Abstract
This study aims to evaluate how fiber orientation results are dependent on fluctuations in input parameters, such as the average fiber length, fiber volume content, and initial alignment of fibers. The range of parameters is restricted to deviations within one specific short fiber reinforced thermoplastic and is not set up to investigate the differences between materials. The evaluation was conducted by a virtual shear cell based on a mechanistic modeling approach. The fiber orientation prediction model discussed is the pARD-RSC (principal anisotropic rotary diffusion-reduced strain closure) model implemented as a user routine in AUTODESK MOLDFLOW INSIGHT® (AMI®). The material investigated was discontinuous short glass fiber reinforced PBT (polybutylene-terephthalate), which is often used for housings in various industries. It is shown that variation in the input parameters, although having an influence on the fiber orientation model parameters, only affects the final orientation moderately.
1. Introduction
The demand for lightweight structures to reduce the amount of energy required to transport a vehicle from A to B is increasing. This leads to the need for advanced models and methods to predict the performance of such components. Discontinuous short glass fiber reinforced thermoplastic components are, thus, very interesting, as their material properties combine lightweight performance with thermo–mechanical strength, such as temperature dependent ultimate tensile or flexural strength. For example, 90% of all technical thermoplastic materials purchased each year at Robert Bosch GmbH are of a short glass fiber reinforced grade.
A simulative prediction of failure and the lifetime of the glass fiber reinforced product can decrease the development time and, therefore, reduce costs significantly. To do so, an integrative simulation chain is necessary. The integrative simulation chain combines the results from process simulation, e.g., the fiber orientation distribution, with structural mechanics models. It is important in the integrative simulation chain that the fiber orientation is accurately predicted. The stiffness and strength of polymers depend on the fiber orientation significantly. Fiber orientation differs in its position based on thickness, with fibers aligned in the flow direction in the shell region and perpendicular to the flow in the core region. Models are required that are capable of predicting this orientation correctly, especially for mechanical strength and thermo–mechanical deformation. The models presently used to predict fiber orientation are derived from Jeffery [1], and the parameters introduced are purely empirical. A review of current fiber orientation models can be found in [2]. The company ALTAIR [3] recently proposed a different approach. ALTAIR is using a discrete element method approach by placing some discrete fibers in the flow field, which will be used for the orientation evolution of discontinuous short fiber reinforced thermoplastics.
This work focuses on the simulative prediction of empirical fiber orientation parameters in a shear flow. With the help of a mechanistic model, the influence of various input parameters is studied. First, we study the statistical variance caused by different cells with identical inputs. Since these cells are determined based on the second order fiber orientation, they are under constraints. Consequently, statistical variance is expected. Second, we investigate the influence of various material parameters within one short fiber reinforced material. We vary the fiber length, fiber volume content, and initial orientation. The gained parameters are then used for an injection molding simulation in Autodesk Moldflow®, and the influence on the final fiber orientation in the part is assessed.
2. Theory
The orientation of a single fiber can be characterized by a unit vector p (see Figure 1 [4]).
p1 = sinΘ cosϕ
p2 = sinΘ sinϕ
p3 = cosΘ.
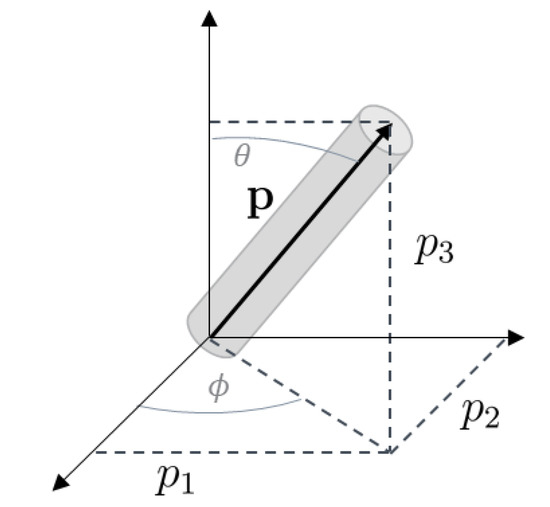
Figure 1.
Definition of a single unit fiber in space.
Various models have been developed to model fiber orientation. Work was performed at Virginia Tech [5] using a sliding plate rheometer to choose a fiber orientation model—the pARD-RSC (principal anisotropic rotary diffusion-reduced strain closure) [6] model. The chosen model was implemented in AMI® using the Solver API solution within AMI® [5]. The model is given by
where A is the second order orientation tensor, and is the fourth order orientation tensor; RA is the Eigen matrix, D is the strain rate, and W is the vorticity tensor. is the interaction coefficient introduced in [7].
The parameters , , and κ were determined from a numerical shear cell experiment developed at the Polymer Engineering Center (PEC) of the University of Wisconsin—Madison [8]. For the generation of unit cells with discrete fibers, sequential addition and the migration method were used [9]. A statistical approach to determine the uncertainties of this procedure was established by varying the initial fiber cell parameters.
3. Generation of the Unit Cells
Two different setups of cells were generated. First, the influence on cell generation was investigated. The generation of the cells containing 30 wt%. in a 512 µm × 512 µm × 512 µm cubic cell resulted in 1118 discrete fibers with a diameter of 10 µm and a fiber length of 275 µm. The algorithm used assures that the fibers do not bend or overlap with each other [9]. The initial orientations, given by the fiber orientation tensor elements , , and , were 0.15, 0.05, and 0.8 and correspond to the initial alignment of pellets in the sliding plate experiments. All the diagonal elements, such as , were set to 0. Under these settings, 10 initial cells were created by the fiber generator. Notably, the second order orientation tensor does not impose a unique orientation state. Consequently, the orientation between the 10 cells was not identical.
Second, the influence of fluctuations in the initial settings for orientation, fiber length, and fiber content were examined. A Design of Experiment (DoE) scheme was used to investigate three parameters (, fiber length, and fiber concentration) in three levels. To minimize the calculation times, a reduced DoE scheme (D-optimal using the software Cornerstone®) was applied, resulting in 15 settings to consider linear and quadratic combinations and interactions. The upper and lower bounds were chosen as the upper and lower bounds of the material properties of PBT GF 30 during injection molding, since this study aims to determine the influence of varying the parameters during the final fiber orientation of the part.
The settings applied for the D-optimal scheme with three parameters and three steps are given in Table 1.

Table 1.
Settings for DoE.
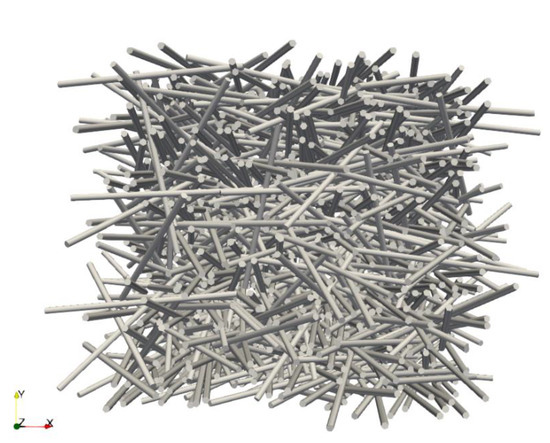
Figure 2.
Initial fiber alignment for V15.
The mechanistic modelling approach of PEC was applied to study the orientation of the fibers in a shear flow field. The numerical shear cell applies shear in the 1, 2 plane. On the top and bottom of the shear cell, walls that prevent fibers from penetrating in two directions are modelled. For the 1 and 3-directions, periodic boundary conditions were applied to the cell. A shear rate of 1 s−1 was applied for 100 s and 200 s. The input parameters for the calculations include a constant viscosity (taken for a fixed temperature with the shear rate from the data sheets for an unreinforced PBT), the fiber geometry, the fiber volume content, and the cell dimensions, as well as the number of elements. The fibers are modelled as stiff rigid bodies with a single element.
In each time step, the velocity, angular velocity, and position of each fiber was calculated with the force and momentum balance. The forces/moments considered in the model are hydrodynamic forces exerted from the polymer on the fibers and interaction forces between fibers. Back coupling between fiber motion and fluid motion was not considered.
Between two approaching fibers, it is assumed that the interaction is divided into three regimes: lubrication forces at large distances, transition forces at the distance of the surface roughness of the fibers, and mechanical forces at contact [10]. The lubrication forces are dependent on the distance and approaching angle. The lubrication force model is based on the work in [10]. Since analytical solutions exist only in the parallel case [11] and in the case of infinitely long fibers [12], optimization of the lubrication force was conducted. As an experimental approach was not available, a numerical one was applied. A fully coupled simulation in COMSOL® was used to calculate the lubrication force between two fibers at varying angles, relative velocities, fiber lengths, and matrix viscosities. Based on these data, an analytic optimization of the lubrication force was performed and implemented in the mechanistic model.
4. Results and Discussion
After applying a constant shear rate of 1 1/s for times of 100 s or 200 s to the initially aligned shear cell, the evolution parameters according to Equation (4) were determined based on a generic fitting algorithm in MATLAB®. Figure 3 shows a graph of the fiber orientation evolution over time for V15. This graph shows the evolution of fiber orientations for , , and over strain under a constant shear rate. The parameters for CI, D2, and κ are derived from the fitted lines according to Equation (4).
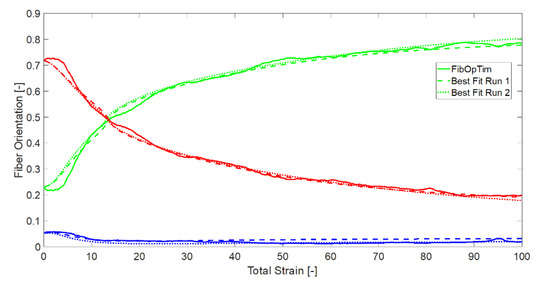
Figure 3.
Fiber orientation evolution for a shear rate of 1 s−1 and parameters set as V15.
From the variation of cell generation with identical input parameters, it can be found that varies significantly with the generation of cells and model parameter fitting. The mean values determined over all ten generations can be found together with the standard deviation in Figure 4.
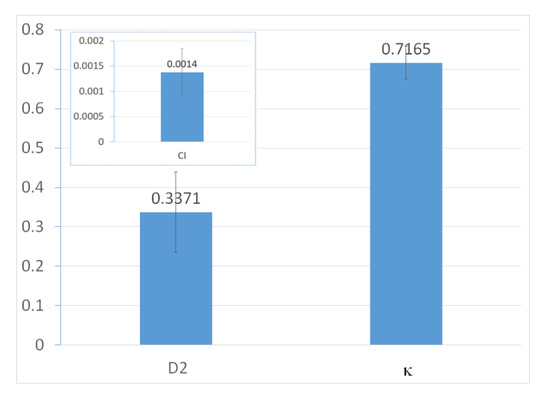
Figure 4.
Average value for ten cells with identical inputs.
To determine whether such deviations play an important role, DoE calculations were performed. Table 2 shows the resulting parameters for each run.
Table 2.
Results for the parameter fitting to the model (4 for DoE settings).
A statistical evaluation of the three factors (F1 = length, F2 = content, F3 = orientation) and the three response data (R1 = , R2 =, R3 = κ) was performed and is plotted in Figure 5a,b. For the chosen parameter range, no clear correlation could be found. The response (R1 to R3) was independent from the input parameters (factors F1 to F3).
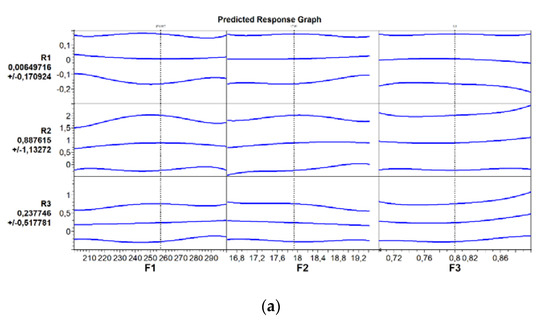
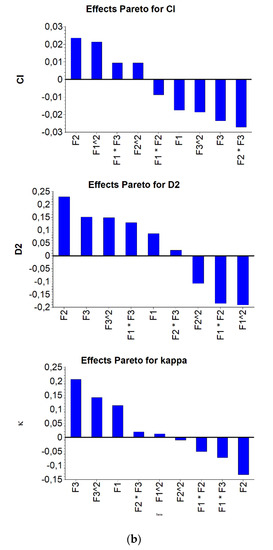
Figure 5.
(a) Predicted Response Graph for R1 to R3 vs. F1 to F3. (b) Influence of factors on the response (top), (middle), and (bottom).
In the Pareto graphs, for and , the fiber content has the largest positive effect, and is the initial orientation. Nevertheless, the effect, in general, is rather small.
5. Numerical Simulation of the Fiber Orientation in Moldflow
The influence of these varying parameters on the calculated fiber orientation in AMI® 2019 was investigated with seven parameter sets from V3, V6, V8, V9, V10, V13, and V14. These seven settings were chosen because they represent the extreme values from all valid parameter sets (min/max).
Simulations were done using the Solver API functionality in AMI® 2019 in a pre-release version. The geometry used for these simulations was a center-gated box with a non-homogeneous wall thickness distribution (see Figure 6).
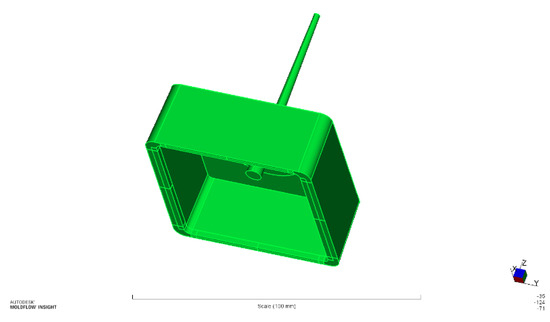
Figure 6.
Geometry of the simulated center gated box.
For the simulation, material data from the AMI® 2019 data base for Ultradur B4300 G6 were chosen. The injection parameters used are given in Table 3.
Table 3.
Settings in AMI® 2019.
The cooling system of the mold was also taken into account (see the blue cylinders in Figure 7).
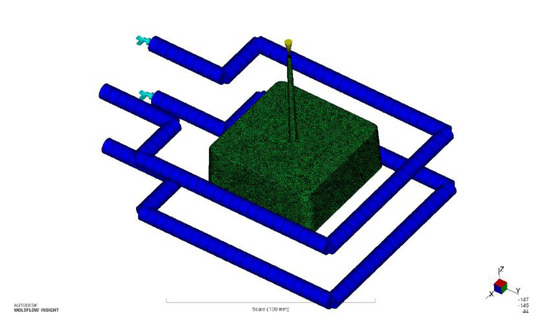
Figure 7.
Model in AMI® 2019 with the cooling system (blue) and melt entrance (yellow cone).
To make a quantitative comparison between the seven chosen model parameter sets, each was simulated with identical processing parameters given in Table 3. Two element stacks of hexaeder elements over thickness were generated. The calculated fiber orientations were then mapped on these stacks. The positions of each stack are given in Figure 8 (identified by red circles).
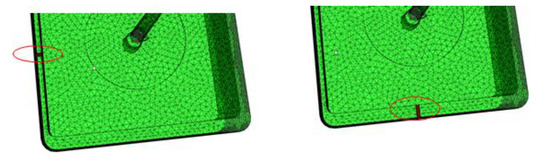
Figure 8.
Positions of the element stacks to evaluate fiber orientation.
For each calculation, the deviation to the first (V3) model parameter set was determined according to the root mean square deviation (RMSD) method.
Table 4 gives a summary of the RMSD determined for each position.
Table 4.
RMSD (root mean square deviation) values with reference to V3 for , , and .
With a maximum orientation of 0.8 in the flow direction, for the chosen input parameters and the determined model parameters of the DoE, the change in fiber orientation is 10–20%.
6. Conclusions
This study showed that varying the input parameters (average fiber length, fiber volume content, and initial alignment) within one material range for fiber orientation modeling does not have a large influence on the final orientation. Although the fiber volume content and the average fiber length varied over the flow, these changes did not affect the fiber orientation model parameters. Thus, it can be concluded that one constant set of parameters is sufficient for one material. This reduces the needed time for parameter identification significantly.
For materials with different viscosities, the average fiber length and fiber content parameters need to be determined again. To evaluate the dependence of the input on the model parameters and, thus, the fiber orientation results, the variations in the parameters must be wider.
Author Contributions
Conceptualization, S.K., A.K., and T.O.; methodology, A.K. and S.K.; software: S.K.; validation, A.K.; writing—original draft preparation, A.K.; writing—review, S.K.; visualization, A.K. All authors have read and agreed to the published version of the manuscript.
Funding
This research received no external funding.
Acknowledgments
The authors would like to express their thanks to Mohamed Besher Baradi (Robert Bosch GmbH) for providing the code for the RMSD evaluation.
Conflicts of Interest
The authors declare no conflict of interest.
Abbreviations
The following abbreviations are used in this manuscript:
| AMI® | AUTODESK MOLDFLOW INSIGHT® |
| API | Application Programming Interface |
| PEC | Polymer Engineering Center |
| DoE | Design of Experiments |
| PBT | Polybutylene terephthalate |
| µCT | micro Computer Tomography |
| RSC | Reduced strain closure |
| ARD | Anisotropic rotary diffusion |
| pARD | Principal anisotropic rotary diffusion |
| RMSD | Root mean square deviation |
References
- Jeffery, G.B. The motion of ellipsoidal particles immersed in a viscous fluid. Proc. R. Soc. Lond. Ser. A Math. Phys. Eng. Sci. 1922, 102, 161–179. [Google Scholar]
- Kugler, S.K.; Kech, A.; Cruz, C.; Osswald, T.A. Fiber Orientation Predictions—“A Review of Existing Models”. J. Compos. Sci. 2020, 4, 69. [Google Scholar] [CrossRef]
- Mayavaram, R.; Celigueta, M.A.; Becker, P.A.; Venkatesan, G.; Singh, N. Predicting Fiber Orientation in Short Fiber Reinforced Injection Molding Process Using Discrete Element Method. ANTEC® 2020 Papers: The Virtual Edition; ANTEC®: Danbury, CT, USA, 2020. [Google Scholar]
- Advani, S.G.; Tucker, C.L. The use of tensors to describe and predict fiber orientation in short fiber composites. J. Rheol. 1987, 31, 751–784. [Google Scholar] [CrossRef]
- Kugler, S.K.; Lambert, G.M.; Cruz, C.; Kech, A.; Osswald, T.A.; Baird, D.G. Macroscopic fiber orientation model evaluation for concentrated short fiber reinforced polymers in comparison to experimental data. Polym. Compos. 2020, 41, 2542–2556. [Google Scholar] [CrossRef]
- Tseng, H.C.; Chang, R.Y.; Hsu, C.H. The use of principal spatial tensor to predict anisotropic fiber orientation in concentrated fiber suspensions. J. Rheol. 2017, 62, 313–320. [Google Scholar] [CrossRef]
- Folgar, F.; Tucker, C.L. Orientation behavior of dibers in concentrated suspensions. J. Reinf. Plast. Compos. 1984, 3, 98–119. [Google Scholar] [CrossRef]
- Pérez, C. The Use of a Direct Particle Simulation to Predict Fiber Motion in Polymer Processing. Ph.D. Thesis, University of Wisconsin-Madison, Madison, WI, USA, 2017. [Google Scholar]
- Schneider, M. The sequential addition and migration method to generate representative volume elements for the homogenization of short fiber reinforced plastics. Comput. Mech. 2017, 59, 247–263. [Google Scholar] [CrossRef]
- Lindström, S.; Uesaka, T. Simulation of the motion of flexible fibers in viscous fluid flow. Phys. Fluids 2007, 19, 113–307. [Google Scholar] [CrossRef]
- Yamane, Y.; Kaneda, Y.; Dio, M. Numerical simulation of semi-dilute suspensions of rodlike particles in shear flow. J. Non-Newton. Fluid Mech. 1994, 54, 405–421. [Google Scholar] [CrossRef]
- Kromkamp, J.; Van der Ende, D.T.; Kandhai, D.; Van der Sman, R.G.; Boom, R.M. Shear-induced self-diffusion and microstructure in non-Brownian suspensions at non-zero Reynolds numbers. J. Fluid Mech. 2005, 529, 253–278. [Google Scholar] [CrossRef]
© 2020 by the authors. Licensee MDPI, Basel, Switzerland. This article is an open access article distributed under the terms and conditions of the Creative Commons Attribution (CC BY) license (http://creativecommons.org/licenses/by/4.0/).