1. Introduction
High damage tolerance, good fatigue behavior, the possibility of functionalization, weldability and the recyclability of the components are the particular advantages of thermoplastic fiber composites (TPCs) compared to their thermoset counterparts [
1,
2]. Even though thermoset matrices currently represent the majority of the FRPs market [
3,
4], these composites cannot be melted or formed after manufacture due to the cross-linkage. The possibilities for recycling are therefore very limited. The production of thermoplastic composite materials in, for example, the thermoplastic RTM process, enables the possibility for recycling, which is a great advantage with regard to environmental issues [
5,
6].
TPCs can be processed either using reactive processing of monomer melts or using melt impregnation with polymer melts (organosheets). The latter has already been used successfully for 40 years in the automotive industry. The reactive processing of ɛ-caprolactam (CL) into anionically polymerized PA6 (aPA6) is only established in casting processes of neat material. For this reason, several institutes and companies worldwide are involved in process development and processing of composites out of this resin combined with fibers [
7,
8,
9,
10].
The main issue of this process is that the chemical reaction of the monomer, activator and catalyst is very sensitive to moisture [
11,
12,
13]. If the reactive monomer melt adsorbs a critical amount of moisture, the polymerization reaction slows down or even stops completely [
12]. The moisture present in the raw materials (fibers, binders, core materials) thereby can inhibit the polymerization reaction. The moisture content thus has a significant influence on the resulting polymer properties and processing speed [
13,
14,
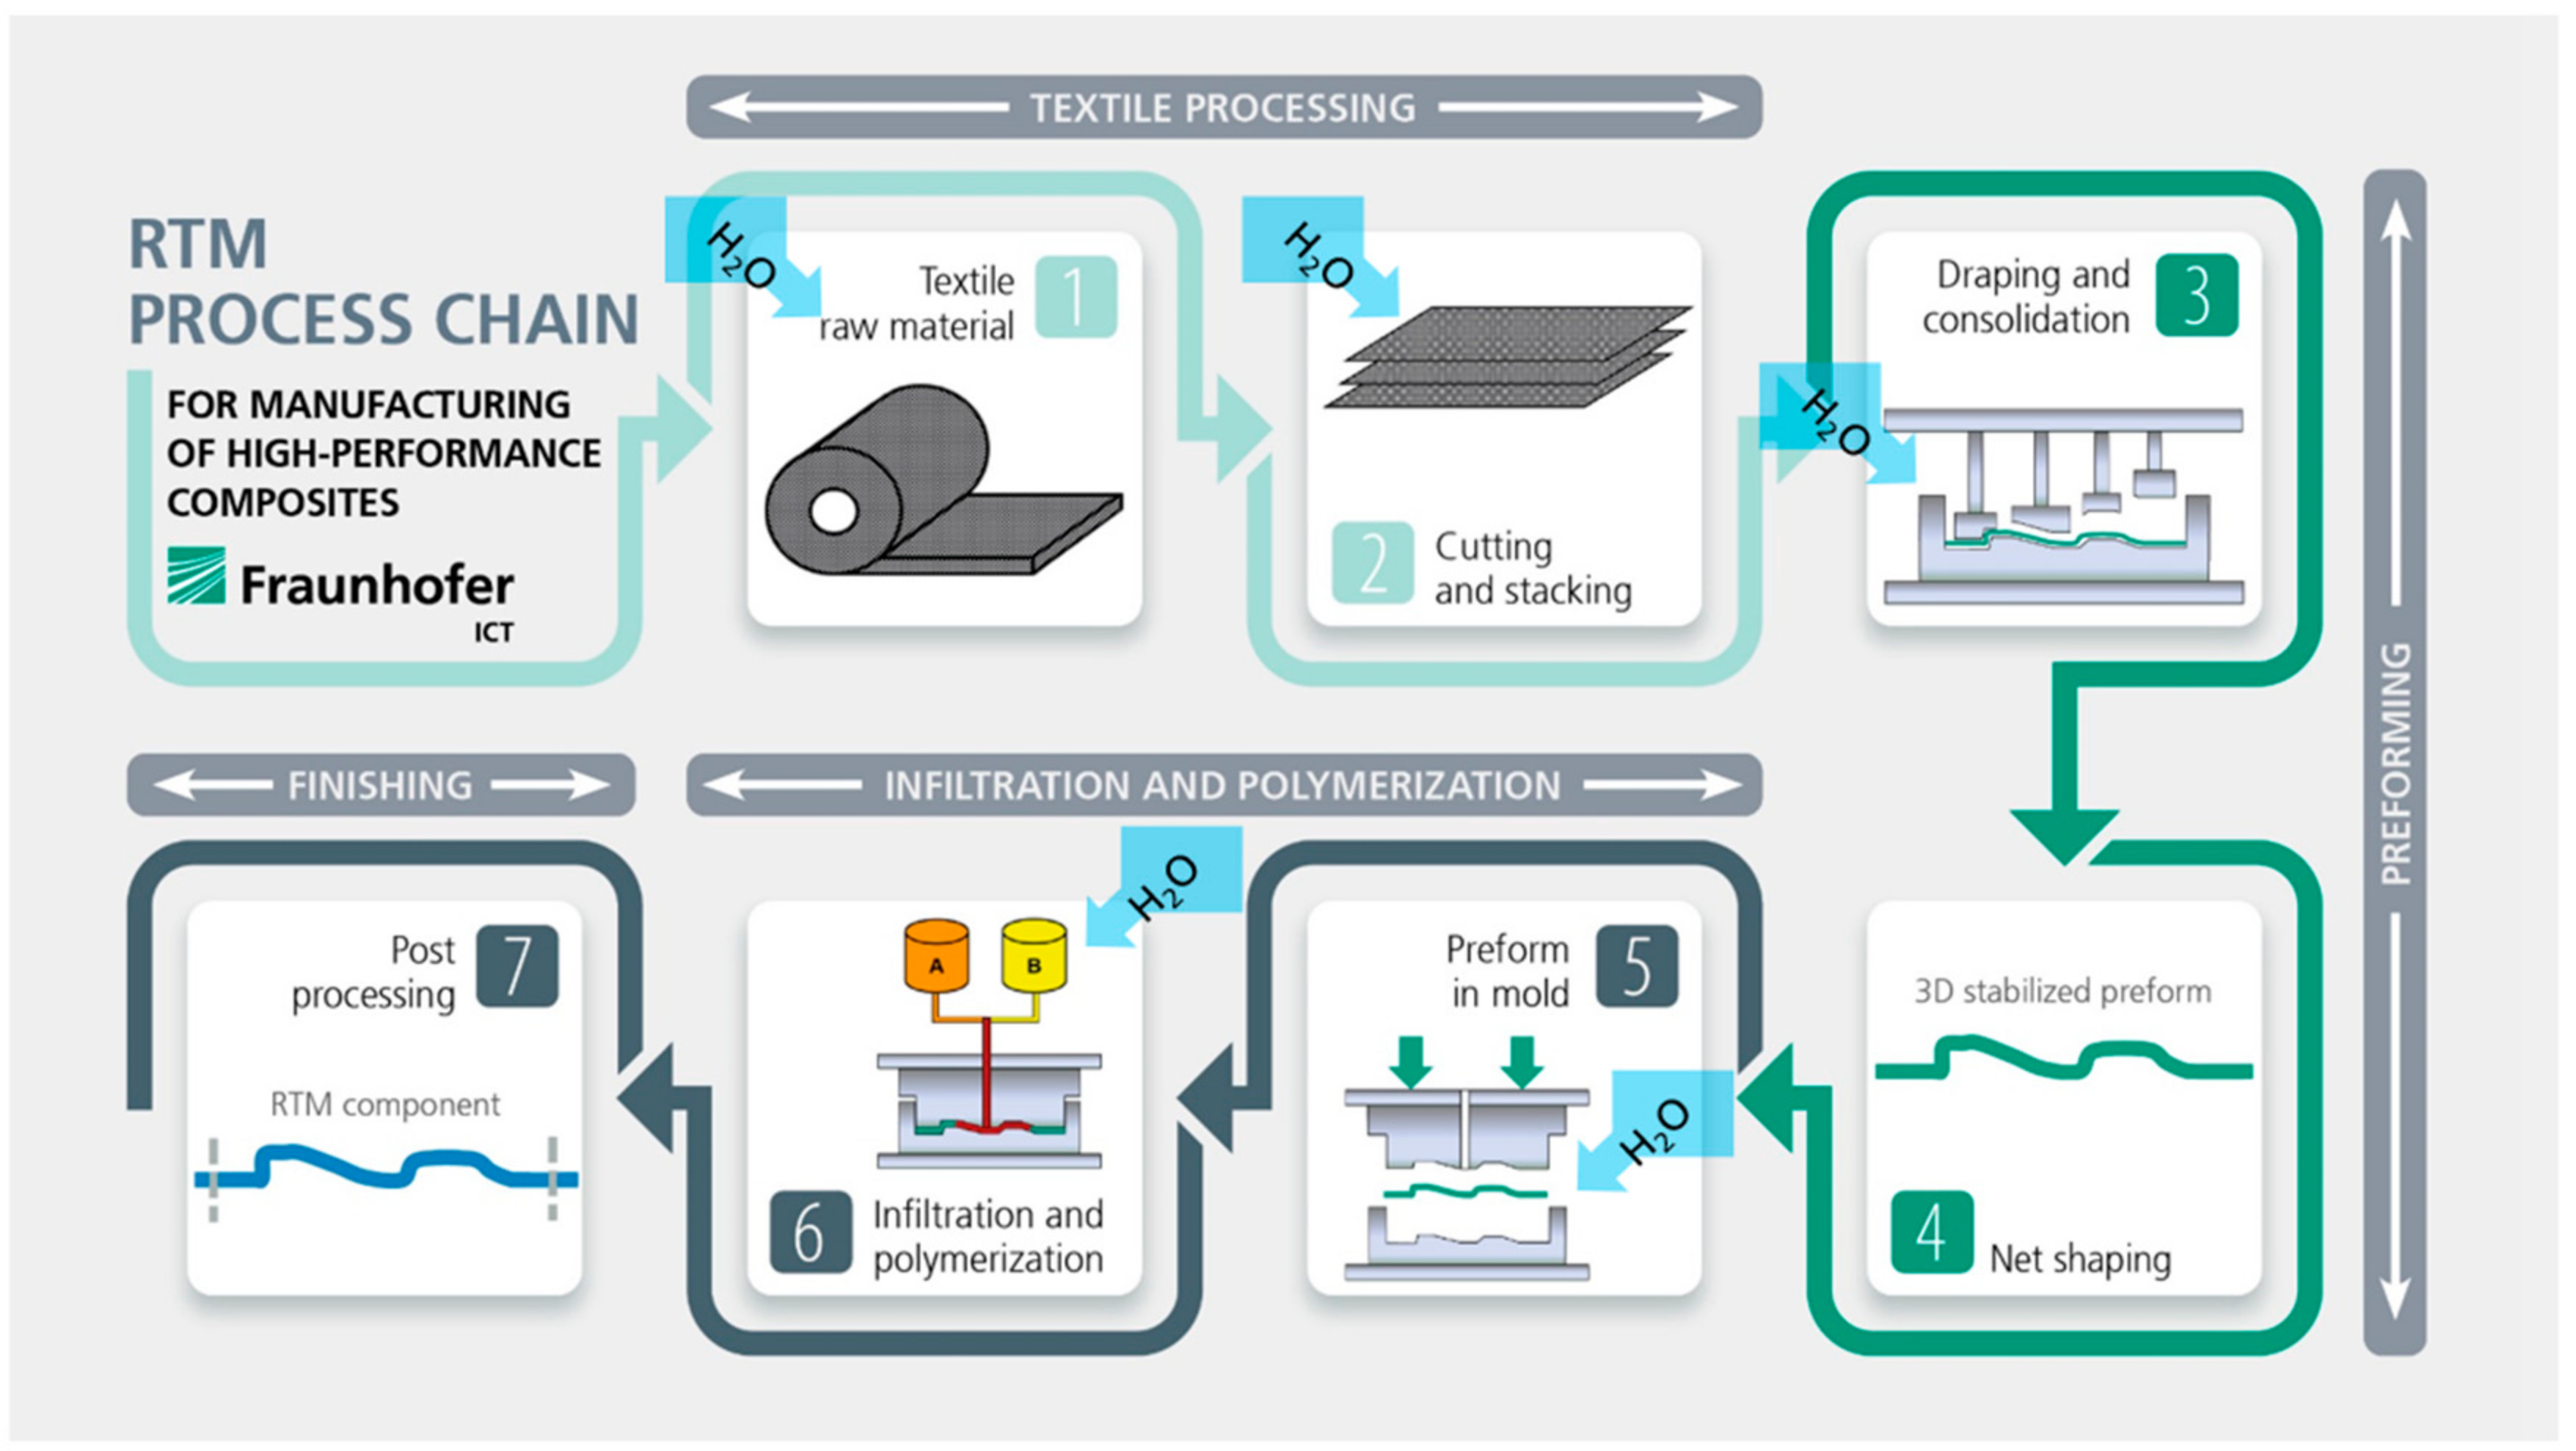
15]. The lack of knowledge about the moisture sorption behavior of the raw materials leads to an unstable and poorly reproducible manufacturing process. The process steps, where moisture can enter the T-RTM process, are shown in
Figure 1.
On the one hand, moisture can be introduced already through the semi-finished fiber product. The fibers are cut, stacked and preformed. In each step and the corresponding handling, the fibers may take up moisture from the ambient air with a certain relative humidity (RH). Therefore, the semi-finished fiber products or preforms are normally dried in a convection oven at 80 °C–100 °C. After drying, the preform is then placed in the heated mold. During this handling from the drying oven into the mold, contact with moisture is nearly unavoidable. Secondly, moisture can also enter through the matrix components. When filling the melt vessels of the metering machine, the raw materials come into contact with air that has a specific humidity.
Usually, these thermoplastic composites are manufactured with approx. 50–65 vol.% fibers. The previously stacked and dried fiber preforms are placed in the mold, evacuated and impregnated. Due to the extremely low matrix viscosity of around 5–10 mPa·s, the impregnation can be finished very fast, depending on the part geometry and size. For the polymerization reaction, the mold temperature is set to 150 °C. The exothermic temperature rise increases the temperature to around 200 °C in the mold. Typical reactive mixtures contain around 1.0–2.5 wt.% of activator (when using BRUGGOLEN® C20P) and around 2.0–5.0 wt.% catalyst (when using BRUGGOLEN® C10). The rest (92.5–97.0 wt.%) of the mixture is neat ε-caprolactam.
2. Materials and Methods
2.1. Materials
The materials commonly used in the T-RTM process are the matrix components ε-caprolactam, activator and catalyst, binder materials and reinforcing fibers such as glass or carbon fibers. In addition, foam cores can be used to produce thermoplastic sandwich structures.
In the case of aPA6, the monomer is ε-caprolactam, supplied by the company L. Brüggemann GmbH & Co. KG. (Heilbronn, Germany) under the trade name AP-NYLON® Caprolactam Flakes with a maximum water content of 100 ppm was used. As activator a hexamethylene-1,6-diisocyanate (BRUGGOLEN® C20P) and as catalyst a sodium-caprolactamate (BRUGGOLEN® C10) also from L. Brüggemann GmbH & Co. KG (Heilbronn, Germany) were investigated. The examined glass fibers are type 92125 with sizing FK-800, suitable for reactive thermoplastic processing, from P-D INTERGLAS TECHNOLOGIES GmbH (Erbach, Germany). The carbon fibers that were studied are Zoltek Panex PX 35 with sizing T61, also suitable for reactive thermoplastic processing. The binder powder used, Griltex CT 101, is based on polyamide 12 and supplied by EMS-Griltech (Herrliberg, Switzerland). The foam core used is made out of polyamide 6 and has a closed cell structure. The foam is available under the trade name Zotek NB70 from Zotefoams (Croydon, UK).
2.2. Methods
The process-independent moisture sorption behavior (adsorption/desorption) of the materials was examined. For this purpose, sorption isotherms of the materials were measured using the gas sorption method. Due to their physical and chemical behavior, materials can exhibit different moisture bonds, which are difficult to distinguish from one another. For this reason, the corresponding sorption isotherms must be determined experimentally.
Prior to the measurement the samples were heated between 40 and 90 °C, depending on the material properties, for at least 12 h in a vacuum (≈17 Pa), to have a defined and dry initial condition. The measurements of the sorption isotherms were done on a Quantachrome Hydrosorb 1000 with an accuracy of 0.1% full scale. The temperature was set to 23 °C in order to get comparable and reproducible results under standard conditions for all investigated materials. During the measurements, the relative humidity was increased in defined steps between 5 and 95% RH to observe the moisture sorption under these conditions. The measurement of each specific value is finished after a state of equilibrium with the atmospheric conditions has been established. Each measurement was carried out once, as it is standard in water vapor sorption measuring. For some of the investigated materials, a second measurement was carried out, which showed reproducible results in good agreement. These are not shown in the following.
First, the adsorption properties of the materials were determined to investigate the potential amount of moisture entering the T-RTM process and thus inhibiting the polymerization reaction. For definition of the needed conditioning parameters, the moisture desorption properties were determined by measuring the desorption behavior.
The measured sorption isotherms show the moisture load of the material in a state of equilibrium under constant temperature at different levels of relative humidity. Various forms of sorption isotherms provide information about the surface pores of the sample and the associated adsorption and desorption behavior. For the classification of sorption isotherms, IUPAC divides them into six different types, which are determined by the structure and chemical nature of the sorbent [
16].
3. Results
Figure 2a shows the sorption isotherm of ε-caprolactam at 23 °C. The adsorption and desorption behavior of ε-caprolactam shows a classical hysteresis loop. The moisture load of ε-caprolactam is very low up to a relative humidity of 62%. With increasing the RH further, ε-caprolactam starts steeply adsorbing a lot of moisture. The maximum moisture load in the range of the saturation vapor pressure is 500 mg/g. The moisture release starts from a relative humidity of less than 80%. The moisture load decreases to 140 mg/g and keeps constant. A complete release of the moisture present in the material is not possible.
Figure 2b shows the sorption isotherm of the activator C20P. The adsorption and desorption behavior of activator C20P passes again a hysteresis loop, very similar to the ε-caprolactam, but at a much lower level of absolute moisture uptake. The activator starts adsorbing moisture from a RH of 60%, which is indicative for hydrophobic behavior. The moisture load increases strongly as the relative moisture increases until the saturation vapor pressure is reached (= equilibrium). The absolute moisture load at saturation vapor pressure is 110 mg/g. The moisture desorption of activator C20P starts when the relative humidity drops below 80%. The desorption is nearly linear until a RH of 55% is reached. Below 55% RH, the desorption nearly stops and the moisture remains in the activator, again very similar to the behavior of ε-caprolactam, with a minimum moisture load of 20 mg/g. Since the decrease of the moisture load does not go back to the initial state, some moisture remains in the material.
Figure 2c shows the adsorption curve of the catalyst C10. The catalyst shows a linear increase in the moisture load, beginning at a relative humidity of 10% and a strong increase exceeding 75% RH until saturation. The maximum moisture load is 450 mg/g. Measuring the desorption curve was not possible due to fluidization of the catalyst by moisture absorption.
The sorption isotherms of glass fibers type 92125 FK800 at 23 °C are shown in
Figure 3a. The moisture load in the glass fibers starts at a RH of 10% and increases exponentially with increasing RH. The fibers have a significantly lower total moisture load compared to the matrix components. The maximum moisture load near the saturation vapor pressure is 0.62 mg/g. The moisture release of the glass fibers takes place directly when the saturation vapor pressure is undershot, i.e., no plateau is formed between adsorption and desorption. The desorption behaves similar to the adsorption. An almost complete release of the moisture load can be seen.
Figure 3b shows the moisture content of carbon fibers in relation with RH. The carbon fibers also have a comparatively low moisture load. The moisture uptake starts at a relative humidity of 10% and behaves almost linearly up to 70%. The maximum value of moisture loading near the saturation vapor pressure is 0.48 mg/g. The desorption curve of the carbon fiber is nearly similar to the adsorption curve. The moisture load decreases to almost 0%.
In
Figure 4a the sorption isotherm of the binder powder is shown. The moisture load of the binder powder increases almost linearly with the relative humidity. The maximum load is 14 mg/g. The binder powder exhibits a clearly visible hysteresis loop in the desorption behavior. The upper part of the loop has only a minimal horizontal area, which indicates pores without a narrow opening and therefore only a slight drop in vapor pressure. Furthermore, the hysteresis loop is not closed at the lower end, which indicates that some of the moisture is not completely desorbed or is bound to the material in a different way than adsorption.
Figure 4b shows the sorption isotherms of the foam samples. The foam absorbs a total of 70 mg/g moisture at the saturation vapor pressure. It shows a significantly visible hysteresis loop in the behavior of the desorption. The upper part of the loop has an almost horizontal section, which indicates a large occurrence of surface pores with narrow openings and thus a high vapor pressure drop. Furthermore, the hysteresis loop is not closed at the lower end, which indicates that some of the moisture is not completely desorbed like in the binder material Griltex CT 101.
4. Discussion
4.1. Matrix Materials
The monomer activator and catalyst show clearly irreversible hysteresis loops. In the catalyst sample, it is not even possible to measure the desorption isotherm due to the complete liquefaction of the material. Since the matrix materials are reactive chemicals, it is difficult to conclude from the presence of an irreversibility hysteresis loop that the surface is porous. The reason might be that the moisture is bound to the material not only by physisorption but also by chemisorption since the loop does not close at the end of the desorption. Another phenomenon that leads to this form of an open hysteresis loop is that moisture is blocked in pores with narrow openings. This slows down the sorption kinetics to a minimum, up to the moisture equilibrium. Since the apparatus for sorption measurement spends a reasonable metrological maximum of time to measure a climatic condition, it may happen that the equilibrium is not reached during this time due to the low sorption kinetics. Monomer ε-caprolactam and catalyst C10 absorb the most moisture. This similar material behavior can be explained by the high content of caprolactam (approx. 82%) in the catalyst (approx. 18% sodium-caprolactamate). Compared to ε-caprolactam and catalyst C10, activator C20P absorbs about 75% less moisture. The hysteresis effect is caused by capillary forces, which must be overcome during desorption. The decrease in the moisture load can be explained by capillary condensation. This means that the pores only empty when a certain low ambient pressure is reached. In the case of caprolactam and the activator, this can be seen at the first three desorption points between 95% RH and 80% RH. Small pores that are filled only empty suddenly when the pressure difference exceeds the capillary forces. This is followed by a constant decrease to the plateau at about 50% RH.
The plateau suggests a continuous distribution of the pore radii in this area. The assumption that there is a large gap in the pore size distribution is very unlikely. This would mean that there are very small pores that would empty when the pressure / RH has dropped below 5%. According to the Kelvin–Laplace equation (Equation (1)), the pore diameter would have to be smaller than 49 Å for water and a temperature of 23 °C [
17,
18].
where
r is the radius of the pores, γ the surface tension (0.055 N/m, accounting for the presence of solutes), M the molar mass of water (0.018 kg/mol), RH the relative humidity, ρ the density of water (~1000 kg/m
3), R the ideal gas constant (8.314 J/mol·K) and
T the temperature (296.15 K).
In the case of ε-caprolactam, hydrolytic polymerization with water at room temperature is very unlikely. However, adjacent amide groups can form sorption centers [
19]. There are three ways, water molecules may interact with the sorption centers, see
Figure 5. A water molecule can form hydrogen bonds with two carbonyl groups of the caprolactam molecules. This water is difficult to dissolve from this bond because of these two hydrogen bonds. A water molecule can also form a hydrogen bond to a carbonyl and an amide group. The third possibility is that the water molecule is bound by capillary condensation [
20].
The activator has two ends with isocyanate groups that are blocked with caprolactam rings. A chemical reaction of the activator’s highly reactive isocyanate ends with water is not expected below the deblocking temperature of around 160 °C [
21]. Though, the activator molecules can also form hydrogen bonds with water molecules at the carbonyl and amide group. Chemical reactions with water are possible in the catalyst [
13], which could be the reason for the missing desorption curve after complete liquefaction.
4.2. Fibers, Binder and Core Material
The course of the adsorption and desorption isotherms of the fibers shows a hysteresis loop, whereby the upper part of the loop does not show a horizontal range of the desorption isotherm. This course indicates pores with a large diameter, resulting in a slight reduction in vapor pressure [
16,
22]. The hysteresis loops are closed in a dry state, which shows that the entire moisture load can be desorbed again by lowering the relative humidity. The carbon fibers adsorb a maximum of 0.49 mg/g moisture whereas the glass fibers reach a maximum at 0.61 mg/g.
Foam core and binder powder show a slight drop in vapor pressure at the beginning of the desorption phase. The hysteresis loops are not closed at the lower end, which suggests that some of the moisture is bound to the material in some other way than adsorption or that the measurement could not reach an absolute equilibrium point.
5. Conclusions
In summary, the sorption behavior of the individual materials could be characterized, providing an overview of the matrix components (ε-caprolactam, activator, catalyst), selected glass and carbon fibers as well as the binder and foam core. Furthermore, the maximum amount of moisture adsorption was determined. It was found that the fiber materials absorb only a small amount of moisture with less than 1 mg/g. The binder and foam core adsorb between 14–70 mg/g. This amount of moisture is also significantly lower than that absorbed by the matrix materials (110–500 mg/g). The highest moisture adsorption could be observed in ε-caprolactam and the catalyst C10. The irreversible curve shows that once the matrix material takes up moisture an efficient drying is not possible, leading to an unavoidable high moisture content in the reactive mixture. It is therefore necessary to avoid any contact with humidity if possible.
However, for the practical application of these measured values in the T-RTM process, another aspect has to be considered. The sorption isotherms determine the percentage moisture absorption in milligrams of water per gram of material. The amount of water introduced into the process therefore also depends on the percentage of the respective material. The high percentage moisture absorption of the catalyst can therefore be regarded as uncritical, since the catalyst makes up a maximum of five weight percent of the composite produced, similar to the binder.
The reinforcing fibers show a good drying behavior, and due to their percentage of 40–60 by volume in the final composite part they need to be dried before the impregnation and polymerization step in the process. Handling times should be kept at a minimum. When producing a sandwich composite, the foam core also has to be dried in advance to keep the negative moisture influence low.
Another important aspect is the sorption kinetic of the materials, which will be investigated in further research. The kinetics might give recommendations for the maximum handling time of the materials in each process step.
Author Contributions
Conceptualization, J.H. and R.W. and M.W.; methodology, P.G.W. and J.H.; validation, P.G.W. and J.H.; formal analysis, J.H. and M.W.; investigation, J.H. and P.G.W.; resources, R.W.; data curation, M.W. and P.G.W.; writing—Original draft preparation, J.H. and R.W. and M.W.; writing—Review and editing, P.G.W. and P.R. and F.H.; visualization, M.W.; supervision, F.H.; project administration, R.W.; funding acquisition, R.W. All authors have read and agreed to the published version of the manuscript.
Funding
This research received no external funding.
Conflicts of Interest
The authors declare no conflict of interest.
References
- van Rijswijk, K.; Bersee, H. Reactive processing of textile fiber-reinforced thermoplastic composites—An overview. Compos. Part A Appl. Sci. Manuf. 2007, 38, 666–681. [Google Scholar] [CrossRef]
- Cho, B.-G.; McCarthy, S.P.; Fanucci, J.P.; Nolet, S.C. Fiber reinforced nylon-6 composites produced by the reaction injection pultrusion process. Polym. Compos. 1996, 17, 673–681. [Google Scholar] [CrossRef]
- Sauer, M. Composites-Marktbericht 2019—Der globale CF-und CC-Markt 2019—Marktentwicklungen, Trends, Ausblicke und Herausforderungen. 2019. Available online: http://cc.allermun.de/media/3989/ger_ccev_marktbericht_2019_kurzversion.pdf (accessed on 4 January 2021).
- Niemeyer, S.; Ziegmann, G. Recycling kohlenstofffaserverstärkter Kunststoffe (CFK); Recycling und Rohstoffe 978-3-935317-81-8. 2012. Available online: https://issuu.com/tkverlag/docs/recycling_und_rohstoffe_5/20?ff&backgroundColorFullscreen=%238c943c (accessed on 4 January 2021).
- D’Hooghe, E.L.; Edwards, C.M. Thermoplastic Composite Technology; Tougher than You Think. Adv. Mater. 2000, 12, 1865–1868. [Google Scholar] [CrossRef]
- van Rijswijk, K.; Bersee, H.; Jager, W.F.; Picken, S.J. Optimisation of anionic polyamide-6 for vacuum infusion of thermoplastic composites: Choice of activator and initiator. Compos. Part A Appl. Sci. Manuf. 2006, 37, 949–956. [Google Scholar] [CrossRef]
- Gittel, D. Gesamtabschlussbericht Verbundprojekt “CastComp”—Neues T-RTM-Verfahren für Hochleistungsverbundstrukturen; Fraunhofer ICT: Pfinztal, Germany, 2010. [Google Scholar]
- Maazouz, A.; Lamnawar, K.; Dkier, M. Chemorheological study and in-situ monitoring of PA6 anionic-ring polymerization for RTM processing control. Compos. Part A Appl. Sci. Manuf. 2018, 107, 235–247. [Google Scholar] [CrossRef]
- Ageyeva, T.; Sibikin, I.; Karger-Kocsis, J. Polymers and Related Composites via Anionic Ring-Opening Polymerization of Lactams: Recent Developments and Future Trends. Polymers 2018, 10, 357. [Google Scholar] [CrossRef] [PubMed] [Green Version]
- Ageyeva, T.; Sibikin, I.; Kovács, J.G. A Review of Thermoplastic Resin Transfer Molding: Process Modeling and Simulation. Polymers 2019, 11, 1555. [Google Scholar] [CrossRef] [PubMed] [Green Version]
- Arnoldová, P.; Prokopová, I.; Bernat, P.; Roda, J. Polymerization of lactams, 94. Formation of cyclic oligomers in anionic polymerization of 6-hexanelactam. Angew. Makromol. Chem. 1999, 269, 25–29. [Google Scholar] [CrossRef]
- Wendel, R.; Thoma, B.; Henning, F. Influence of water during manufacturing of aPA6 in the thermoplastic RTM process. In Proceedings of the Conference 2017 of the Polymer Processing Society, Cancun, Mexico, 10–14 December 2017; p. 33. [Google Scholar]
- Wilhelm, M.; Wendel, R.; Aust, M.; Rosenberg, P.; Henning, F. Compensation of Water Influence on Anionic Polymerization of ε-Caprolactam: 1. Chemistry and Experiments. J. Compos. Sci. 2020, 4, 7. [Google Scholar] [CrossRef] [Green Version]
- Wendel, R.; Rosenberg, P.; Wilhelm, M.; Henning, F. Anionic Polymerization of ε-Caprolactam under the Influence of Water: 2. Kinetic Model. J. Compos. Sci. 2020, 4, 8. [Google Scholar] [CrossRef] [Green Version]
- Alfonso, A.; Hoto, R.; Andrés, J.; García, J.A. Industrial viability of aPA-6 matrix-based basalt fiber reinforced composites. In Proceedings of the 18th International Conference on Composite Materials, Jeju Island, Korea, 21–26 August 2011. [Google Scholar]
- Thommes, M.; Kaneko, K.; Neimark, A.V.; Olivier, J.P.; Rodriguez-Reinoso, F.; Rouquerol, J.; Sing, K.S. Physisorption of gases, with special reference to the evaluation of surface area and pore size distribution (IUPAC Technical Report). Pure Appl. Chem. 2015, 87, 160. [Google Scholar] [CrossRef] [Green Version]
- Defay, R.; Prigogine, I.; Bellemans, A. Surface Tension and Adsorption; Longmans: London, UK, 1966; ISBN 0317089471. [Google Scholar]
- Haul, R.S.J.; Gregg, K.S.W. Sing: Adsorption, Surface Area and Porosity. 2. Auflage, Academic Press, London 1982. 303 Seiten, Preis: $ 49.50. Ber. Bunsenges. Phys. Chem. 1982, 86, 957. [Google Scholar] [CrossRef]
- Sfirakis, A.; Rogers, C.E. Effects of sorption modes on the transport and physical properties of nylon 6. Polym. Eng. Sci. 1980, 20, 294–299. [Google Scholar] [CrossRef]
- Puffr, R.; Šebenda, J. On the Structure and Properties of Polyamides. XXVII. The Mechanism of Water Sorption in Polyamides. J. Polym. Sci. C Polym. Symp. 1967, 16, 79–93. [Google Scholar] [CrossRef]
- van Rijswijk, K.; Bersee, H.; Beukers, A.; Picken, S.J.; van Geenen, A.A. Optimisation of anionic polyamide-6 for vacuum infusion of thermoplastic composites: Influence of polymerisation temperature on matrix properties. Polym. Test. 2006, 25, 392–404. [Google Scholar] [CrossRef]
- Sing, K.S.W. Reporting physisorption data for gas/solid systems with special reference to the determination of surface area and porosity (Provisional). Pure Appl. Chem. 1982, 54, 2201–2218. [Google Scholar] [CrossRef]
| Publisher’s Note: MDPI stays neutral with regard to jurisdictional claims in published maps and institutional affiliations. |
© 2021 by the authors. Licensee MDPI, Basel, Switzerland. This article is an open access article distributed under the terms and conditions of the Creative Commons Attribution (CC BY) license (http://creativecommons.org/licenses/by/4.0/).

 ,
, 