3.2. Tensile and Flexural Properties of CaCO3 Particles Filled HPP
The tensile properties of mixed HPP and CaCO
3 particles filled HPP were summarized, and the results are shown in
Figure 2. The detailed numbers and statistical analysis results are shown in
Table 1. Different letters of A, B, C, D, E, and F in
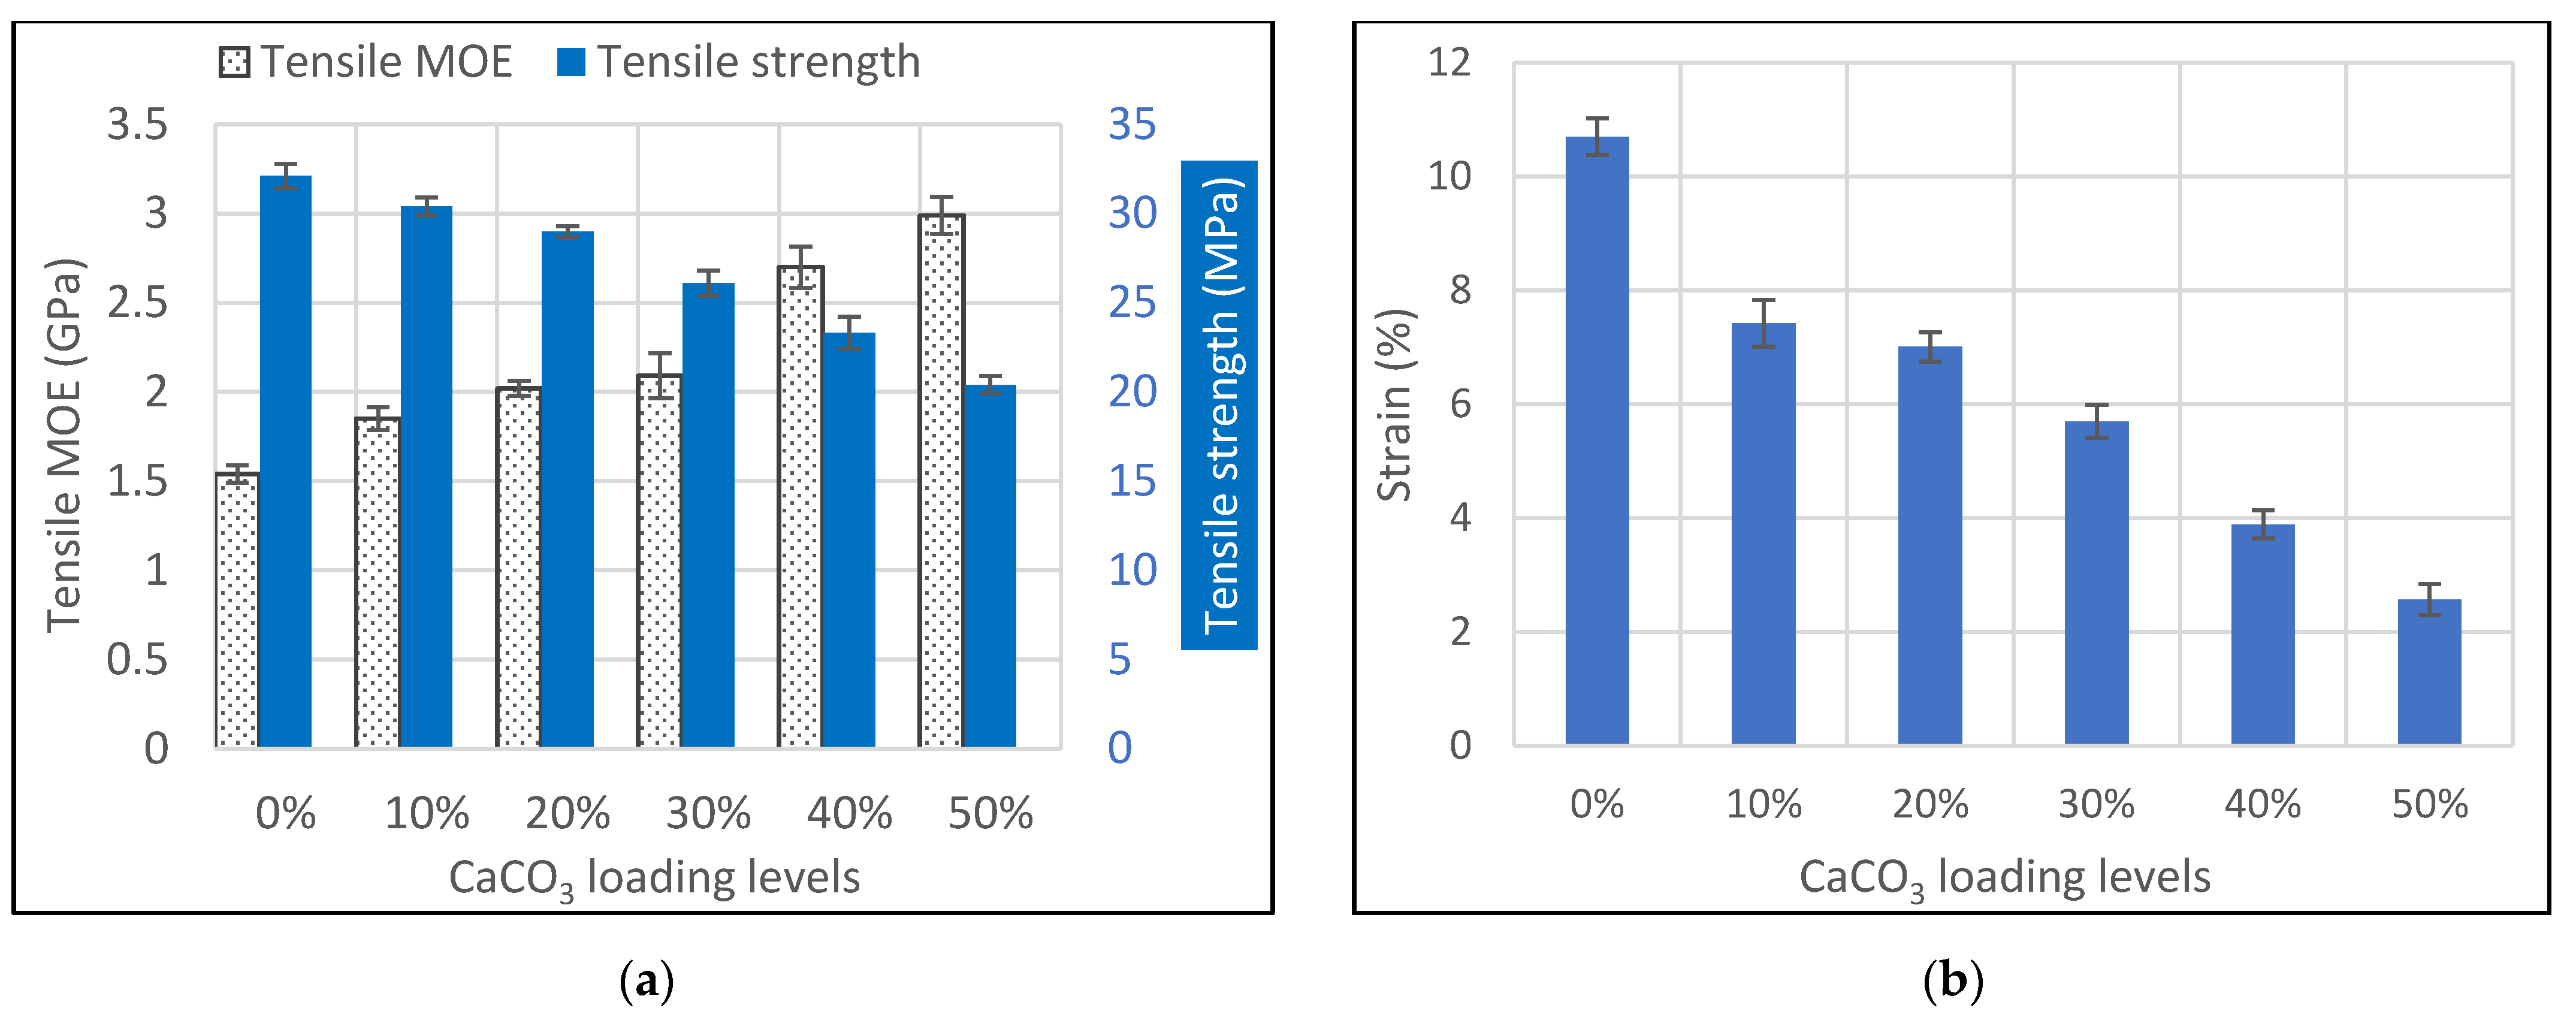
Table 1 represent significant differences in the mechanical results. After the batch mixer processing, HPP has an MOE and tensile strength of 1.54 GPa and 32.1 MPa, respectively (
Figure 2a and
Table 1). Addition of CaCO
3 particles at loading levels of 10, 20, 30, 40, and 50 wt.% into HPP through the batch mixer increased the tensile MOE of the composites to 1.85, 2.02, 2.09, 2.70, and 2.99 GPa, which are 20, 31, 36, 75, and 94% higher than that of pure HPP, respectively. On the other side, tensile strengths significantly decreased from 32.1 MPa to 30.4, 29, 26.1, 23.3, and 20.4 MPa with inclusion of 10, 20, 30, 40, and 50 wt.% CaCO
3, representing decreases of 5, 10, 19, 27, and 36%. The elongations at yield (strain) during the tensile testing were also characterized using an extensometer and the data is shown in
Figure 2b and
Table 1. When compared with HPP, inclusion of CaCO
3 at loading levels of 10, 20, 30, 40, and 50 wt.% significantly decreased the strain at yield from 10.7% to 7.4, 7.0, 5.7, 3.9, and 2.6%, which are around 31, 35, 46, 64, and 76% lower than that of pure HPP.
After injection molding, dispersed CaCO
3 particles were packed with HPP under high pressure in an aluminum mold followed by cooling. When the specimens were cooled to a lower temperature, specimen shrinkage in all the dimensions occurred in the mold and less shrinkage was observed for the CaCO
3 particles filled HPP specimens than that of pure HPP specimens. During specimen cooling, CaCO
3 particles in the composites restricted the movement of molecular chains of HPP, decreasing the shrinkage. Simultaneously, the particles also interrupted the crystallization process the composites went through during cooling and the mechanical behaviors of CaCO
3 particles filled HPP would therefore change. After settling the specimens for a period at room conditions, the polymer phase approached an equilibrium without any further deformation and polymer crystallization completed. HPP has a glass transition temperature lower than room temperature and polymer molecular chains can still move without significant effect on material properties. Under this approximate equilibrium, residual stress could be existed on the CaCO
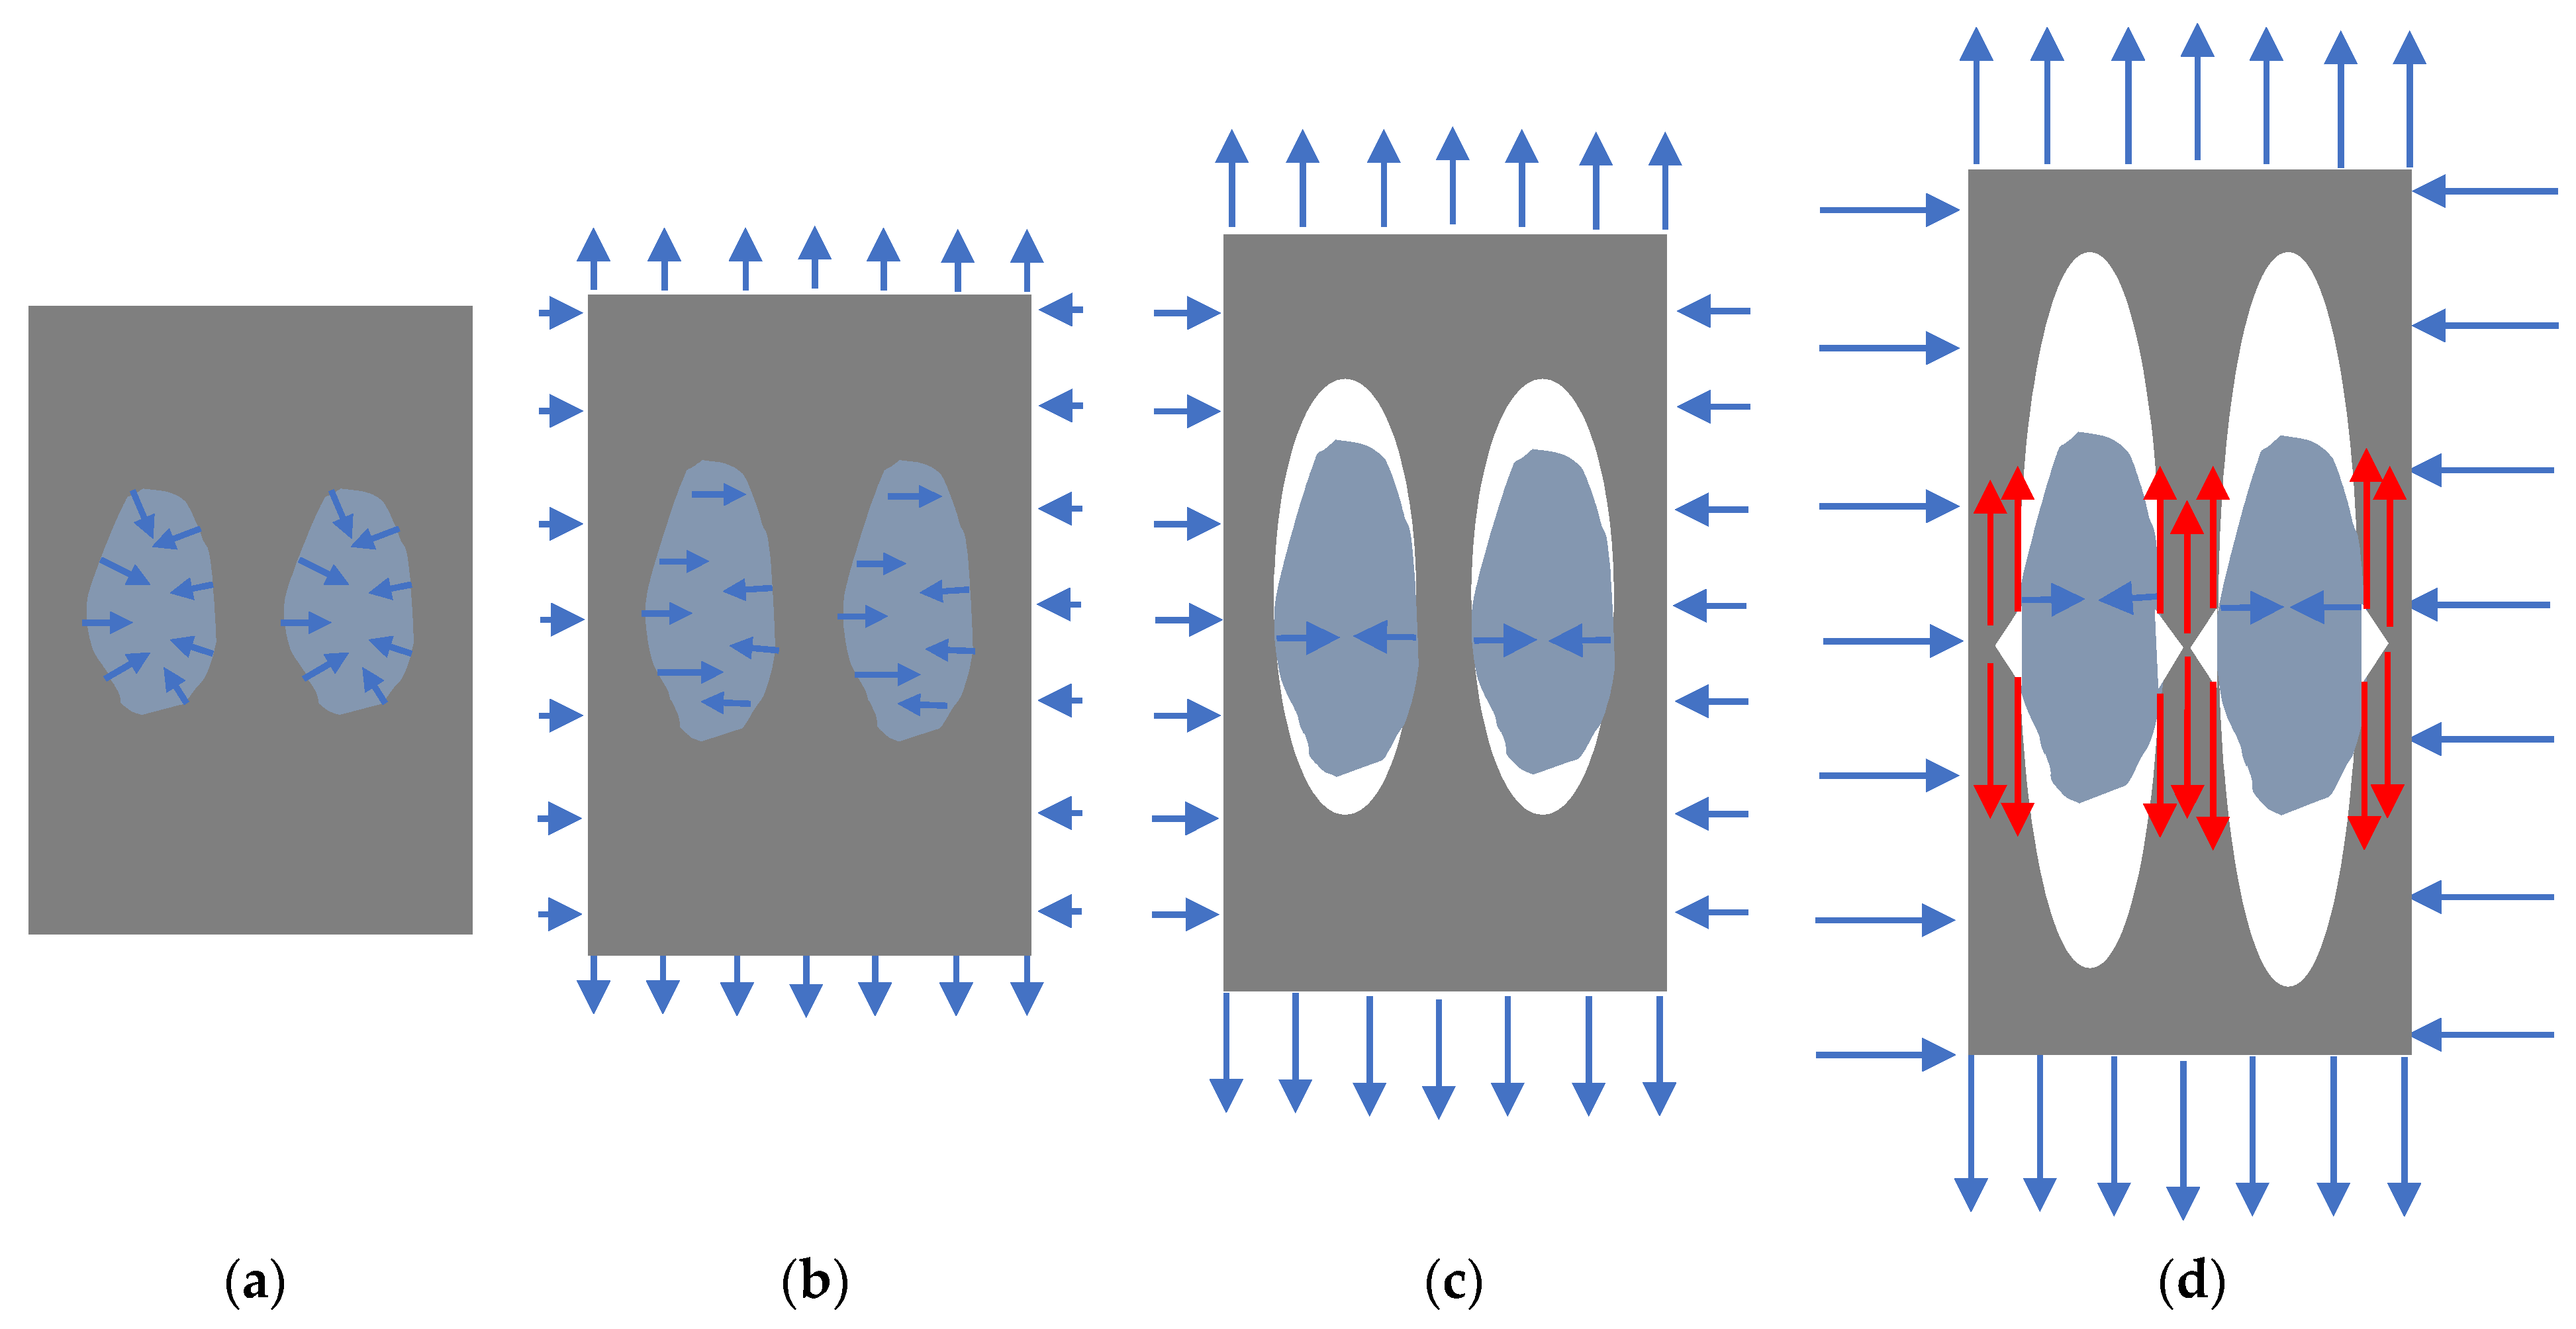
3 particle which is applied by polymer molecules due to polymer shrinkage during cooling. Therefore, CaCO
3 particles existed in the composite system bearing residual compression stresses with a small strain because of a high MOE (
Figure 3a). All the compression stresses are normal to the particle surface at all points.
Under tensile load for the equilibrated composite system, specimens of HPP and CaCO
3 particle filled HPP responded with an initial deformation in the elastic region. In this initial phase of the elastic deformation zone, stress inside the whole specimen is uniform and initial uniform strain is generated in a very small magnitude according to the classical mechanics. In this stage, external load released the residual stress applied on CaCO
3 particles along the tensile load direction, returning the particle to the zero-stress status and cancelling the strain in the tensile load direction which was caused by the initial residual stress (
Figure 3b). Additionally, tensile load also applies shrinking force perpendicular to the tensile load direction on the specimen due to Poisson’s ratio effect, compressing the CaCO
3 particles cross the tensile load direction, simultaneously.
As the external tensile load increases the elastic strain of polymer phase would be much larger than that of CaCO
3 particle because MOE of CaCO
3 particle is much greater than that of HPP. With the same grip separation in this strain range, the deformation of CaCO
3 particles cannot catch up with the deformation of HPP. Starting at this moment, polymer phase begins to separate with CaCO
3 particles and debonding at a point of the interface occurs first along the tensile load direction. For an irregular shape rigid particle embedded in the polymer matrix, the farthest point on the particle surface in the tensile load direction debonds first, forming a void, and then the debonding slowly spreads along the particle surface to all directions. The debonding continues until voids form at all the interface perpendicular to the tensile load direction (
Figure 3c). At the same time, as the specimen elongates in the direction of load, shrinkage continues to occur in the direction perpendicular to the load. Therefore, the polymer matrix would hold the rigid particle at the widest point and applies compression stresses on the particle (
Figure 3c). This is the second stage deformation of the composite under tensile load. During this process, CaCO
3 particles interfere with the mechanical responses of the composites under tensile stress and the dominant deformation mechanism is still in the elastic range, mostly occurring with the polymer phase. The tensile MOE characterization results shown in
Figure 1 and
Table 1 demonstrated the interferences from CaCO
3 particles and tensile MOE increased with the interferences. When the loading levels of particles increased from 10 to 50 wt.%, more surface area of CaCO
3 particles became involved in this interference, resulting in greater tensile MOE of the composites. At this second stage of elastic deformation, a shear force could also be generated on the particle if the widest dimension of the particle is not aligned with the transverse direction of the specimen, rotating the CaCO
3 particles in the matrix during the deformation process.
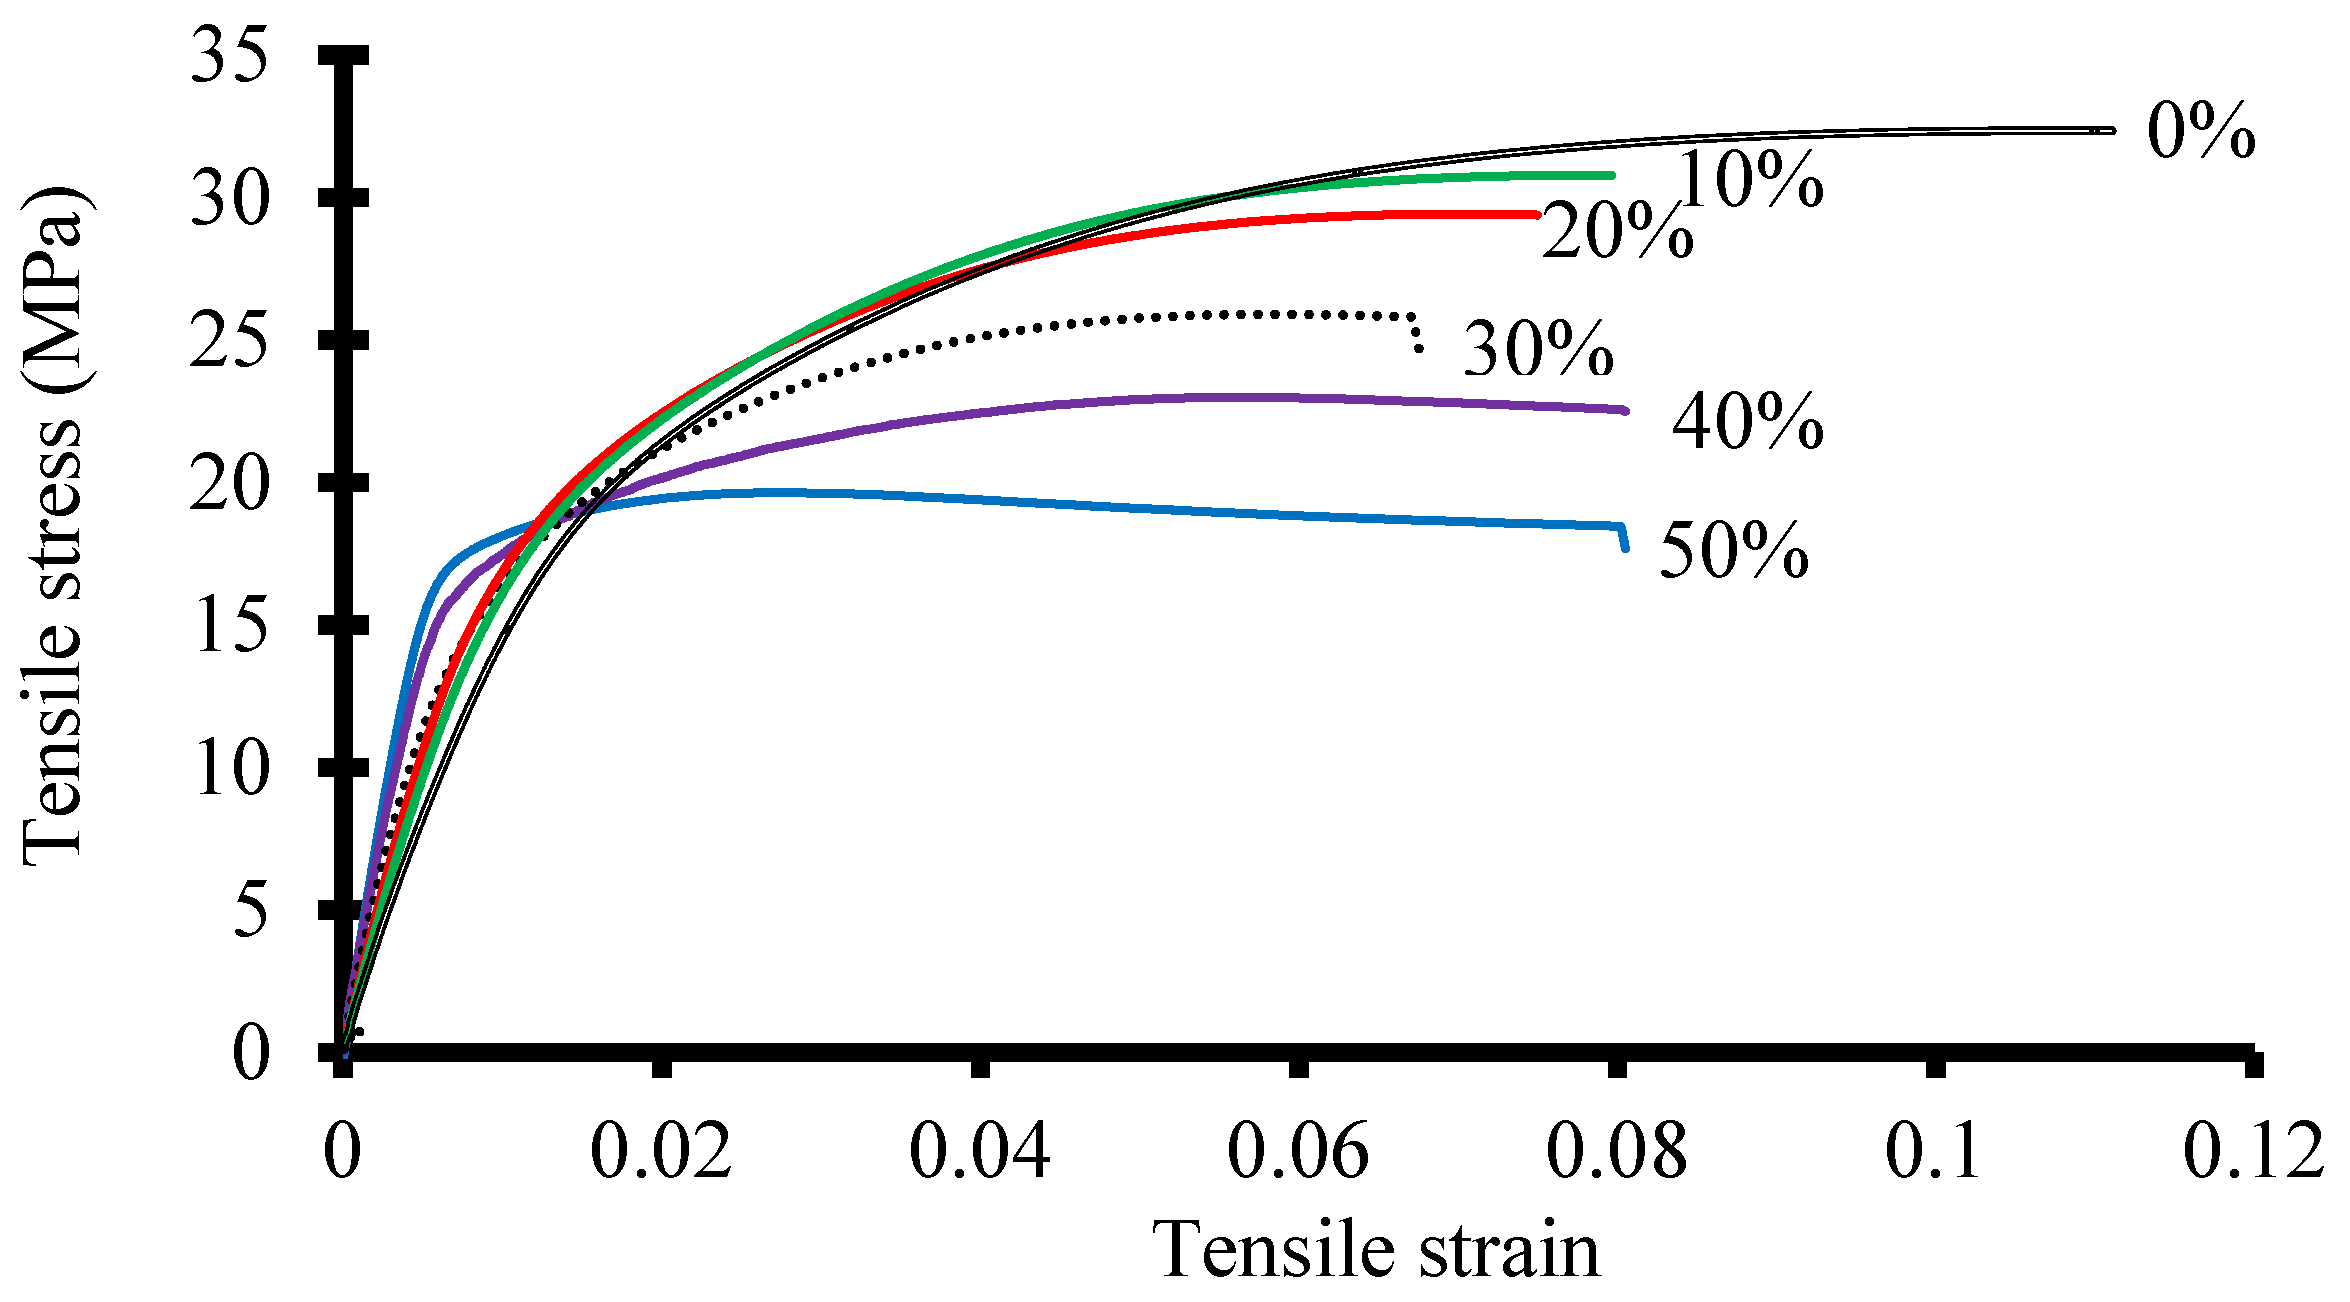
These phenomena of elastic deformation of the specimen can also be indicated by the stress-strain curves of the tested specimen and a representative stress-strain curves for each sample is shown in
Figure 4. In this elastic deformation range, higher loading CaCO
3 particles in the composite needed a proportionally higher stress to reach the same strain assuming a similar uniform dispersion of these particles in HPP. Simultaneously, higher loading particle composites also required greater stresses to reach the initial phase of the elastic deformation zone (
Figure 3b). A linear regression analysis on the tensile MOE (Y) versus CaCO
3 loading levels (X) showed a linear relation below:
In this relationship, tensile MOE increased linearly with particle loading level, which verified the theory proposed above.
As a greater external tensile load continues to be applied to the testing specimen, plastic deformation of the HPP system dominates the deformation process with increased strain and the composite deformation passed the elastic zone. Rigid CaCO
3 particles do not go through the plastic deformation in this case. At this stage, the slopes of the stress-strain curves start to decrease until the yield point of the composites is reached (
Figure 4). At the point of composite yielding, rupture of the plastic matrix occurs, and tensile strength is obtained. During the plastic deformation range, additional tension stress is applied to the polymer phase in the transverse direction of the specimen by the CaCO
3 particles. This tension stress is the reaction stress to the stress applied the CaCO
3 particles. Therefore, the yielding and rupture of the polymer phase is achieved by the combination of the external tension load and the reaction tension stress from CaCO
3 particles (
Figure 3d). Sharp edges of CaCO
3 also play a role in yielding the composite under tensile load.
At the yielding point, the tensile stress (strength) is calculated by dividing the external force with the cross-section area of the specimen and the force is only loaded to the polymer phase since there is a complete separation between polymer phase and CaCO
3 particles in the loading direction. For the same cross-section area with the same amount of polymer phase, the tensile strength would be the same. When the loading levels of CaCO
3 in the composites increased from 10 to 50 wt.%, the amount of polymer phase in the cross-section decreased with a proportional rate and the tensile strength would decrease linearly with CaCO
3 particle loading levels. The experimental results of the tensile strength are shown in
Figure 1a and
Table 1. Data analysis of the tensile strength showed a linear relationship between the tensile strength (Y) and the CaCO
3 particle loading level (X):
Other factors, such as particle distribution and dispersion and the reaction tension stress applied by particles had a minor effect on tensile strength.
The tensile strain at yield behaved the same as the tensile strength (
Figure 1b) and it decreased significantly with increasing CaCO
3 particle loading levels. Along the tensile load direction, portion of polymer molecular chains was replaced by the CaCO
3 particles, and the strain needed to achieve the tensile strength would decrease proportionally. The linear relationship between the strain at yield (Y) and CaCO
3 particle loading level (X) is shown below.
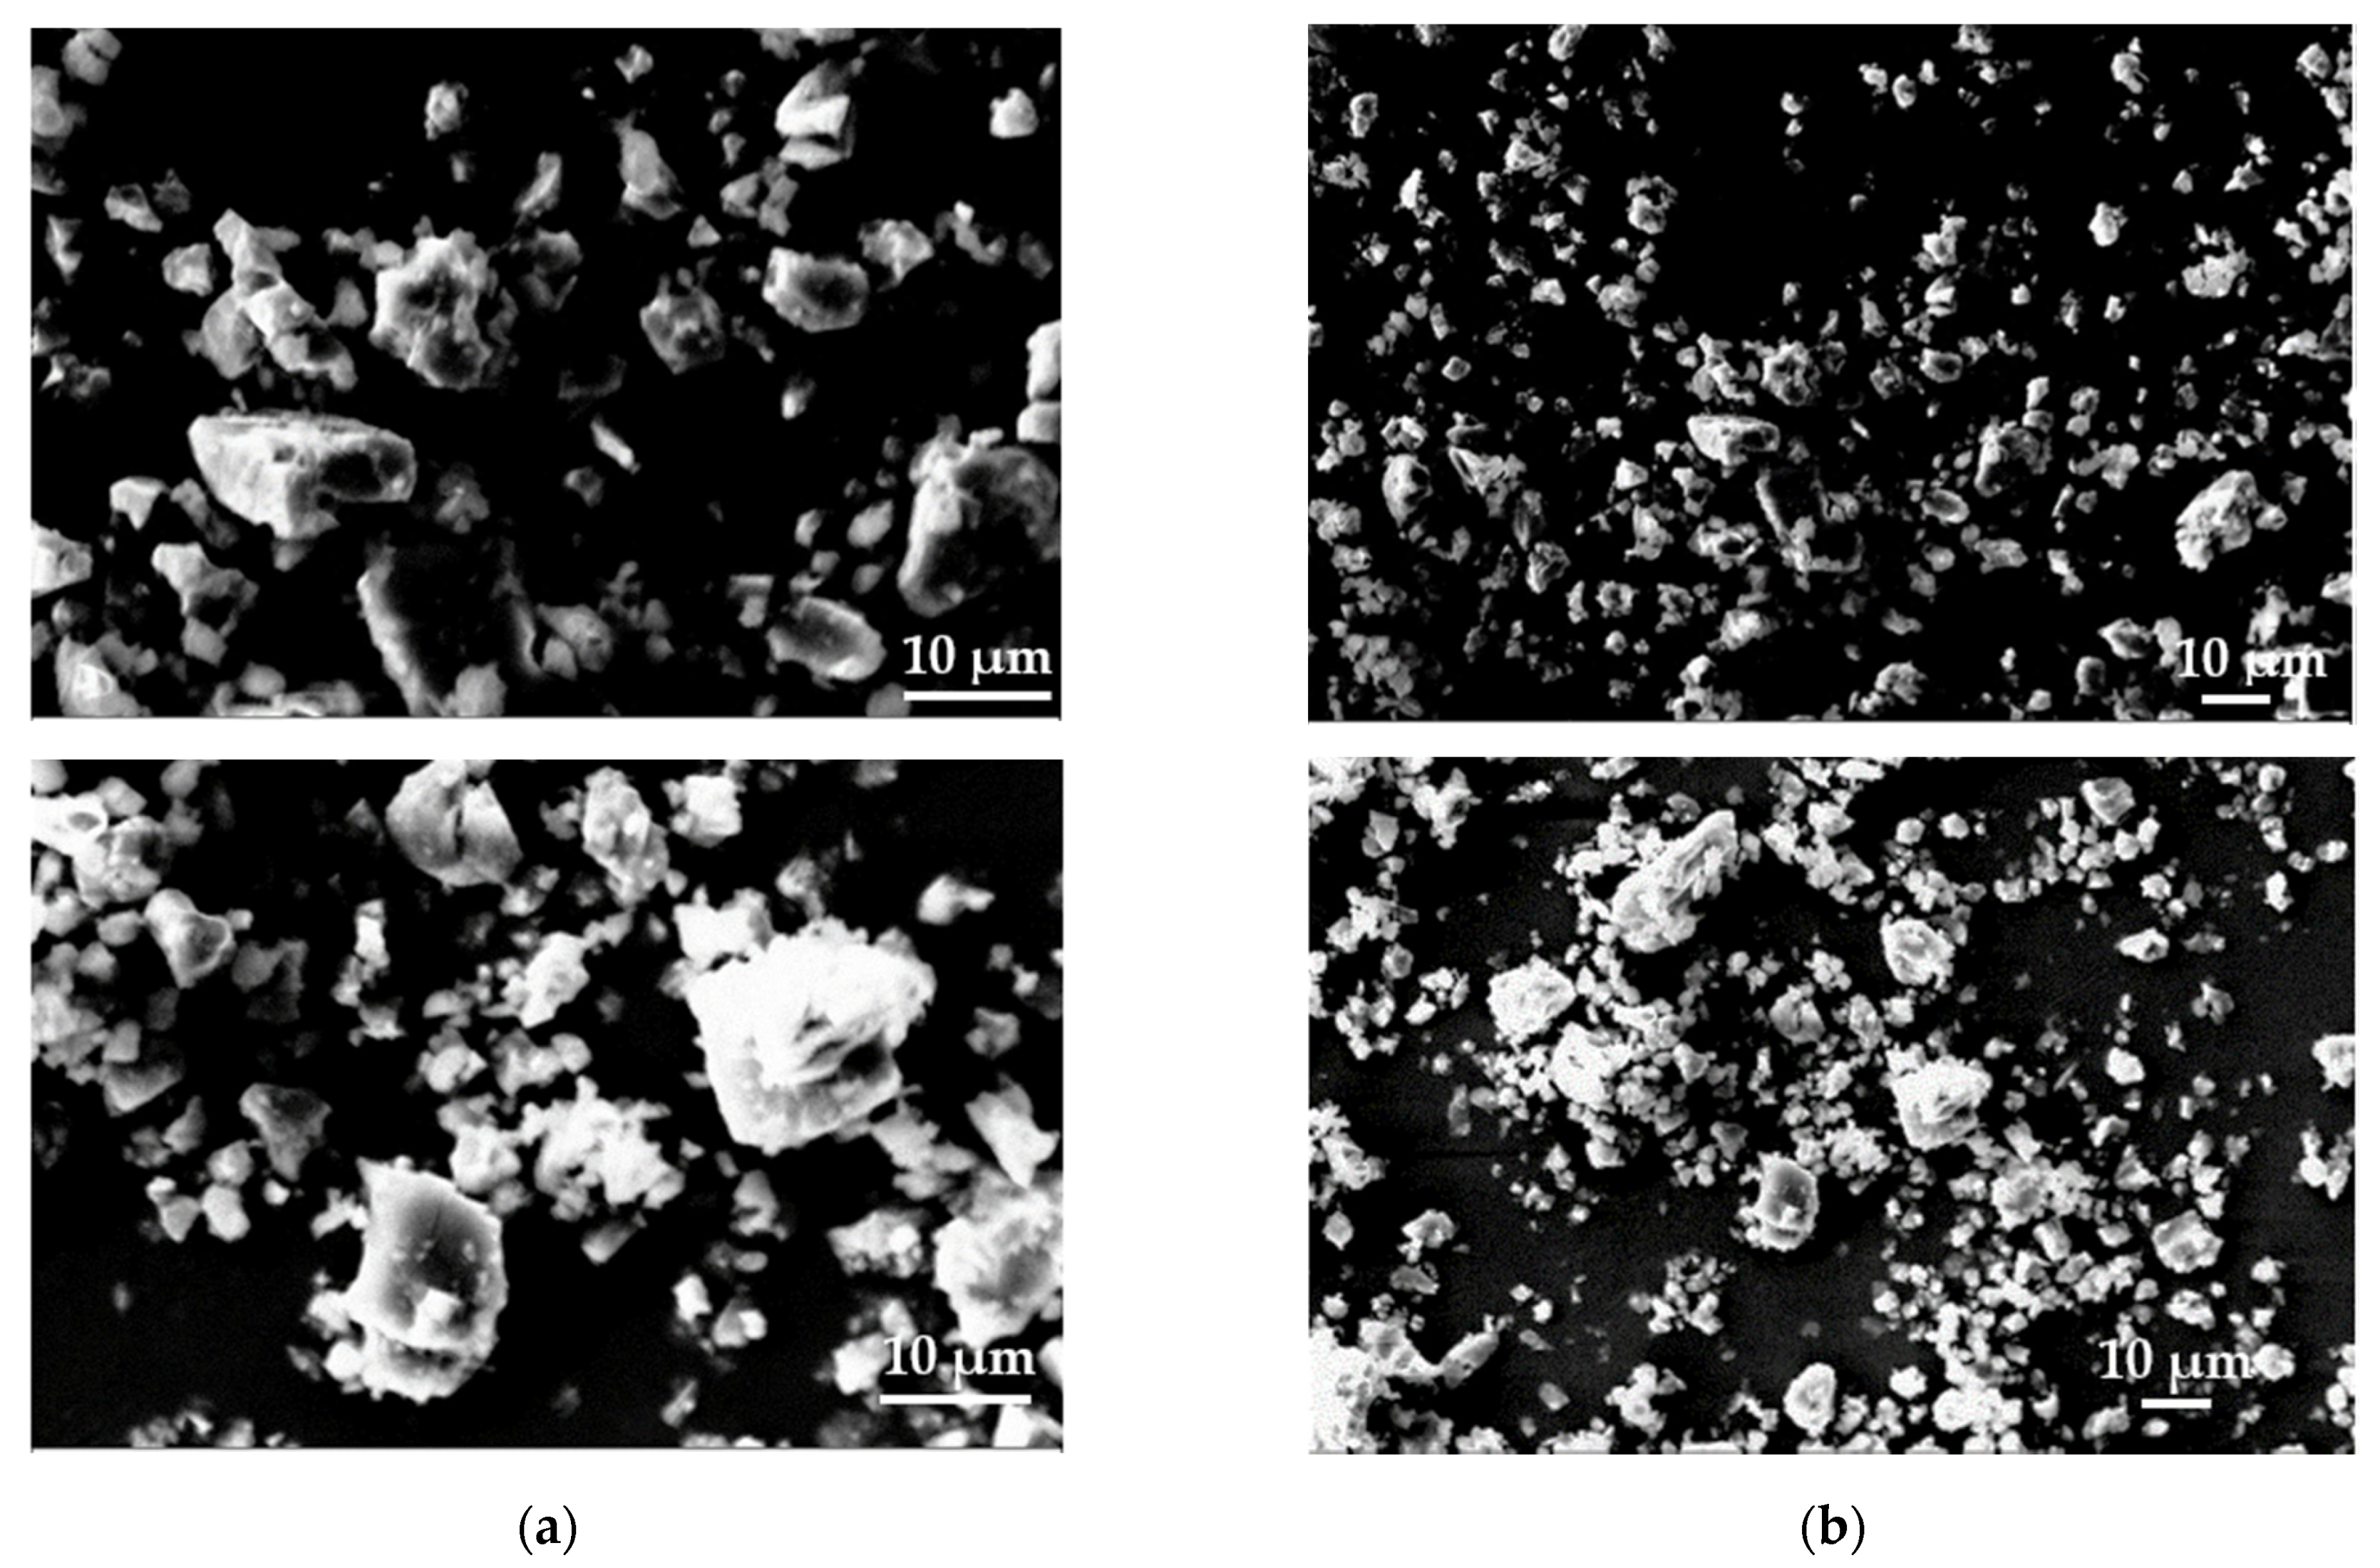
In summary, the tensile properties of CaCO3 particles filled HPP changed linearly with particle loading levels. In our proposed explanation, the particle morphologies, including shape and size, and quantity play critical role affecting the tensile behaviors of the composites.
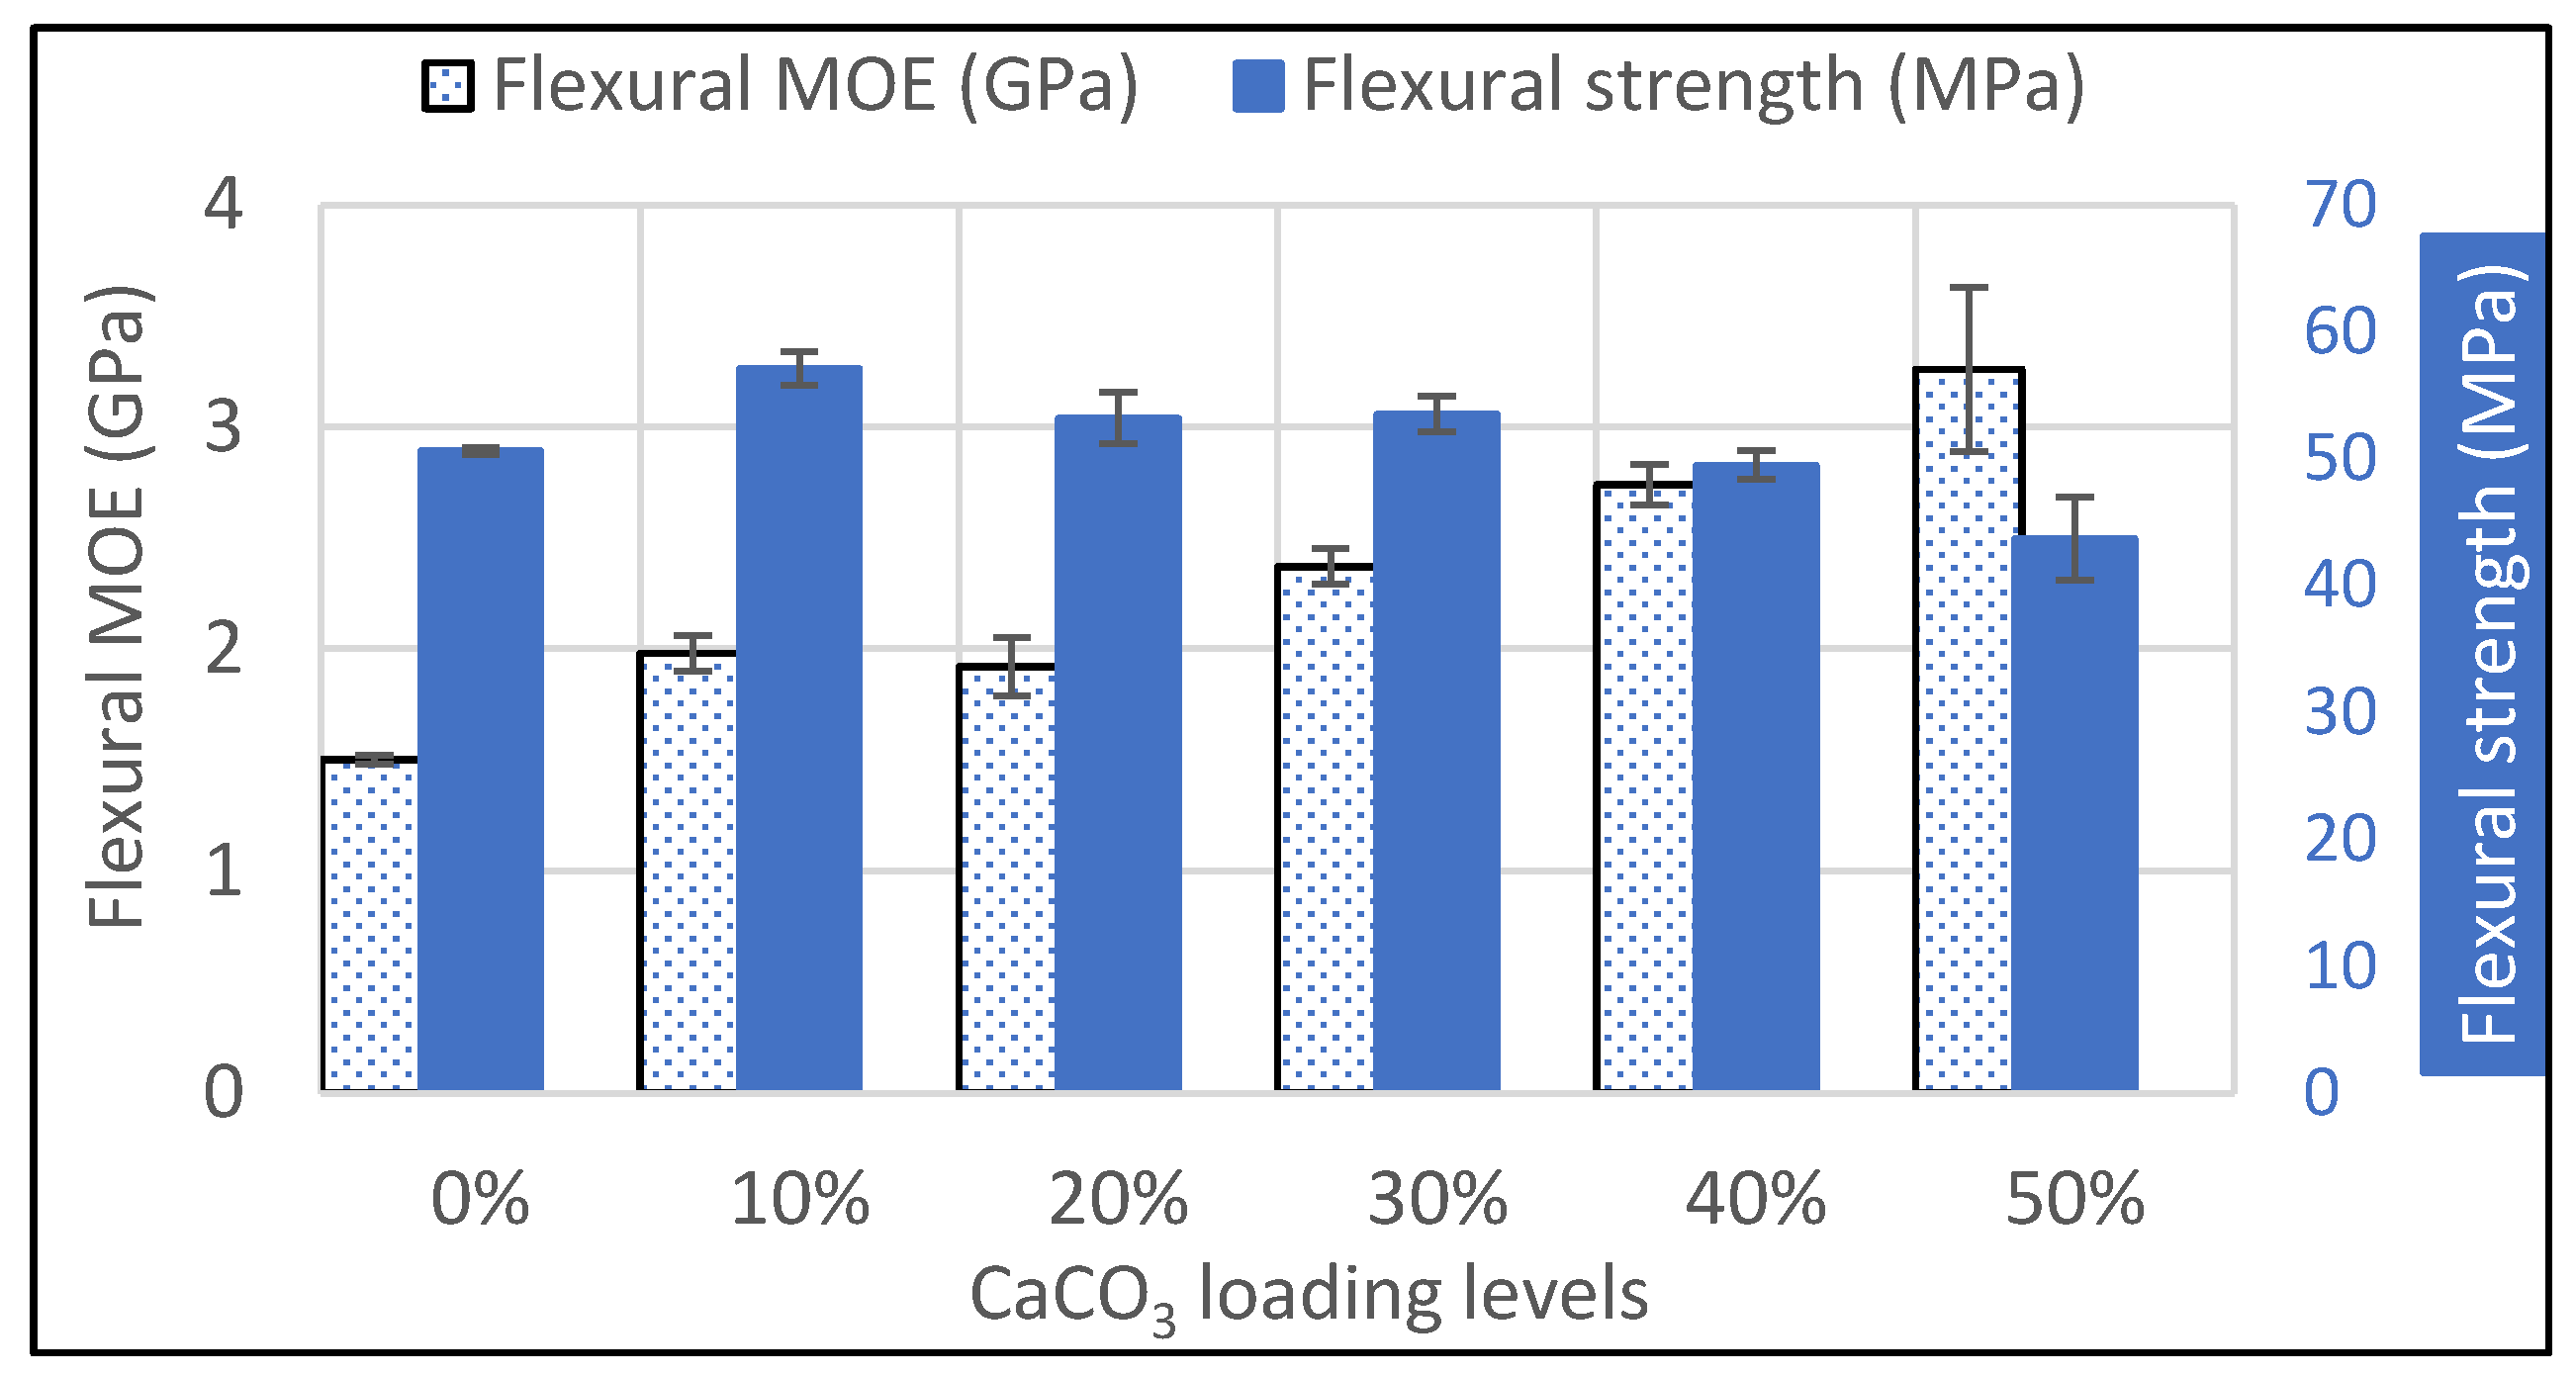
The flexural properties of pure HPP and CaCO
3 particles filled HPP, including flexural MOE and strength, are shown
Figure 5.
Table 1 shows the detail numbers and the statistical analysis results. During the flexural tests, all the specimens did not yield or break at 5% strain limit at two different testing speeds. The flexural strength at 5% strain obtained using the rate of straining of the outer fiber of 0.1 mm/mm/min was reported in this study. The flexural MOE and strength of HPP are 1.50 GPa and 50.6 MPa. Adding CaCO
3 particles into HPP significantly increased the flexural MOE and the MOE at 10, 20, 30, 40, and 50 wt.% particle loadings are 1.98, 1.92, 2.37, 2.74, and 3.26 GPa, which are 32, 28, 58, 83, and 117% greater than that of pure HPP, respectively. The increase of flexural MOE is common when including rigid particles in polymer composites [
34]. The flexural strength of the composites increased from 50.6 MPa for pure HPP by inclusion of the CaCO
3 particles at 10, 20, and 30 wt.% and the flexural strengths are 57.1, 53.2, and 53.5, respectively. There is no significant difference on flexural strength for the composite with 40 wt.% CaCO
3 particles when compared with HPP. Adding 50 wt.% CaCO
3 significantly decreased the flexural strength of HPP. The deformation of the specimen during flexural test is complex, combining the tension on the bottom surface of the specimen and the compression at the top surface. In the particle loading level ranges of 10, 20, and 30 wt.%, the compression strength is increased on top surface. Simultaneously, the stress needed for the bottom surface to reach 5% strain is increased, resulting in the increase of flexural strength of the composites. At the 40 and 50 wt.% CaCO
3 loadings, a larger portion of the composites surface contained interfaces between CaCO
3 particle and polymer phase and a lower stress was required to achieve a 5% strain on the bottom surface than that needed in composites having 10–30 wt.% particles, resulting in a lower flexural strength. At the 50 wt.% loading level, the flexural strength is also lower than that of HPP (
Figure 5).
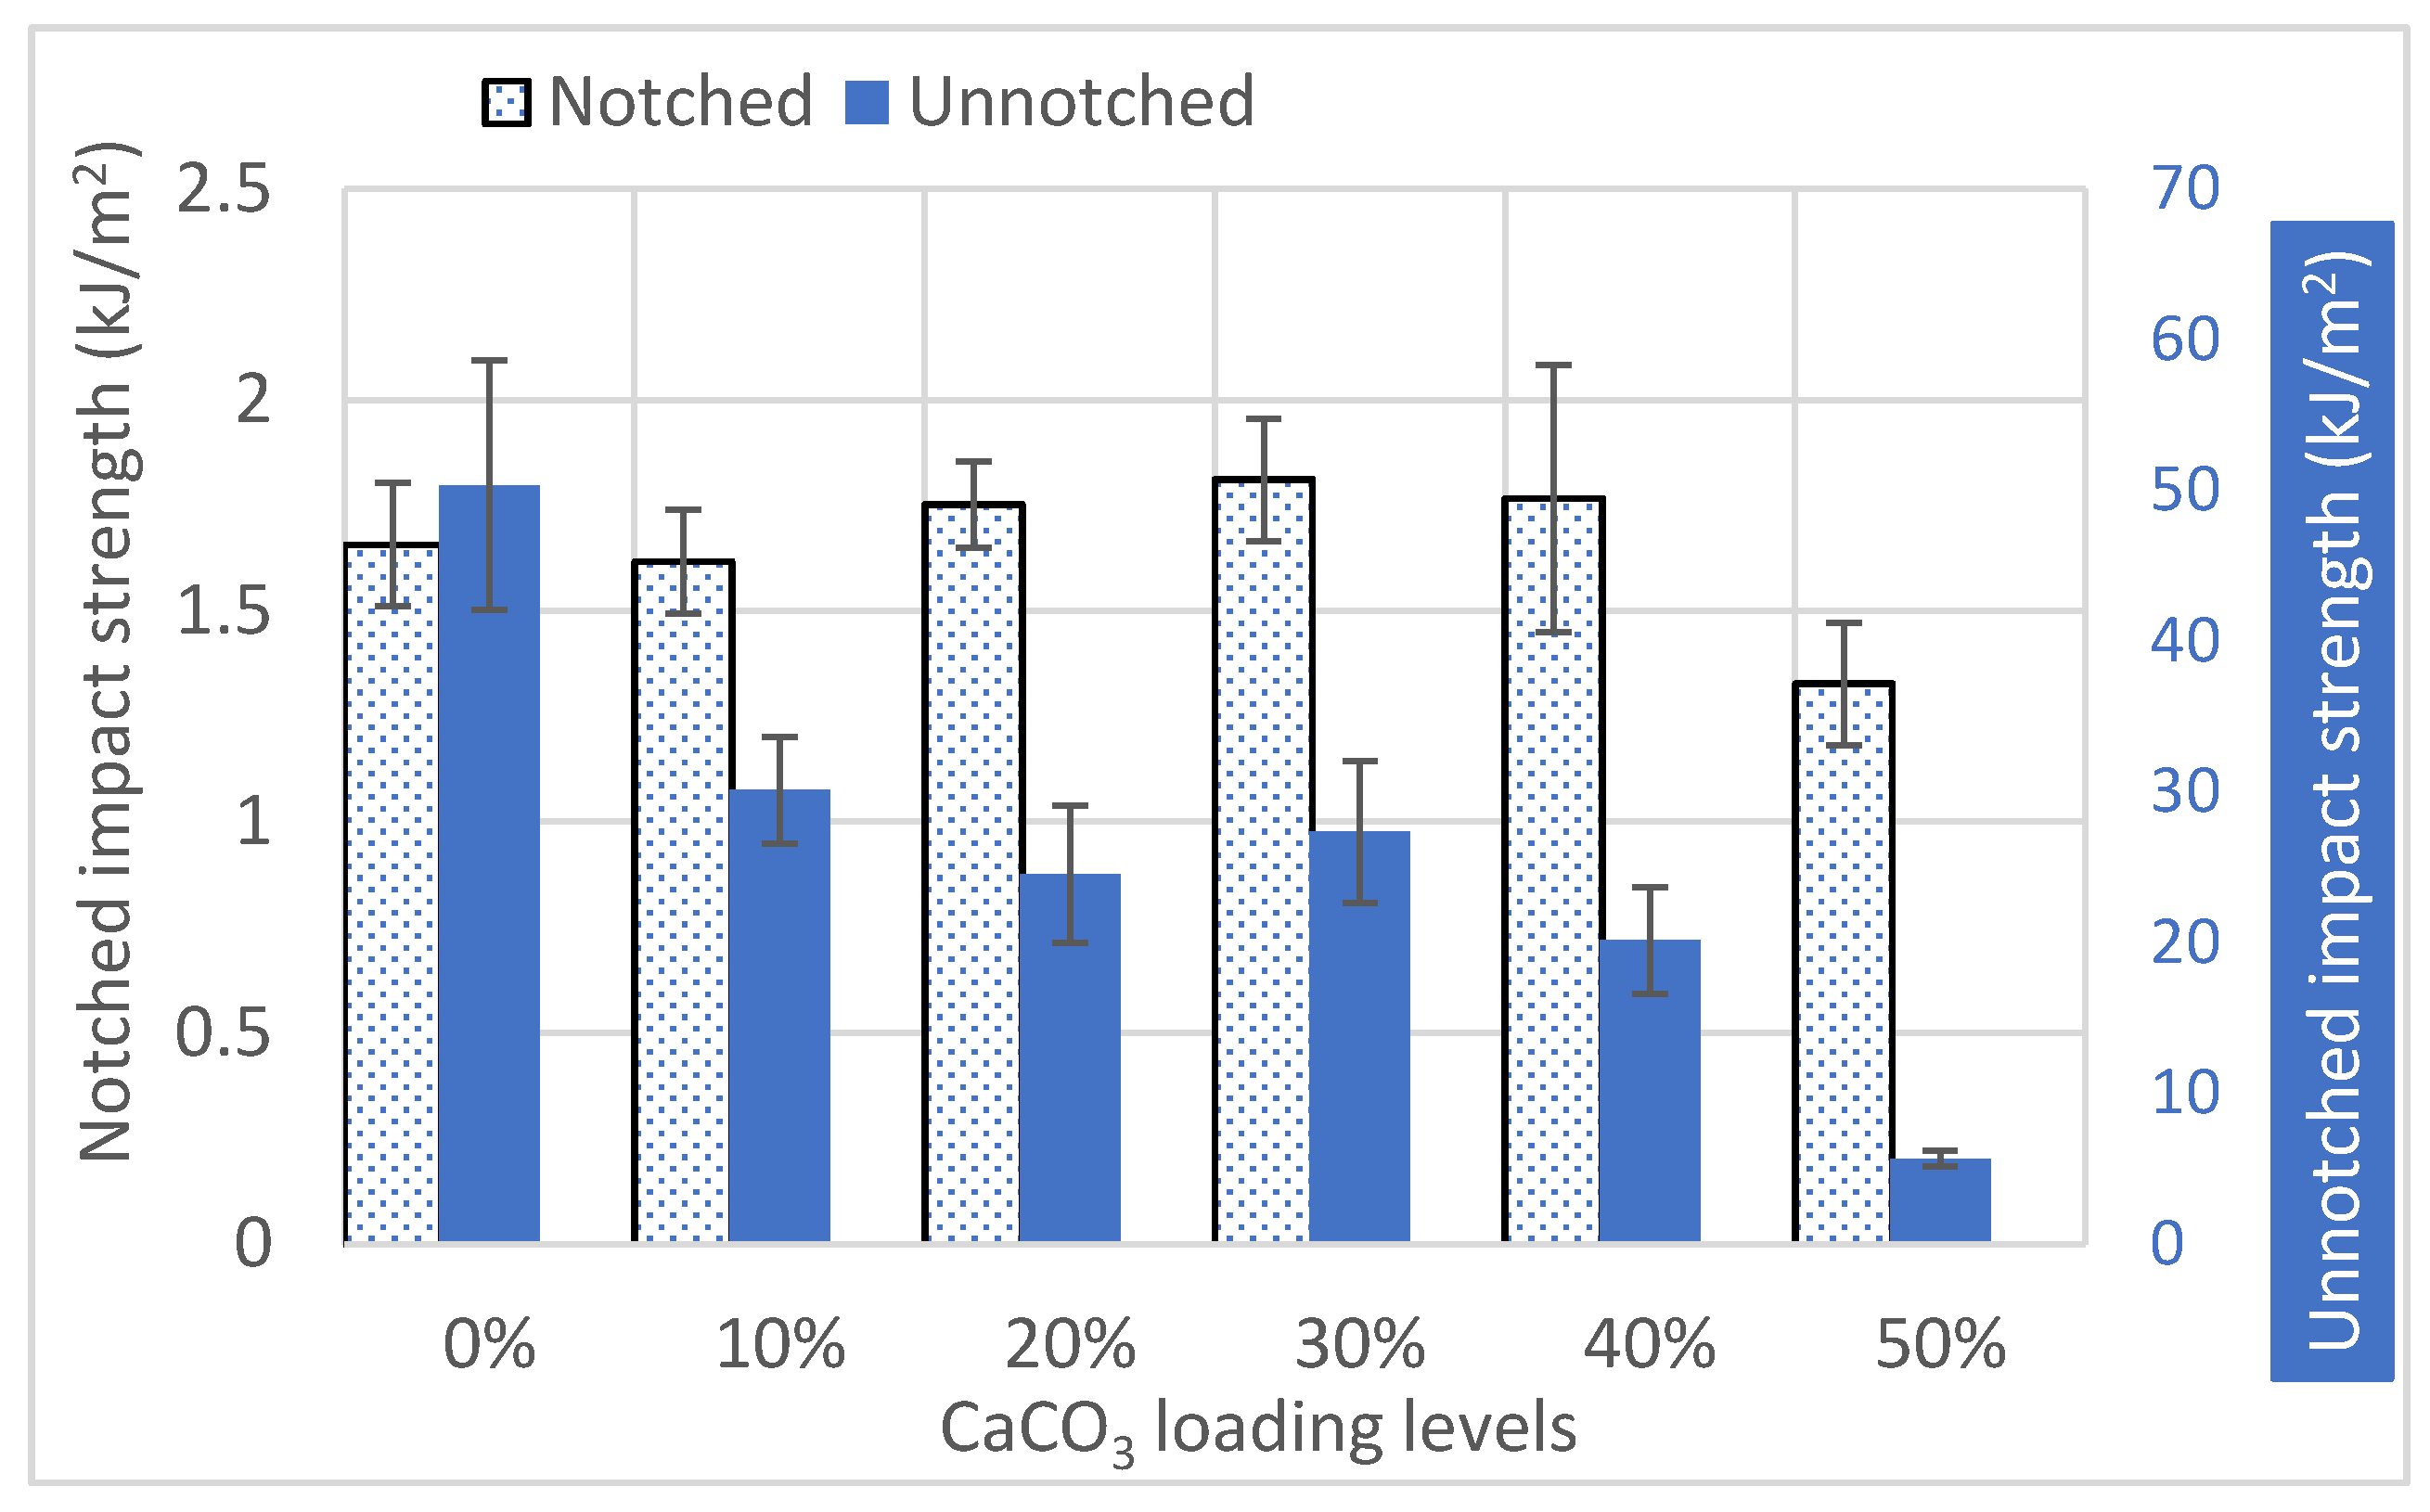
3.3. Impact Properties of CaCO3 Particles Filled HPP
The Izod impact strengths tested notched and unnotched for all the composites are shown in
Table 1 and
Figure 6. The unnotched specimens were tested with the v-notch faced backward to the hammer load. The notched and unnotched impact strengths for pure HPP are 1.66 and 50.3 kJ/m
2. For notched impact tests, the impact strengths for composites with CaCO
3 particle loading levels of 10, 20, 30, 40, and 50 wt.% are 1.62, 1.75, 1.81, 1.76, and 1.32 kJ/m
2. The statistical analysis indicated that the impact strengths of composites with CaCO
3 particle loading levels of 10, 20, 30, and 40 wt.% are not significantly different than that of pure HPP (
Table 1). At 50 wt.% loading, the notched impact strength (1.32 kJ/m
2) is significantly lower (20%) than that of pure HPP (1.66 kJ/m
2). For unnotched impact tests, the composites containing the rigid particles have significantly much lower impact strengths and the impact strengths at 10, 20, 30, 40, and 50 wt.% loading levels are 30.1, 24.5, 27.3, 20.1, and 5.67 kJ/m
2, which are 40, 51, 46, 60, and 89% lower than that of pure HPP (50.3 kJ/m
2) (
Table 1 and
Figure 6).
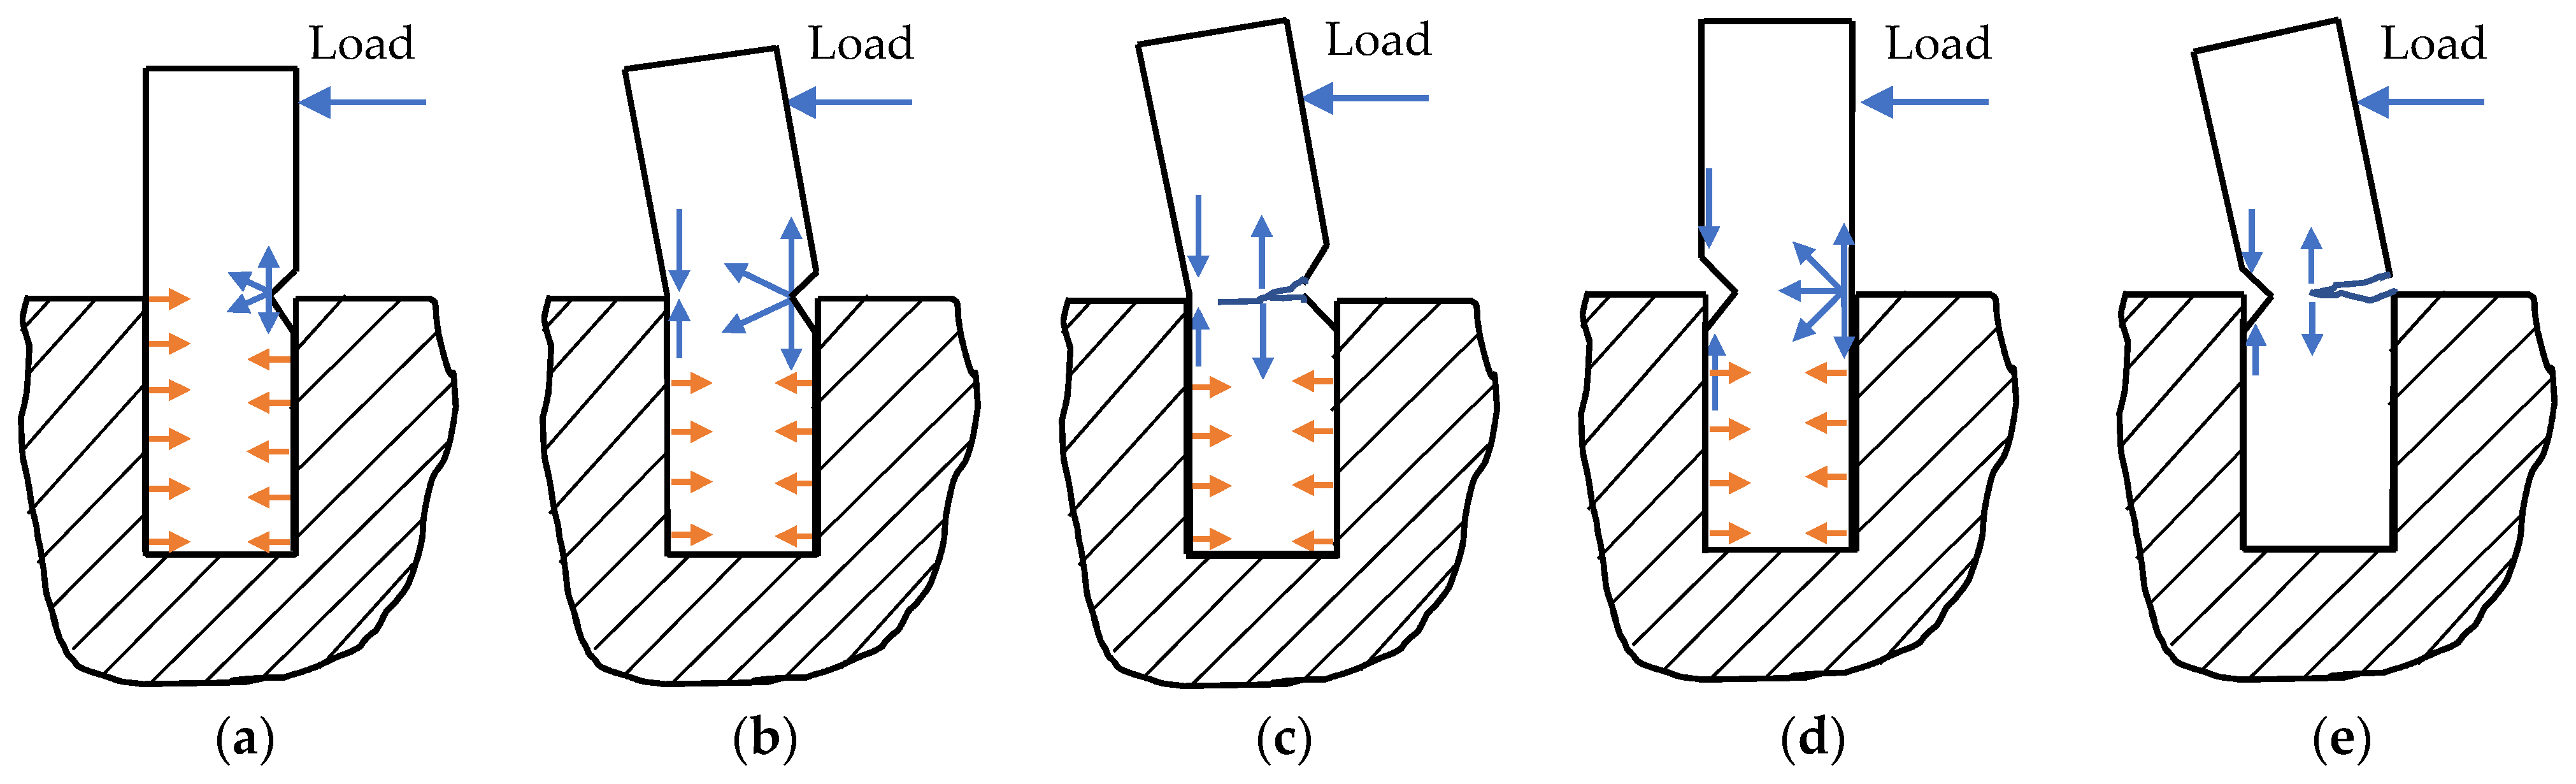
During the notched Izod impact test, the notching side of the specimen faced the impact load (
Figure 7). The bottom half of the specimen was held tight by the specimen holder and compression forces were applied to the specimen during the test (
Figure 7a). When the hammer contacted the specimen, a high magnitude of impact load applied strong stress to the notch tip. The effect of the stress can be simplified as tension and compression to the notch tip (
Figure 7b). The tension force facilitated the fracture initiation which could be induced by notching process and the compression force helped to propagate the fracture toward the center of the specimen transversely (
Figure 7c). Once fracture started to propagate (
Figure 7c), tension force would be the main driver moving the fracture front boundary toward the backside of the specimen. The backside of the specimen was always under compression until the complete failure of the specimen. The notched Izod impact strength was then calculated through dividing the energy to break the specimen by the specimen cross-section area. The energy to fracture the HPP sample would be the energy to overcome the elastic and plastic deformation of HPP, i.e., the work needs to be done to create the new surfaces of HPP.
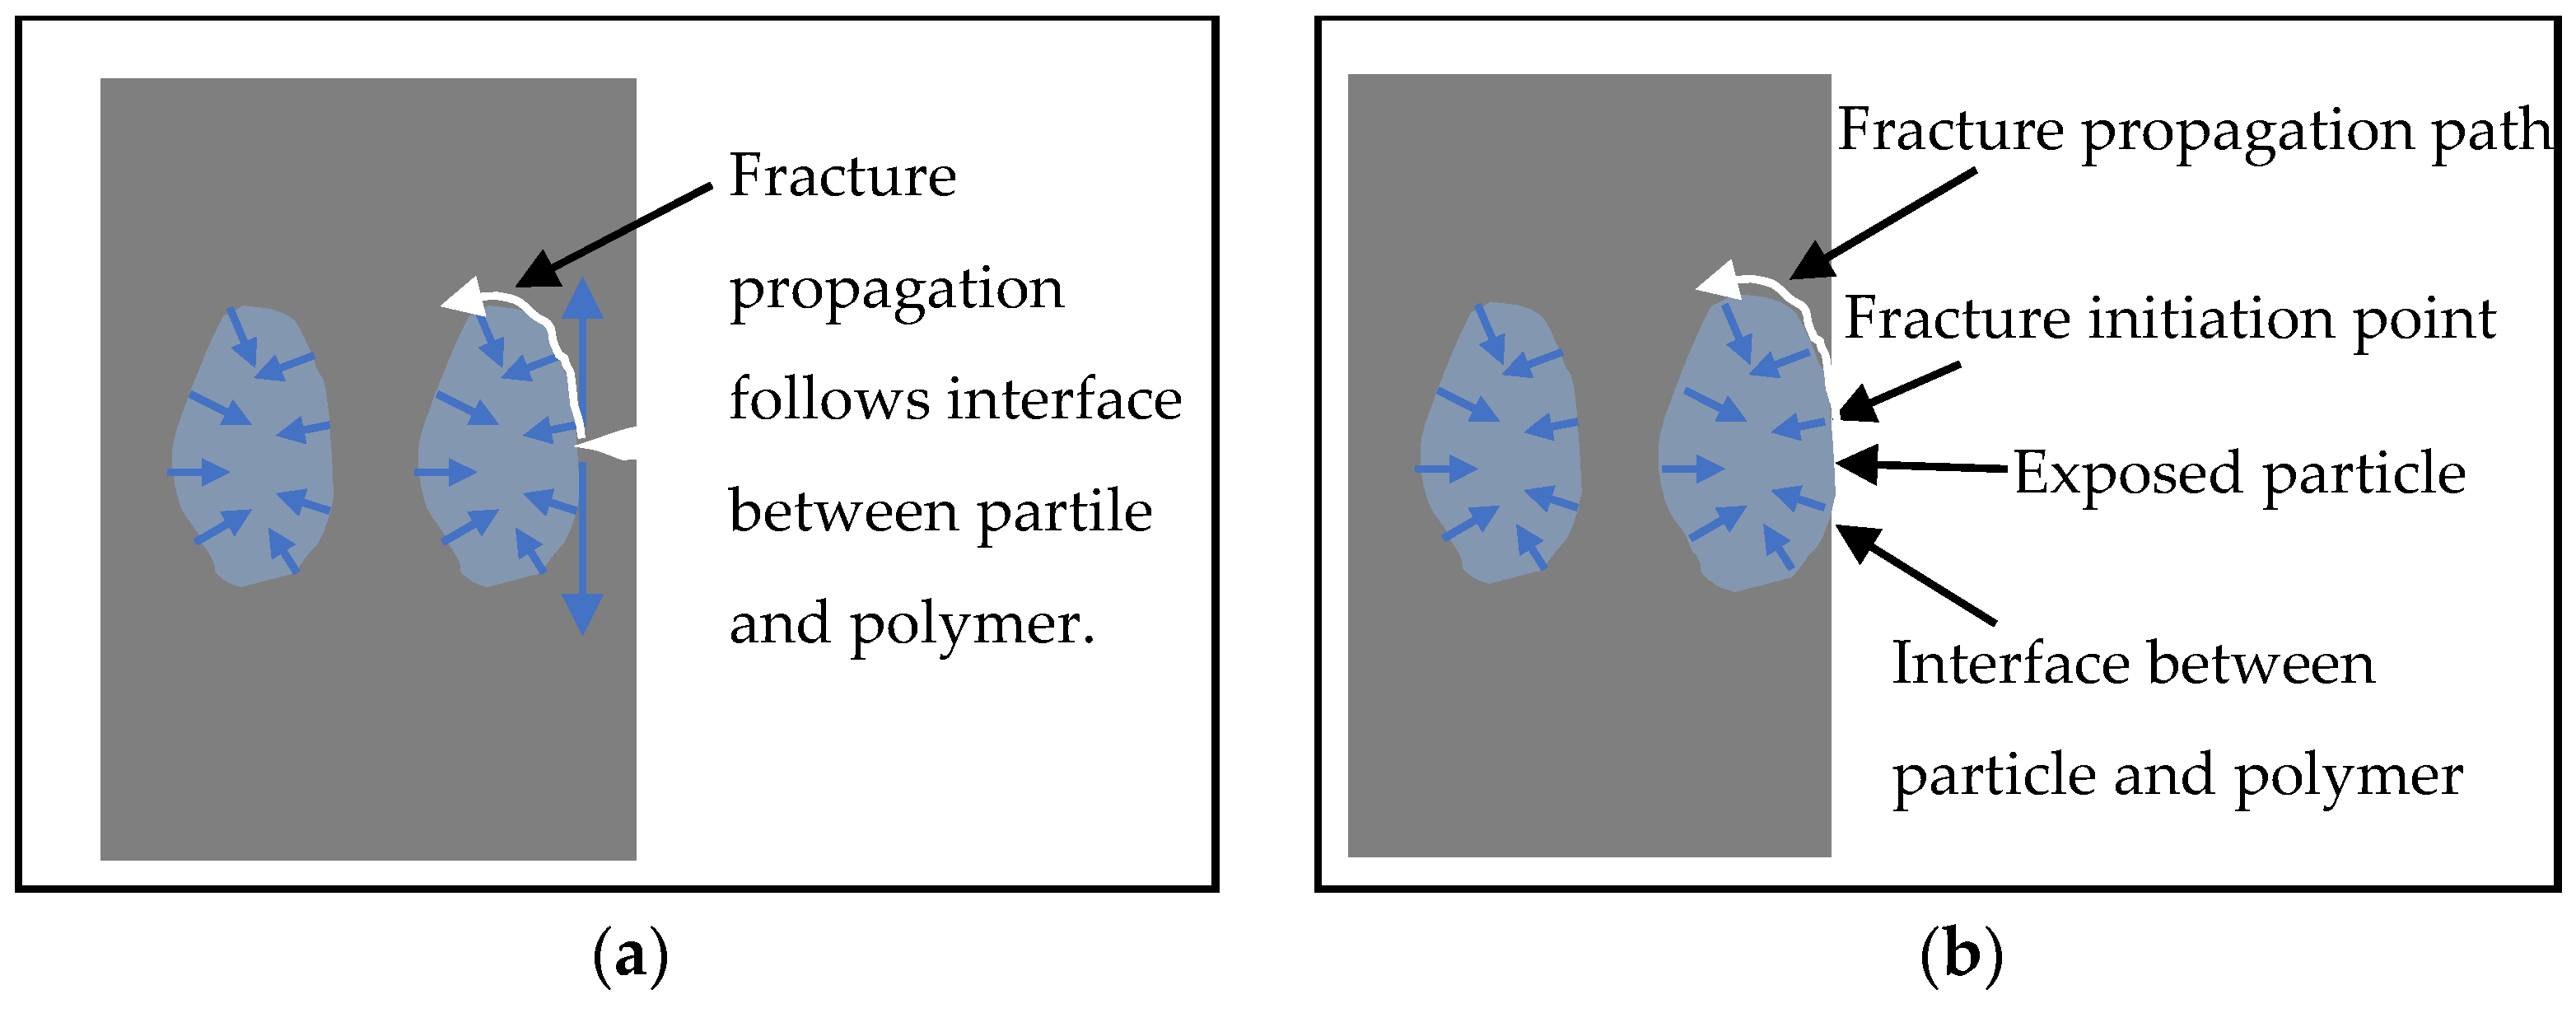
In CaCO3 filled HPP composites, fracture can only occur in the polymer phase or at the interface between the particles and polymer. To be fractured, a polymer must go through elastic and plastic deformation zones. Assuming a same surface area (Atotal) was created after specimen fracture for pure HPP and CaCO3 particles filled HPP composites, there would be less deformation energy for the polymer phase in CaCO3 particles filled HPP composites because partial fracture surface would be replaced with CaCO3 particle surface (Afiller). Under this circumstance, the energy for fracturing CaCO3 particles filled HPP composite would be lower and less amount of polymer has been fractured, resulting in lower impact resistance of the sample. The surface area for polymer fracture for CaCO3 filled HPP composite is (Atotal − Afiller). Another premise for the theory to be true is that much less energy is needed to separate CaCO3 particle and polymer matrix compared with fracture of polymer matrix. This is a reasonable estimation for this specific case because there was no chemical modification on the surface of CaCO3 particles. Alternatively, we can say that the work needed to separate unit interface of CaCO3 particle and polymer is lower than that for creating unit fracture surface of the polymer.
During the fracture propagation process, however, CaCO
3 filled HPP behaved differently. The rigid particle functioned as a blocker for the fracture propagation. Therefore, the fracture front of the CaCO
3 particles filled HPP followed a different path than pure HPP. The fracture front moved along the interface between CaCO
3 particles and polymer matrix (
Figure 8a), followed by fracturing the pure polymer phase between CaCO
3 particles. With this new fracture path, a much larger fracture surface area (A
filler’ > A
filler) was created for CaCO
3 particles filled HPP when compared with pure HPP.
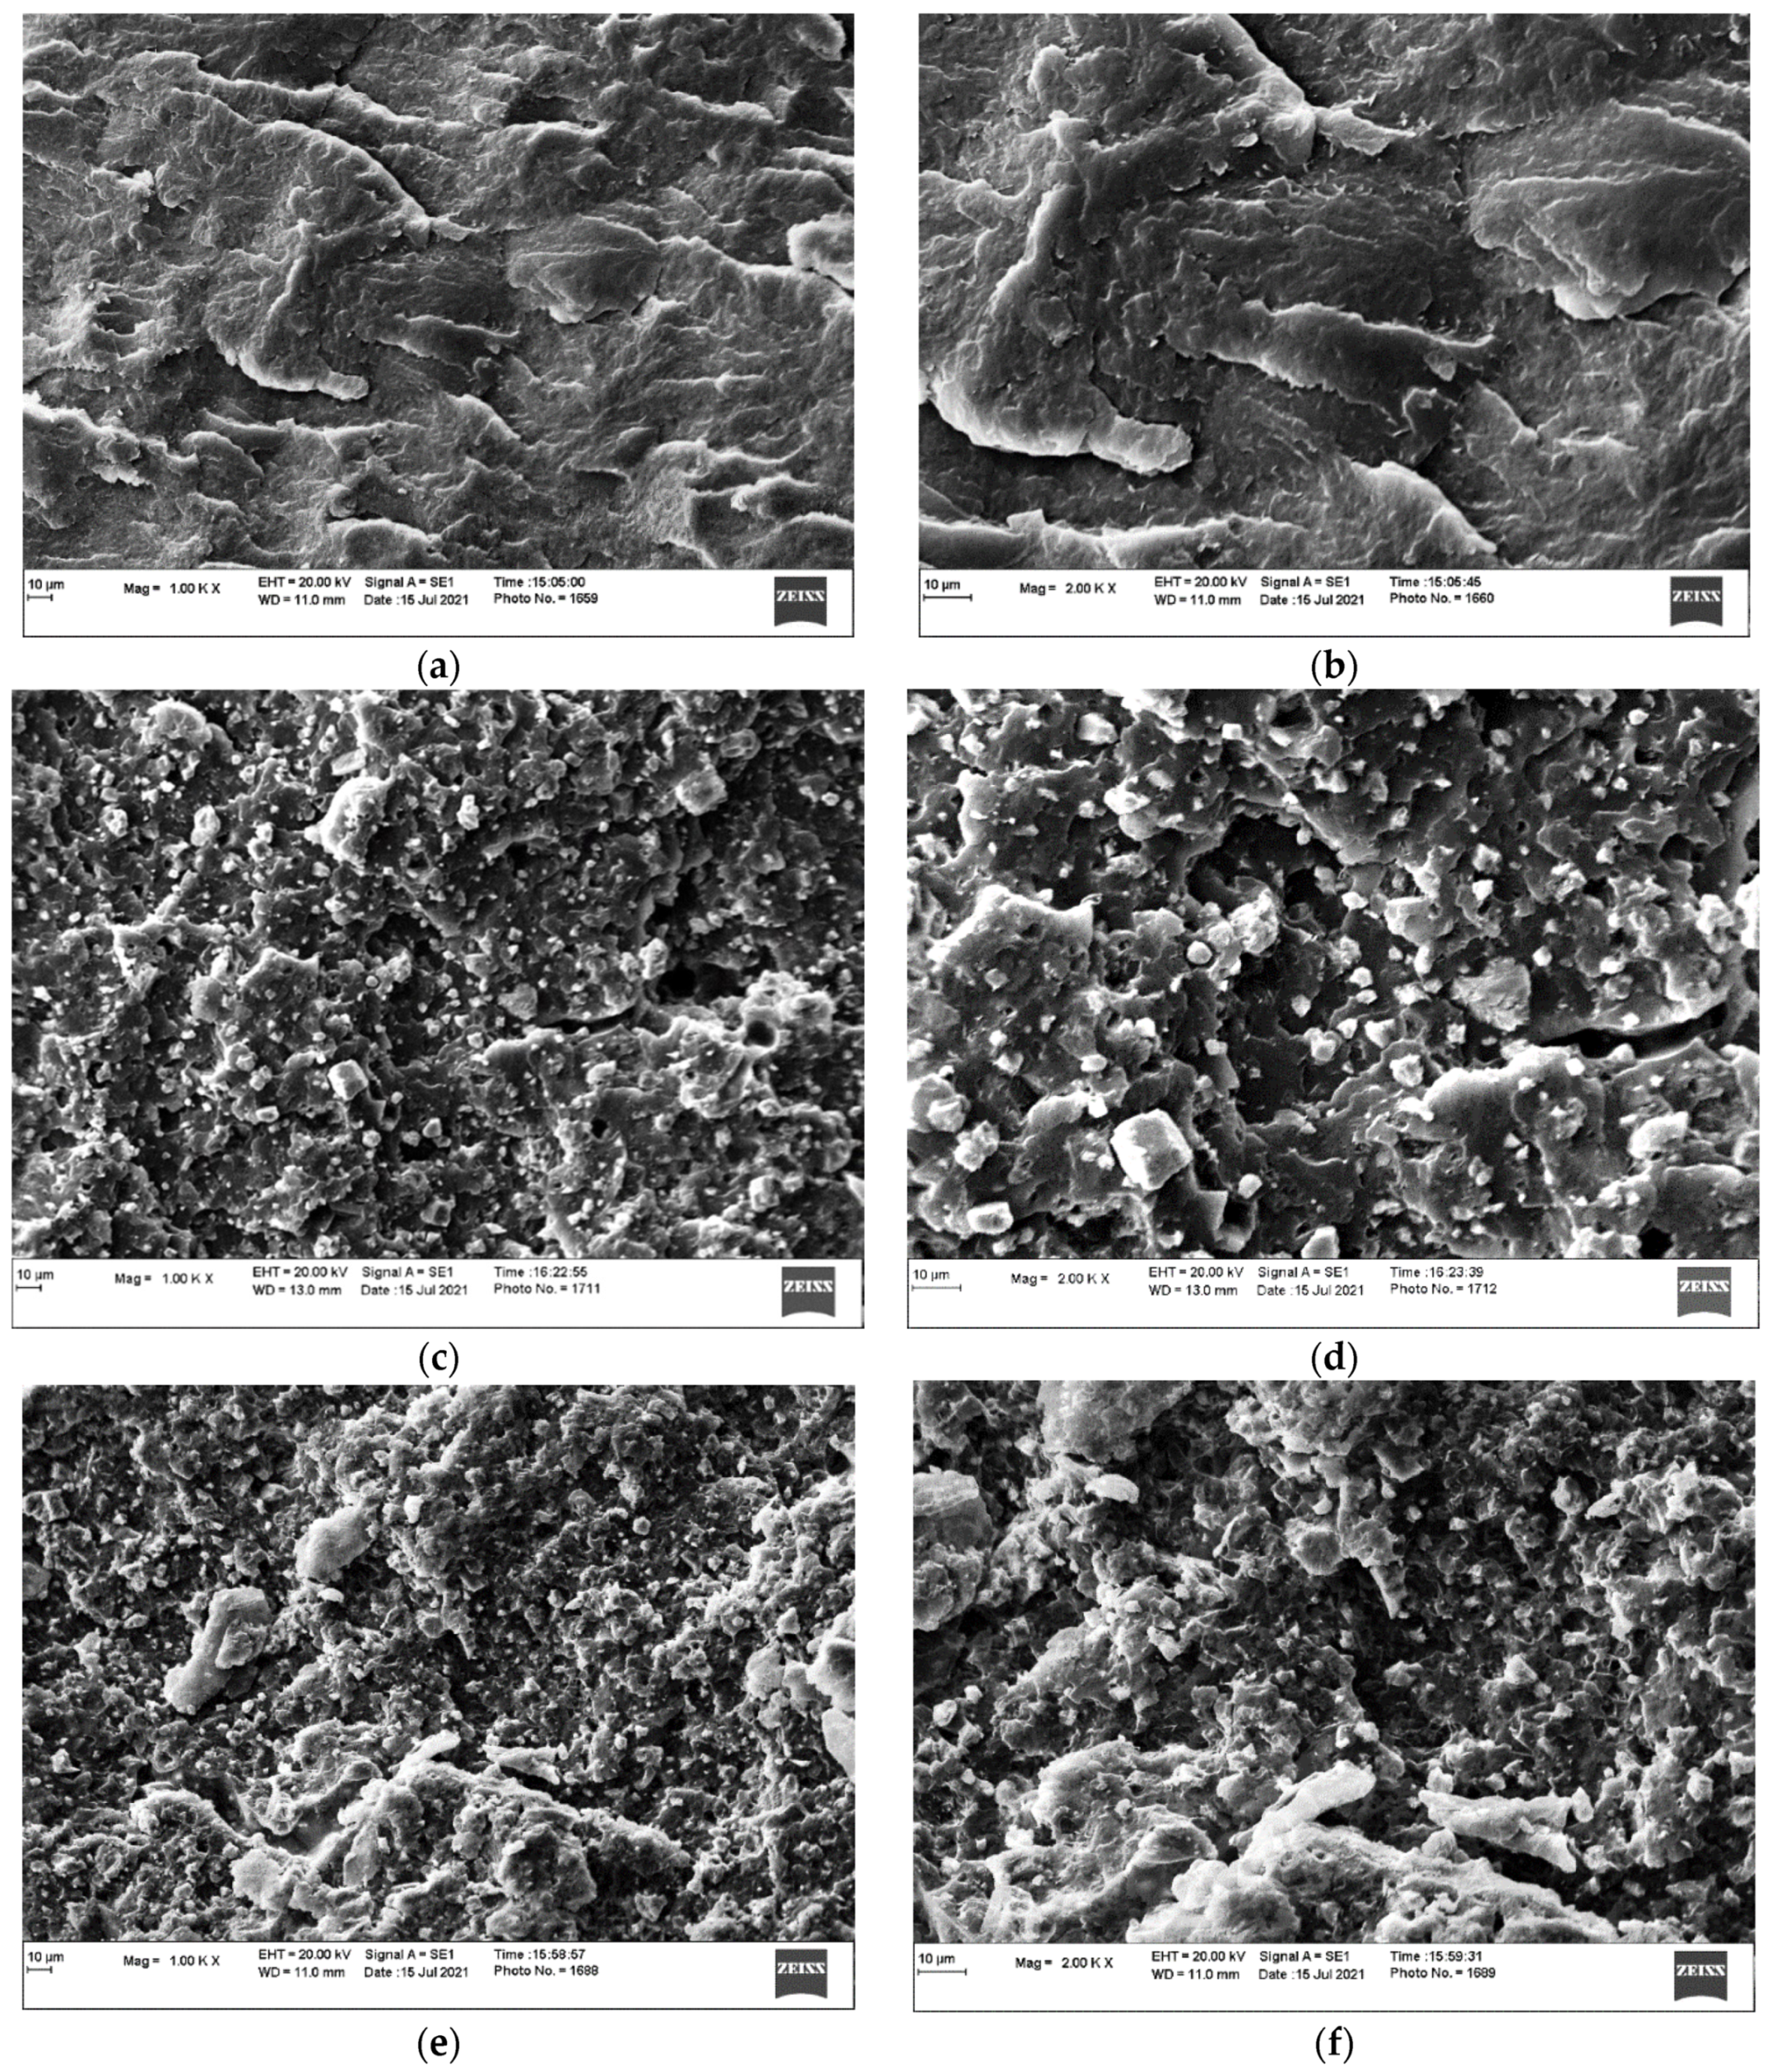
The different fracture surfaces can be demonstrated by the SEM micrograph observations (
Figure 9) and much coarser fracture surfaces were observed for CaCO
3 filled HPP samples. Simultaneously, separation between the particles and HPP can be easily identified (
Figure 9) and this can verify that the work used to separate CaCO
3 particle from HPP is lower than that to fracture HPP. In this case, the work used to create the new surface area of A
filler’ can compensate the work needed to create fracture polymer surface area of (A
total − A
filler) and comparable impact strength can be achieved using CaCO
3 fillers when compared with pure HPP (
Figure 6 and
Table 1). The phenomena of maintaining the notched Izod impact strength of HPP using up to 40 wt.% CaCO
3 particles are explained. At the 50 wt.% CaCO
3 particles loading level, a large portion of polymer was replaced by CaCO
3 particles and the work for creating polymer fracture surface area of (A
total − A
filler) cannot be made up by the work creating the new surface area of A
filler’. The surface area of (A
total − A
filler) is the polymer fracture surface area which has been replaced when 50 wt.% CACO
3 particles are included in the composite. Therefore, a lower Izod impact strength was observed at 50 wt.% loading level of CaCO
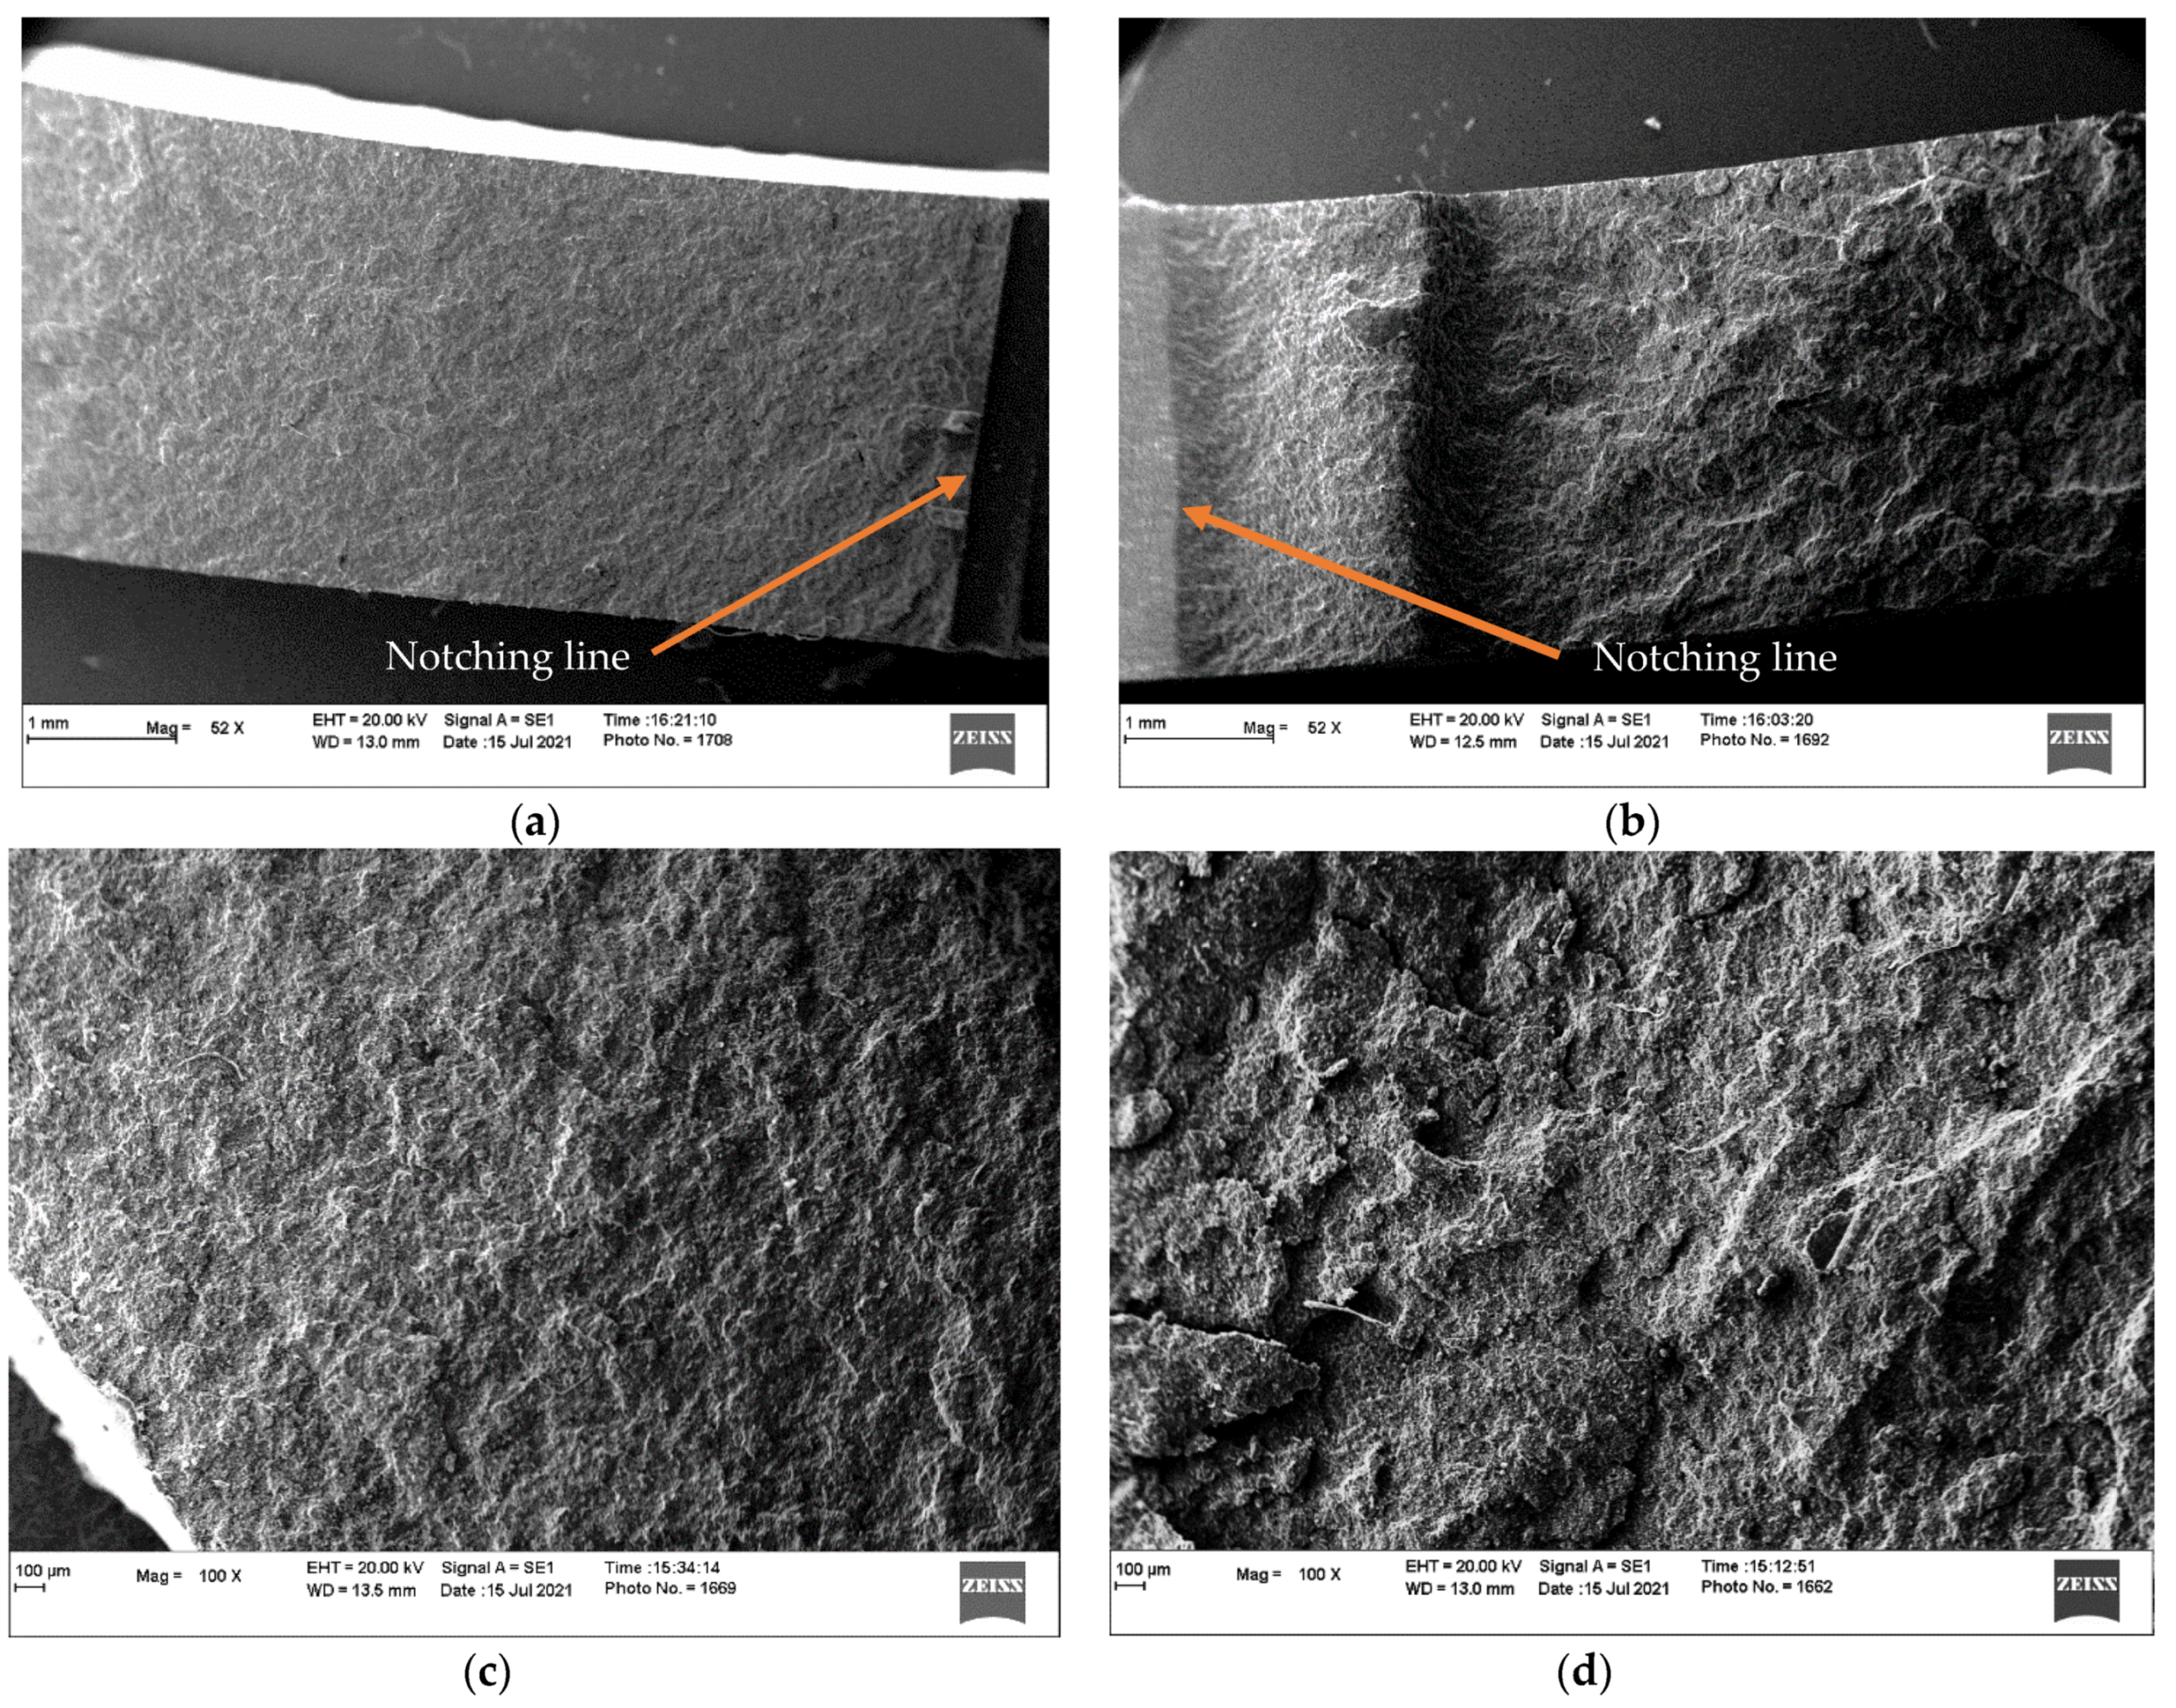
3 particles. For the same composite, unnotched impact strengths are much higher than notched impact strengths. The fracture surfaces of specimens after unnotched impact tests were observed to be much rougher than those after notched impact tests. The fracture surfaces of HPP filled with 30 and 50 wt.% CaCO
3 particles after the notched and unnotched impact tests are shown in
Figure 10. The relatively rougher surface indicated that more surface was created during the unnotched impact test, and more energy was required for the same surface properties for the same composites. The greater energy led to higher impact strength which was calculated by dividing the energy using the specimen cross-section area. This is one reason unnotched impact strength is much greater than notched impact strength.
For unnotched Izod impact test, inclusion of CaCO
3 particles significantly decreased the impact strength (
Table 1 and
Figure 6). The initial stresses the specimen encountered at the moment of contacting with impact hammer is shown in
Figure 7d and the fracture initiation started at the location contacting with the bottom sample holder. For composite with exposure of rigid particles on the surface, the fracture initiation point started at the interface between the rigid particle and the polymer phase due to a relatively weak bonding between the two incompatible surfaces (
Figure 8b). Under such circumstance, fracture initiated without yielding of polymer phase, resulting in a lower fracture initiation energy than that of pure polymer specimen. The fracture initiation energy needed for the system is another reason the unnotched impact strength is much greater than notched impact strength. Once the fracture has been initiated, propagation continued under the external impact load toward the notching tip of the specimen (
Figure 7e). Fracture propagation in CaCO
3 particles filled HPP behaved the same as that in notched impact test and created relatively larger fracture surface area. However, the fracture initiation in unnotched impact test probably required a much higher magnitude of energy than that in fracture propagation and dominated the fracture process. Therefore, the unnotched impact strength of CaCO
3 particles filled HPP is much lower than that of pure HPP.
During the fracture propagation, less amount of polymer was fractured in the fracture propagation path for a composite with a higher loading level of CaCO3 particles and a lower impact strength was obtained. Simultaneously, a composite with a higher CaCO3 particle loading level has more exposed particles on the surface and less amount of polymer to be fractured in the fracture initiation phase, resulting in a lower impact strength.


