Article

Removal of Pb(II) Ions from Aqueous Solution Using Modified Starch

by
O. H. P. Gunawardene
1,
C. A. Gunathilake
1,*,
A. P. S. M. Amaraweera
2,
N. M. L. Fernando
2,
A. Manipura
1,
W. A. Manamperi
3,
K. M. A. K. Kulatunga
2,
S. M. Rajapaksha
4,
A. Gamage
1,
R. S. Dassanayake
5,*,
B. G. N. D. Weerasekara
6,
P. N. K. Fernando
7,
C. A. N. Fernando
6 and
J. A. S. C. Jayasinghe
8
1
Department of Chemical and Process Engineering, Faculty of Engineering, University of Peradeniya, Peradeniya 20400, Sri Lanka
2
Department of Manufacturing and Industrial Engineering, Faculty of Engineering, University of Peradeniya, Peradeniya 20400, Sri Lanka
3
Materials Engineering Department, California Polytechnic State University, San Luis Obispo, CA 93407, USA
4
Department of Materials and Mechanical Technology, Faculty of Technology, University of Sri Jayewardenepura, Nugegoda 10250, Sri Lanka
5
Department of Biosystems Technology, Faculty of Technology, University of Sri Jayewardenepura, Gangodawila, Nugegoda 10100, Sri Lanka
6
Department of Nano Science Technology, Faculty of Technology, Wayamba University of Sri Lanka, Kuliyapitiya 60200, Sri Lanka
7
Department of Chemistry, Faculty of Graduate Studies, University of Kelaniya, Kelaniya 11300, Sri Lanka
8
Department of Civil Engineering, Faculty of Engineering, University of Peradeniya, Peradeniya 20400, Sri Lanka
*
Authors to whom correspondence should be addressed.
J. Compos. Sci. 2021, 5(2), 46; https://doi.org/10.3390/jcs5020046
Submission received: 1 December 2020 / Revised: 25 December 2020 / Accepted: 29 December 2020 / Published: 3 February 2021

Abstract

:
In this study, two types of modified cassava starch samples (MCS and MWS) prepared from commercially available native cassava starch (NCS) and native cassava starch extracted using the wet method (NWS) were investigated for the removal of Pb(II) ions from aqueous solutions. MCS and MWS samples were synthesized under acidic conditions using Pluronic 123 as the structure-directing agent and tetraethylorthosilicate (TEOS) as the chemical modifying agent. Modified starch samples were characterized using Fourier transform infrared (FTIR) spectroscopy, thermogravimetric analysis (TGA), X-ray Diffraction (XRD), and a nitrogen (N2) gas adsorption–desorption analyser. MCS and MWS showed enhanced thermal stabilities upon acid hydrolysis and chemical modification. The effects of contact time and initial Pb(II) concentration were studied through batch adsorption experiments. Adsorption kinetics followed the pseudo-second-order kinetic model. The equilibrium adsorption data were analysed and compared by the Langmuir and Freundlich adsorption models. The coefficient correlation (R2) was employed as a measure of the fit. The Langmuir model fitted well with equilibrium adsorption data, giving a maximum Pb(II) adsorption capacity of 370.37 and 294.12 mg/g for MWS and MCS, respectively. Modified samples exhibited a higher desorption efficiency of over 97%. This study demonstrated that modified starch could be utilized for Pb(II) removal from industrial wastewater.

1. Introduction

With the rapid industrialization and urban development across the globe, excessive release of heavy metals into the environment has significantly affected soil, plants, aquatic life, animals, and humans [1,2,3,4]. High toxicity, carcinogenicity, and non-biodegradability of heavy metals make them extremely hazardous [5,6,7,8]. The primary anthropogenic sources of heavy metals include metallurgy, electropolishing industries, tannery, smelting, surface treatment industries, electroplating, painting, mining, composite and battery production, agricultural waste, industrial effluents, and domestic sewage [3,7,9,10,11,12,13,14]. Heavy metals can also be added into the environment through natural processes, including weathering, erosion, and volcanic actions [3,4,7,9,12].
The most commonly known heavy metal ions include Cr(III), Pb(II), Hg(II), As(III), Cd(II), Hg(II), and Tl(I) [15]. Once released into the environment, heavy metals affect ecological life through bioaccumulation and biomagnification [3,16]. Heavy metal toxicity can be either acute or chronic [7]. Long-term exposure to heavy metals can contribute to severe health concerns such as renal tubular damage, hyperkeratosis, anxiety, depression, restriction in growth, skin lesions, hypocalcaemia in fish, necrosis, irritation, damage to the nervous and cardiovascular systems, kidney diseases, and disturbances in hematologic reproductive-metabolic and -endocrine systems. Moreover, chronic long-term exposure to heavy metals can lead to cancer or even death [17,18,19,20,21,22].
Among those heavy metals, lead (Pb) is considered one of the most potent heavy metals. Pb is a bluish-grey naturally occurring metal present in trace amounts in the earth’s crust [23]. It has many applications ranging from household and agricultural to industrial applications [3,9,10,11,12]. Pb is commonly utilized in batteries, ammunition, paints, X-ray shielding devices, gasoline, chemicals, plumbing, and pipelines [23,24]. Even though Pb has many uses, exposure to Pb, also known as “Pb poisoning,” gives rise to various health issues. Pb poisoning can mainly occur via injection of Pb-contaminated food and water and inhalation of Pb-contaminated particles or aerosols. Pb poisoning may cause adverse health effects on the brain, kidney, digestive systems, central nerve system, blood circulation system, and may subsequently lead to cancer [23,25,26,27]. Over recent decades, the use of Pb has decreased significantly due to the elimination of Pb in gasoline and the reduction in Pb levels in various applications including plumbing, pipelines, and paints [25,26]. However, the groundwater contamination of Pb(II) ions is still on the rise. Therefore, the removal of Pb(II) from wastewater has been of significant importance.
Several treatment technologies including chemical precipitation, ion-exchange, membrane filtration, electrochemical treatment technologies, advanced oxidation processes, biological treatment methods, coagulation, chemical and physical adsorption, floatation, solvent extraction, reverse osmosis, and film process have been investigated for the removal of heavy metal ions [1,2,23,28,29,30]. However, most of these techniques are rarely used due to the complexity of their design and operation, labor intensity, and relatively high cost.
Interestingly, the adsorption techniques have gained increasing attention for the removal of heavy metal ions, including Pb(II) ions, due to their easy operation, high efficiency, cost-effectiveness, versatility, and recyclability [31]. Although activated carbon is considered one of the better adsorbents with a large surface area and outstanding adsorption property, its usage is limited by high cost, regeneration problems, and most importantly, not being environmentally friendly during its preparation [32]. Therefore, studies are currently underway to develop adsorbents using polysaccharides, including cellulose, chitin, chitosan, cyclodextrin, and starch, to remove heavy metal ions from wastewater [33].
Polysaccharide-based adsorbents possess distinct characteristics, including relative abundance, biodegradability, renewability, low cost, environmental benignity, and high sorption properties [2,28]. Being a polysaccharide, starch is considered one of the most propitious adsorbents due to its high reactivity upon the chemical modification and high surface/volume ratio in addition to the characteristics above [2,34]. Despite starch’s inherent superior properties, native starch cannot directly be used as an adsorbent [32]. Therefore, starch is first chemically modified by introducing various functionalities including hydroxyl, xanthate, carboxylate, acrylate, and amine phosphate groups before as an adsorbent [32]. The techniques including grafting, cross-linking, etherification, esterification, and dual modification have been widely employed for chemical modifications of starch [32].
Several studies have been previously investigated on the effective removal of Pb(II) ions using chemically modified starch. For instance, Awokoya and coworkers [35] reported a maximum Pb(II) adsorption capacity of 110.64 mg/g using succinylated starch. Kweon et al. [36] showed the effective removal of 48.27 mg/g of Pb(II) using oxidized starch. Guclu and coworkers [37] displayed a maximum removal of 112.96 mg/g of Pb(II) by starch graft polyacrylic acid. Xu et al. [38] studied Pb(II) ion removal by cross-linked amphoteric starch with an absorption capacity of 152.74 mg/g. Separate studies conducted by Guo et al. [39] with cross-linked phosphate carbonate starch, Soto et al. [40] with starch esters, and Koyla et al. [41] with hydroxyethyl starch-graft polyacrylamide exhibited the maximum Pb(II) removal capacity of 316.47, 25.16, and 103.6 mg/g, respectively. Iran and coworkers [42] achieved a maximum Pb(II) adsorption capacity of 430 mg/g with polyethylene-graft poly(acrylic acid)-co-starch/organic-montmorillonite hydrogel composite. Generally, the modified starch adsorbents remove Pb(II) ions via chelation and ionic interactions.
In this study, we report the removal of Pb(II) ions from an aqueous solution using two types of modified starch samples prepared from commercially available cassava starch and native cassava starch extracted in the lab. To the best of our knowledge, this is the first attempt to modify starch with improved surface properties using Pluronic P123 and tetraethylorthosilicate (TEOS) as a structure-directing agent and a chemical modifying agent. Moreover, the synthesis process is simple, environmentally benign, low cost, and less labor intensive.

2. Materials and Methods

2.1. Materials

Tetraethylorthosilicate (TEOS, 98%) were purchased from Gelest Inc., Morrisville, PA, USA. Triblock copolymer P123 (EO20PO70EO20) was purchased by BASF Corporation, Flortham Park, NJ, USA. Lead Nitrate (PbNO3, 99%), ethanol (C2H5OH, 99.8%), HCl solution (37%), and NaOH solution were purchased from Techno Pharmchem Haryana, India. All the reagents used were analytical reagent grade.
Standard Pb(II) solutions were prepared using PbNO3. The pH value of all Pb(NO3)2 solutions was adjusted to 4.4 to avoid the precipitation of Pb at higher pH (pH > 4.8) [16].
Two cassava starch types, (i) commercially available native cassava starch (food-grade) purchased from Vilaconic joint-stock company, Vietnam, and (ii) native cassava starch extracted using a wet method, were used for modification.

2.2. Extraction of Cassava Starch

The cassava starch extraction process was conducted according to the wet method described by Benesi et al. [43]. Initially, cassava roots were peeled, washed, and disintegrated into 1 cm cubes. After that, the cassava cubes were pulverized in a high-speed blender for 5 min. Then, the resulted pulp was suspended in ten times its volume of water and stirred for 5 min. Next, the pulp was filtered using a double-fold cotton cloth, and the filtrate was allowed to stand for 2 h for the starch granules to settle. The top liquid was then decanted and discarded. After that, water was added to the sediment, and the mixture was stirred again for 5 min. Finally, the extracted cassava starch was dried at 65 °C for 3 h. The moisture and fiber content of the cassava starch was determined using the Association of Official Analytical Chemists (AOAC) 920.36 (2000) and 962.09 (2005) standards [44,45]. The amylose content of native starch was determined by the blue value method described by Stawski [46]. The gelatinization temperature was measured using differential scanning calorimetry (DSC, 131-Evo, Setaram Instrumentation, Caluire, France). The samples were heated from 25 to 140 °C with the scan rate at 10 °C/min. The composition of the starch samples used for the chemical modification is depicted in Table 1. All the analyses were carried out in triplicate.

2.3. Preparation of Adsorbents

Modified starch was prepared under acidic conditions using Pluronic 123 (poly(ethylene oxide)20-poly(propylene oxide)70-poly(ethylene oxide)20[-(EO)20-(PO)70-(EO)20-]) as a structure-directing agent and TEOS as the chemical modifying agent according to a slightly modified method described elsewhere by Gunathilake et al. [47]. Initially, 1 g of cassava starch purchased from Vilaconic joint-stock company, Vietnam, was dissolved in 20 mL of 0.5 M HCl under vigorous stirring at 150 rpm while maintaining the temperature at 45 °C for 3 h. Simultaneously, 2 g of Pluronic 123 was dissolved in 125 mL of 0.5 M HCl under rapid stirring at room temperature for 3 h. After that, 4.43 cm3 of TEOS was dissolved in 50 mL of 0.5 M HCl under stirring at 150 rpm at room temperature for 2 h. Next, the acidic solution, which contains dissolved Pluronic 123, was heated up to 40 °C while stirring at 150 rpm. The TEOS solution was then added to the beaker with Pluronic 123. The mixture was left under rapid stirring at 40 °C for 3 h. Then, the starch solution was added to the TEOS/Pluronic 123 mixture. (Note that the starch solution was neutralized by adding 0.5 M NaOH before the addition). The final mixture was left under vigorous stirring for 6 h at 40 °C. Subsequently, the solution was hydrothermally treated in YAMATO DS 60 drier at 105 °C for 24 h until a powdered mixture was obtained. The powder was mixed with an HCl-ethanol solution for 12 h at 35 °C and subsequently filtered through 8 μm filter paper to remove the template. Finally, the power collected on the filter paper was dried at 80 °C for 2 h. A similar procedure was followed for modifying cassava starch extracted by the wet method. The native and modified starch samples were named during the experiments, as mentioned below.
  • NCS—Native commercially available starch;
  • NWS—Native starch extracted by the wet method;
  • MCS—Modified native commercially available starch;
  • MWS—Modified native starch extracted by the wet method.

2.4. Characterization of Samples

2.4.1. Nitrogen (N2) Adsorption Studies

All four samples (NCS, NWS, MCS, and MWS) were characterized by N2 adsorption and desorption measurements. The specific surface area and porosity of the starch particles were examined using the nitrogen gas adsorption–desorption analyzer. A Brunauer–Emmet–Teller (BET) model was used to calculate the specific surface area. The monolayer adsorption was evaluated using the linear form of the BET equation. The BET surface area (SBET), single-point pore volume (Vsp), the volume of fine pores (Vmi), and the total pore volume (Vt) were measured using the nitrogen adsorption analyzer. Nitrogen adsorption isotherms were measured at −196 °C on an ASAP 2010 volumetric analyzer (Micromeritics, Inc., Norcross, GA, USA). Prior to the adsorption measurements, all samples were outgassed under vacuum at 110 °C for 2 h [48].
The single-point pore volume (Vsp) was estimated from the amount N2 gas adsorbed at a relative pressure (p/p0) of ~0.98. The pore size distributions (PSD) were calculated using adsorption branches of nitrogen adsorption–desorption isotherms by the improved KJS method calibrated for cylindrical pores [49]. The BET surface areas (SBET) were calculated from the N2 adsorption isotherms in the relative pressure range of 0.05–0.2 using a cross-sectional area of 0.162 nm2 per nitrogen molecule.

2.4.2. Fourier Transforms Infrared Spectroscopy (FTIR)

FTIR spectra of modified cassava starch samples were obtained using a Nicolet iS10FTIR instrument (Thermo Scientific, Waltham, MA, USA). Samples were analyzed by transmission mode after preparing KBr pellets with FTIR grade KBr (99%). Spectra were collected in the wavenumber range of 500 to 4000 cm−1. For each sample, 4 scans were taken at a resolution of 4 cm−1.

2.4.3. Thermogravimetric Analysis (TGA)

Thermal degradation of modified cassava starch samples was evaluated using a TGA 5500 (TA instruments, New Castle, DE, USA) under the nitrogen atmosphere. Platinum crucibles were of 100 µL were used with a heating rate of 10 °C/min at 25 to 650 °C. Thermal degradation temperature was calculated using the TRIOS software (4.4.0 version, TA instruments, New Castle, DE, USA).

2.4.4. X-Ray Diffraction (XRD)

The X-ray diffraction patterns of the starch samples were obtained using a Bruker D8 Advanced Eco Powder X-ray Diffraction system. The XRD spectra were recorded over an angular range (2θ) of 5 to 45° with a continuous scanning at scan rate = 0.02°/min.

2.4.5. Atomic Absorption Spectrophotometer (AAS)

AAS (SHIMADZU, AA7000, Kyoto, Japan) was used to study the Pb adsorption kinetics, equilibrium, and desorption studies.

2.5. Adsorption Studies

2.5.1. Adsorption Kinetic Studies

Adsorption kinetic studies were performed using 50 mL of aqueous Pb(II) solutions with an initial concentration of 100 mg/L. The pH value of aqueous solutions was maintained at 4.4. In all experiments, 0.05 g of the adsorbent was used under similar experimental conditions with a stirring speed of 150 rpm at 22 °C. The experiments were triplicated for each adsorbent. An aliquot of 0.2 mL was taken at predetermined intervals before adding the adsorbent (t = 0) and after adding the adsorbent (t = 4–120 min). From 4 to 20 min, the samples were taken at 4 min intervals, while from 20 to 30 min, the samples were taken at 5 min intervals. From 30 to 120 min, the samples were taken at 10 min intervals. After filtration, the concentrations of heavy metal ions in the aqueous solutions were determined using atomic absorption spectroscopy (AAS). The adsorption capacity was calculated from the following Equation (1):
q t = C 0 C t V m
where q t (mg/g) is the adsorption capacity of the adsorbent, C 0 (mg/L) is the initial concentration of Pb(II) solution, C t   (mg/L) is the concentration of Pb(II) at a given time, V (L) is the volume of Pb(II) solution, and m (g) is the mass of the adsorbent.

2.5.2. Equilibrium Adsorption Kinetics

All adsorption experiments were conducted batch-wise. A series of Pb(II) solutions with different initial concentrations (50, 100, 150, 200, 250, 300 mg/L) were prepared to determine the equilibrium adsorption behaviour. The equilibrium kinetics were followed using the procedure mentioned before in a 50 mL of Pb(II) solution with 0.05 g of adsorbent under vigorous stirring at 150 rpm at 22 °C for 12 h. After the filtration, the concentrations of Pb(II) ions in the aqueous solutions were determined by AAS. All the experiments were triplicated.
The adsorbed heavy metal ions per unit mass of the solid adsorbent at equilibrium ( q e ) were determined according to the following Equation (2):
q e = C 0 C e V m
where q e qe(mg/g) is the equilibrium adsorption capacity of the adsorbent, C 0 (mg/L) is the initial concentration of Pb(II) solution, C e   (mg/L) is the equilibrium concentration of Pb(II), V (L) is the volume of Pb(II) solution, and m (g) is the mass of the adsorbent.

2.5.3. Desorption Experiments

Desorption studies were carried out in a batch system using Pb(II) ion loaded adsorbents immediately after the adsorption experiments. The regeneration experiments were carried out only for the two modified starch samples. A 0.05 g of adsorbent was mixed with 100 mL of 0.1 M HCl solution for 30 min at room temperature (RT). The desorption was followed in each cycle at every 10 min intervals. The concentration of Pb(II) after desorption was measured using AAS, as previously reported. The desorption efficiency (DE) was calculated according to the following Equation (3) [9]:
D E = C t V m 0 × 100 %
where DE (%) is the desorption efficiency, C t (mg/L) is the concentration of lead ions in the desorption solution at time t (min), V is the volume of the desorption solution, and m 0 (g) is the amount of Pb(II) adsorbed.

3. Results and Discussion

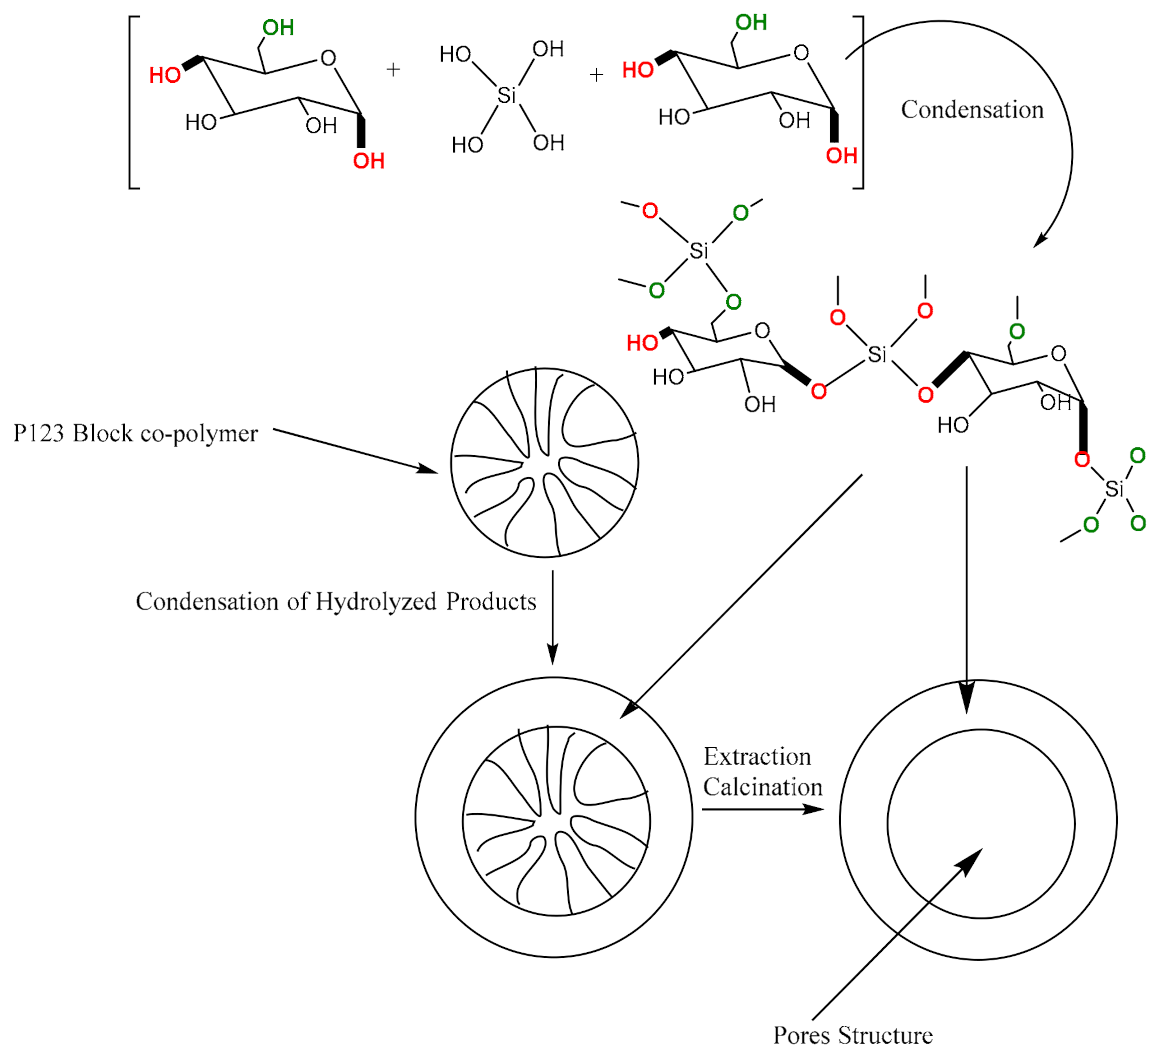
3.1. Synthesis of Modified Starch

Synthesis of the modified starch involves the hydrolysis and condensation steps, as shown in Scheme 1 and Scheme 2. The structure-directing agent, Pluronic 123, is a block-copolymer containing hydrophilic ethylene oxide (EO) and hydrophobic propylene oxide (PO) parts. During the synthesis, both starch and TEOS are hydrolyzed under acidic conditions; see Scheme 1. Due to the hydrophilic and hydrophobic nature of P123, it forms micelles. Hydrophilic part of the P123 and condensation product formed from the reaction between the hydrolyzed TEOS and starch have weak electrostatic interaction through hydrogen bonding. The micelles formed by P123 are subsequently removed with acidic ethanol to enhance porosity, as illustrated in Scheme 2.

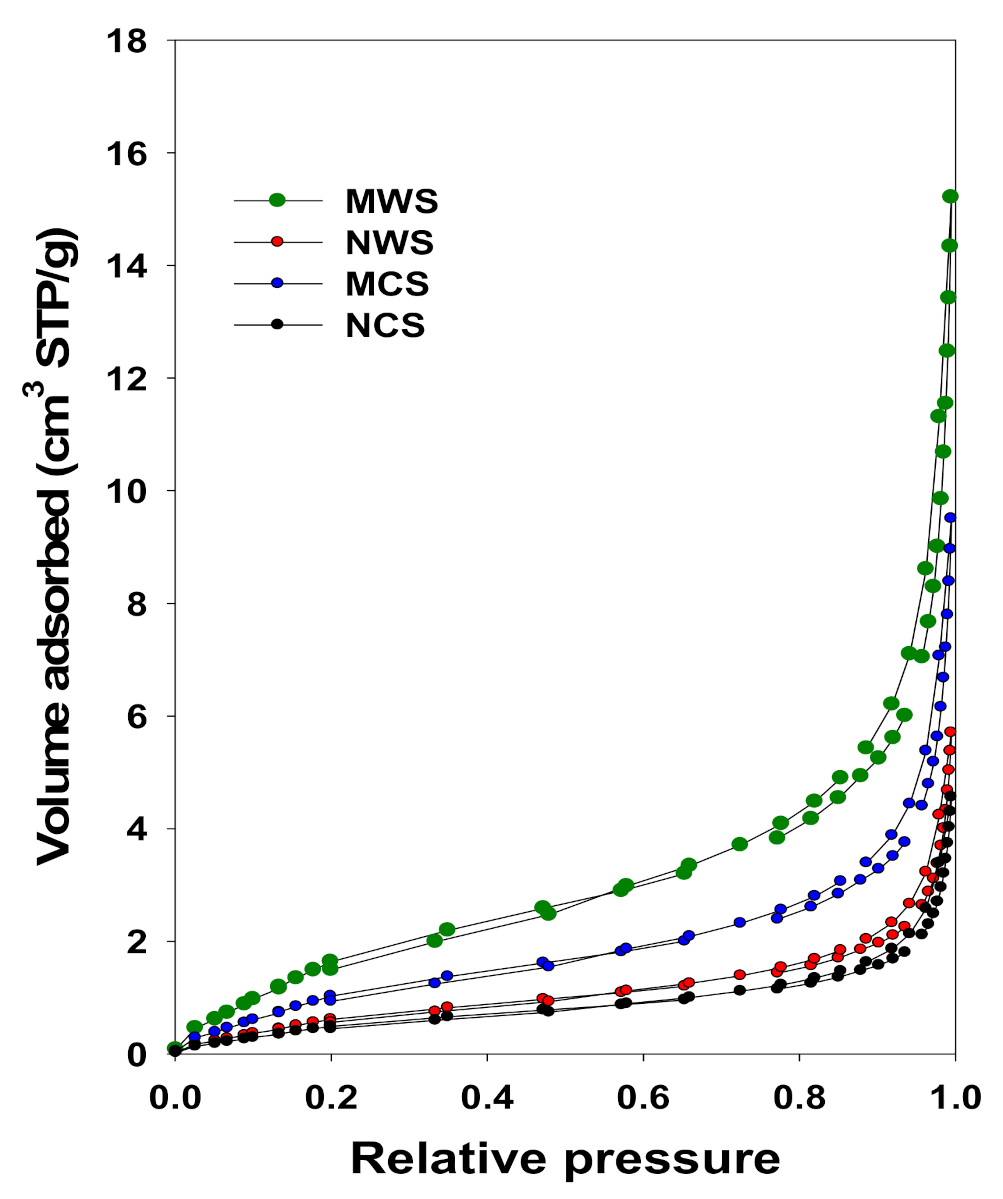
3.2. N2 Adsorption Studies

The N2 adsorption–desorption isotherms of two native (NCS and NWS) and two modified (MCS and MWS) starch samples are shown in Figure 1. All four samples follow a similar Type IV adsorption–desorption isotherm with a hysteresis loop. The hysteresis loop is a clear indication of the presence of mesoporous structures in both natives (NCS and NWS) and modified (MCS and MWS) starch samples. Moreover, all four samples exhibit a broad capillary condensation–evaporation step starting at a relative pressure of ~0.15–0.98. By comparing the respective isotherms obtained for the native and modified starch samples, the adsorption capacities follow the order of MWS > MCS > NWS > NCS. Our results suggest that the surface properties of the modified starch significantly enhanced after the chemical modification (see Table 2). For instance, the modified starch extracted by the wet method (MWS) sample shows the highest specific surface area and total pore volume of 5.8 (±0.1) m2/g and 0.022 (±0.001) cm3/g. Native commercially available starch (NCS) exhibits the least specific surface area and total pore volume of 1.7 (±0.1) m2/g and 0.007 (±0.001) cm3/g (see Table 2).
The structural parameters of the native and modified starch samples calculated based on the N2 adsorption–desorption data are depicted in Table 2.
Vsp—single point pore volume calculated at the relative pressure of 0.98; Vmi—volume of fine pores (micropores below 2 nm) calculated by integration of the PSD curve up to 2 nm; SBET—specific surface area calculated from adsorption data in relative pressure range 0.05–0.20; Vtot—total pore volume calculated by integrating PSD in the entire relative pressure range.

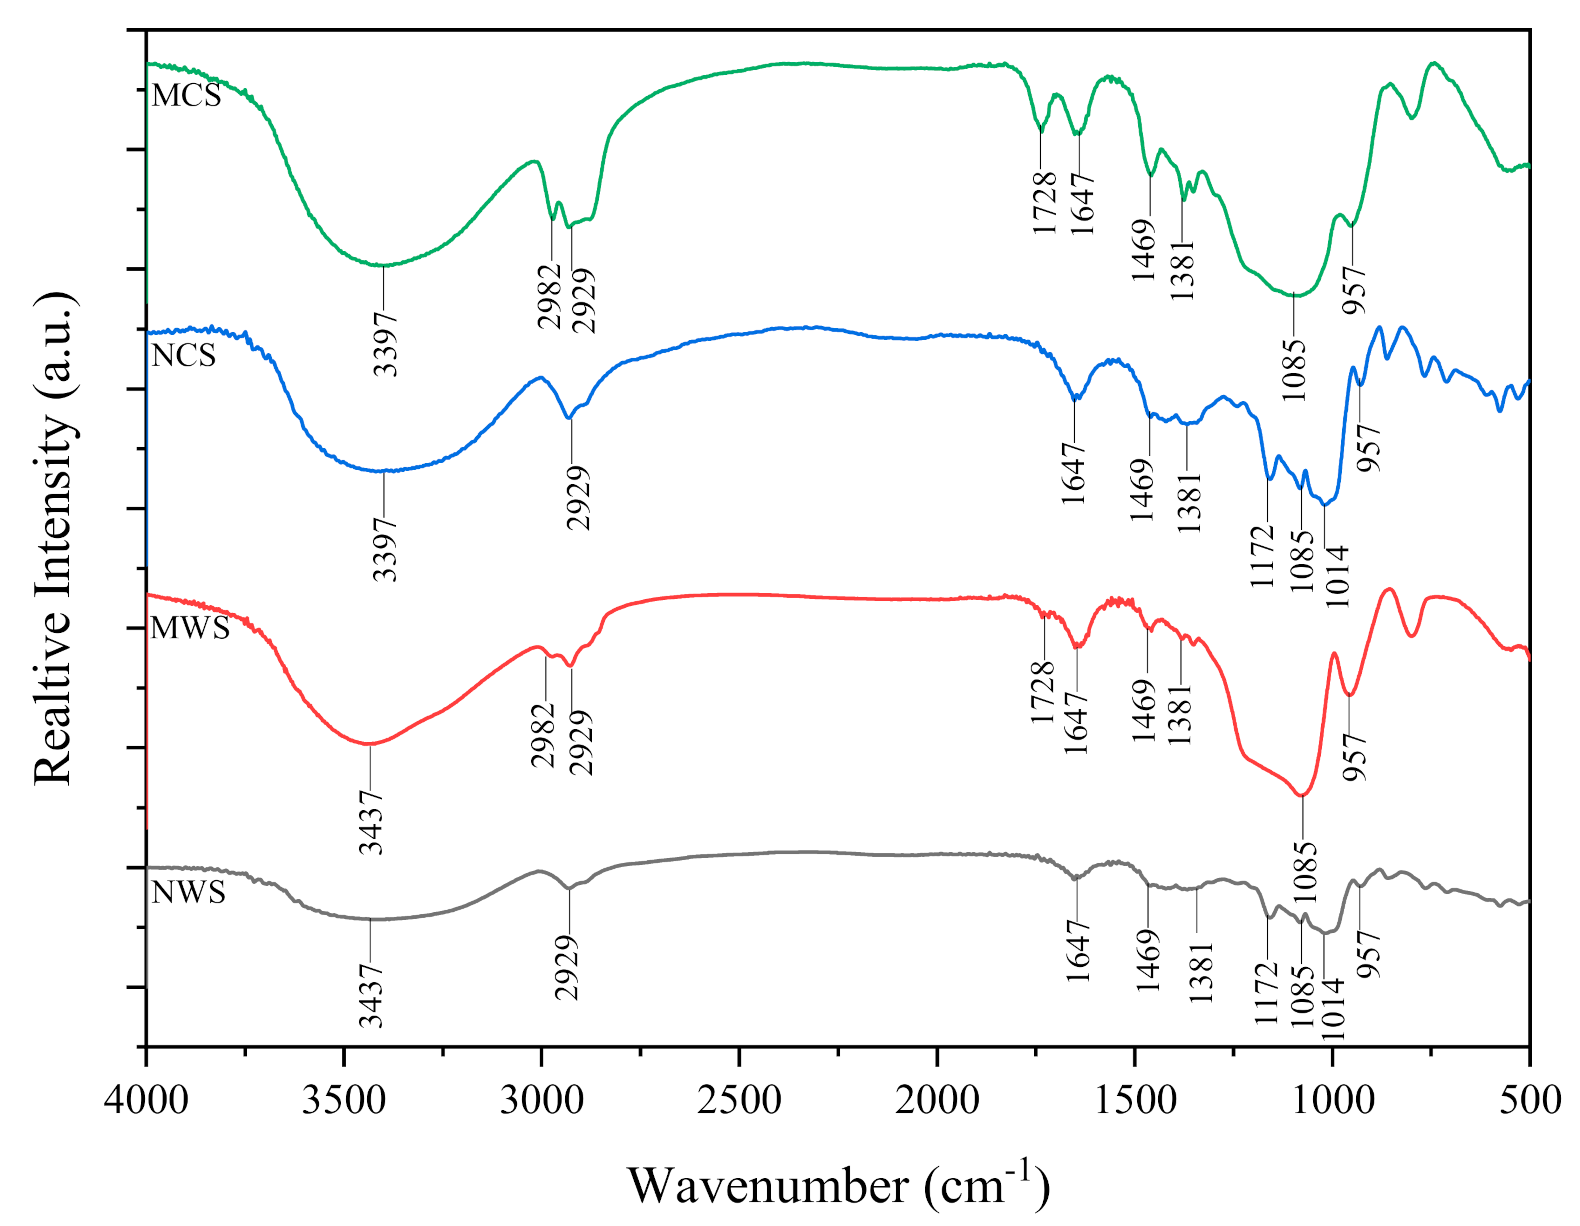
3.3. Fourier Transforms Infrared Spectroscopy (FTIR)

FTIR studies were conducted on all starch samples. Figure 2 shows the FTIR spectra of both native (NCS and NWS) and modified starch (MCS and MWS). All samples show broad O-H stretching bands at 3437–3397 cm−1 [50], and a band around 2929 cm−1 corresponds to the stretching vibration of the C–H bond from the glucose units; see Figure 2. Both MCS and MWS samples display a peak at 1728 cm−1 that is ascribed to the C=O group, suggesting the oxidation of alcohol to aldehyde during the hydrolysis process.
The absorbance band at 1647 cm−1 that appeared in all samples is attributed to the bending vibration of O-H of absorbed water. The peaks at 1469 and 1381 cm−1 are for CH2 symmetric scissoring and C -H symmetric bending vibrations. Two bands at 1172 and 1104 cm−1 correspond to the C-O-C asymmetric stretching and C–O stretching vibrations, respectively [51]. The peak at 957 cm−1 is assigned to the skeletal mode vibration of α-(1–4) glycosidic linkage. Both MCS and MWS samples exhibit a sharp 957 cm−1 peak due to the hydrolysis of glycosidic linkages. Moreover, both MCS and MWS samples do not show the IR bands at 1172 and 1014 cm−1 due to the breakdown of α,1-4 and α, 1-6 glycosidic bonds upon acid hydrolysis [52].

3.4. Thermogravimetric Analysis (TGA)

Thermal stability of all four starch samples (NCS, NWS, MCS, and MWS) were investigated in flowing nitrogen using high-resolution thermogravimetry. Figure 3 exhibits the thermogravimetric (TG) and corresponding differential thermogravimetric (DTG) profiles of all starch samples. The TG profiles of NWS and NCS samples (see Figure 3a,b) show two distinct weight loss regions in the temperature ranges of 25–100 °C and 250–580 °C. The former event represents a weight loss of ~12% (w/w) corresponding to the evaporation of physically adsorbed water. The latter event is attributed to the thermal decomposition of starch with a weight loss of ∼63% (w/w). The DTG profiles of the NWS and NCS display the thermal degradation temperature of starch at 330 °C. The TG and DTG profiles of MWS and MCS samples are shown in Figure 3c,d. Both MWS and MCS samples exhibit three weight loss regions at 25–130, 130–220, and 250–580 °C, respectively. The first thermal event refers to the evaporation of physically absorbed water. The second and third events are ascribed to the thermal decomposition of the residual triblock copolymer template and starch, respectively. The residual triblock copolymer template decomposed at 167 °C for both MWS and MCS samples. However, the thermal decomposition of the starch in the modified samples occurred at 357 and 378 °C for MWS and MCS, respectively. Both MWS and MCS samples show an increase in their thermal stability after the hydrolysis and chemical modification. One of the two major reasons for the enhanced thermal stabilities of MWS and MCS is the increased crystallinity, as the acid hydrolysis mainly occurs in the amorphous regions of the starch. The other reason is the incorporation of silica into the polymer structure, which provides more rigidity.

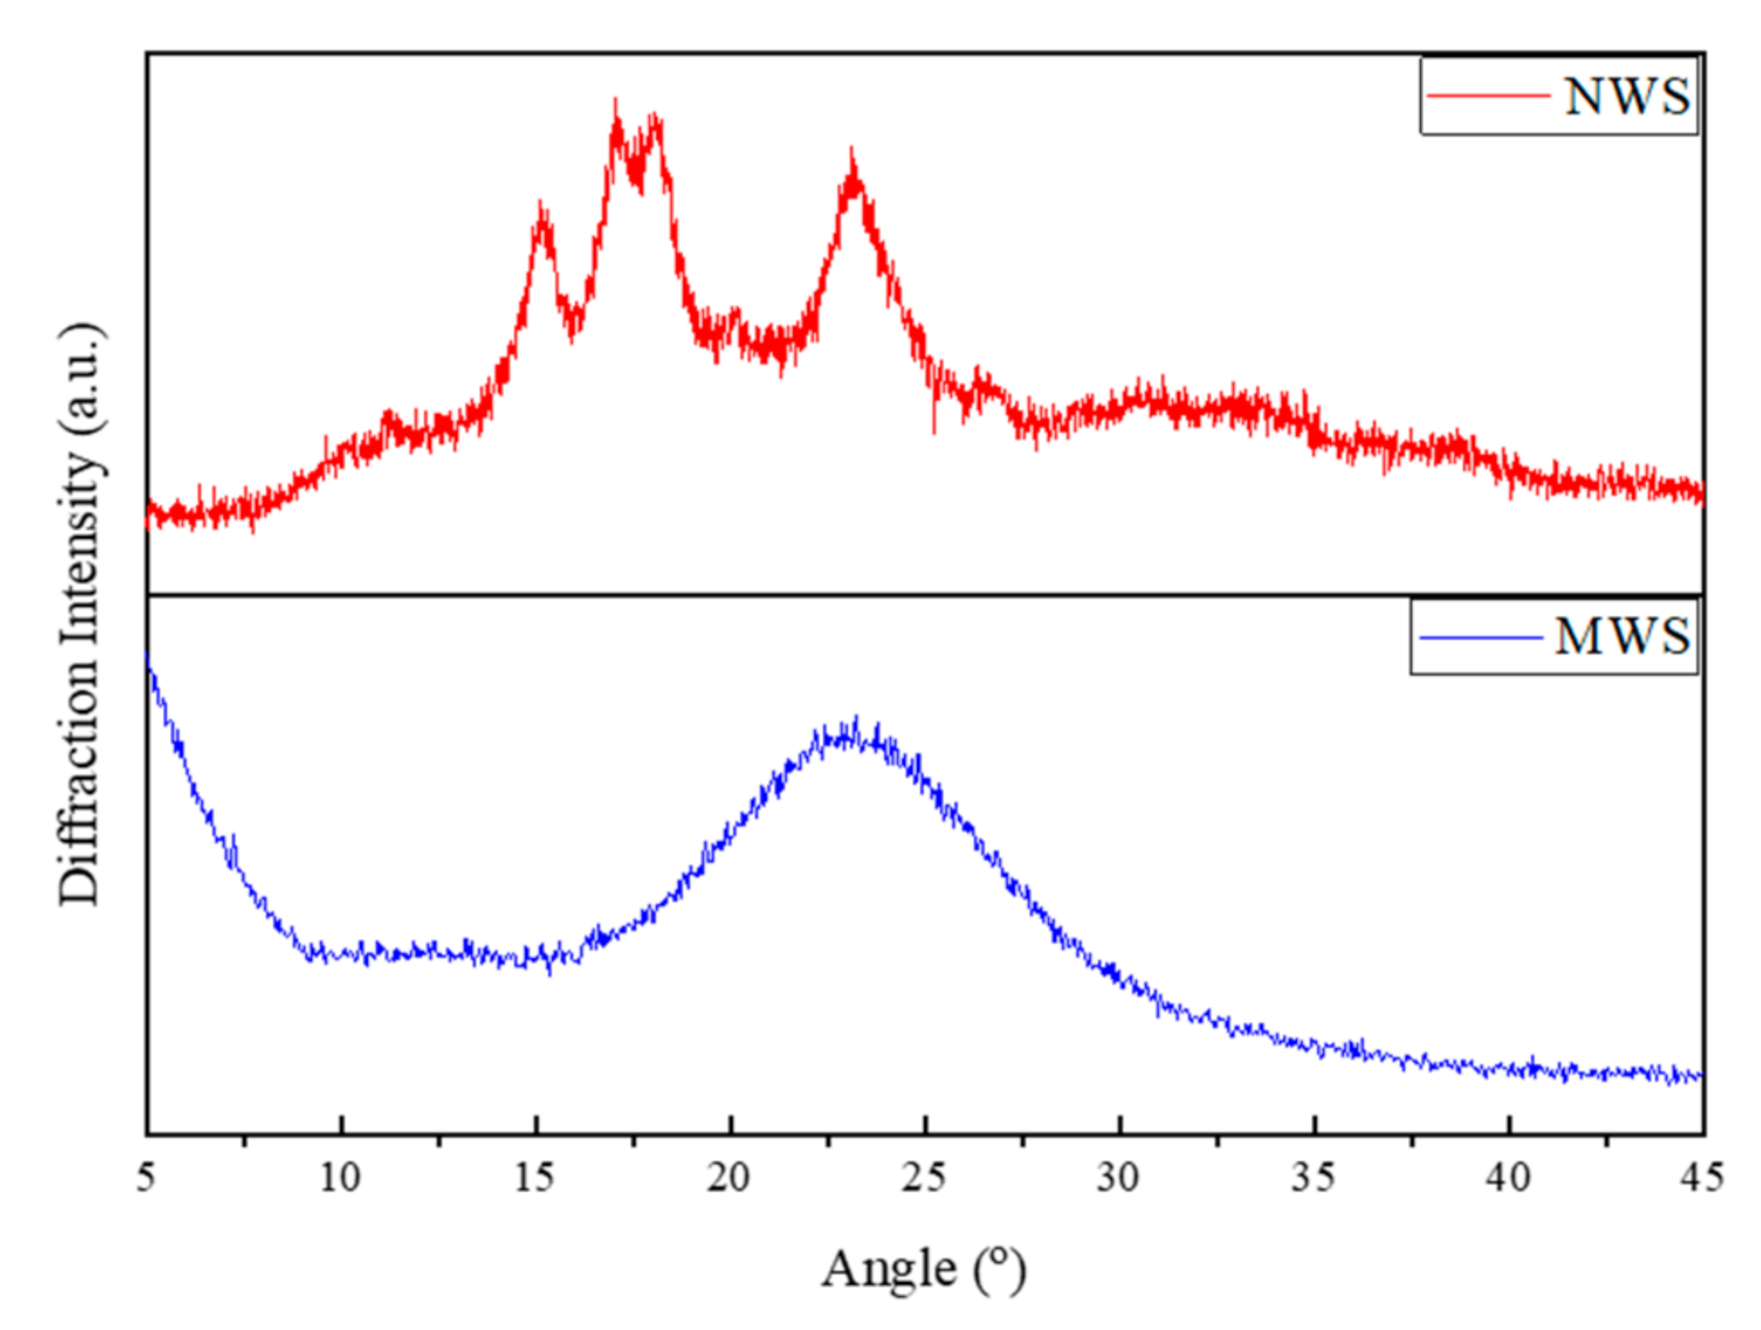
3.5. X-Ray Diffraction (XRD) Analysis

Figure 4 shows the XRD profiles obtained for NWS and MWS samples. NWS exhibits five prominent peaks at 15.01, 17.03, 18.04, 20.06, and 23.19°. This is in agreement with the XRD patterns reported for starch [53]. However, MWS displays only a broad peak at 22°, indicating the lower crystallinity. The amorphous nature of the MWS is attributed to the chemical modification of starch and the development of the porous structure. Similar XRD patterns were also observed for NCS and MCS (data not shown).

3.6. Adsorption and Kinetic Studies

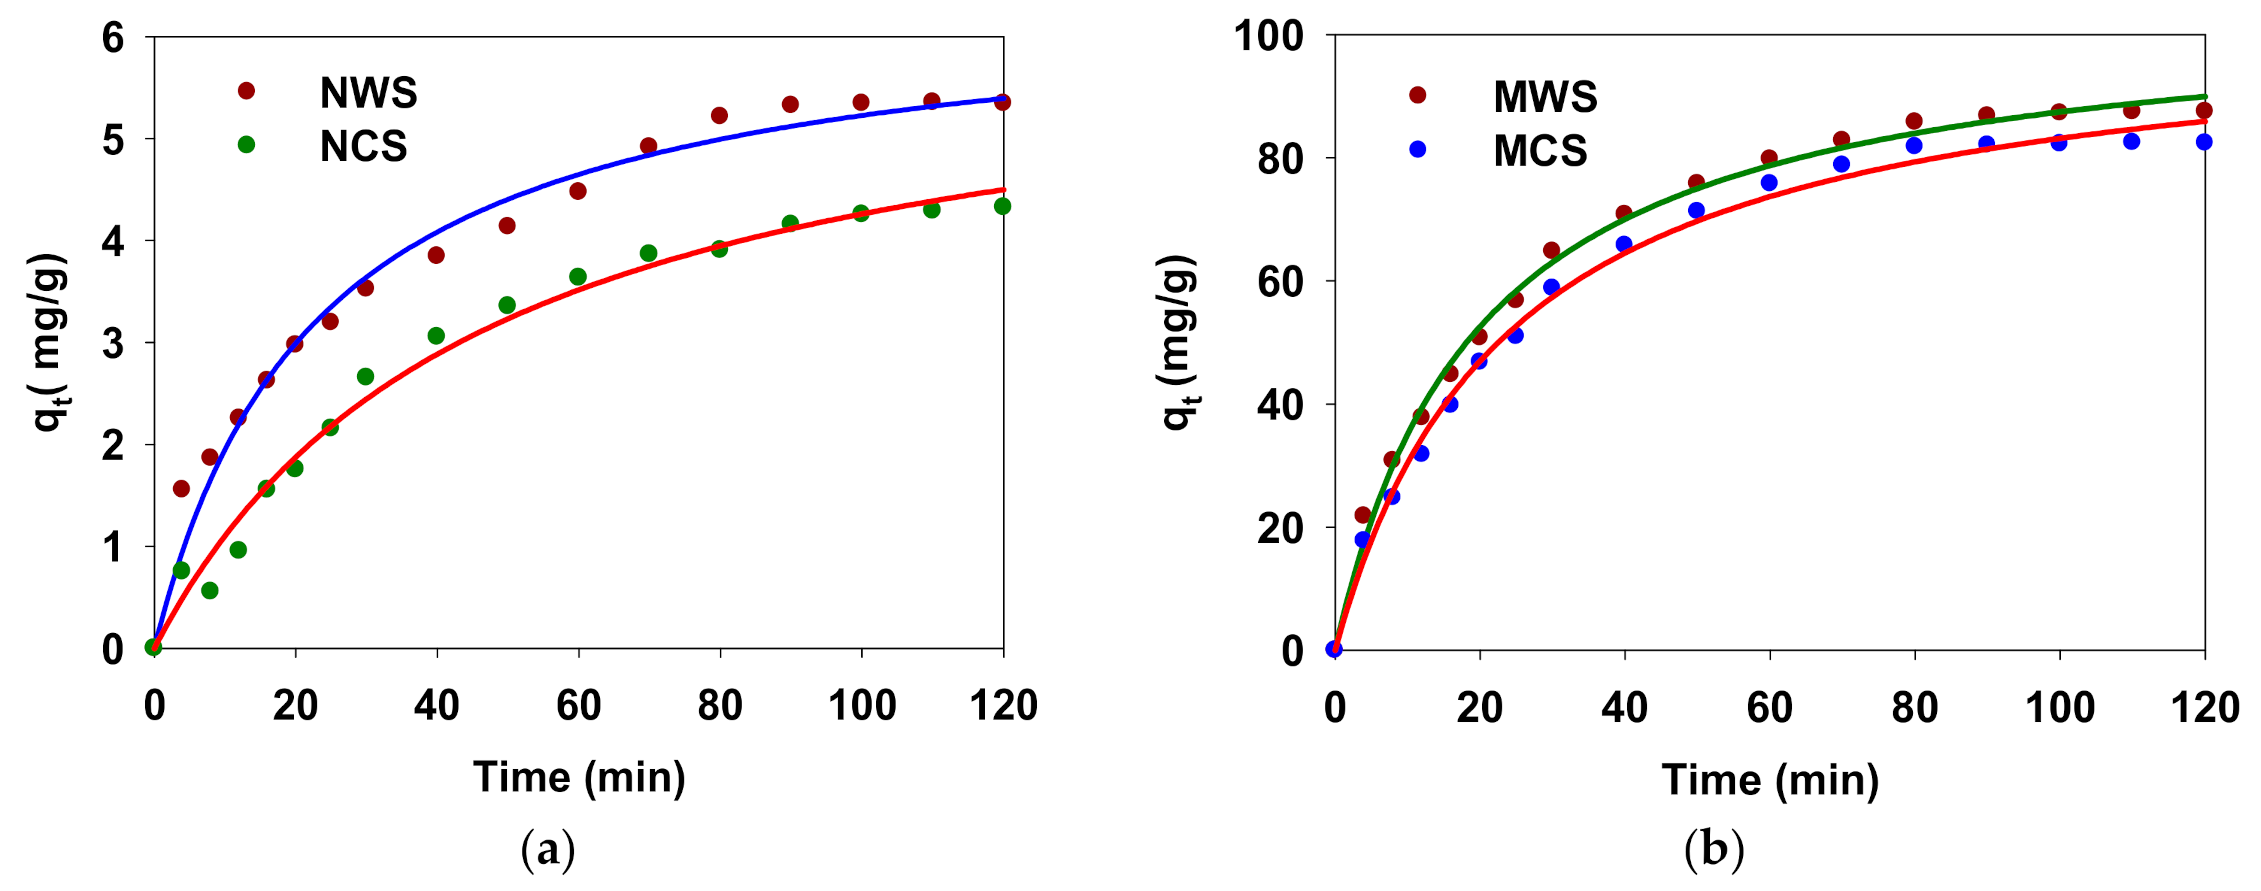
3.6.1. The Effect of Contact Time on Adsorption Capacity

Figure 5a,b show the effect of contact time on Pb(II) adsorption capacity onto the native (NWS and NCS) and modified (MWS and MCS) starch samples, respectively. As it can be seen, Pb(II) adsorption rate initially increased rapidly during the first 30 min, and the maximum adsorption capacity was reached within 2 h for all starch samples; see Figure 5a,b. Therefore, the Pb(II) uptake occurred in two steps. The initial rapid adsorption of Pb(II) is due to the availability of a large number of sites, and the subsequent slow adsorption process is attributed to the unavailability of sites that decreases over time. The NCS and NWS show relatively small adsorption capacities (qt) of 4.32 and 5.34 mg/g, respectively. Interestingly, the adsorption capacities for modified starch samples, MCS and MWS, are ~16 and 19-fold greater as compared to the unmodified (NCS and NWS) samples. The adsorption capacities of MCS and MWS are 82.35 and 87.48 mg/g, respectively.
In order to study the adsorption kinetics of Pb(II) ions, the kinetic parameters were investigated using Lagergren’s first-order kinetics model and Ho’s pseudo-second-order kinetic model.

3.6.2. Pseudo-First Order Kinetic Model

The pseudo-first-order kinetics of the adsorption of Pb(II) onto starch was followed using the Lagergren first-order kinetic model; see Equation (4) [34].
The first-order adsorption kinetic model is given below:
d q t d t =   k 1 q e q t
Lagergren’s pseudo-first-order model can be expressed as in Equation (5) by plotting the linear form of Equation (5),
log q e   q t   =   l o g q e k 1 t 2.303
where k 1 (min−1) is the equilibrium rate constant of pseudo-first-order adsorption, q e (mg·g−1) is the amount of Pb(II) ions adsorbed at equilibrium, q t (mg·g−1) is the amount of Pb(II) ions adsorbed at time t (min).
The data were fitted to the Lagergren pseudo-first-order model; see Equation (5). Figure S1 (Supporting Information) shows the plots of the linearized form of pseudo-first-order model (log q e   q t vs. t) for the adsorption of Pb(II) ions onto NWS, NCS, MWS, and MCS samples. The first-order rate constants of MCS and MWS samples are higher than their respective native starch samples, NCS and NWS.
The applicability of Lagergen’s pseudo-first-order model was determined by calculating the correlation coefficient, R2. Table 3 summarizes the pseudo-first-order rate constants and the correlation coefficients (R2) of first-order kinetic plots. Generally, the linearity of the plots indicates the applicability of the kinetic model of interest. As shown in Table 3, R2 was found to be in the range of 0.92–0.98 for all first-order kinetic plots. Our results suggest that the adsorption process is not in good agreement with the pseudo-first-order kinetic model.

3.6.3. Pseudo-Second-Order Model

Ho’s pseudo-second-order model was employed to study the second-order adsorption kinetics.
The pseudo-second-order kinetic model is given by Equation (6):
d q t d t =   k 2 q e q t 2
In the linear form, as shown in Equation (7),
t q t =   1 k 2 q e 2 + t q e
where k 2 (g·mg−1 min−1) is the rate constant for the pseudo-second-order adsorption model, q e (mg·g−1) is the amount of Pb(II) ions adsorbed at equilibrium, q t (mg·g−1) is the amount of Pb(II) adsorbed at time t (min). The plot between t / q t and t was recorded to determine the rate constant for the pseudo-second-order adsorption model. The concentration adsorption rate h (mg·g−1·min−1) can be calculated according to Equation (8) [13].
h =   k 2 q e 2
The plots of the linearized form of pseudo-second-order model (t/qt vs. t) are depicted in Figure S2a,b, Supporting Information. Table 4 summarizes the kinetic parameters calculated from the pseudo-second-order model and the correlation coefficients (R2) for all plots. Data fitted well to the pseudo-second-order model with the correlation coefficients over 0.98 (R2 ≥ 0.98); see Table 4. The linearity of these plots indicates the applicability of this model. Therefore, our data suggest that the adsorption process occurs via a chemisorption mechanism. As can be seen from Table 4, the MWS sample shows the maximum concentration adsorption rate (h) of 5.52 mg·g−1·min−1.

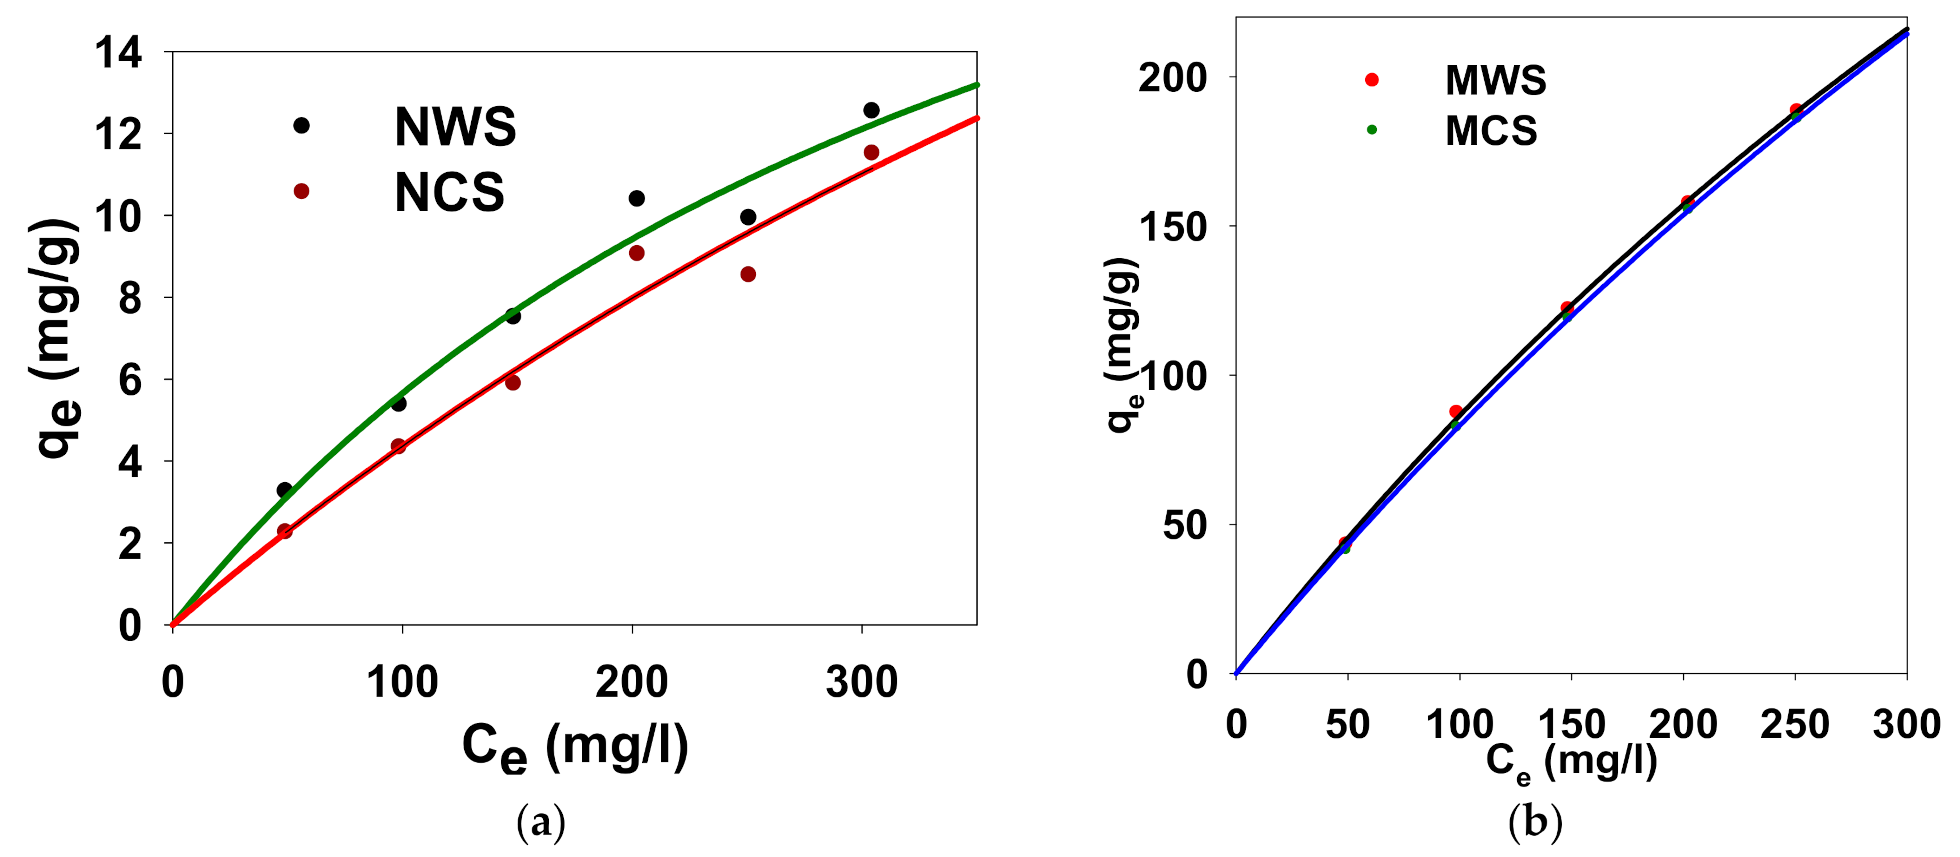
3.7. Effect of Initial Concentration on Adsorption Capacity

The effect of initial Pb(II) concentration on the adsorption capacity was conducted with varying initial concentrations of Pb(II) (50, 100, 150, 200, 250, 300 mg/L) and a fixed adsorbent dose of 1 g/L. Figure 6a,b show the plots of adsorption capacity against the initial Pb(II) concentration for NCS, NWS, MCS, and MWS samples. As can be seen from Figure 5a,b, the amount adsorbed increased with increasing Pb(II) ion concentration, indicating the availability of actives sites on the adsorbate. This also suggests that the adsorption process is highly concentration dependent. The amount of Pb(II) ions adsorbed by NCS and NWS samples is significantly lower as compared to their respective MCS and MWS samples. MCS and MWS samples show a maximum absorption capacity of 216.54 and 218.74 mg/g, respectively. Our results reveal that the starch modification immensely contributed to the higher adsorption capacities.

3.8. Adsorption Isotherms

The equilibrium adsorption isotherms are commonly considered to understand the mechanism of the adsorption. The most widely used Langmuir and Freundlich isotherms were employed to study the equilibrium of the adsorption system. The adsorption isotherms were constructed at a fixed adsorbent dosage (1 g/L) by varying initial concentrations of Pb(II) ions (50–300 mg/L).

3.8.1. Langmuir Model

Langmuir isotherm models the monolayer coverage of the adsorption surfaces [34]. The Langmuir model is applicable for homogeneous adsorption studies based on the following assumptions: (i) all the adsorption sites are assumed to be identical, and all sites are energetically and sterically independent of the adsorbed quantity; (ii) each site retains only one molecule of the given compound; (iii) adsorbent and intermolecular forces decrease rapidly with the distance from the adsorption surface [29].
Langmuir equation is given below:
q e =   q m K L C e 1 + K L C e
In the linear form given by Equation (10),
1 q e =   1 q m + 1 q m K L C e
where K L (L mg−1) is the Langmuir adsorption constant related to the energy of adsorption, which reflects the affinity between the adsorbent and adsorbate, q m (mg·g−1) is the maximum adsorbed quantities, C e (mg·L−1) is the equilibrium concentration, and q e (mg·g−1) is the amount of lead adsorbed at equilibrium.
An essential parameter related to the Langmuir model can be expressed in terms of dimensionless constant separation factor of equilibrium parameter   R L , is represented by Equation (11), which is used to determine if a certain sorption system is “favourable” or “unfavourable”. The determining factors are as follows: (i) unfavourable ( R L > 1 ); (ii) Linear ( R L = 1 ); (iii) favourable ( R L < 1 ) and (iv) unfavourable ( R L = 0 ) [31].
R L = 1 1 + K L C i
where C i (mg·L−1) is the initial concentration of the lead ion solutions.
The Langmuir isotherm exhibited a better fit to the experimental data with higher correlation coefficients for all starch samples (R2 ≥ 0.98), as given in Table 5 and Figure S3 (Supporting Information). Therefore, the adsorption mechanism is well described by the monolayer Langmuir model on a homogeneous surface. The adsorption capacities of the MCS and MWS were remarkably higher as compared to their unmodified counterparts; see Table 5. The maximum adsorption capacities of MCS and MWS are found to 294.12 and 330.37 mg/g, respectively. Table 5 summarizes the Langmuir isotherm constants for the adsorption of Pb(II) ions. The RL value calculated from the Langmuir model is in the range 0–1 for all samples; see Table S1 (Supporting Information). Moreover, the RL value decreases with increasing initial Pb(II) concentration, which indicates the favourable adsorption of Pb(II) onto starch samples; see Table S1 (Supporting Information).

3.8.2. Freundlich Model

The Freundlich model is among the most widely used models to analyse the equilibrium data related to adsorbents. Freundlich equation is employed to describe the non-ideal multilayer adsorption on to the heterogeneous surfaces [44].
The Freundlich isotherm is given below:
q e =   K F C e N
The linear form of the Freundlich isotherm can be expressed as
l o g q e = l o g K F + N   l o g C e
where K F ( mg 1 1 N L 1 N g 1 ) is the Freundlich constant being indicative of the strength of the adsorption bond, N is the heterogeneity factor as an indicator of adsorption effectiveness,   C e (mg·L−1) is the equilibrium concentration, and q e (mg·g−1) is the amount of Pb(II) ions adsorbed at equilibrium. Furthermore, K F predicts the quantity of Pb(II) ions adsorbed per gram of composite at the equilibrium concentration. If N < 1, the bond energies increase with the surface density while N > 1, bond energies decrease with the surface density. Moreover, if N = 1, all surface sites are equivalent. If the value of N is in the range of 0 and 1, it indicates favourable sorption [29].
The equilibrium data were fitted to the Freundlich model; see Figure S4 (Supporting Information). Table 6 summarizes the Freundlich isotherm constants for Pb(II) adsorption. According to the data shown in Table 6, both MCS and MWS samples show larger KF values over NCS and NWS samples, indicating their higher adsorption capacity and affinity for Pb(II) ions. All calculated N values are within the range of 0 to 1, suggesting a favourable sorption process; see Table 5. However, the correlation coefficient (R2) of the Freundlich isotherm was found to be less than or equal to 0.98 ((R2 ≥ 0.98); see Table 6.
Comparing the correlation coefficient (R2), the equilibrium data for the adsorption of Pb(II) ions onto the starch samples followed the Langmuir model more than the Freundlich model. Therefore, homogeneous monolayer adsorption is more favourable over heterogeneous multilayer adsorption.

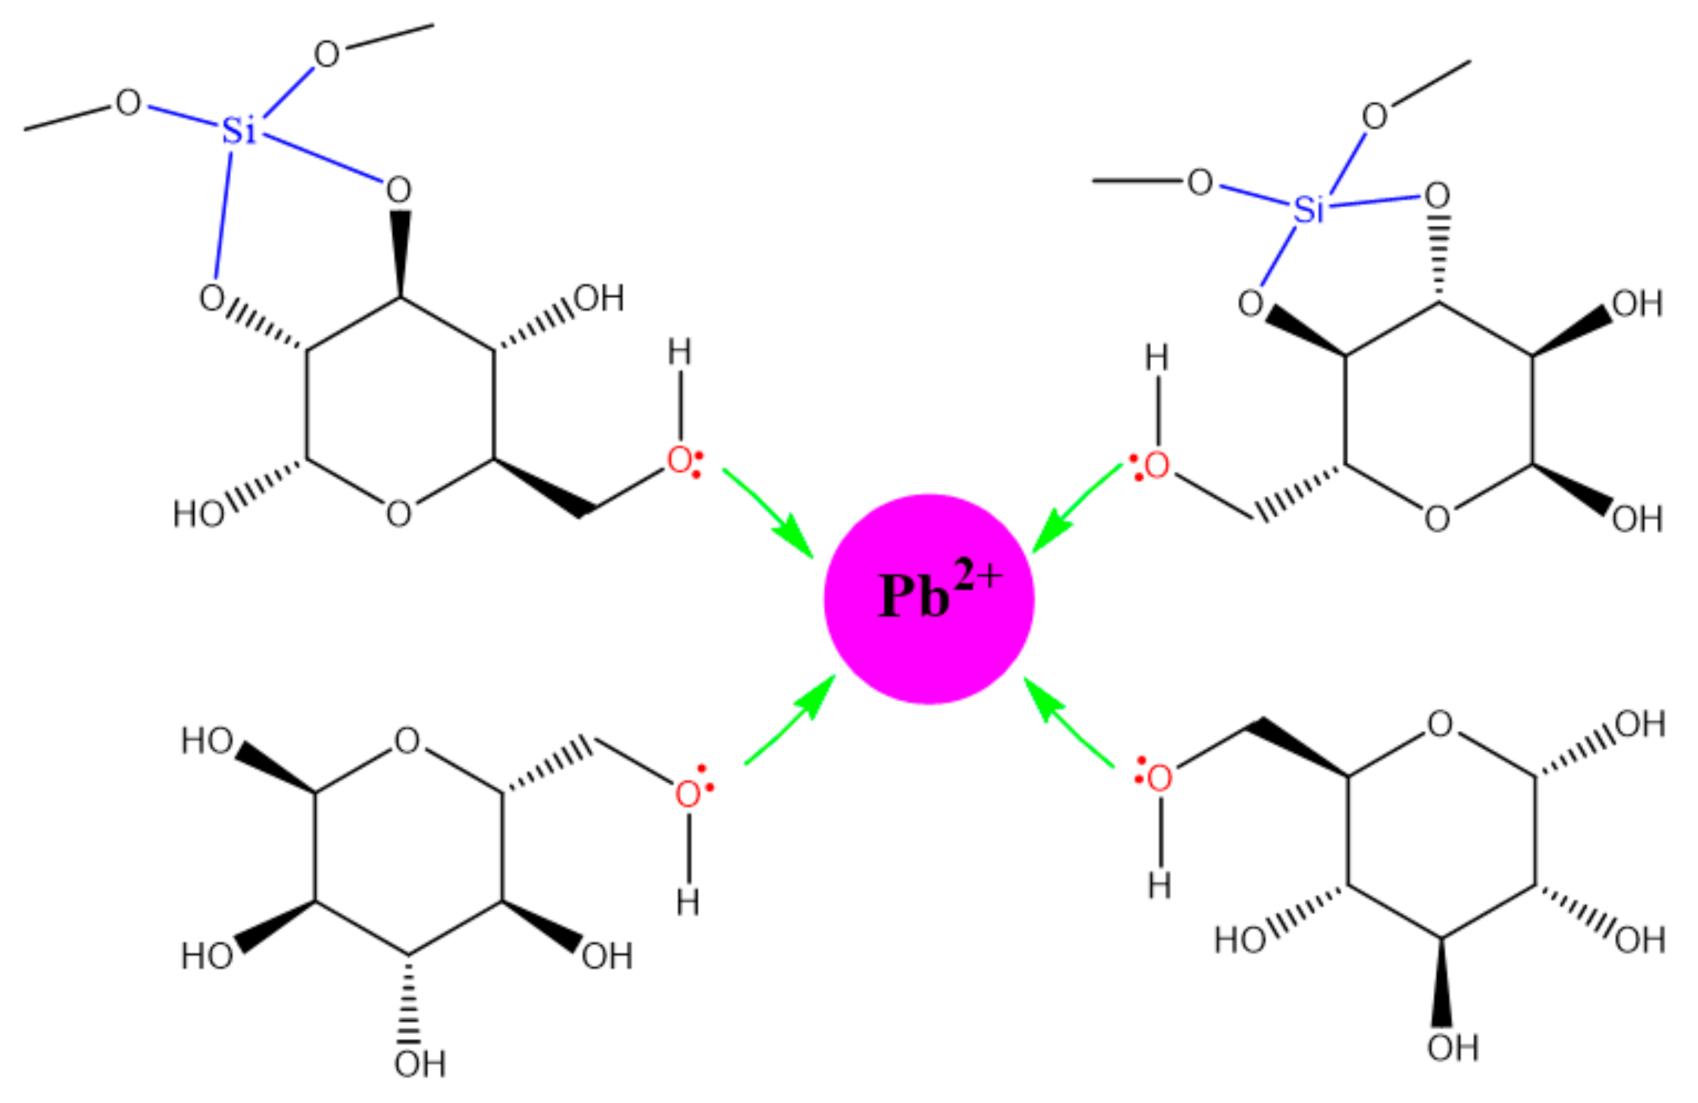
3.9. Lead Adsorption Mechanism

The absorption behaviour of Pb2+ ions onto modified starch can be explained using Pearson’s hard–soft acid-base (HSAB) principle. The pendant hydroxyl groups act as the hard Lewis bases, which show a greater affinity towards moderately hard Lewis acid, Pb2+. The lone pairs present in the oxygen atom donates electrons to the Pb2+ ions resulting in complexion between the Pb2+ ions and hydroxyl groups on the modified starch, as shown in Scheme 3. Note that it is also possible to form similar type of structure between uncondensed Si-OH functional groups and Pb2+ as shown in Scheme 3.

3.10. Desorption Studies

An imperative characteristic of an adsorbent is the desorption efficiency. Table 7 presents the desorption efficiencies of the modified starch samples (MCS and MWS). Both MCS and MWS exhibit high desorption efficiencies over 97% within 30 min. Our data suggest that the adsorption process is reversible, and hence the adsorbents can be recycled. Moreover, the recovered Pb(II) ions during the desorption process could be used for other applications.

3.11. Comparison with Other Studies

Several studies have been previously reported on the removal of Pb(II) ions from aqueous solutions using various adsorbents, including starch-based materials. Table 8 presents a comparison of the maximum Pb (II) ion adsorption capacities for different adsorbents reported in the literature. Interestingly, the modified starch samples studied in this study show comparatively larger adsorption capacities; see Table 8.

4. Conclusions

In this study, two types of modified starch adsorbents (MCS and MWS) were successfully prepared using Pluronic 123 as a structure-directing agent and TEOS as the chemical modifying agent. The adsorption process followed the pseudo-second-order kinetic model indicating the chemisorption mechanism. The equilibrium adsorption data fitted well to the Langmuir isotherm model with a correlation coefficient (R2) over 98%. The adsorption capacities calculated from the Langmuir isotherm were 330.37 and 294.12 mg/g for MCS and MWS. The MCS and MWS samples showed the highest desorption efficiencies of over 97%. Due to the easy synthesis route, cost-effectiveness, environmental benignity, high adsorption capacities, and desorption efficiencies, modified starch materials show potential in large-scale removal of Pb(II) ions from aqueous solutions.

Supplementary Materials

The following are available online at https://www.mdpi.com/2504-477X/5/2/46/s1, Figure S1: Kinetics of Pb(II) adsorption onto starch (NCS, NWS, MCS, and MWS) samples according to the pseudo-first-order model, Figure S2: Kinetics of Pb(II) adsorption onto (a) NCS and NWS (b) MCS and MWS samples according to the pseudo-second-order model, Figure S3: Langmuir isotherms of Pb(II) adsorption for (a) NCS, (b) NWS, (C) MWS, and (d) MWS, Figure S4: Freundlich isotherms of Pb(II) adsorption for (a) NCS, (b) NWS, (C) MWS, and (d) MWS, Table S1: RL values for the equilibrium batches.

Author Contributions

Conceptualization, C.A.G., A.M., W.A.M., S.M.R. and R.S.D.; Data curation, O.H.P.G., S.M.R., B.G.N.D.W. and P.N.K.F.; Formal analysis, O.H.P.G., A.P.S.M.A. and A.M.; Funding acquisition, A.M. and W.A.M.; Investigation, O.H.P.G., C.A.G., A.P.S.M.A., A.M., W.A.M., S.M.R., R.S.D., J.A.S.C.J. and C.A.N.F.; Methodology, C.A.G. and A.P.S.M.A.; Project administration, C.A.G., A.M., W.A.M., K.M.A.K.K., C.A.N.F. and R.S.D.; Resources, C.A.G., N.M.L.F., S.M.R., A.G., B.G.N.D.W., P.N.K.F. and C.A.N.F.; Supervision, C.A.G., A.M., W.A.M. and R.S.D.; Validation, A.P.S.M.A. and R.S.D.; Writing—original draft, O.H.P.G., C.A.G. and A.P.S.M.A., J.A.S.C.J.; Writing—review and editing, O.H.P.G., C.A.G., A.P.S.M.A. and R.S.D. All authors have read and agreed to the published version of the manuscript.

Funding

This research was funded by Accelerating Higher Education Expansion and Development (AHEAD) grant (AHEAD/RA3/DOR/65).

Data Availability Statement

The data presented in this study are openly available in Electronic Supporting Information (ESI). Data not presented in this study are available on request from the corresponding author.

Acknowledgments

The authors sincerely acknowledge the encouragement and guidance provided by all the members of the academic and non-academic staff members of Department of Chemical and Process Engineering, University of Peradeniya, Environmental Laboratory of Department of Civil Engineering, University of Peradeniya and Amanpreet S. Manchanda from Department of Chemistry California State University, Turlock, CA, USA for gas adsorption measurements.

Conflicts of Interest

The authors declare no conflict of interest.

References

  1. Xiang, B.; Fan, W.; Yi, X.; Wang, Z.; Gao, F.; Li, Y.; Gu, H. Dithiocarbamate-modified starch derivatives with high heavy metal adsorption performance. Carbohydr. Polym. 2016, 136, 30–37. [Google Scholar] [CrossRef] [PubMed]
  2. Apopei, D.F.; Dinu, M.V.; Trochimczuk, A.W.; Dragan, E.S. Sorption isotherms of heavy metal ions onto semi-interpenetrating polymer network cryogels based on polycrylamide and anionically modified potato starch. Ind. Eng. Chem. Res. 2012, 51, 10462–10471. [Google Scholar] [CrossRef]
  3. Bradl, H. Heavy Metals in the Environment: Origin, Interaction and Remediation; Elsevier: Amsterdam, The Netherlands, 2005. [Google Scholar]
  4. Nriagu, J.O. A global assessment of natural sources of atmospheric trace metals. Nature 1989, 338, 47–49. [Google Scholar] [CrossRef]
  5. Bhat, M.A.; Chisti, H.; Shah, S.A. Removal of heavy metal ions from water by cross-linked potato di-starch phosphate polymer. Sep. Sci. Technol. 2015, 50, 1741–1747. [Google Scholar] [CrossRef]
  6. Ibrahim, B.; Fakhre, N. Crown ether modification of starch for adsorption of heavy metals from synthetic wastewater. Int. J. Biol. Macromol. 2019, 123, 70–80. [Google Scholar] [CrossRef]
  7. Ferguson, J.E. The Heavy Elements. In Chemistry, Environmental Impact and Health Effects; Pergamon Press: Oxford, UK, 1990; pp. 211–212. [Google Scholar]
  8. IARC Working Group on the Evaluation of Carcinogenic Risks to Humans. Overall evaluations of carciogeniety: An updating of IARC Monographs volumes 1 to 42. IARC Monogr. Eval. Carcinog. Risks Hum. Suppl. 1987, 7, 1–440. [Google Scholar]
  9. He, Z.L.; Yang, X.E.; Stoffella, P.J. Trace elements in agroecosystems and impacts on the environment. J. Trace Elem. Med. Biol. 2005, 19, 125–140. [Google Scholar] [CrossRef]
  10. Goyer, R.A.; Clarkson, T.W. Toxic effects of metals. Casarett Doull’s Toxicol. Basic Sci. Poisons 1996, 5, 696–698. [Google Scholar]
  11. Herawati, N.; Suzuki, S.; Hayashi, K.; Rivai, I.; Koyama, H. Cadmium, copper, and zinc levels in rice and soil of Japan, Indonesia, and China by soil type. Bull. Environ. Contam. Toxicol. 2000, 64, 33–39. [Google Scholar] [CrossRef]
  12. Shallari, S.; Schwartz, C.; Hasko, A.; Morel, J.-L. Heavy metals in soils and plants of serpentine and industrial sites of Albania. Sci. Total Environ. 1998, 209, 133–142. [Google Scholar] [CrossRef]
  13. Ashizawa, A.; Faroon, O.; Ingerman, L.; Jenkins, K.; Tucker, P.; Wright, S. Draft Toxicological Profile for Cadmium; Agency for Toxic Substances and Disease Registry: Atlanta, GA, USA, 2008. [Google Scholar]
  14. Bardos, P. Composting of Mechanically Segregated Fractions of Municipal Solid Waste—A review. SITA Environmental Trust. 2004. Available online: http://www.compostinfo.info/content/set%20critical%20review%20msw%20composting.pdf (accessed on 1 January 2021).
  15. World Health Organization. Trace Elements in Human Nutrition and Health; World Health Organization: Geneva, Switzerland, 1996. [Google Scholar]
  16. Abdel-Aal, S.; Gad, Y.; Dessouki, A. The use of wood pulp and radiation-modified starch in wastewater treatment. J. Appl. Polym. Sci. 2006, 99, 2460–2469. [Google Scholar] [CrossRef]
  17. Tchounwou, P.; Wilson, B.; Abdelghani, A.; Ishaque, A.; Patlolla, A. Differential cytotoxicity and gene expression in human liver carcinoma (HepG2) cells exposed to arsenic trioxide, and monosodium acid methanearsonate (MSMA). Int. J. Mol. Sci. 2002, 3, 1117–1132. [Google Scholar] [CrossRef] [Green Version]
  18. Yedjou, C.G.; Moore, P.; Tchounwou, P.B. Dose-and time-dependent response of human leukemia (HL-60) cells to arsenic trioxide treatment. Int. J. Environ. Res. Public Health 2006, 3, 136–140. [Google Scholar] [CrossRef] [PubMed]
  19. Tchounwou, P.B.; Centeno, J.A.; Patlolla, A.K. Arsenic toxicity, mutagenesis, and carcinogenesis—A health risk assessment and management approach. Mol. Cell. Biochem. 2004, 255, 47–55. [Google Scholar] [CrossRef] [PubMed]
  20. Moore, M.R. A commentary on the impacts of metals and metalloids in the environment upon the metabolism of drugs and chemicals. Toxicol. Lett. 2004, 148, 153–158. [Google Scholar] [CrossRef] [PubMed]
  21. Centeno, J.A.; Tchounwou, P.B.; Patlolla, A.K.; Mullick, F.G.; Murakata, L.; Meza, E.; TodorTodorov, D.L.; Yedjou, C.G. Environmental pathology and health effects of arsenic poisoning. In Managing Arsenic in the Environment: From Soil to Human Health; CSIRO Publishing: Clayton, Victoria, Australia, 2006; pp. 311–327. [Google Scholar]
  22. Okuda, J.; Iida, K. Preparation of a “chronological table of main diseases in Japanese history” for pharmacy students of the 6-year program. Yakushigaku Zasshi 2005, 40, 137–146. [Google Scholar]
  23. Tchounwou, P.B.; Yedjou, C.G.; Patlolla, A.K.; Sutton, D.J. Heavy metal toxicity and the environment. In Molecular, Clinical and Environmental Toxicology; Springer: Berlin/Heidelberg, Germany, 2012; pp. 133–164. [Google Scholar]
  24. Meena, A.K.; Mishra, G.; Rai, P.; Rajagopal, C.; Nagar, P. Removal of heavy metal ions from aqueous solutions using carbon aerogel as an adsorbent. J. Hazard. Mater. 2005, 122, 161–170. [Google Scholar] [CrossRef]
  25. Jain, S.; Vasudevan, P.; Jha, N. Removal of some heavy metals from polluted water by aquatic plants: Studies on duckweed and water velvet. Biol. Wastes 1989, 28, 115–126. [Google Scholar] [CrossRef]
  26. Flora, S.J.; Flora, G.; Saxena, G. Environmental occurrence, health effects and management of lead poisoning. In Lead; Elsevier: Amsterdam, The Netherlands, 2006; pp. 158–228. [Google Scholar]
  27. Harvey, B. Managing Elevated Blood Lead Levels among Young Children: Recommendations from the Advisory Committee on Childhood Lead Poisoning Prevention. Available online: https://www.cdc.gov/nceh/lead/casemanagement/casemanage_main.htm (accessed on 4 January 2021).
  28. Abdul-Raheim, A.-R.M.; El-Saeed Shimaa, M.; Farag Reem, K.; Abdel-Raouf Manar, E. Low cost biosorbents based on modified starch iron oxide nanocomposites for selective removal of some heavy metals from aqueous solutions. Adv. Mater. Lett. 2016, 7, 402–409. [Google Scholar] [CrossRef]
  29. Mahmoud, M.E.; Nabil, G.M.; Zaki, M.M.; Saleh, M.M. Starch functionalization of iron oxide by-product from steel industry as a sustainable low cost nanocomposite for removal of divalent toxic metal ions from water. Int. J. Biol. Macromol. 2019, 137, 455–468. [Google Scholar] [CrossRef]
  30. Feng, K.; Wen, G. Absorbed Pb2+ and Cd2+ ions in water by cross-linked starch xanthate. Int. J. Polym. Sci. 2017, 2017. [Google Scholar] [CrossRef] [Green Version]
  31. Barczak, M.; Michalak-Zwierz, K.; Gdula, K.; Tyszczuk-Rotko, K.; Dobrowolski, R.; Dąbrowski, A. Ordered mesoporous carbons as effective sorbents for removal of heavy metal ions. Microporous Mesoporous Mater. 2015, 211, 162–173. [Google Scholar] [CrossRef]
  32. Haroon, M.; Wang, L.; Yu, H.; Abbasi, N.M.; Saleem, M.; Khan, R.U.; Ullah, R.S.; Chen, Q.; Wu, J. Chemical modification of starch and its application as an adsorbent material. RSC Adv. 2016, 6, 78264–78285. [Google Scholar] [CrossRef]
  33. Xie, G.; Shang, X.; Liu, R.; Hu, J.; Liao, S. Synthesis and characterization of a novel amino modified starch and its adsorption properties for Cd (II) ions from aqueous solution. Carbohydr. Polym. 2011, 84, 430–438. [Google Scholar] [CrossRef]
  34. Liu, Q.; Li, F.; Lu, H.; Li, M.; Liu, J.; Zhang, S.; Sun, Q.; Xiong, L. Enhanced dispersion stability and heavy metal ion adsorption capability of oxidized starch nanoparticles. Food Chem. 2018, 242, 256–263. [Google Scholar] [CrossRef]
  35. Awokoya, K.; Moronkola, B. Preparation and characterization of succinylated starch as adsorbent for the removal of Pb (II) ions from aqueous media. Int. J. Eng. Sci 2012, 1, 18–24. [Google Scholar]
  36. Kweon, D.-K.; Choi, J.-K.; Kim, E.-K.; Lim, S.-T. Adsorption of divalent metal ions by succinylated and oxidized corn starches. Carbohydr. Polym. 2001, 46, 171–177. [Google Scholar] [CrossRef]
  37. Güçlü, G.; Al, E.; Emik, S.; İyim, T.B.; Özgümüş, S.; Özyürek, M. Removal of Cu 2+ and Pb 2+ ions from aqueous solutions by starch-graft-acrylic acid/montmorillonite superabsorbent nanocomposite hydrogels. Polym. Bull. 2010, 65, 333–346. [Google Scholar] [CrossRef]
  38. Xu, S.-M.; Feng, S.; Peng, G.; Wang, J.-D.; Yushan, A. Removal of Pb (II) by crosslinked amphoteric starch containing the carboxymethyl group. Carbohydr. Polym. 2005, 60, 301–305. [Google Scholar] [CrossRef]
  39. Guo, L.; Zhang, S.-F.; Ju, B.-Z.; Yang, J.-Z.; Quan, X. Removal of Pb (II) from aqueous solution by cross-linked starch phosphate carbamate. J. Polym. Res. 2006, 13, 213–217. [Google Scholar] [CrossRef]
  40. Soto, D.; Urdaneta, J.; Pernía, K.; León, O.; Muñoz-Bonilla, A.; Fernandez-García, M. Removal of heavy metal ions in water by starch esters. Starch-Stärke 2016, 68, 37–46. [Google Scholar] [CrossRef]
  41. Kolya, H.; Das, S.; Tripathy, T. Synthesis of Starch-g-Poly- (N-methylacrylamide-co-acrylic acid) and its application for the removal of mercury (II) from aqueous solution by adsorption. Eur. Polym. J. 2014, 58, 1–10. [Google Scholar] [CrossRef]
  42. Irani, M.; Ismail, H.; Ahmad, Z.; Fan, M. Synthesis of linear low-density polyethylene-g-poly (acrylic acid)-co-starch/organo-montmorillonite hydrogel composite as an adsorbent for removal of Pb (ΙΙ) from aqueous solutions. J. Environ. Sci. 2015, 27, 9–20. [Google Scholar] [CrossRef] [PubMed]
  43. Benesi, I.R.; Labuschagne, M.T.; Dixon, A.G.; Mahungu, N.M. Stability of native starch quality parameters, starch extraction and root dry matter of cassava genotypes in different environments. J. Sci. Food Agric. 2004, 84, 1381–1388. [Google Scholar] [CrossRef]
  44. Association of Official Analytical Chemists (AOAC). Methods 920.36 (Moisture), 984.13 (Protein), 948.22(Lipid and Oil) and 923.03 (Ash of Flour), 17th ed.; AOAC (2000) Official Methods of Analysis; The Association of Official Analytical Chemists: Gaithersburg, MD, USA, 2000. [Google Scholar]
  45. Association of Official Analytical Chemists (AOAC). Method 962.09 (Crude Fibber), 18th ed.; AOAC (2005) Official Method of Analysis; Association of Officiating Analytical Chemists: Washington, DC, USA, 2005. [Google Scholar]
  46. Stawski, D. New determination method of amylose content in potato starch. Food Chem. 2008, 110, 777–781. [Google Scholar] [CrossRef]
  47. Gunathilake, C.; Kadanapitiye, M.S.; Dudarko, O.; Huang, S.D.; Jaroniec, M. Adsorption of lead ions from aqueous phase on mesoporous silica with P-containing pendant groups. ACS Appl. Mater. Interfaces 2015, 7, 23144–23152. [Google Scholar] [CrossRef]
  48. Gunathilake, C.; Gangoda, M.; Jaroniec, M. Mesoporous isocyanurate-containing organosilica–alumina composites and their thermal treatment in nitrogen for carbon dioxide sorption at elevated temperatures. J. Mater. Chem. 2013, 1, 8244–8252. [Google Scholar] [CrossRef]
  49. Kruk, M.; Jaroniec, M.; Sayari, A. Application of large pore MCM-41 molecular sieves to improve pore size analysis using nitrogen adsorption measurements. Langmuir 1997, 13, 6267–6273. [Google Scholar] [CrossRef]
  50. Lemos, P.V.F.; Barbosa, L.S.; Ramos, I.G.; Coelho, R.E.; Druzian, J.I. The important role of crystallinity and amylose ratio in thermal stability of starches. J. Therm. Anal. Calorim. 2018, 131, 2555–2567. [Google Scholar] [CrossRef]
  51. Abdullah, A.H.D.; Chalimah, S.; Primadona, I.; Hanantyo, M.H.G. Physical and chemical properties of corn, cassava, and potato starchs. IOP Conf. Ser. Earth Environ. Sci. 2018, 160, 012003. [Google Scholar] [CrossRef] [Green Version]
  52. Almeida, M.R.; Alves, R.S.; Nascimbem, L.B.; Stephani, R.; Poppi, R.J.; de Oliveira, L.F.C. Determination of amylose content in starch using Raman spectroscopy and multivariate calibration analysis. Anal. Bioanal. Chem. 2010, 397, 2693–2701. [Google Scholar] [CrossRef] [PubMed]
  53. Utrilla-Coello, R.G.; Hernández-Jaimes, C.; Carrillo-Navas, H.; González, F.; Rodríguez, E.; Bello-Perez, L.A.; Vernon-Carter, E.J.; Alvarez-Ramirez, J. Acid hydrolysis of native corn starch: Morphology, crystallinity, rheological and thermal properties. Carbohydr. Polym. 2014, 103, 596–602. [Google Scholar] [CrossRef] [PubMed]
  54. Badmus, M.; Audu, T.; Anyata, B. Removal of lead ion from industrial wastewaters by activated carbon prepared from periwinkle shells (Typanotonus fuscatus). Turk. J. Eng. Environ. Sci. 2007, 31, 251–263. [Google Scholar]
  55. Vojoudi, H.; Badiei, A.; Bahar, S.; Ziarani, G.M.; Faridbod, F.; Ganjali, M.R. A new nano-sorbent for fast and efficient removal of heavy metals from aqueous solutions based on modification of magnetic mesoporous silica nanospheres. J. Magn. Magn. Mater. 2017, 441, 193–203. [Google Scholar] [CrossRef]
  56. Pavlovic, I.; Pérez, M.; Barriga, C.; Ulibarri, M. Adsorption of Cu2+, Cd2+ and Pb2+ ions by layered double hydroxides intercalated with the chelating agents diethylenetriaminepentaacetate and meso-2, 3-dimercaptosuccinate. Appl. Clay Sci. 2009, 43, 125–129. [Google Scholar] [CrossRef]
Scheme 1. Hydrolysis of starch and tetraethylorthosilicate (TEOS).
Jcs 05 00046 sch001
Scheme 2. Condensation of hydrolyzed starch and TEOS into a block copolymer and the development of pore structures.
Jcs 05 00046 sch002
Figure 1. Nitrogen adsorption desorption isotherms for starch samples.
Jcs 05 00046 g001
Figure 2. FTIR spectra of the native (NWS and NCS) and modified (MWS and MCS) cassava starch samples.
Jcs 05 00046 g002
Figure 3. Thermogravimetric (TG) and differential thermogravimetric (DTG) profiles of (a) NWS, (b) NCS, (c) MWS, and (d) MCS samples.
Jcs 05 00046 g003
Figure 4. X-ray Diffractometry spectra of NWS, and MWS starch samples.
Jcs 05 00046 g004
Figure 5. Effect of contact time on Pb(II) adsorption efficiency on to (a) native (NWS and NCS) and (b) modified (MWS and MCS) starch samples (Initial Pb(II) concentration 100 mg/L, speed 150 rpm, temp 22 °C, pH 4.4, adsorbent dose 1 g/L).
Jcs 05 00046 g005
Figure 6. Effect of initial Pb (II) concentration on the adsorption capacity of (a) NCS and NWS (b) MCS and MWS (initial concentration 50, 100, 150, 200, 250, 300 mg/L, pH 4.4, speed 150 rpm, time 2 h, temp 22 °C, adsorbent dose 1 g/L).
Jcs 05 00046 g006
Scheme 3. Schematic illustration of Pb2+ adsorption mechanism.
Jcs 05 00046 sch003
Table 1. Composition of the native cassava starch (NCS) and native cassava starch extracted using the wet (NWS).
NWSNCS
ComponentsPercentage (%)Percentage (%)
Moisture Content12 ± (0.01)14
Amylose21.04-
Crude fibre0.2 ± (0.01)0.2
Gelatinization Temperature43.27 °C-
Particle Size<0.149 mm<0.037 mm
Table 2. Adsorption parameters for native and modified starch samples.
SampleVsp (cm3/g)Vmi (cm3/g)SBET (m2/g)Vtot (cm3/g)
NCS0.006<0.011.7 ± 0.10.007
MCS0.013<0.013.6 ± 0.10.014
NWS0.007<0.012.1 ± 0.10.009
MWS0.021<0.015.8 ± 0.10.022
Table 3. First-order rate constants (k1) and the correlation coefficients (R2) of first-order kinetic plots.
SampleFirst-Order Rate Constant (k1), min−1R2
NCS4.35 × 10−20.94
MCS5.46 × 10−20.98
NWS4.77 × 10−20.94
MWS6.67 × 10−20.92
Table 4. Pseudo-second-order kinetic parameters for Pb(II) adsorption.
Adsorbentqe (mg·g−1)h (mg·g−1 min−1)k2 (g mg−1 min−1)R2
NCS21.770.156.65 × 10−4 0.98
MCS261.014.514.42 × 10−40.99
NWS26.390.297.15 × 10−40.99
MWS303.095.525.2 × 10−40.99
Table 5. The Langmuir isotherm constants for removal of Pb(II) ions.
Sampleqm (mg·g−1)KL (L mg−1)R2
NCS13.363.64 × 10−30.99
MCS294.123.06 × 10−20.98
NWS18.911.18 × 10−30.99
MWS330.371.64 × 10−20.99
Table 6. The Freundlich isotherm constants for removal of Pb(II).
SampleNKFR2
NCS0.870.080.98
MCS0.6711.650.98
NWS0.730.200.98
MWS0.5618.590.97
Table 7. Desorption of ions from adsorbents using 0.1 M HCl.
AdsorbentDesorption Efficiency (%)
10 min20 min30 min
MCS72.485.698.3
MWS76.489.897.5
Table 8. Comparison of the Pb(II) ions adsorption capacities of various adsorbents.
Adsorbentqm (mg/g)Reference
Starch esters25.16[40]
Oxidized starch48.27[36]
Hydrothermally modified chitosan97.97[34]
Hydroxyethyl starch-graft polyacrylamide103.6[41]
Cross-linked amphoteric starch152.74[38]
Activated carbon prepared by periwinkle shells234.4[54]
Silica modified through co-precipitation270[55]
MCS294.12Present study
Cross-linked phosphate carbonate316.47[39]
MWS330.37Present study
ZnAl-dmsa (meso-2,3-dimercaptosuccinic acid)404[56]
Polyethylene-graftpoly (acrylic acid)-co-starch/organo- montmorillonite hydrogel composite430[42]
Publisher’s Note: MDPI stays neutral with regard to jurisdictional claims in published maps and institutional affiliations.

