Article

Optimal Modified Starch Content in UF Resin for Glulam Based on Bonding Strength Using Artificial Neural Network

1
Department of Bio Systems, Faculty of New Technologies and Aerospace Engineering, Shahid Beheshti University, Tehran 1983969411, Iran
2
Department of Bio Refinery, Faculty of New Technologies and Aerospace Engineering, Shahid Beheshti University, Tehran 1983969411, Iran
3
Laboratory of Wood Chemistry and Technology, Department of Forestry and Natural Environment, International Hellenic University, GR-661 00 Drama, Greece
*
Author to whom correspondence should be addressed.
J. Compos. Sci. 2022, 6(10), 279; https://doi.org/10.3390/jcs6100279
Submission received: 24 August 2022 / Revised: 3 September 2022 / Accepted: 13 September 2022 / Published: 22 September 2022
(This article belongs to the Section Composites Applications)

Abstract

:
The purpose of this study was to present an application of the artificial neural network (ANN) that predicts the bonding strength of glulam manufactured from plane tree (Platanus orientalis L.) wood layers adhered with a combination of modified starch adhesive and UF resin. Bonding strength was measured at different weight ratios containing different values of nano-zinc oxide as an additive under different conditions of press temperature and press time. As a part of the research, an experimental design was determined. According to that, the glulam specimens were fabricated, the bonding strength of specimens was measured, and the results were statistically analyzed. Then, a model was developed to predict bonding strength using the artificial neural network (ANN) technique. To describe the results, FTIR and TGA tests were also conducted. The experimental results show that the maximum bonding strength values were obtained when the WR was at the middle level (50%), nano-zinc oxide content was at a maximum (4%), and press temperature and press time were fixed at 200 °C and 22 min, respectively. The ANN results agreed well with the experimental results. It became clear that the prediction errors were in an acceptable range. The results indicate that the developed ANN model could predict the bonding strength well with an acceptable error.

1. Introduction

Formaldehyde-based resins have been used to produce wood products for many years due to their application facility and high performance. However, findings have shown that using these compounds as an adherent is very detrimental for human health in the long term, especially in domestic consumptions [1]. Hence, in recent decades, a permanent need has emerged to replace these components with bio-based adhesives that can be used to produce wood composites. Various studies have been conducted to introduce and offer safe natural-based adhesives with the performance of synthetic resins [2]. Starch has the second rank of polymeric carbohydrates in nature, after cellulose [3]. In addition, this cheap resource has a high production potential while it is also biodegradable. However, if it is used naturally without any chemical modification, it cannot be assumed as an adhesive. Hence, to improve the properties of starch-based products, and to control their viscosity and morphological characteristics, it is necessary to create active centers in the starch structure [4] via chemical and thermal modification in order to convert compact groups of hydroxyl substitutions into more active and bulkier aldehyde and carboxylic groups. In addition, adding different nano-sized additives can accelerate cross-linking among polymer functional groups. Many studies have been conducted to investigate the effect of the chemical treatment of starch on improving the properties of wood composite products [5,6,7,8,9,10] and changes in the properties of starch during the oxidation process. Luo et al., (2006) studied the effect of sodium hypochlorite treatment on the physicochemical properties of starch and concluded that a cross-linking reaction takes place between oxidized starch polymers [11]. Sukhija et al., (2016) showed that crosslinks arise due to oxidation of starch with NaOCl [12]. Patel et al., (1974) evaluated the kinetics of hypochlorite oxidation in media with different pH values and concluded that the oxidation rate of starch can be retarded under both acidic and alkaline conditions [13]. Forssell et al., (1995) compared the degree of oxidation of barley and potato starches and concluded that depolymerization of starch compounds occurred, while potato starch was oxidized more easily than barley starch [14].
In many analyses related to the applicability of natural adhesives for producing wood-based composites, the repeatability of the results, their generalizability to other, more extensive fields, and the presentation of a suitable model may not be precise and comprehensive enough due to the nonlinear effect of the variables on the response. In addition, it is often hard and costly to achieve the results with a minimum capability to generalize the response(s) being examined. An artificial neural network (ANN) is one of the nonlinear analysis methods that can offer models that are able to present final results with a high precision of analysis and predict results and generalize results with less time and cost. In this system, it is possible to recognize all complicated nonlinear relations between the process parameters and predict the output responses [15]. ANN modeling has been used to predict the process parameters in many applications. Kazi et al., (2020) and Sharma et al., (2020) have used ANN to predict the behavior of polymer composites [16,17]. Demir and Aydin (2021) modeled the conductivity and thermal coefficients of veneer sheets using an ANN based on the experimental values [18]. Using a multilayer perceptron artificial neural network, De Palacios et al., (2018) evaluated the effect of thickness swelling, water absorption, and the density of particleboard panels, so that an acceptable agreement was observed between the experimental and evaluated data according to the statistics, such as the estimated errors [19]. Aysenur et al., (2019) evaluated the effect of the production processes, such as paraffin ratio and press temperature, on the physical properties of particleboard using ANN modeling and indicated that the proposed model could offer a suitable estimate to predict the response compared to other methods, such as empirical formulas [20].
Mei et al., (2020) predicted the tensile strength and deformation of a diffusion bonding joint for Inconel 718 using a deep neural network and obtained an excellent correlation coefficient (0.99913) [21]. Silva et al., (2021) investigated the usability of an artificial neural network to estimate compressive strength and obtained results that indicated an excellent performance of the developed ANN model to predict compressive strength from input parameters studied with an average error less than 5% [22].
A survey of the research history showed that although some feasibility studies are conducted on the application of bio-based adhesives [5,6,7,8,9,10,11,12,13,14], very limited research has been conducted on predicting and optimizing the bonding strength of laminated wood products fabricated using a blend of modified starch and synthetic resins using ANN modeling. Therefore, the purpose of the present research was to estimate the effect of the application of a starch adhesive combined with UF resin containing zinc oxide nanoparticles as an additive, as well as the press parameters on the bonding strength of laminated wood products (glulam) using an artificial neural network approach.

2. Materials and Methods

2.1. Materials

2.1.1. Production of Layer

A plane tree (Platanus orientalis L.) log with a diameter at breast height of 40 cm was cut, shortened to a length of 40 cm, placed indoors for 3 months until its moisture content reached about 15%, and then was used to make boards with the dimensions of 400 mm × 70 mm × 7 mm using a band saw. For final drying and to achieve the moisture of 7%, the boards were put inside an oven in bundles of twenty (to prevent warping) at 120 °C for 4 h. Afterwards, the boards were immediately cooled, and the intact boards were stored in plastic bags—to prevent moisture reabsorption—to make glulam.

2.1.2. Preparation of Starch Adhesive and UF Resin

Natural corn starch was used to make the natural adhesive. Sodium hypochlorite (NaOCl, 99% content, density of 1.25 g/mL, and molecular weight of 74.5 g/mol, Hebei Kejiang Biotechnology Co., Ltd., Shijiazhuang, China) and hydrochloric acid (37%, density of 1.18 g/cm3, molecular weight of 36.46 g/mol, Merck, Germany) were used to modify the starch and to make starch adhesive. Urea formaldehyde (UF) resin (with specific gravity of 1.26 g/cm3, gel time of 60 s, viscosity of 350 cP, and solid content of 63% produced by Samed Mfg. & Ind. Co., Mashhad, Khorasan, Iran) was also used to prepare the final adhesive combination for any treatment.

2.1.3. Nano-Zinc Oxide

Nano-zinc oxide particles were purchased from Nano Mavad Gostaran Pars Co. (Tehran, Iran). The density, dimensions, purity, crystal structure, molecular weight, and melting point of these particles were 5.6 g/cm3, 20–60 nm, 97–98%, hexagonal, 81.38 g/mol, and 1975 °C, respectively. The required suspensions were prepared according to the test plan through sonication treatment before being mixed with the adhesive.

2.2. Methods

2.2.1. Preparation of the Starch Adhesive

First Stage: Chemical Modification of Starch

First, 100 g of corn starch powder was weighed and dissolved in 200 mL of distilled water. Then, 10 g of NaOCl (equivalent to 12 mL) was added gradually as the temperature reached 30 °C. The pH of the mixture was continuously controlled by a digital pH-meter with a precision of ± 0.01, and NaOH (0.5 M) was used to obtain a pH of 9.5. Mixing continued in this pH for an additional 30 min. Then, sulfuric acid (H2SO4, 20%) was used to neutralize the solution. Mixing continued for 10 more minutes at 30 °C to reach a well-mixed mixture [23,24,25]. Then, the mixture was centrifuged at 2000 rpm for 20 min, the supernatant water was removed, and the deposited starch was rinsed three times with distilled water. Afterwards, the starch was placed on filter paper and the mixture’s moisture was removed by a Buchner funnel connected to a vacuum pump. Due to the high concentration and the likely agglomeration of the starch deposited on the filter paper, it was washed with distilled water several times and then it was dried at room temperature. This procedure was performed several times to obtain a sufficient amount of modified starch to make the adhesive (about 400 g).

Second Stage: Preparation of the Starch Adhesive

In a beaker, 50 g of the modified starch was placed in a water bath, and 100 mL of 0.5 M hydrochloric acid (equivalent to the concentration of 2%) was added to the starch drop by drop. The water bath temperature gradually increased while being controlled by a thermometer. Simultaneously, stirring the mixture continued for 10 min before the mixture reached a physical state of plastic-dilatant at 65 °C. After removing the beaker from the water bath, the pH of the mixture became strongly acidic (pH 1.5). Therefore, NaOH (0.5 mol) was added drop by drop to increase the mixture’s pH to the range of 7 to 7.5. When the mixture’s temperature reached 90–95 °C, it was mixed for 10 to 15 min to consolidate the adhesive [24,25]. The prepared adhesive was placed in aluminum foil and was kept at dry room temperature. To obtain enough adhesive, several batches of the adhesive were prepared and mixed together and stored in plastic bags in a refrigerator.

2.2.2. Fabrication of Glulam

After preparing the adhesive according to the selected experimental design, it was applied to one of the top layer surfaces with a calibrated syringe and uniformly distributed with a spatula. Then, three layers with a direction parallel to the grain were assembled and transferred into the press and pressed at different press temperatures (PTem) and different amounts of time (PTim), as illustrated in Table 1 and Table 2. When the boards were removed, they were exposed to climatized conditions (at a temperature of 21 ± 2 °C and a relative humidity of 65 ± 5%) for 72 h and then they were trimmed to certain dimensions (150 mm × 19 mm × 19 mm) by a circular saw to measure the bonding strength using a universal tester (Load cell-2 ton: Sanaf Co., Ltd. (Tehran, Iran)), according to EN 302–1 standard [26]. During the preparation of the adhesive and in order to achieve a uniform distribution, nano-zinc oxide was first ultrasonicated on an aquatic environment (according to the final concentration of resin matter, 50%) and then it was added to the modified starch while being mixed with UF resin with a mixer. Other production variables kept identical and constant include hardener content (NH4Cl, 1% based on oven dried weight of adhesive), pressure (15 kg/cm2), resin consumption per unit area (100 g/m2), final thickness of the board (19 mm), etc. To prevent the inflation of the bonding line, a minimum resin content was used.

2.3. Experimental Design

The independent variables used include the weight ratio of the starch adhesive to the UF resin (WR) at five levels (10:90, 30:70, 50:50, 70:30, and 90:10), nano-zinc oxide content (NC) at five levels (0%, 1%, 2%, 3%, and 4%, based on resin dry matter weight), press temperature (PTem) at five levels (120, 140, 160, 180, and 200 °C), and press time (PTim) at five levels (14, 16, 18, 20, and 22 min). The boards (with a repetition of two times for every run) were made according to the selected experimental design (central composite rotatable design, CCRD). The results obtained from the bonding strength test were evaluated and statistically analyzed as a complete random design under the factorial fraction test, using the response surface methodology (RSM, Design-Expert Software Version 13, Stat-Ease 6 Minneapolis, MN, USA). The independent variables, together with their codes and levels and the number of condition combinations used, are given in Table 1 and Table 2, respectively. ANOVA was used to determine the effect of the glulam construction parameters on the bonding strength by determining the level of significance and direct, interactive, and quadratic effects of the independent variables used.

2.4. Characterization of Modified Starch and UF Resin

To examine the changes in surface functional groups, Fourier Transform Infrared (FT-IR) spectroscopy analysis was performed using pelletized specimens. Two mg of the adhesive samples was mixed with about 100 mg of potassium bromide (KBr) and changed into flour with a perfect coagulation or modification. The prepared specimens were scanned using the FT-IR spectrometer Nicolet 6700 (Thermo Fisher Scientific, Waltham, MA, USA) in the range of 600 to 4000 cm−1. Additionally, thermogravimetry analysis (TGA, TGA-50, Shimadzu Corporation, Kyoto, Japan) was performed to observe the thermal behavior of 100 mg of the powdered adhesive specimens. The specimens were heated from 30 °C to 600 °C with a heating rate of 10 °C/min under the nitrogen atmosphere flowed at 20 mL/min.

2.5. Prediction and Optimization of the Bonding Strength Using ANN

The ANN (artificial neural network) was used to predict the bonding strength using “nftool” in MATLAB Software, ver.15. For this purpose, a feed-forward back propagation algorithm with “trainlm” training function was used for prediction. The hyperbolic tangent sigmoid “tansig” transfer function was used in the hidden layer and the “purelin” linear transfer function was used in the output layer as an active function. Figure 1 shows a diagram of the ANN with 8 neurons on one hidden layer. The weight ratio of starch to UF resin, nano-zinc oxide content in adhesive, press temperature, and press time were chosen as the input parameters, while the bonding strength was used as the target value with output in the neural network models. Both target values and input experimental data were used to train the ANN algorithm.
The operations were normalized by the maximum or minimum input data set ranging between −2 and 2—due to the application of the hyperbolic tangent sigmoid function in the model—using the Equation (1).
N = x i Maximum   of   x Maximum   of   x Minimum   of   x  
where N is the normalized value, x is the training data series, and xi is the value of any input data in the training data set, 1, 2, 3, 4,…, etc.
The performance of the ANN model was determined by measuring the statistics including the correlation coefficient (R2), mean absolute percentage error (MAPE), root mean square error (RMSE) and mean absolute error (MAE). These values are measured by Equations (2)–(5):
R 2 = 1 i = 1 n y actual y predicted 2 i = 1 n y actual y meam 2
MAPE = 1 n i 1 n y actual y predicted y actual × 100
RMSE = i = 1 n y actual y predicted 2 n
MAE = 1 n i = 1 n y acyual y predicted
where yactual is the experiment output, ypredicted is the output resulting from the developed network, and n is the number of observations.

3. Results and Discussion

3.1. Characterization: FTIR and TGA Analysis

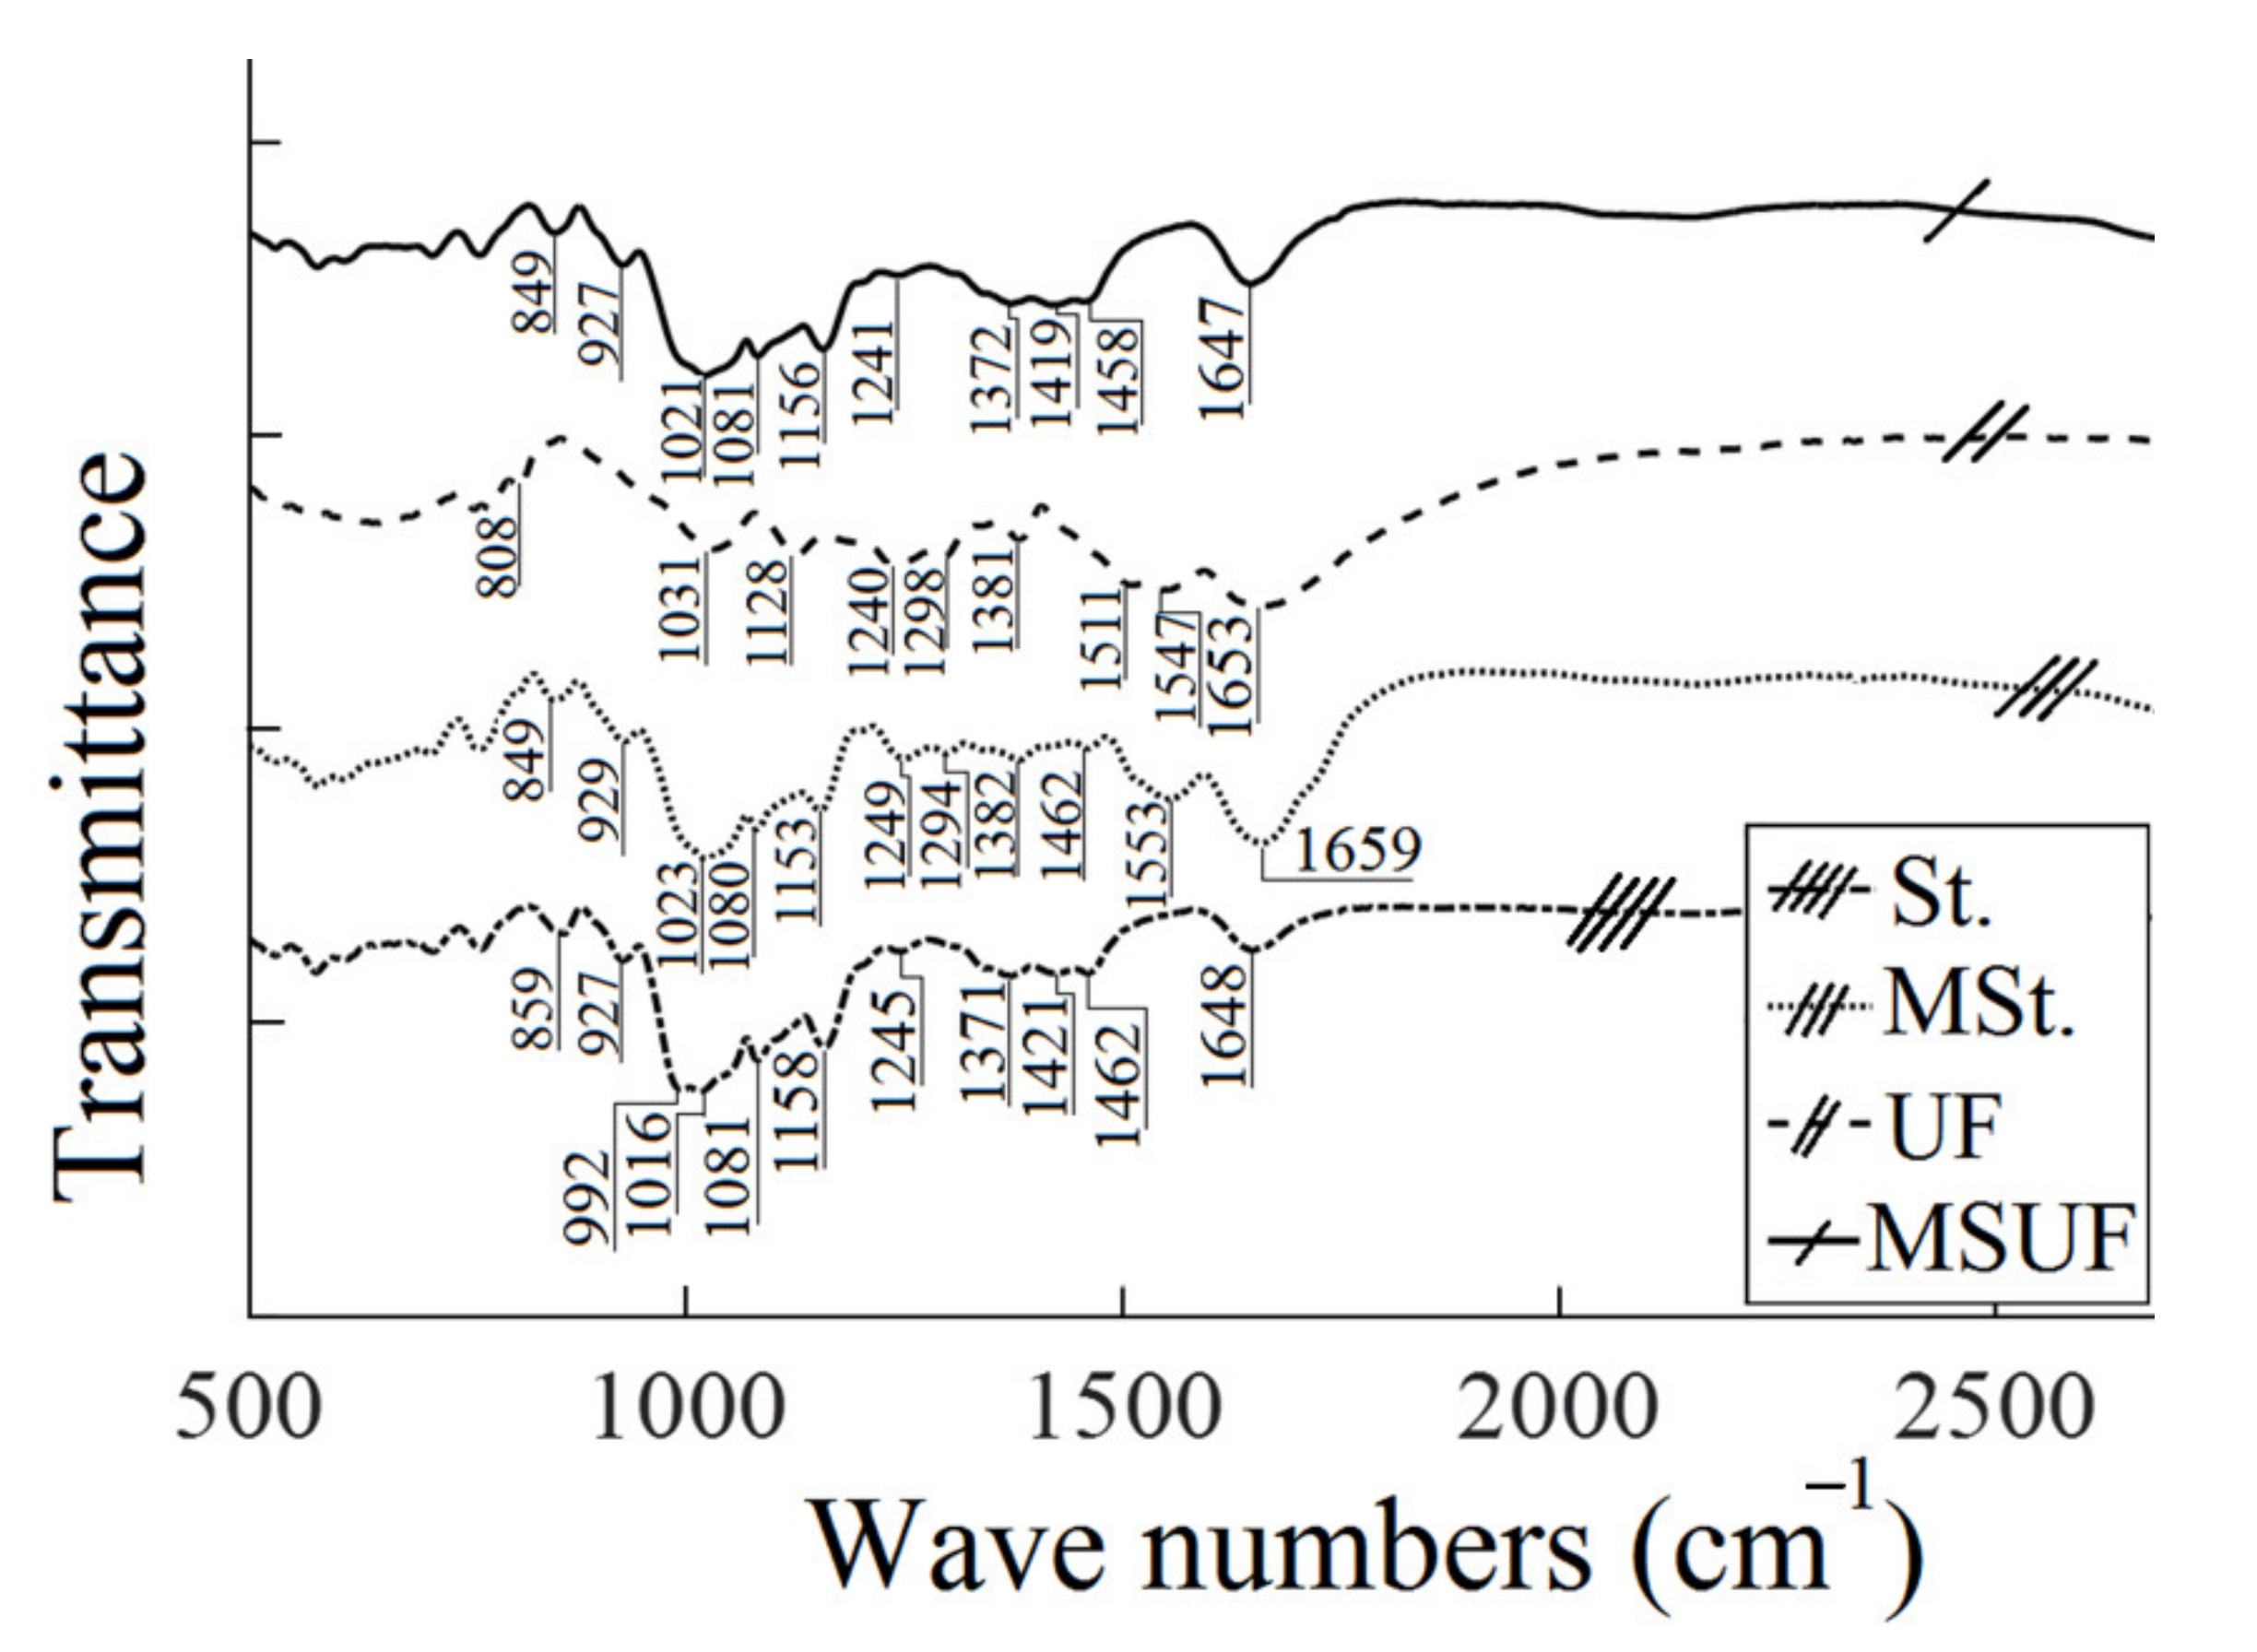
The FTIR spectra of natural starch (St.), oxidized starch (MSt.), UF resin, and MSUF adhesive are given in Figure 2. As it is observed, the band of natural starch at 1660 cm−1 are attributed to the stretching vibration bond of the C = O group (amide I) [27]. The band at 1540 cm−1 is attributed to the bending vibration of the N-H group (amide II), while the bands at 1458 and 1371 cm−1 are derived from the C-H stretching and bending modes of methylene [28]. The stretching vibration bond of the -CH2- group occurred at 1390 cm−1 and the bands at 945–1200 cm−1 belong to the bending vibration bonds of the C-C, C-O, and C-O-C groups [29].
It can be observed that chemical treatment has made the band at 1640–1655 cm−1 stronger in the modified starch and MSUF compared to St. and UF resin. This means that more carboxyl groups are presented in the oxidized starch, which can take part more readily in reaction with free formaldehyde or the -CH2OH of the UF resin [2], and form intermolecular hydrogen bonding with hydroxyl groups of the modified starch. The peaks in the range of 1545–1555 cm−1 exist in both UF and MSt. while they are not observed in the natural starch. However, the peak disappeared in UF and MSt. due to the interaction of the -COOH and N-H or N-H2 functional groups present in UF and MSt. The new stretching vibration band of the N-H group at 1458 cm−1 and the deformation vibration band at 1153 cm−1, resulting from the shift of the band of the C-N group at 1128 cm−1 [30,31], indicate that urea could be transferred to the MSUF adhesive through the polycondensation reaction. A new absorption peak has appeared at 1419 cm−1 in the combination of MSt. and UF (MSUF) adhesive which does not exist in UF, St., and MSt., which shows the formation of a new C-H symmetrical scissoring of CH2OH moiety [32], so that the potential formation of the copolymerization process can be confirmed. The peak observed at 1511 cm−1 belongs to the N-H bending vibration of amide II [33] in starch, modified starch, and UF resin; however, the peak disappeared in MSUF, which can mean the presence of a reaction between COOH and N-H or N-H2. In the band range of 1370–1380 cm−1, it can be observed that the peak intensity decreased significantly, which is due to the reaction of C-H in the aldehyde group (-CHO) of the modified starch and amine group in urea, and the formation of a starch-based polymer. A peak at 1293 cm−1 appeared in UF and MSt., which can be attributed to -OH, resulting from a deformation in -CH2OH; however, in the OSUF specimen, this peak probably disappeared due to its consumption during the polycondensation process. In addition, a strong peak appearing at 1245 cm−1 belongs to the -C-O methylol group [34] in UF and MSt. specimens; however, the peak almost disappeared in the MSUF specimen. This methylol group shows the formation of ether linkage in the related specimens; however, the formation of a C-N methylene bond is preferred in the combination of OS and UF (MSUF), which is stronger than ether linkages. A new band appeared at 1080 cm−1 in MSUF, showing the intensity of the formation of C-N or N-C-N stretching of the resin methylene linkage [35], while this band does not exist in UF. NaOH makes the starch inflated and more hydroxyl groups react with NaOH and form molecules containing a di-carbonyl group through rearrangement [36]. Along with the oxidation of hydroxyl groups, NaOH has weakened the peak absorption of C-O-C band of the starch molecule at 1000 cm−1, which has increased the band intensity at 500–800 cm−1. This indicates the effect of NaOH on the degradation of starch molecules, separation of the glycosidic bond, and production of small molecules from carboxylic acid molecules or heterocyclic loops containing an unsaturated bond [37].
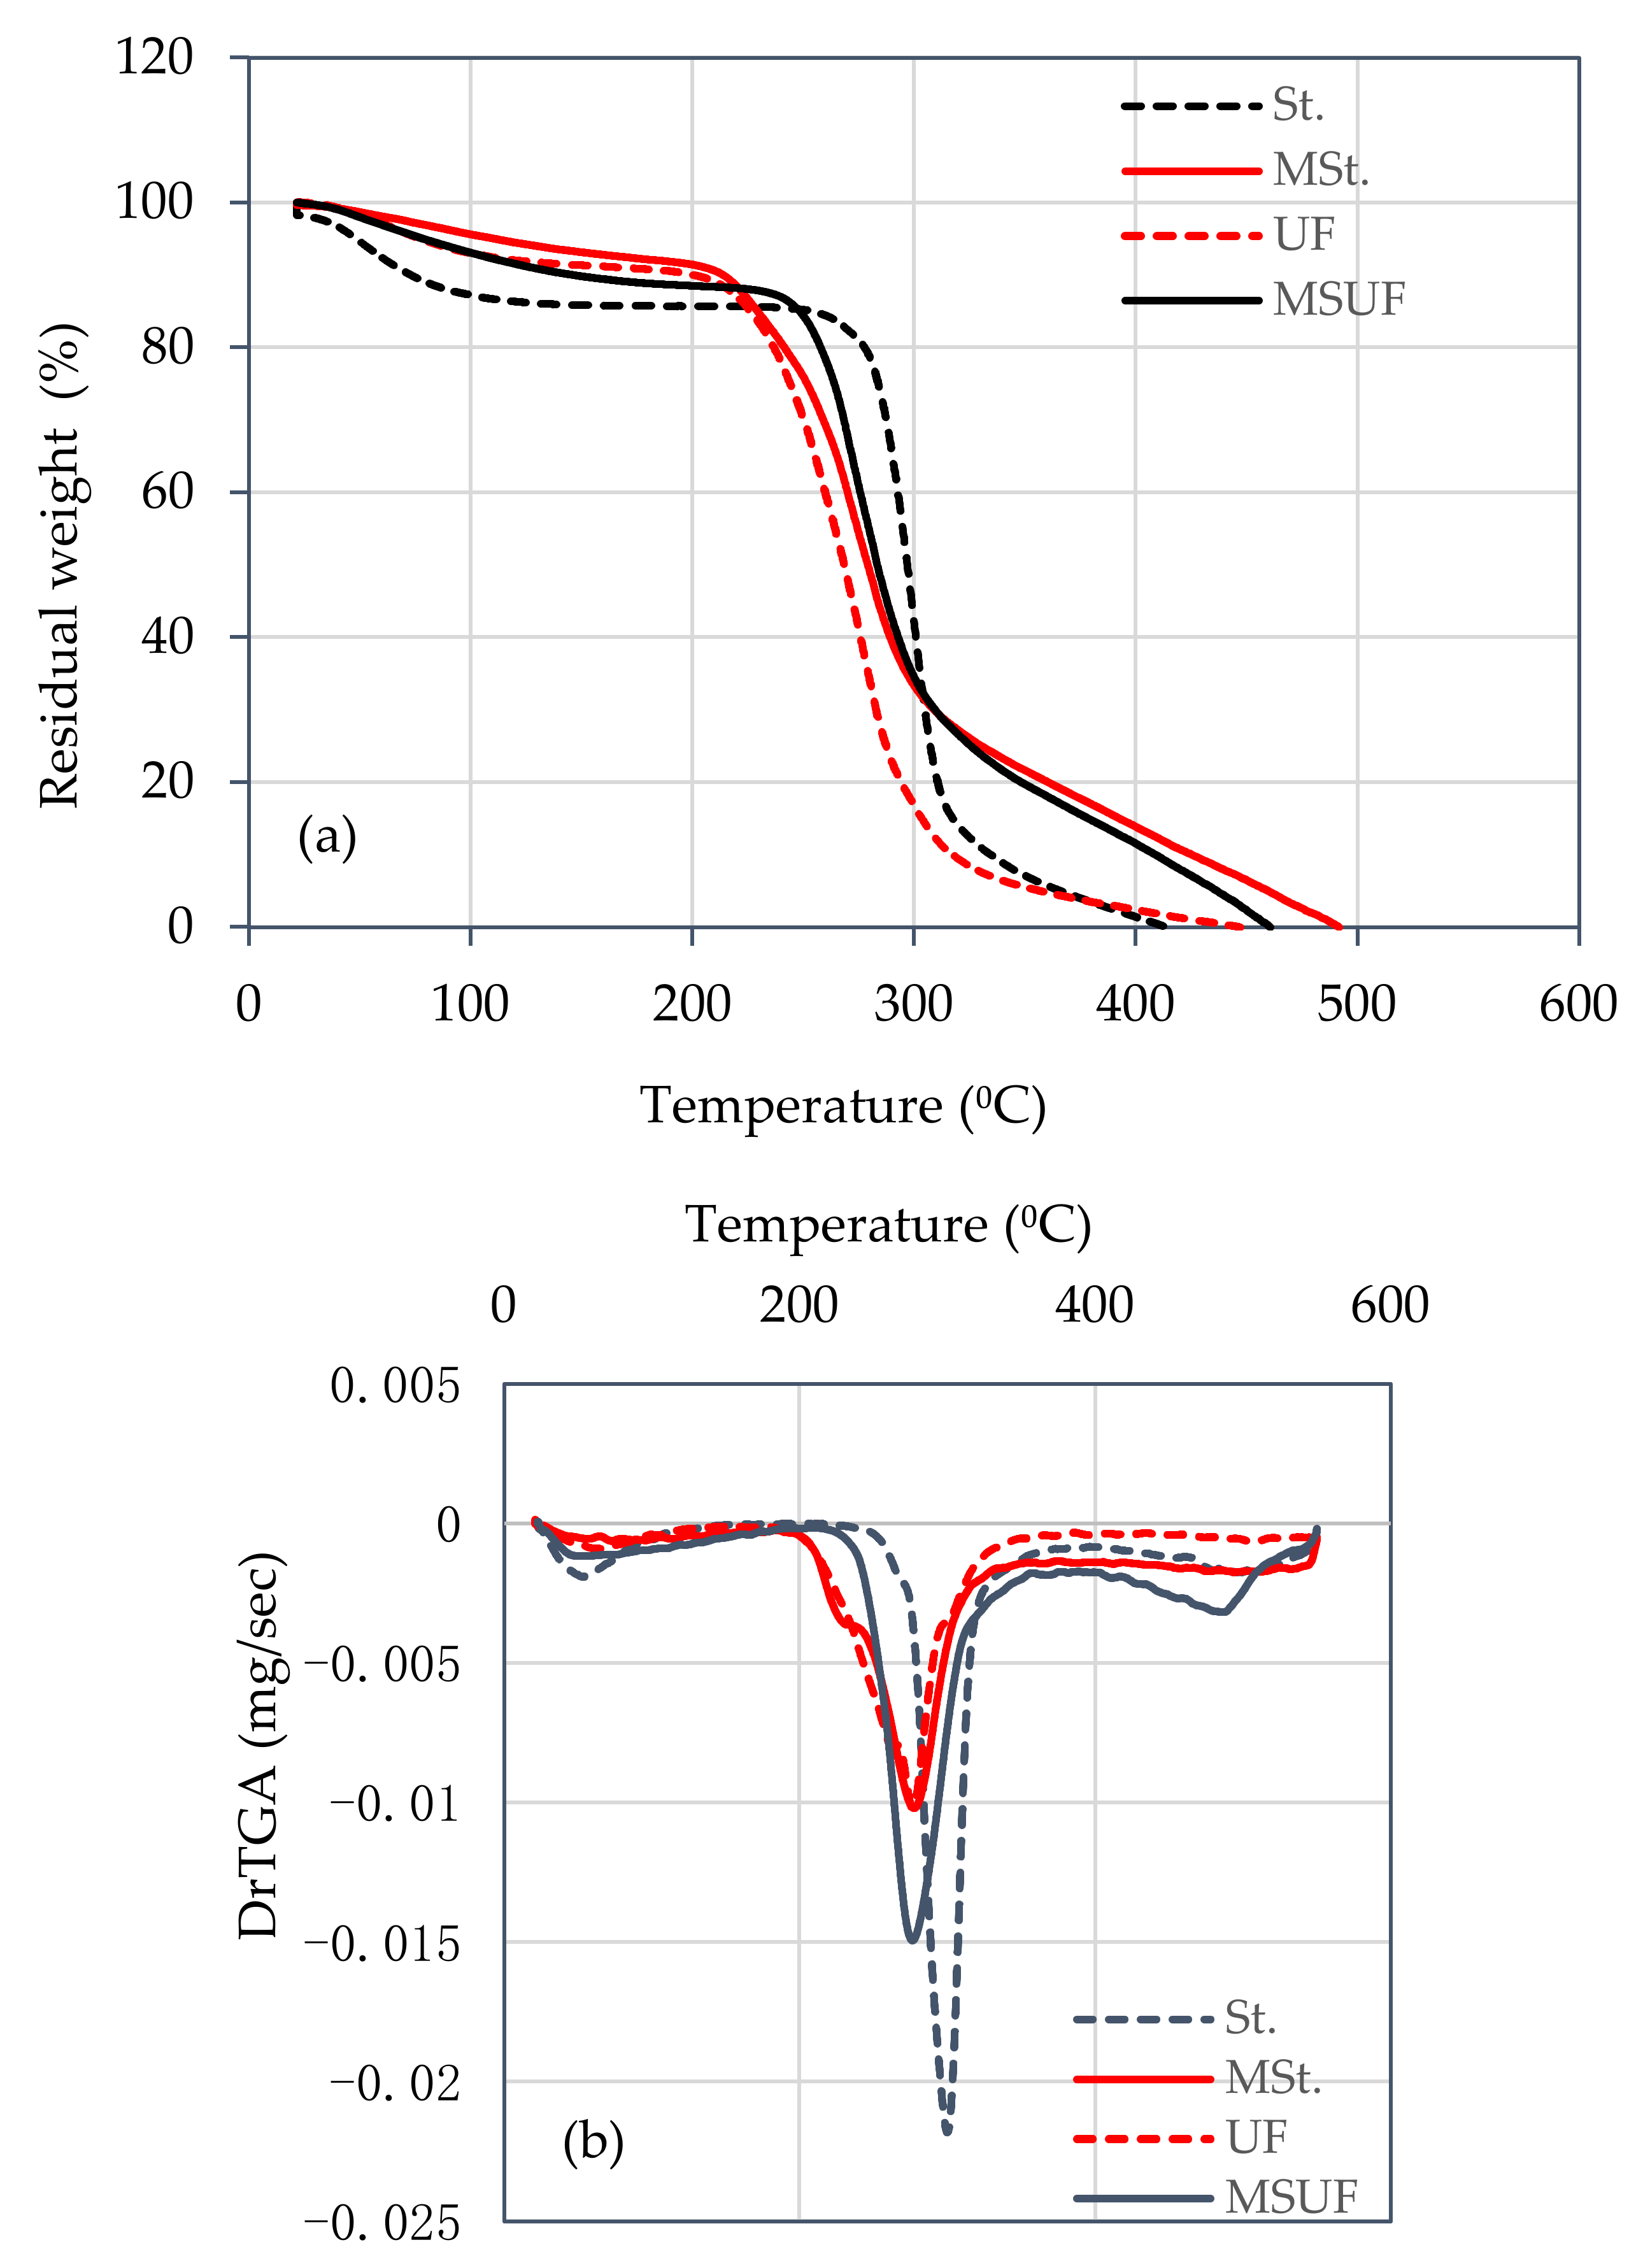
Figure 3 shows the TG and DTG curves of different adhesives to analyze thermal stability data. It is clear that the beginning of all degradation profiles are similar to each other and almost follow a similar trend, except for the natural starch (St.) in which, mass loss was significant at the beginning of heating due to the presence of a lot of -OH groups in the glucose units. The thermal degradation process of adhesives can be divided into three stages. In the first stage of degradation at the temperature of 20–192 °C, a mass loss of 10 and 11% was observed for the UF resin and MSt. adhesive, respectively. The temperature associated with the first degradation stage of natural starch and MSUF is 20–232 °C and 20–218 °C, respectively, and the mass loss is about 15% and 13%, respectively. The reduced weight loss of MSUF can be attributed to the evaporation of the specimen moisture and the moisture removal due to the water production in the condensation reaction of the reactive species (urea and methylol derivatives). The second stage of weight loss can be distinguished at the temperature of 192–380 °C, resulting from the dehydration of the polymerized chain [38]. The weight loss in this range and mainly in the range from 300 to 400 °C is due to the degradation of the starch and UF resin. In the second stage, the degradation of the natural starch began at 232.34 °C and reached the maximum value at 299.87 °C. However, for MSt., the initial temperature and the temperature of the maximum degradation decreased to 183 °C and 277.19 °C, respectively, compared to St., which apparently can be accompanied by the early rupture of the amylopectin double helices of esterified starch granules [39]. On the other hand, decomposition of the UF resin began at the temperature of 183 °C and reached the maximum at 276.20 °C. The initial temperature and the temperature of the maximum degradation rate of MSUF are fixed at 218.79 °C and 276.18 °C, respectively, which are almost equal to the temperature of the maximum degradation of the resin, showing that adding MSt. did not increase the weight loss. The increase in mass loss of MSt. in the second stage compared to that of St. is probably due to the continuous increase in the unstable ether methylene content in MSUF resin. However, according to the decrease in the mass loss in the third stage and its similar response in MSt. and MSUF, it can be stated that, in this case, the application of the modified starch could create the significant and positive effect of the UF copolymerization on methylene. According to the changes in the residual weight of the specimens in the range of 400–490 °C, the cured resin combined with the modified starch generally shows an increasing tendency in the residual weight, affirming the improvement in the thermal stability of the modified resin. These results indicate that in situ polymerization of the modified starch affects the chemical structure and number of groups, consequently confirming the increase in the thermal stability of the UF resin.

3.2. Statistical Analysis

As the data sets used in the prediction model to estimate the bonding strength, the experimental values of the bonding strength are given in Table 3. ANOVA was also performed to determine the effect of the WR, NC, PTem, and PTim on the bonding strength (Table 4). According to the test results, the studied parameters affecting the examined response were statistically significant (p < 0.01).
After determining the bonding strength of the specimens prepared based on the experimental design, the quadratic model was selected out of the linear, interactive, quadratic, and cubic models due to its better capability to offer the required response. As seen in Table 4, although this model does not have a high determination coefficient (R2), adjusted determination coefficient (adj. R2), and prediction determination coefficient (pred. R2), it offers a low p-value. The ANOVA shows the direct, interactive, and quadratic relationships between the effects of the independent variables on the dependent variable (bonding strength). The significance of each term was evaluated according to its corresponding p-value. p-values less than 0.05 show the significance of the model while those above 0.05 show that the model is not significant. The F-value (9.32) of the model emphasizes its significance. Here, it is only 0.0001% probable that the model’s F-value has noise at this value. The values less than 0.05 show the significance of the model terms. In this case, the linear x1, quadratic x12, x42, and interactive x1x2, x1x4, x2x3, x2x4, x3x4 model terms are significant. The presence of various significant model terms shows the improvement of the model performance. The lack of fit value of 0.0924 emphasizes that the lack of fit is not significant with respect to the pure error. The probability of facing this lack of fit F-value is 9.24% due to noise. In this case, the non-significant lack of fit is good. The results of Fisher’s F-test indicate a high F-value (9.32) with probability (p < 0.0001), describing the high significance of the independent variable combinations. It is seen in Table 4 that the quadratic terms including the MSt. (x12), press time (x42), the interactive terms including the WR and NC (x1x2), WR and PTim (x1x4), NC and PTem (x2x3), NC and PTim (x2x4), and PTem and PTim (x3x4), and the linear term of the WR (x1) significantly affected the response being examined due to the high F-value and a smaller p-value. The predicted R2 (0.481) is somewhat consistent with the adjusted R2 (0.557). “Adeq. Precision” measures the signal to noise ratio. A ratio more than 4 is satisfactory. The ratio 10.5 for this model shows a suitable signal. As a result, the chosen quadratic model can be used to direct the design space.

3.3. ANN Results

To estimate the effect of the studied independent variables on the bonding strength of the glulam using the ANN, the experimental data were classified into training, validation, and testing data sets. These data sets (Table 3) were used in the prediction model to estimate the bonding strength. The ANN performance was evaluated by MSE statistics. The weights and biases were fit frequently by taking the MSE value during the training. MSE was minimized for all experimental data. The best performance was obtained after 10 epochs showed the MSE value equal to 0.3789. This minimum value showed the performance of the prediction error, indicating that there is not a very high error in the prediction of the product’s bonding strength.
A total of 46 test inputs and their responses were used for training, testing, and validation. In all, 70% of the data were used for training while 30% of the data were used as the testing and validation data sets. The mean square error (MSE) value of the network was 0.10345, 0.16345, and 0.37878 during training, testing, and validating, respectively, after continuous training for 10 epochs as shown in Figure 4. It can be observed that the curves of plot are close to each other and there is no significant difference between the validation and test curves up to seven iterations, showing the absence of any overfitting [40].

3.4. Prediction of Bonding Strength Using ANN

The prediction of the bonding strength of the board was evaluated by training and testing the performance of the model offered by the ANN. For this purpose, four statistical indices were used to evaluate and compare the performance of the model developed by the ANN method in the prediction (Table 5), including determination coefficient (R2), which predicts the percentage of the changes in the dependent variable that is explained by the independent variable; root mean square error (RMSE), which compares the deviation between the predicted and actual values through some positive values; mean absolute percentage error (MAPE), which shows the precision of the prediction method estimation; and mean average error (MAE).
It can be observed that the total R2 value ranges from 0.80 to 0.92 for training, testing, and validation, showing the satisfactory (not excellent) prediction level of the model. The MAPE value is also another important criterion to prove the performance of the chosen model. Accordingly, the MAPE values of the training, validation, testing, and all data sets are 3.8263, 10.2074, 5.5234, and 5.0231%, respectively. As can be observed, the ANN method has been suitable and satisfactory to determine the bonding strength of the laminate board. Additionally, it can be said that the RMSE results are very satisfactory, at 0.3422, 0.6023, 0.3965, and 0.3993 for the training, validation, testing, and all data sets, respectively. It can be stated that an RMSE value closer to zero means a better fit between the measured and predicted outputs [41]. In sum, both MAPE and RMSE values were in acceptable ranges of precision for the training, validation, and testing stages. Similarly, MAE values are equal to 0.2076, 0.43, 0.3248, and 0.2579, respectively.
The error results obtained from the ANN for all data sets are given in Figure 5. It is observed that the error percentage is less than 1% (except one case). This shows a significant relationship between the inputs being examined and the response, and the model could prove its performance to predict the bonding strength of the laminate products connected with natural adhesives. According to other error statistics, such as RMSE, MAE, and MAPE, where a basic criterion was chosen to describe the model’s performance, it becomes clear that there is a slight difference between the observed and predicted results, remarkably validating the application of Levenberg–Marquardt algorithm for network development.
The relationship between the measured and predicted results obtained by the ANN model is offered in Figure 6a–c, showing the regression analysis of the ANN model for the bonding strength (0.8923 for all data sets, R = 0.9689 for the testing data set, and R = 0.9015 for the training data set). Hence, the R2 value as 0.9388 for the testing data set shows that the presented network can describe at least 93% of the observed data. This status adequately supports the validity of the proposed ANN model.
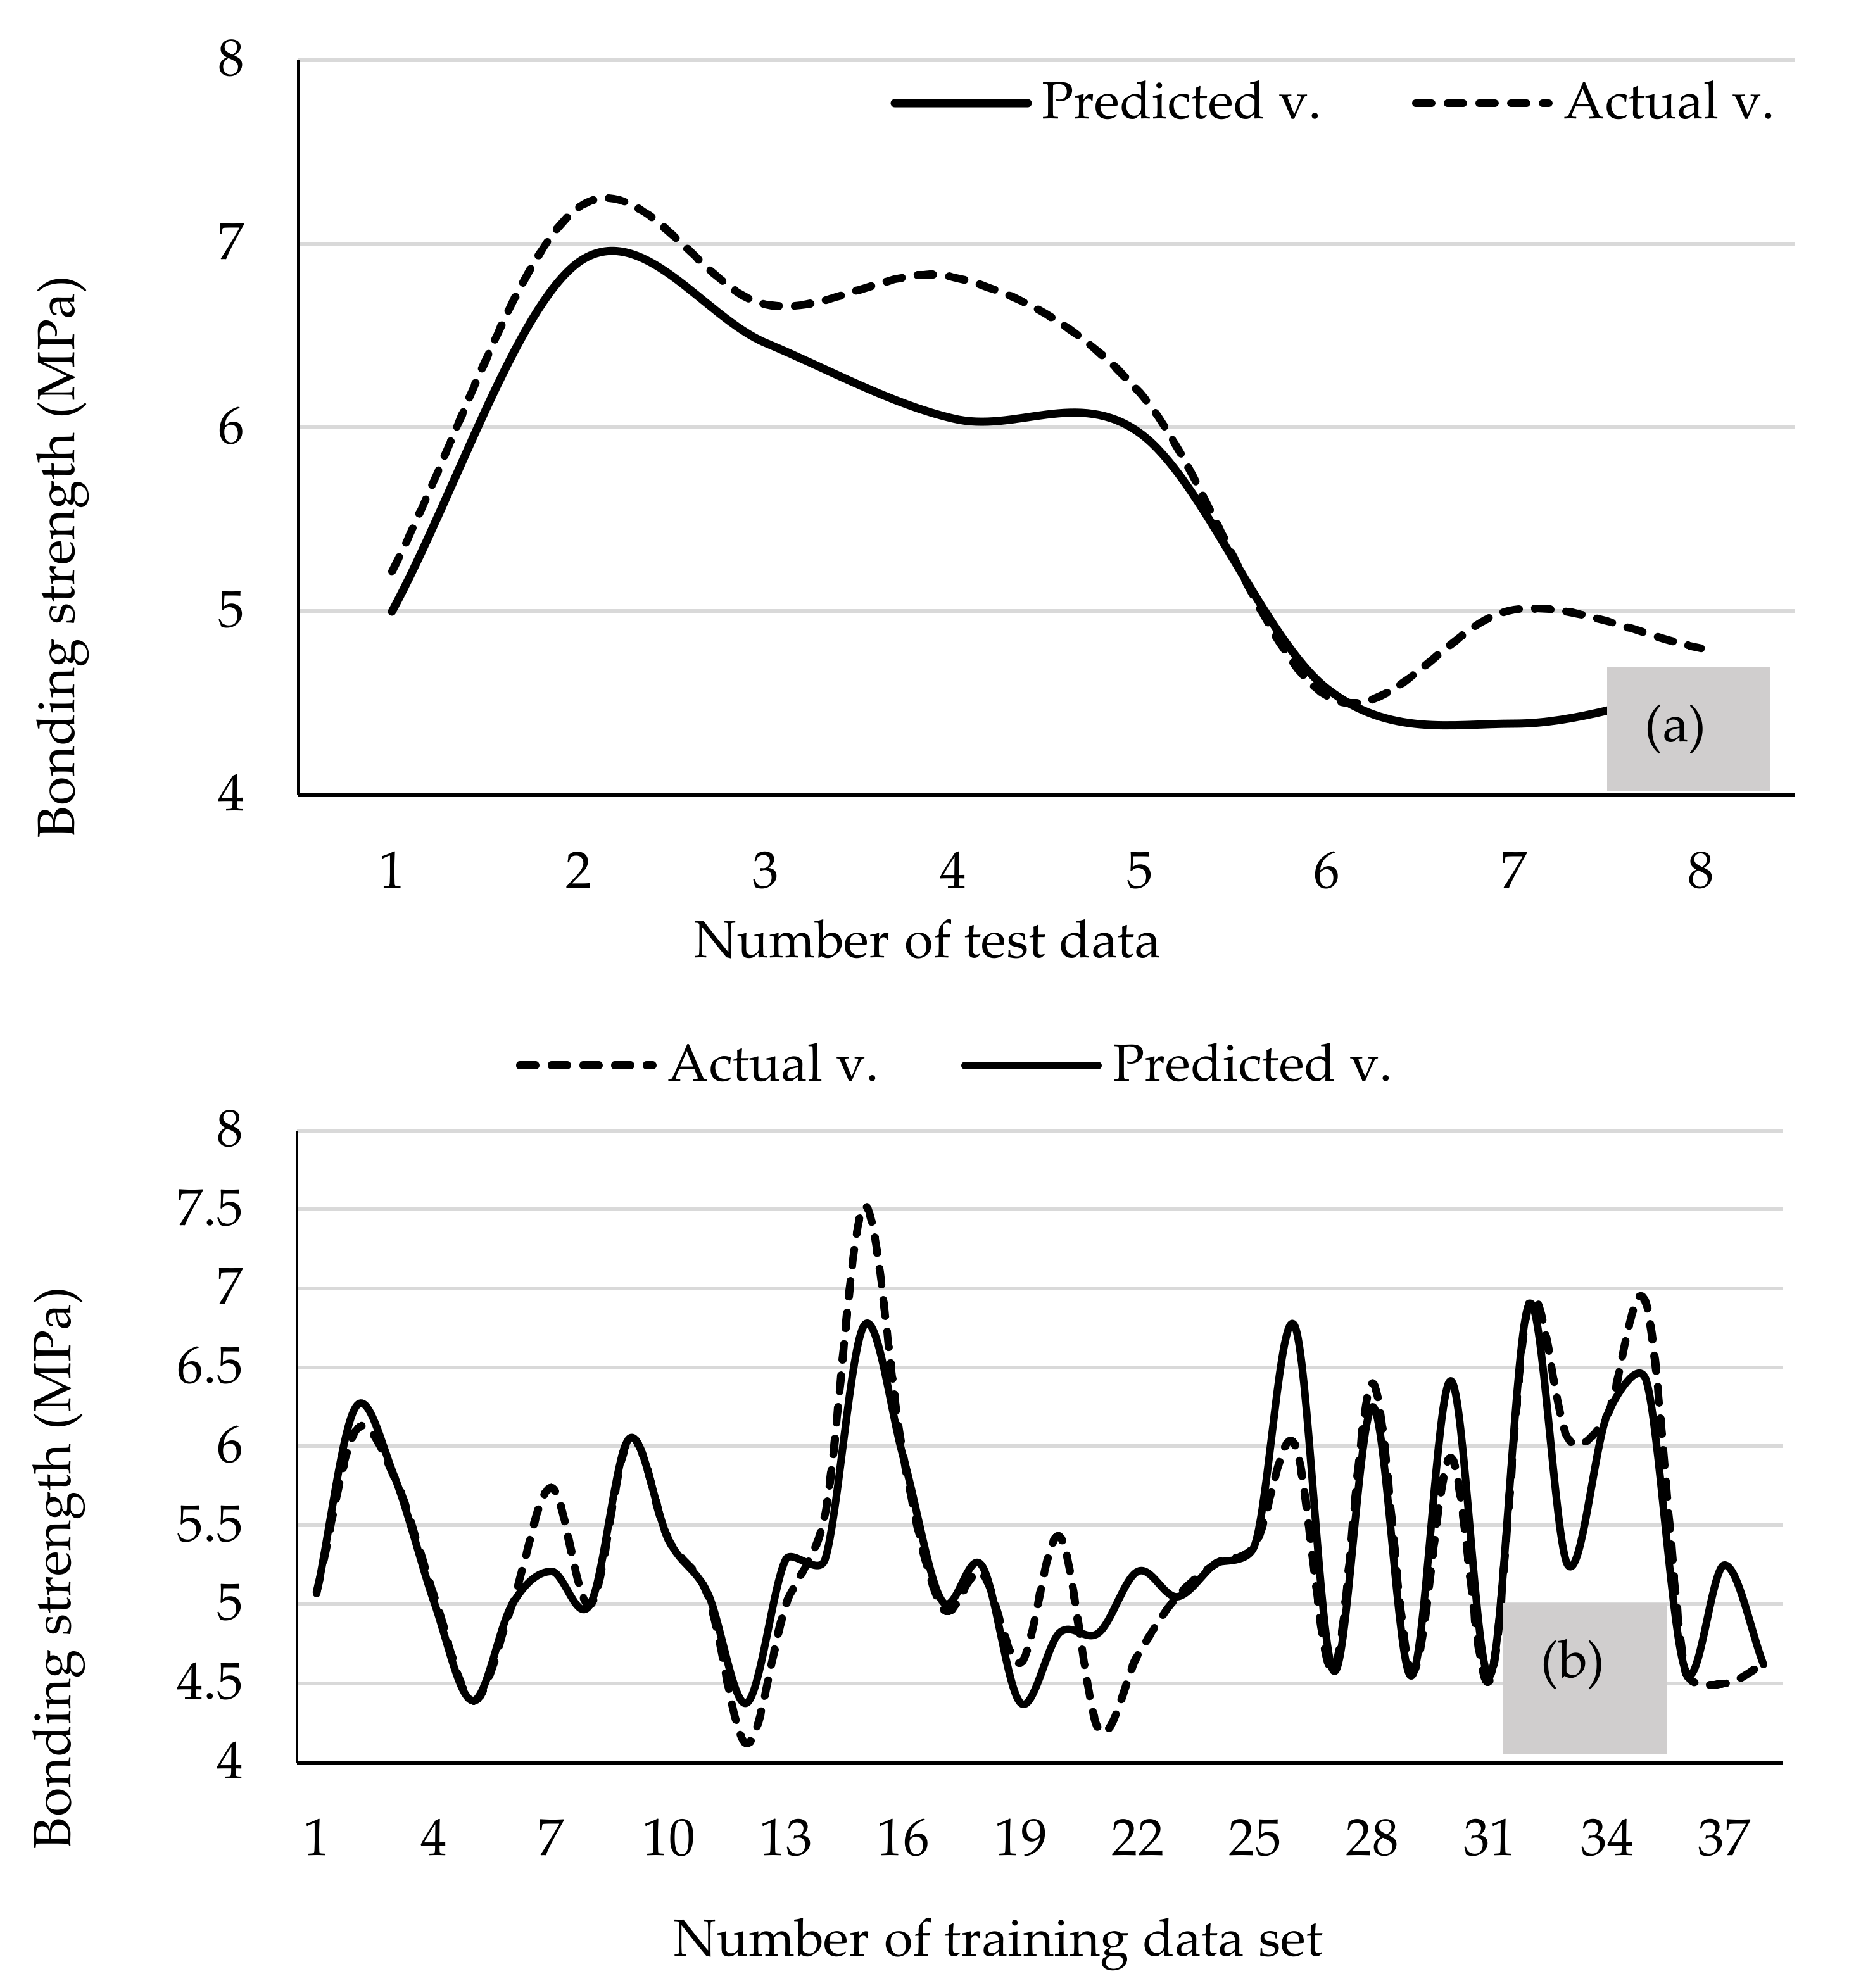
The comparison between the ANN modeling output and experimental values (training and testing data sets) is depicted in Figure 7a,b. The results of the graphical comparison show a similarity between the experimental study and the ANN model, supporting the model validity according to the statistics, such as R2 at a adequate level (88–92%). Hence, there is a suitable agreement between the ANN modeling output and experimental results so that it generally improves the validity of any ANN model. It emphasizes that the ANN model can be used to optimize the bonding strength of the laminate products. Therefore, applying the ANN model can be considered an appropriate alternative to measurement, reducing the measurement time and cost. If the network training is performed well, the model can be used to predict the bonding strength.

3.5. Discussion

In terms of having a significant effect on the response according to ANOVA, the interactive effects of the examined variables on the response are depicted in Figure 8. As it is observed in Figure 8a, if the PTem and PTim are at their middle values (160 °C and 18 min), as the WR increases and the NC becomes minimum, the strength becomes maximum in the interactive effect of the WR and NC. On the other hand, if a minimum WR is used, maximum application of nano-zinc oxide can increase the bonding strength to some extent.
Due to the formation of an adequate interfacial bonding between ZnO and the hardened starch matrix, it was found that the tensile strengths of the starch containing nano-zinc oxide improves [42,43]. However, at the same time, the drop contact angle also increases as ZnO content increases [40]. It can decrease the adhesive wettability of the wood surface, so that resin cannot properly penetrate the wood porous space, causing poor bonding between the adhesive and wood surface. Consequently, the stress transferability to the other adjacent layers of the glue line decreases.
As nano-zinc oxide is added up to 4%, the moisture content reaches a minimum in the starch matrix due to the strong interactive effect between the starch matrix and ZnO and the lower accessibility of the hydroxyl group to water molecules; finally, a matrix is formed with less hydrophilicity. This could be due to the destruction of the starch–plasticizer interaction and formation of an inter-chain network of starch matrix by hydroxyl groups on the surface of nanoparticles, so that a cross-linking network system is formed and the mobility of polymer chains decreases due to the formation of the interaction between the starch matrix and ZnO hydroxyl groups [44]. Hence, the penetration of water carrying resin into the starch chains decreases. Consequently, the interaction between urea amine groups of the resin and oxidized functional groups, such as aldehyde and carboxylic groups in starch, decreases. In addition, by adding nanoparticles, the rigidity of starch increased due to the interaction between nanoparticles and starch. Simultaneously, the matrix elongation decreases [44]. This means that during loading, the glue line experiences a large deformation. Due to the acceleration of brittleness in the formed glue line, the formation of micro-cracks and a developed crack area is accelerated.
Although alkaline and acidic treatments decrease the starch viscosity due to the stronger depolymerization and separation of inter- and intra-molecular connections in amylopectin and amylose chains [45], its value is still higher than that of resin. In addition, during the treatment, the structure of many granules changes depending on the concentration of the oxidizer and the treatment temperature while many other granules remain unchanged. Due to the viscosity of the gelatinization of the unchanged starch granules, an obvious increase occurs in the viscosity of the adhesive system [46], decreasing the wood penetrability, which results in a cohesive rupture during loading. At the same time, despite the effect of the structurally changed granules on the decrease in viscosity, the system still has a viscosity much higher than the pure resin. On the other hand, due to the application of the alkaline oxidation treatment to modify the natural starch and the application of the acidic treatment to produce the starch adhesive, the polymer chain containing new bulkier groups are exposed to create new bonds with additional formaldehyde in the UF resin, so that a cross-linked network structure is consequently formed and the adhesive viscosity also increases. In other words, while starch is treated in the acidic and oxidation processes to produce the adhesive, the molecular weight of the natural starch decreases effectively and it effectively decreases the gelatinization viscosity [47]. Additionally, the alkaline treatment causes a disruption of the glucosidal ring of starch and forms one or two aldehyde groups [48,49]. With respect to the existence of the amine groups in urea, these aldehyde groups can react with aldehyde groups formed on opened glucosidal rings of starch [50]. Depending on the content of depolymerized oxidized starch, the number of new sites of the aldehyde and carboxyl groups can increase and form more hydrogen bonds with the hydroxyl groups of amylopectin and amylose molecules, leading to a larger integrity in the polymer matrix [51]. Moreover, due to stronger depolymerization resulting from the alkaline treatment, viscosity and retrogradation of starch compounds decreases [52], so that the released carbonyl and carboxyl radicals increase the voids between amylose chains [45]. In the presence of NaOH, carboxymethylation reaction is formed and oxidized starch polymers are converted into the carboxymethyl starch ether compounds, leading to the introduction of sodium starch alkoxide as the new product in which the number of carbonyls and carboxyl groups increase [53]. Accordingly, amine groups of urea molecules can simply react with them.
As shown in Figure 8b, when the NC and PTem were at their middle values (2% and 160 °C) and as the WR increased and the PTim reached a minimum, the strength reached the maximum value. However, as the WR decreased, the decrease in the strengths can be largely compensated using the maximum PTim. When a minimum or maximum level of starch was applied and the PTim was in its minimum or maximum value, the bonding strength reached its minimum. It was approved that the crystallinity index of the prepared panels increased as the PTim increased, so that the strength properties of the board decreased [54]. Although, the change in the UF resin structure from micro-crystalline to an amorphous state during the coagulation on wood significantly decreased the crystallinity index of the modified starch, the increase in press time can increase the UF resin crystallinity. Due to the positive effect of the reduced crystallinity index by applying the modified starch, the increase in the WR, which results in decreasing the crystallinity index of the adhesive, the press time, and the crystallinity index of the UF resin, could create more cross-linking and improve the strength. However, as the press time increased, the strength decreased even at high levels of modified starch, which can be attributed to the increased effect of the crystallinity index of the adhesive.
It can be observed in Figure 8c that when the WR and PTim were at their middle values (50% and 16 min) while the NC and PTem increased or as these values simultaneously decreased, the strength reached the maximum value. However, by decreasing one of these variables while another is at its maximum, the strength reached its minimum. Due to the limitation of the press time for construction of the laminate products, formaldehyde-based adhesives containing metal ions are cured easily and more quickly, and therefore, they can offer more strength [55]. In addition, the non-reacted urea and mono-submitted urea need a rather high curing temperature to form compact cross-linking [56], so that formaldehyde-based resins containing ZnO particles can react easily to form a cross-linking network during the curing [57]. The larger specific surface area of nanoparticles can increase the contact surface with adhesive and, consequently, the bonding strength between the matrix and nanoparticles [58]. At higher temperatures, the resin viscosity severely decreased at the beginning of the press period and before the acceleration of the polycondensation process. Previous studies reported the potential for the formation of the intercalation and/or exfoliation of nanoparticle layers in the UF polymer matrix [59], which confirms that nanoparticles can disperse well in UF resin and are distributed in the matrix more easily and homogeneously. In these conditions, due to the brittleness of pure resin, the addition of nanoparticles and their more proper and homogeneous distribution can decrease the resin brittleness. As a result, stress can be distributed on the larger surface during the force exertion and loading, which can reduce the stress concentration and consequently impede the panel ruptures at a higher loading. Strong agglomeration of nanoparticles leads to increased viscosity of the resin containing nano-zinc oxide compared to the pure UF resin [59]. The increased molecular weight and cross-linking density of the nano-UF system increases the viscosity of the UF adhesive, which consequently increases the strength [60]. In addition, at a lower press temperature where the viscosity decreases, the homogeneous dispersion of nanoparticles may be impaired. Therefore, in the presence of a small number of nanoparticles, they are less likely to accumulate, which can limit the development of micro-cracks caused by stress concentration.
Figure 8d shows that, as PTim increased and the NC reached a minimum, the strength reached its maximum value. On the other hand, an increase in NC could largely minimize the negative effect of the PTim if the WR and PTem were at their middle values (50% and 180 °C). It can be observed in Table 4 that, according to the F-value, the interactive effect of PTim × NC on bonding strength is minimum. It seems that at a temperature of 180 °C, the increase in the NC broke the cross-linking created during the polycondensation together with the increase in the press time and, probably, the fast excessive conduction of temperature due to the high thermal conductivity of nano-zinc oxide in the glue line. In addition, as the NC content increased, the thermal conduction of the glue line increased as well. Therefore, steam was confined more easily, especially at the end of the press period, when a very high compression of layers resulting from the complete lignin softening and deformation of wood into a complete plastic state limited the exit of steam from the panel. The increased saturated steam pressure can even exceed the internal bonding strength. However, at a lower press time, higher thermal conduction and a more uniform distribution of temperature in the glue line, due to the presence of nano-zinc oxide, is an advantage and it helped resin coagulation before excessive steam was confined in the glue line.
The longer hot press time means that the system needs more energy to create cross-linking. It is known that the increased press time can change viscoelastic parameters, so that as the press time increases to a certain level, the modulus of elasticity and modulus of viscosity progressively increase. Hence, due to the effect of press time on the rheological properties of the adhesive, which subsequently affect the bonding strength, the increase in moduli improves the strength [61]. A long press time and high nanoparticle contents result in very high coagulation of the resin layer, so that the interlayer connection is not strong due to the increase in the stress created by the coagulation of the adhesive layer.
As shown in Figure 8e, if WR and NC were fixed at their middle values (50:50 and 4%), both maximum and minimum values of PTim resulted in the maximum value of strength. Furthermore, if PTim was used at a maximum level, the strength could be largely compensated for by decreasing the PTem to the minimum level. The simultaneous increase or decrease in PTem and PTim led to the decrease in strength.
A certain time is needed to conduct temperature from the board surface to its core. However, the increase in press time not only affects the efficiency of the hot press but also affects resin coagulation. A long press time leads to glue line brittleness in the laminated product, which can be exacerbated at the highest press temperature. If either of these factors, including press time and temperature, increases or decreases, the acceleration of the molecular thermal movement and water evaporation improve during the hot press and, as a result, more hydrogen bonds are formed. However, if both factors reach their maximum values, hemicellulose and lignin are destroyed (their destruction begins at 100 °C); hence, the bonding strength decreases. When the press time is short and press temperature is low, the adhesive layer coagulation becomes incomplete, leading to the disconnection of the resin layer due to the incomplete hardening of resin polymers and the decrease in the bonding strength.
Starch can become foamy due to the steam trapped inside the viscous paste of gelatinized starch [62], so that the crystalline double-helix chains of starch are separated. The granule structure is broken and a waterborne network of hydrogen bonds is created [63]. The low temperature of the top and bottom surfaces of the press prevents the completion of the starch gelatinization process and a fraction of starch chains remains inside the granules, so that the foam formed does not completely extend and solidify. As a result, the cell walls of the formed foam, which affect the formation of a uniform film on the glue line to improve the adhesive coating surface, cannot develop the strength required to keep the structure after the steam escapes following the removal of the board from the press. In addition, in using the upper limit of the press temperature, the starch adhesive paste expands very quickly due to the steam trapped inside the board and the remarkable internal pressure, so that the distribution surfaces of both the adhesive and the UF resin coating the starch extend. If the board remains confined under the press and steam cannot escape due to the long press time, the internal pressure created can cause cracks in the expanded cell walls of the starch and UF resin and the failure and weakening of the glue line can begin.

3.6. Optimization

A well-trained model can calculate satisfactory average values for the optimization of the research, because the optimized values of the bonding strength are normally provided by showing the average values. Moreover, the best performance of the adhesive bonding is satisfactory for structure, furniture, and industrial applications related to wood and the wood industry [64]. For this purpose, the average values obtained for different combinations of parameters are required. Otherwise, some defects may occur when applying wood products. Hence, some defects in the bonding strength of the wood consumed with different application conditions must be described using the prediction techniques that describe the effects on the adhesive’s bonding strength.
After determining the most proper statistics and the relative capability of the ANN model chosen to predict the response, the regression equation obtained from the model (Equation (6)) was utilized as a criterion to determine the optimal limits of the input values to obtain the best response point. When applying the equation, the non-significant terms of the independent, interactive, and quadratic effects were deleted (ANOVA table). Accordingly, even the bonding strength that was not obtained from the experimental study can be also obtained by the ANN prediction model for all input levels of x1, x2, x3, and x4 (Figure 9). It can be observed that the specimens in which about 50% starch with a maximum content of nano-zinc oxide (4%) was used in the glue line and pressed at the temperature of 187 °C for 22 min reached the maximum strength (about 4.5 MPa).
y = 1.05 + 1.216 × 1 − 0.889 × 1 × 2 − 0.613 × 1 × 4 + 0.33 × 2 × 3 − 0.106 × 2 × 4 − 0.265 × 3 × 4 + 0.155 × 12 + 0.225 × 42

4. Conclusions

The present study focused on modeling the effects of the application of a starch adhesive combined with UF resin (WR), nano-zinc oxide (NC), and press time (PTim) and press temperature (PTem) on the bonding strength of glulam constructed from plane tree (Platanus orientalis L.) wood using the ANN technique.
The results of the study show that as the modified starch content increases to 50%, the bonding strength increases continuously. As it increases beyond this value, the strength decreases. As the NC content reaches a maximum (4%), the bonding strength reaches its maximum as well. The simultaneous increase in WR and NC decreases the bonding strength. If lower contents of NC are consumed, the increase in the WR can compensate for the decrease in the strength.
The interactive effect of PTim and PTem shows that the bonding strength can reach the maximum value by combining the maximum value of one of these factors with the minimum value of the other. Hence, according to the WR and NC, a suitable level of PTem and PTim can be offered.
Finally, it was demonstrated that ANN is a valuable tool to predict the bonding strength of wood laminate products, and it is expected that this technique will be considered as an alternative method by those working in wood industries to ensure that a laminate product with a high bonding quality is obtained.

Author Contributions

Conceptualization, methodology, software, validation, formal analysis, investigation and resources, project administration, writing and original draft preparation, M.N. and M.A.; investigation, writing—review and editing writing and supervision, A.N.P., D.F. and E.V.; visualization, P.G. and M.K. All authors have read and agreed to the published version of the manuscript.

Funding

This research received no external funding.

Conflicts of Interest

The authors declare no conflict of interest.

References

  1. Wang, J.X.; Shen, J.; Lei, C.S.; Feng, Q. Volatile organic compound and formaldehyde emissions from Populus davidiana wood treated with low molecular weight urea-formaldehyde resin. J. Environ. Biol. 2014, 35, 989–994. [Google Scholar] [PubMed]
  2. Zhu, X.; Xu, E.; Lin, R.; Wang, X. Decreasing the formaldehyde emission in urea-formaldehyde using modified starch by strongly acid process. J. Appl. Polym. Sci. 2014, 131, 2–7. [Google Scholar] [CrossRef]
  3. Gadhave, R.V.; Mahanwar, P.A.; Gadekar, P.T. Starch-based adhesives for wood/wood composite bonding: Review. Open J. Polym. Chem. 2017, 7, 19–32. [Google Scholar] [CrossRef]
  4. Monroy, Y.; Rivero, S.; Garcia, M.A. Sustainable panels design based on modified cassava starch bioadhesives and wood processing byproducts. Ind. Crops Prod. 2019, 137, 171–179. [Google Scholar] [CrossRef]
  5. Amini, M.H.M.; Hashim, R.; Sulaiman, N.S.; Mohamed, M.; Sulaiman, O. Citric acid-modified starch as an environmentally friendly binder for wood composite making. Bioresources 2020, 15, 4234–4238. [Google Scholar] [CrossRef]
  6. Hogger, E.M.; van Herwijnen, H.W.G.; Moser, J.; Kantner, W.; Konnerth, J. Systematic assessment of wheat extenders in condensation resins for plywood production: Part I—Physico-chemical adhesive properties. J. Adhes. 2021, 97, 1404–1422. [Google Scholar] [CrossRef]
  7. Arias, A.; Feijoo, G.; Moreira, M.T. Evaluation of starch as an environmental-friendly bioresource for the development of wood bioadhesives. Molecules 2021, 26, 4526. [Google Scholar] [CrossRef]
  8. Islam, M.N.; Faruk, M.O.; Rana, M.N.; Das, A.K.; Habib, A. Preparation and evaluation of rice bran-modified urea formaldehyde as environmental friendly wood adhesive. Glob. Chall. 2021, 27, 2000044. [Google Scholar] [CrossRef]
  9. Amini, M.H.M.; Hashim, R.; Sulaiman, N.S.; Sulaiman, O.; Selamat, M.E. Glutardialdehyde modified starch from waste oil palm trunks as a binder for wood composite making. Int. J. Adhes. Adhes. 2021, 104, 102757. [Google Scholar] [CrossRef]
  10. Zakaria, R.; Bawon, P.; Lee, S.H.; Salim, S.; Lum, W.C.; Al-Edrus, S.S.O.; Ibrahim, Z. Properties of particleboard from oil palm biomasses bonded with citric acid and tapioca starch. Polymers 2021, 13, 3494. [Google Scholar] [CrossRef]
  11. Luo, F.-X.; Fu, X.; Huang, Q.; Li, L. Properties and cross linking mechanism of starches oxidized by sodium hypochlorite at low level. Nat. Sci. 2006, 34, 79–83. [Google Scholar]
  12. Sukhija, S.; Singh, S.; Riar, C.S. Effect of oxidation, cross-linking and dual modification on physicochemical, crystallinity, morphological, pasting and thermal characteristics of elephant foot yam (Amorphophallus paeoniifolius) starch. Food Hydrocoll. 2015, 55, 56–64. [Google Scholar] [CrossRef]
  13. Patel, K.F.; Mehta, H.U.; Srivastava, H.C. Kinetics and mechanism of oxidation of starch with sodium hypochlorite. J. Appl. Polym. Sci. 1974, 18, 389–399. [Google Scholar] [CrossRef]
  14. Forssell, P.; Hamunen, A.; Autio, M.K.; Suortti, P.; Poutanen, K. Hypochlorite oxidation of barley and potato starch. Starch 1995, 47, 371–377. [Google Scholar] [CrossRef]
  15. Karazi, S.M.; Issa, A.; Brabazon, D. Comparison of ANN and DoE for the prediction of laser-machined micro-channel dimensions. Opt. Lasers Eng. 2009, 47, 956–964. [Google Scholar] [CrossRef]
  16. Kazi, M.K.; Eljack, F.; Mahdi, E. Optimal filler content for cotton fiber/PP composite based on mechanical properties using artificial neural network. Compos. Struct. 2020, 251, 112654. [Google Scholar] [CrossRef]
  17. Sharma, A.; Kumar, S.A.; Kushvaha, V. Effect of aspect ratio on dynamic fracture toughness of particulate polymer composite using artificial neural network. Eng. Fract. Mech. 2020, 228, 106907. [Google Scholar] [CrossRef]
  18. Demir, A.; Aydin, I. Modeling the thermal conductivity of veneer sheets the different moisture content using artificial neural network. Proligno 2021, 17, 3–12. [Google Scholar]
  19. De Palacios, P.; Fernández, F.G.; García-Iruela, A.; González-Rodrigo, B.; Esteban, L.G. Study of the influence of the physical properties of particleboard type P2 on the internal bond of panels using artificial neural networks. Comput. Electron. Agric. 2018, 155, 142–149. [Google Scholar] [CrossRef]
  20. Aysenur, G.; Derya, U.; Sibel, Y. Application of artificial neural network to predict the effect of paraffin addition on water absorption and thickness swelling of MDF. Drv. Ind. 2019, 70, 247–255. [Google Scholar] [CrossRef]
  21. Mei, H.; Lang, L.; Li, X.; Mirza, H.A.; Yang, X. Prediction of tensile strength and deformation of diffusion bonding joint for inconel 718 using deep neural network. Metals 2020, 10, 1266. [Google Scholar] [CrossRef]
  22. Silva, F.A.N.; Delgado, J.M.P.Q.; Cavalcanti, R.S.; Azevedo, A.C.; Guimarães, A.S.; Lima, A.G.B. Use of nondestructive testing of ultrasound and artificial neural networks to estimate compressive strength of concrete. Buildings 2021, 11, 44. [Google Scholar] [CrossRef]
  23. Kuakpetoon, D.; Wang, Y.J. Characterization of different starches oxidized by hypochlorite. Starch 2001, 53, 211–218. [Google Scholar] [CrossRef]
  24. Aini, N.; Purwiyatno, H. Gelatinization properties of white maize starch from three varieties of corn subject to oxidized and acetylated-oxidized modification. Int. Food Res. J. 2010, 17, 961–968. [Google Scholar]
  25. Nazerian, M.; Razavi, S.A.; Partoviniya, A.; Vatankhah, E.; Razmpour, Z. Comparison of different modeling methods toward predictive capability evaluation of the bonding strength of wood laminated products. Proc. Inst. Mech. Eng. Part E J. Process. Mech. Eng. 2021, 236, 991–1003. [Google Scholar] [CrossRef]
  26. EN 302-1:2013; Adhesives for Load-Bearing Timber Structures—Test Methods—Part 1: Determination of Longitudinal Tensile Shear Strength. European Committee for Standardization: Brussels, Belgium, 2013.
  27. Zorba, T.; Papadopoulou, E.; Hatjiissaak, A.; Paraskevopoulos, K.M.; Chrissafis, K. Urea-formaldehyde resins characterized by thermal analysis and FTIR method. J. Therm. Anal. Calorim. 2008, 92, 29–33. [Google Scholar] [CrossRef]
  28. Sheng, Y.; Wang, Q.H.; Xu, X.C.; Jiang, W.Y.; Gan, S.C.; Zuo, H.F. Oxidation of cornstarch using oxygen as oxidant without catalyst. LWT-Food Sci. Technol. 2011, 44, 139–144. [Google Scholar] [CrossRef]
  29. Lin, Q.; Pan, J.; Lin, Q.; Liu, Q. Microwave synthesis and adsorption performance of a novel crosslinked starch microsphere. J. Hazard. Mater. 2013, 263, 517–524. [Google Scholar] [CrossRef]
  30. Zhao, X.; Peng, L.; Wang, H.; Wang, Y.; Zhang, H. Environment-friendly urea-oxidized starch adhesive with zero formaldehyde-emission. Carbohydr. Polym. 2018, 181, 1112–1118. [Google Scholar] [CrossRef]
  31. Jiang, X.; Li, C.; Chi, Y.; Yan, J. TG-FTIR study on urea-formaldehyde resin residue during pyrolysis and combustion. J. Hazard. Mater. 2010, 173, 205–210. [Google Scholar] [CrossRef]
  32. Abdullah, A.H.D.; Chalimah, S.; Primadona, I.; Hanantyo, M.H.G. Physical and chemical properties of corn, cassava, and potato starch. IOP Conf. Ser. Earth Environ. Sci. 2018, 160, 012003. [Google Scholar] [CrossRef]
  33. Roumeli, E.; Papadopoulou, E.; Pavlidou, E.; Bikiaris, D.; Paraskevopoulos, K.M.; Chrissafis, K. Synthesis, characterization and thermal analysis of urea–formaldehyde/nanoSiO2 resins. Thermochim. Acta 2012, 527, 33–39. [Google Scholar] [CrossRef]
  34. Lubis, M.A.R.; Park, B.D. Influence of initial molar ratios on the performance of low molar ratio urea-formaldehyde resin adhesives. J. Korean Wood Sci. Technol. 2020, 48, 136–153. [Google Scholar] [CrossRef]
  35. Sun, Q.N.; Hse, C.Y.; Shupe, T.F. Characterization and performance of melamine enhanced urea formaldehyde resin for bonding southern pine particleboard. J. Appl. Polym. Sci. 2011, 119, 3538–3543. [Google Scholar] [CrossRef]
  36. Tang, M.; Wen, S.; Liu, D. Effects of heating- or caustic-digested starch on its flocculation on hematite. Miner. Process. Extr. Metall. Rev. 2016, 37, 49–57. [Google Scholar] [CrossRef]
  37. Golova, O.P.; Nosova, N.I. Degradation of cellulose by alkaline oxidation. Russ. Chem. Rev. 1973, 42, 327–338. [Google Scholar] [CrossRef]
  38. Wang, Z.; Gu, Z.; Hong, Y.; Cheng, L.; Li, Z. Bonding strength and water resistance of starch-based wood adhesive improved by silica nanoparticles. Carbohydr. Polym. 2011, 86, 72–76. [Google Scholar] [CrossRef]
  39. Adebowale, K.O.; Lawal, O.S. Functional properties and retrogradation behaviour of native and chemically modified starch of mucuna bean (Mucuna pruriens). J. Sci. Food Agric. 2003, 83, 1541–1546. [Google Scholar] [CrossRef]
  40. Garza-Ulloa, J. Application of Mathematical Models in Biomechatronics: Artificial Intelligence and Time-Frequency Analysis; Elsevier Inc.: Amsterdam, The Netherlands, 2018; pp. 373–524. [Google Scholar]
  41. Canakci, A.; Ozsahin, S.; Varol, T. Modeling the influence of a process control agent on the properties of metal matrix composite powders using artificial neural networks. Powder Technol. 2012, 228, 26–35. [Google Scholar] [CrossRef]
  42. Ma, X.; Chang, P.R.; Yang, J.; Yu, J. Preparation and properties of glycerol plasticized-pea starch/zinc oxide-starch bionanocomposites. Carbohydr. Polym. 2009, 75, 472–478. [Google Scholar] [CrossRef]
  43. Yu, J.; Yang, J.; Liu, B.; Ma, X. Preparation and characterization of glycerol plasticized-pea starch/ZnO carboxy methyl cellulose sodium nanocomposites. Bioresour. Technol. 2009, 100, 2832–2841. [Google Scholar] [CrossRef]
  44. Abdullah, A.H.D.; Putri, O.D.; Fikriyyah, A.K.; Nissa, R.C.; Hidayat, S.; Septiyanto, R.F.; Karina, M.; Satoto, R. Harnessing the excellent mechanical, barrier and antimicrobial properties of zinc oxide (ZnO) to improve the performance of starch-based bioplastic. Polym.-Plast. Technol. Mater. 2020, 59, 1259–1267. [Google Scholar] [CrossRef]
  45. Basta, A.H.; El-Saied, H.; Winandy, J.E.; Sabo, R. Preformed amide-containing biopolymer for improving the environmental performance of synthesized urea–formaldehyde in agro-fiber composites. J. Polym. Environ. 2011, 19, 405–412. [Google Scholar] [CrossRef] [Green Version]
  46. Luo, D.; Li, Y.; Xu, B.; Ren, G.; Li, P.; Han, S.; Liu, J. Effects of inulin with different degree of polymerization on gelatinization and retrogradation of wheat starch. Food. Chem. 2017, 229, 35–43. [Google Scholar] [CrossRef]
  47. Liu, W.; Zuo, Y.; Wu, Y.; Xiao, J.; Zhu, Y.; Zhao, X. Effect of acid hydrolysis and oxidation on the properties of dialdehyde starch. Mater. Rev. 2017, 31, 41–45. [Google Scholar]
  48. Frihart, C.R.; Pizzi, A.; Xi, X.; Lorenz, L.F. Reactions of soy flour and soy protein by non-volatile aldehydes generation by specific oxidation. Polymers 2019, 11, 1478. [Google Scholar] [CrossRef]
  49. Fonseca, L.M.; Gonçalves, J.R.; El-Halal, S.L.M.; Pinto, V.Z.; Dias, A.R.G.; Jacques, A.C.; Zavareze, E.R. Oxidation of potato starch with different sodium hypochlorite concentrations and its effect on biodegradable films. LWT-Food. Sci. Technol. 2015, 60, 714–720. [Google Scholar] [CrossRef]
  50. Luo, J.; Zhang, J.; Gao, Q.; Mao, A.; Li, J. Toughening and enhancing melamine–urea–formaldehyde resin properties via in situ polymerization of dialdehyde starch and microphase separation. Polymers 2019, 11, 1167. [Google Scholar] [CrossRef]
  51. Zhang, D.S.; Zhang, Y.R.; Wang, X.L.; Wang, Y.Z. High carbonyl content oxidized starch prepared by hydrogen peroxide and its thermoplastic application. Starch 2009, 61, 646–655. [Google Scholar] [CrossRef]
  52. Dias, A.R.G.; da Rosa-Zavareze, E.; Helbig, E.; de Moura, F.A.; Vargas, C.G.; Ciacco, C.F. Oxidation of fermented cassava starch using hydrogen peroxide. Carbohydr. Polym. 2011, 86, 185–191. [Google Scholar] [CrossRef]
  53. Rachtanapun, P.; Simasatitkul, P.; Chaiwan, W.; Watthanaworasakun, Y. Effect of sodium hydroxide concentration on properties of carboxymethyl rice starch. Int. Food Res. J. 2012, 19, 923–931. [Google Scholar]
  54. Sulaiman, N.S.; Hashim, R.; Sulaiman, O.; Nasir, M.; Amini, M.H.M.; Hiziroglu, S. Partial replacement of urea-formaldehyde with modified oil palm starch based adhesive to fabricate particleboard. Int. J. Adhes. Adhes. 2018, 84, 1–8. [Google Scholar] [CrossRef]
  55. Pizzi, A. Phenolic and tannin-based adhesive resins by reactions of coordinated metal ligands. II. Tannin adhesive preparation, characteristics, and application. J. Appl. Polym. Sci. 1979, 24, 1257–1268. [Google Scholar] [CrossRef]
  56. Fan, D.B.; Li, J.Z.H.; Chang, J.M.; Gou, J.S.H.; Jiang, J.X. Chemical structure and curing behavior of phenol-urea-formaldehyde condensed resins of high urea content. J. Adhes. Sci. Technol. 2009, 23, 1787–1797. [Google Scholar] [CrossRef]
  57. Fan, D.B.; Chang, J.M.; Li, J.Z.; Xia, B.H.; Sang, Z.T. Cure properties and adhesive performances of cure-accelerated phenol-urea-formaldehyde resins. Eur. J. Wood Prod. 2011, 69, 213–220. [Google Scholar] [CrossRef]
  58. Younesi-Kordkheili, H. Improving physical and mechanical properties of new lignin-urea-glyoxal resin by nanoclay. Eur. J. Wood Wood Prod. 2017, 75, 885–891. [Google Scholar] [CrossRef]
  59. Bardak, T.; Sozen, E.; Kayahan, K.; Bardak, S. The impact of nanoparticles and moisture content on bonding strength of urea formaldehyde resin adhesive. Drv. Ind. 2018, 69, 247–252. [Google Scholar] [CrossRef]
  60. Veigel, S.; Muller, U.; Keckes, J.; Obersriebnig, M.; Gindl-Altmutter, W. Cellulose nanofibrils as filler for adhesives: Effect on specific fracture energy of solid wood-adhesive bonds. Cellulose 2011, 18, 1227–1237. [Google Scholar] [CrossRef]
  61. Moubarik, A.; Charrier, B.; Allal, A.; Charrier, F.; Pizzi, A. Development and optimization of a new formaldehyde-free cornstarch and tannin wood adhesive. Eur. J. Wood Wood Prod. 2009, 68, 167–177. [Google Scholar] [CrossRef]
  62. Soykeabkaew, N.; Thanomsilp, C.; Suwantong, O.A. A review: Starch-based composite foams. Compos. Part A Appl. Sci. Manuf. 2015, 78, 246–263. [Google Scholar] [CrossRef]
  63. Yongfeng, A.; Jane, J. Gelatinization and rheological properties of starch. Starch 2015, 67, 213–224. [Google Scholar] [CrossRef]
  64. Stoeckel, F.; Konnerth, J.; Gindl-Altmutter, W. Mechanical properties of adhesives for bonding wood—A review. Int. J. Adhes. Adhes. 2013, 45, 32–41. [Google Scholar] [CrossRef]
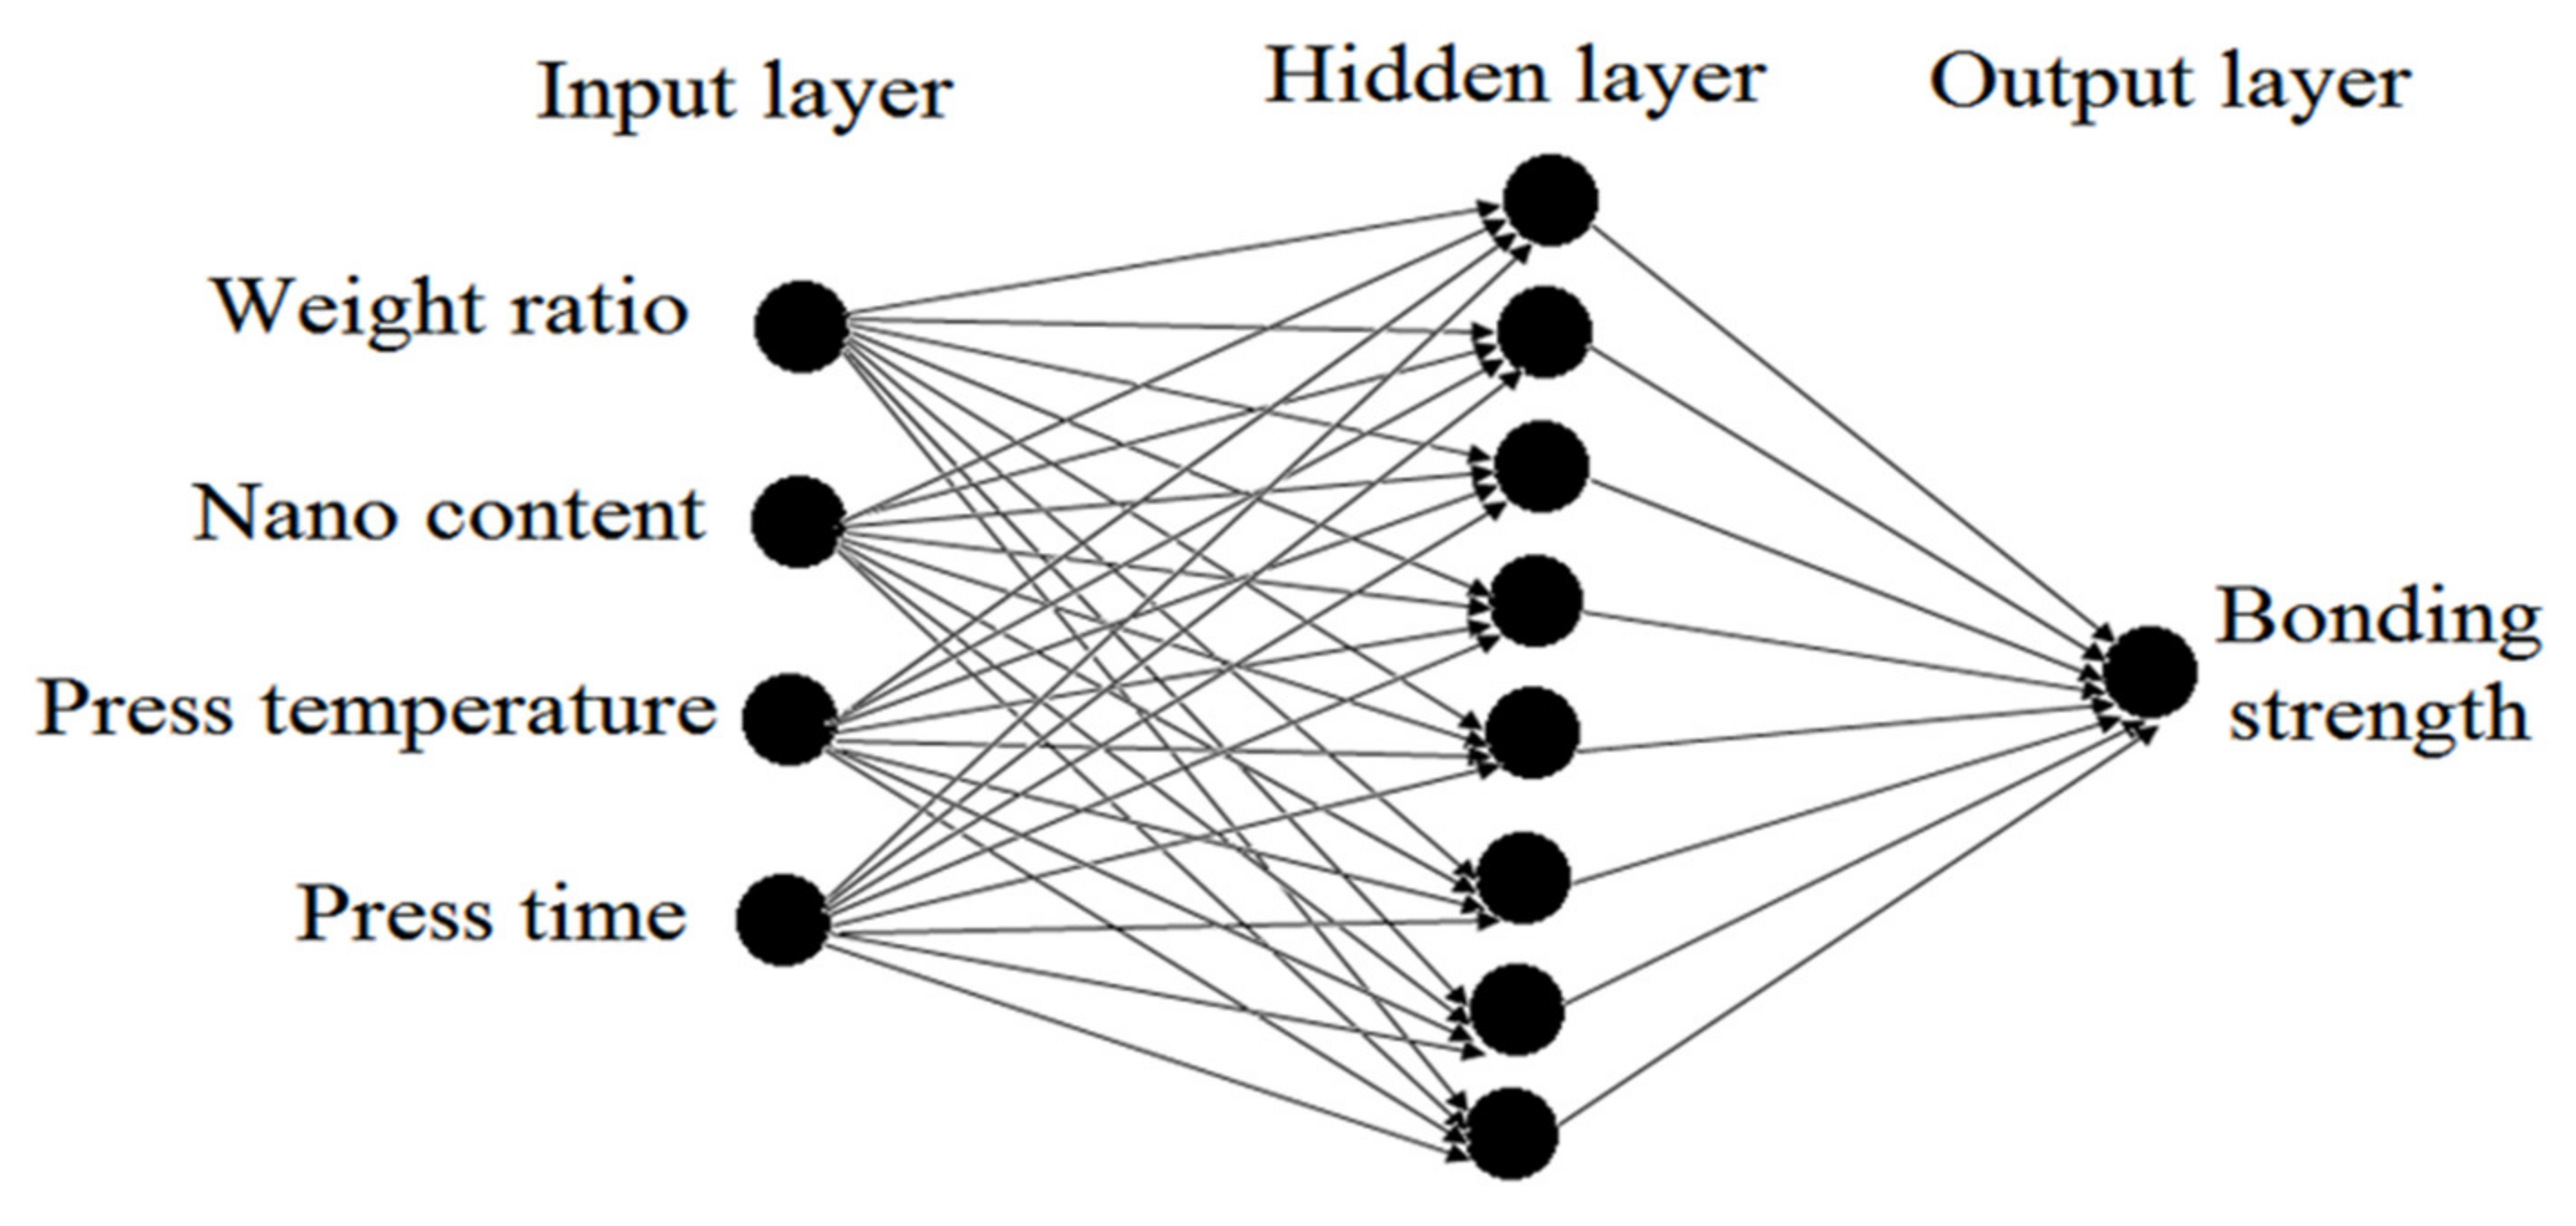
Figure 1. Actual architecture of ANN model.
Jcs 06 00279 g001
Figure 2. Infrared spectrograms of natural corn starch (St.), oxidized starch (MSt.), urea formaldehyde resin (UF), and mix of oxidized starch and UF (MSUF) adhesives.
Jcs 06 00279 g002
Figure 3. TGA (a) and DTG (b) curves of natural starch (US), modified starch (MS), UF resin, and UF resin (30%) + modified starch adhesive (70%) (MSUF).
Jcs 06 00279 g003
Figure 4. Training errors of the ANN used in bonding strength prediction.
Jcs 06 00279 g004
Figure 5. The error estimated to predict the response during ANN modeling.
Jcs 06 00279 g005
Figure 6. ANN predictions of bonding strength vs. experimental data for test (a), training (b), and all (c) data sets.
Jcs 06 00279 g006
Figure 7. Comparison of the measured values and the values predicted by ANN for bonding strength: testing data set (a), training data set (b).
Jcs 06 00279 g007
Figure 8. Interactive effect of independent variables on bonding strength: MSt. × NC (a), MSt. × PTim (b), NC × PTem (c), NC × PTim (d) and PTem × PTim (e).
Jcs 06 00279 g008
Figure 9. The optimal values of the application of the input variables to achieve the best response based on the developed ANN model.
Jcs 06 00279 g009
Table 1. Coded and actual levels of variables for experimental design.
VariablesUnitCoded Values of Variables
−2−1012
Modified starch (x1)%1030507090
Nano content (x2)%01234
Press temperature (x3)°C120140160180200
Press time (x4)min1416182022
Table 2. Experimental design: coded and actual values of inputs.
RunCoded ValuesActual Values
x1x2x3x4Modified Starch (St., %)Nano Content (NC, %)Press Temperature (PTem, °C)Press Time (PTim, min)
1−111130 318020
2000250216022
3111170318020
4200090216018
5−1−1−1130114020
611−1−170314016
7000050216018
8−11−1−130314016
9−1−11130118020
10−200010216018
111−1−1170114020
12−11−1130314020
131−1−1−170114016
14111−170318016
15−1−11−130118016
1611−1170314020
171−11170118020
18020050416018
191−11−170118016
2000−2050212018
210−20050016018
22002050220018
23000−250216014
24−111−130318016
25−1−1−1−130114016
Table 3. Experimental values of bonding strength and values predicted by ANN.
RunExperimental
Value (MPa)
Predicted
Value (MPa)
15.08 (0.7)5.07
26.10 (0.1)6.25
35.22 (0.8)5.00
45.80 (0.1)5.80
56.62 (0.1)6.20
65.06 (0.4)5.02
75.55 (0.3)5.25
85.50 (0.7)5.25
94.39 (0.8)4.39
105.00 (1.0)5.00
115.74 (0.6)5.21
125.00 (0.4)5.00
137.20 (1.1)6.90
145.53 (0.1)5.41
156.05 (0.1)6.10
165.06 (0.7)5.10
176.67 (0.3)6.50
184.12 (0.2)4.37
194.50 (0.6)5.25
205.00 (0.4)5.28
216.82 (1.0)6.10
225.57 (0.4)5.28
236.19 (0.9)5.97
244.54 (0.6)4.58
255.94 (0.4)6.00
Table 4. ANOVA for response surface quadratic model.
SourceSum of SquaresdfMean SquareF-Valuep-Value
Model25.783.219.32<0.0001
x14.2214.2212.20.00107
x1x22.6912.697.810.00761
x1x42.5712.577.450.009
x2x33.4613.46100.00276
x2x41.2511.253.640.0429
x3x46.4216.4218.6<0.0001
x122.6912.697.790.00768
x422.9612.968.580.00532
Residual15.5450.345
Lack of Fit8.7190.4581.750.0924
Pure Error6.82260.262
R20.624Adj. R2 0.557
Pred. R20.481Adeq. precision10.5
Table 5. Performance criteria used for predicting bonding strength by ANN.
Performance CriteriaData Set (Bonding Strength, MPa)
TrainingValidationTestingAll
R20.81280.90230.93880.7921
MAPE3.826310.20745.52345.0231
RMSE0.34220.60230.39650.3993
MAE0.20760.43000.32480.2579
Publisher’s Note: MDPI stays neutral with regard to jurisdictional claims in published maps and institutional affiliations.