Article

Microstructure-Free Finite Element Modeling for Elasticity Characterization and Design of Fine-Particulate Composites

Department of Mechanical Engineering, University of Manitoba, Winnipeg, MB R3T 2N2, Canada
J. Compos. Sci. 2022, 6(2), 35; https://doi.org/10.3390/jcs6020035
Submission received: 28 December 2021 / Revised: 12 January 2022 / Accepted: 18 January 2022 / Published: 20 January 2022
(This article belongs to the Special Issue Characterization and Modelling of Composites, Volume II)

Abstract

:
The microstructure-based finite element modeling (MB-FEM) of material representative volume element (RVE) is a widely used tool in the characterization and design of various composites. However, the MB-FEM has a number of deficiencies, e.g., time-consuming in the generation of a workable geometric model, challenge in achieving high volume-fractions of inclusions, and poor quality of finite element mesh. In this paper, we first demonstrate that for particulate composites the particle inclusions have homogeneous distribution and random orientation, and if the ratio of particle characteristic length to RVE size is adequately small, elastic properties characterized from the RVE are independent of particle shape and size. Based on this fact, we propose a microstructure-free finite element modeling (MF-FEM) approach to eliminate the deficiencies of the MB-FEM. The MF-FEM first generates a uniform mesh of brick elements for the RVE, and then a number of the elements, with their total volume determined by the desired volume fraction of inclusions, is randomly selected and assigned with the material properties of the inclusions; the rest of the elements are set to have the material properties of the matrix. Numerical comparison showed that the MF-FEM has a similar accuracy as the MB-FEM in the predicted properties. The MF-FEM was validated against experimental data reported in the literature and compared with the widely used micromechanical models. The results show that for a composite with small contrast of phase properties, the MF-FEM has excellent agreement with both the experimental data and the micromechanical models. However, for a composite that has large contrast of phase properties and high volume-fraction of inclusions, there exist significant differences between the MF-FEM and the micromechanical models. The proposed MF-FEM may become a more effective tool than the MB-FEM for material engineers to design novel composites.

1. Introduction

Particulate composites are widely used in industrial products and engineering structures due to their merits, such as ease-of-manufacturing and great design flexibility. At the length scale of material representative volume element (RVE), the behavior of a particulate composite can be usually considered as homogeneous and isotropic if (1) the geometric aspect ratio of inclusions is small, (2) both the distribution and orientation of inclusions are statistically homogeneous, and (3) the characteristic dimension of inclusions is adequately small compared with the size of RVE. An important task in the design of composites is to predict their elastic properties based on phase properties and volume fractions. A number of methods is available for the prediction, and they are often classified into experimental, analytical, and numerical categories. Experimental methods are direct and reliable, but they are also expensive and time consuming. Analytical solutions developed from micromechanics models are convenient and efficient; however, they have various limitations in application because they are based on special assumptions regarding composite microstructure. Numerical methods, mainly represented by finite element modeling of RVE, have a number of advantages over the other two categories of methods. They are more efficient than experimental methods, and they do not make any special assumption about composite microstructure. The microstructure-based finite element modeling (MB-FEM) of material RVE has played an important role for material engineers to understand the micromechanics of composite cracking and debonding, which often initiate and develop in the phase materials or at their interfaces [1,2,3]. An accurate representation of the composite microstructure is critical in the finite element analysis of microscopic damage.
However, for the design of a novel composite, the main interest is in the elastic properties at the macroscopic level, rather than the interactions of phase materials at the microscopic level. The commonly considered design variables are elastic properties and volume fractions of phase materials. The design process is often iterative and involves a large number of finite element analyses of intermediate designs; the conventional MB-FEM has a number of deficiencies for this purpose. First, the creation of a workable geometric model for the RVE microstructure is often tedious and time-consuming. A number of algorithms has been developed to generate RVE of particulate composites, e.g., [4,5,6,7,8,9,10,11,12,13] among others. These algorithms either have difficulty to accommodate a high volume-fraction of inclusions [7,8,9,13], or have to use a time-consuming iterative process to achieve a high volume-fraction with the sacrifice of microstructure randomness [10,11,12]. It should be mentioned that the majority of the algorithms are developed for simple inclusion shapes such as sphere, ellipsoid, and cylinder. Inclusion shapes in actual composite materials are often irregular, which would further complicate the creation of valid RVE geometric models. Geometric models of such composites usually contain a large number of degenerated and small geometric entities. Therefore, even with the success of creating an RVE geometric model, there are still challenges in the generation of valid and high-quality finite element meshes, because the degenerated and small entities in the geometric models either prevent the generation of finite element meshes or result in poor-quality elements. Iterative mesh adaptation algorithms usually have to be used to improve mesh quality, but a satisfactory quality is still not guaranteed.
To eliminate the limitations of the conventional MB-FEM for the characterization and design of fine-particulate composites, we first demonstrate that if the size ratio of inclusion to RVE is adequately small, elastic properties of RVE computed by finite element modeling are independent of inclusion shape and size. Based on this fact, we propose microstructure-free finite element modeling (MF-FEM). We validate the MF-FEM against experimental data reported in the literature and compare the MF-FEM with the widely used micromechanical models.

2. Effect of Inclusion Shape and Size on Elastic Properties of Particulate Composites

To study the effect of inclusion shape and size on the elastic properties of particulate composites, the following assumptions are made: (1) the materials of the matrix and the inclusions are homogeneous, isotropic, and perfectly bond to each other; (2) the distribution and orientation of inclusions of small aspect ratio are statistically homogeneous; (3) the applied loading only introduces elastic deformation. Under the above assumptions, we hypothesize that for a fixed volume-fraction of inclusions, if the ratio of inclusion characteristic length to RVE size is adequately small, composite elastic properties such as Young’s modulus, Poisson’s ratio, and shear modulus are independent of inclusion shape and size, and also independent of loading orientation. To verify the above hypothesis, a series of particulate-composite RVE models, which are different from each other only by their inclusion shape and size, are constructed and analyzed. The models are described as follows:
  • All RVE models are in a cubic shape, and the sides have a length of 100 units. Since inclusion-to-RVE size ratio is of interest, the unit can be in any length from nanometer to meter.
  • The composite is a particulate-filled glassy polymer [14]. The matrix material has Young’s modulus Em = 2.68 GPa and Poisson’s ratio Vm = 0.394, and the inclusion material has Young’s modulus Ei = 70.0 GPa and Poisson’s ratio Vi = 0.23.
  • The volume fraction of inclusions in all models is fixed at 30%.
  • The inclusions in a model have the same shape, i.e., either spheroid, almond-shaped, or pill-shaped.
  • The inclusions in a model have the same size. The inclusion-to-RVE size ratio is gradually reduced from 0.8 to 0.02 in the series of models, by decreasing inclusion sizes.
A set of such models is shown in Figure 1.
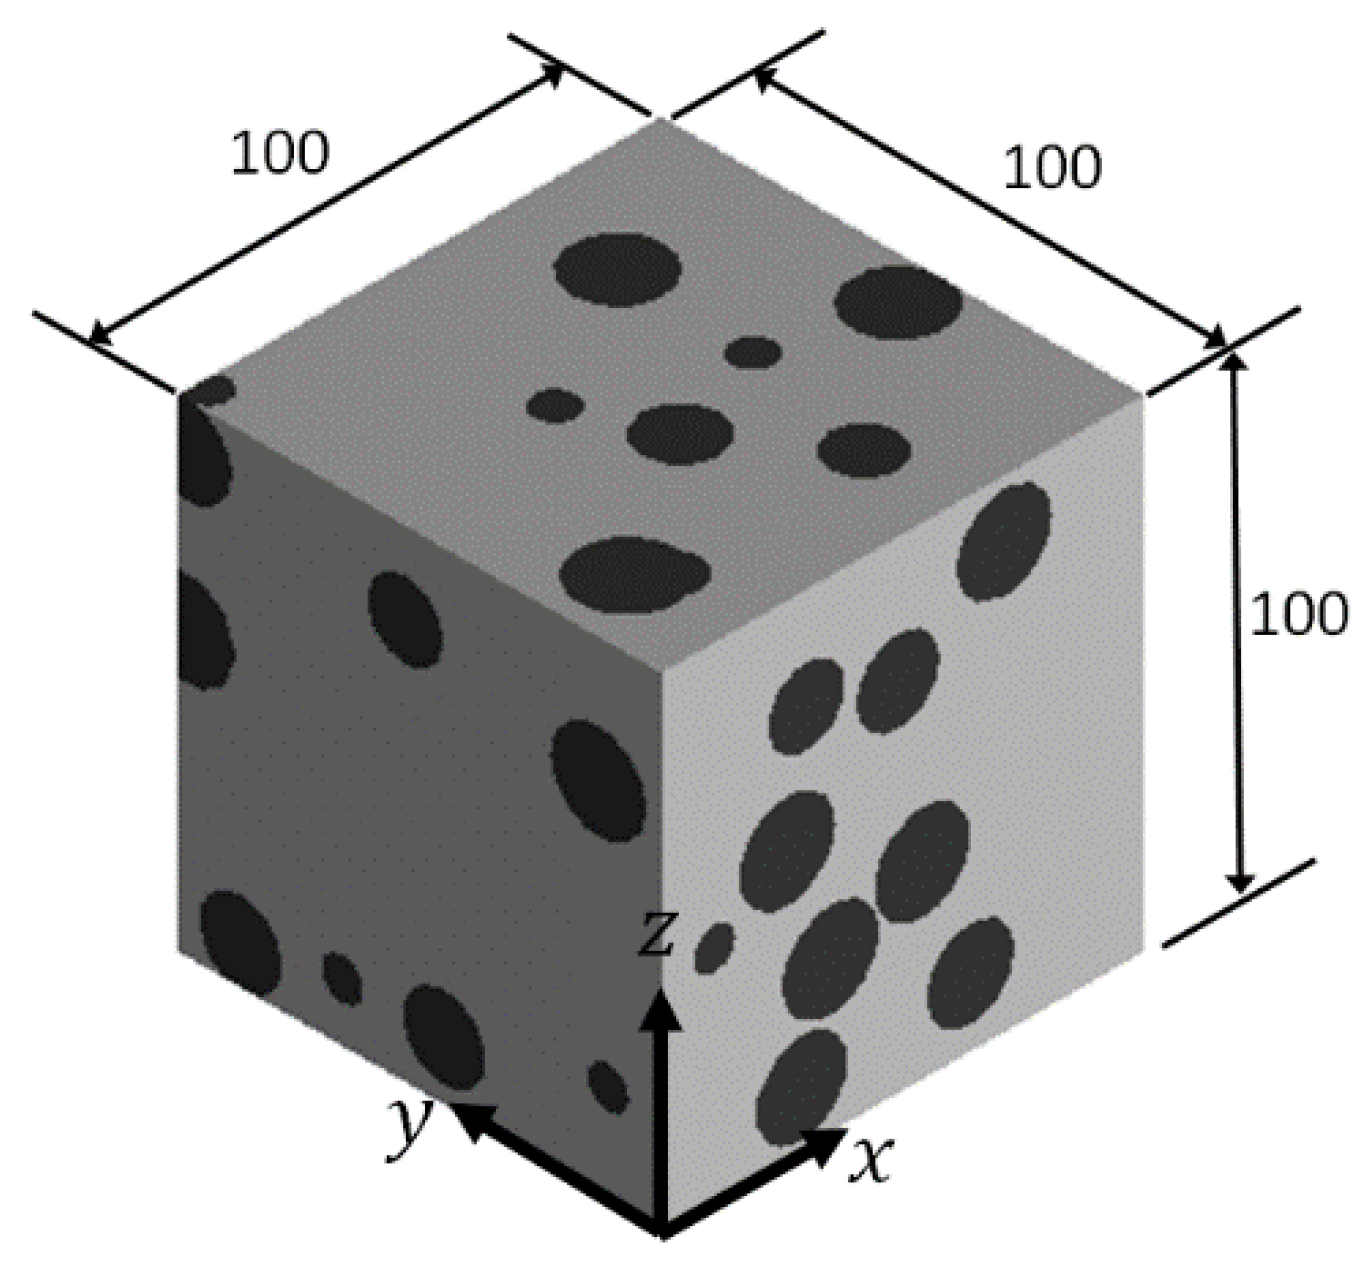
RVE Young’s modulus, Poisson’s ratio, and shear modulus are characterized by the conventional MB-FEM. The coordinate system used in the finite element modeling is illustrated in Figure 2. Boundary conditions for characterizing the elastic properties are listed in Table 1.
Based on the mean-field homogenization theory [15], RVE Young’s modulus ( E i ), shear modulus ( G i j ), and Poisson’s ratio ( ν i j ) are determined from RVE average stresses ( σ ¯ i ,   τ ¯ i j ) and average strains ( ε ¯ i ,   γ ¯ i j ):
E i = σ ¯ i ε ¯ i , ( i = x , y , z )
G i j = τ ¯ i j γ ¯ i j , ( i , j = x , y , z )
ν i j = ε ¯ j ε ¯ i , ( i , j = x , y , z )
The average stresses and strains are calculated as
σ ¯ i = 1 V V σ i   d V , ε ¯ i = 1 V V ε i   d V , τ ¯ i j = 1 V V τ i j   d V , γ ¯ i j = 1 V V γ i j   d V , ( i , j = x , y , z )
In Equation (4), σ i , ε i , τ i j , and γ i j are, respectively, the normal stress, normal strain, shear stress, and shear strain that are determined by the finite element modeling; V is the volume of the RVE.
All finite element analyses in this study were conducted using commercial software, ANSYS Mechanical APDL (2020 R1). For each model, the mean value ( P ¯ ) and standard deviation ( σ ) of Young’s moduli, shear moduli, and Poisson’s ratios characterized from the three loading orientations were calculated, i.e.,
P ¯ = P x + P y + P z 3 , σ = ( P x P ¯ ) 2 + ( P y P ¯ ) 2 + ( P z P ¯ ) 2 3
where P represents one of the three elastic properties. Variations of the mean values and standard deviations with the inclusion-to-RVE size ratio are shown in Figure 3.
The following observations can be made from the results shown in Figure 3:
  • With the inclusion-to-RVE size ratio approximately smaller than 0.04, the RVE elastic properties are almost not affected by the inclusion shape and size.
  • Anisotropy in the RVE elastic properties, which is measured by the error bars in Figure 3, is gradually reduced and then disappears with the decreased inclusion-to-RVE size ratio.
It is not surprising that the hypothesis is valid, because it is the fundamental assumption adopted in the continuum mechanics of composite materials, and it has been demonstrated to be true in a large number of previous studies, which were conducted on different inclusion shapes and phase properties, e.g., [16,17,18,19,20,21,22,23] among others. The threshold of inclusion-to-RVE size ratio referred in the above is equivalent to the critical RVE size used in other studies. Trias et al. [21] reported that for a typical unidirectionally carbon-fiber-reinforced polymer, to properly represent the random distribution of fibers in the transverse plane, the minimum size of RVE should be 50 times the fiber radius. Harper et al. [16] showed that for a planar model of discontinuous carbon fiber composites, the convergence of results from multiple realizations (i.e., models of the same volume fraction) is achieved at RVE edge lengths that are four times the fiber length, irrespective of fiber volume fraction; however, if only one realization is allowed, the ratio of fiber length to RVE size must be reduced to 0.03. The studies show that the averaging of multiple realizations has the effect of reducing anisotropy and thus underestimating the effect of RVE size or inclusion-to-RVE size ratio. For this reason, averaging of multiple realizations of the same volume fraction is not used in this study, and the results in Figure 3 were produced from one realization. It should be pointed out that the critical size of particulate-composite RVE can be significantly different in different regimes, for example, linear vs. nonlinear properties [22].

3. Microstructure-Free Finite Element Modeling of Particulate-Composites

The validity of the hypothesis demonstrated in the previous section justifies the idea of microstructure-free finite element modeling (MF-FEM) for particulate composites. Now that RVE properties are independent of inclusion shape and size if the inclusion-to-RVE size ratio is adequately small, theoretically we can consider any inclusion shape and size that are convenient for the finite element modeling. In this section, we propose a microstructure-free finite element modeling procedure for the characterization and design of two-phase particulate composites. The procedure is similar to the conventional MB-FEM. The only difference is in the representation of inclusions. A geometric model of the RVE microstructure is not needed; instead, the inclusions are represented by finite elements. The procedure is described below.
  • A cubic RVE with side length of 100 units is constructed. The unit can be at any length scale from nanometer to meter, depending on the composite material to be studied.
  • The RVE is meshed with brick elements of the same size, which is determined by the critical inclusion-to-RVE size ratio, i.e., 0.04 to 0.02 times the RVE side length, as discussed in the previous section. All the elements are first assigned with the properties of the matrix material.
  • Then, a number of the elements is randomly selected and re-assigned with the properties of the inclusion material. The number of the selected elements is determined by the desired volume fraction of inclusions and the volume of each element. Samples of such microstructure-free finite element models are shown in Figure 4.
  • Then, the boundary conditions described in Table 1 are applied, and finite element analyses are conducted.
  • RVE properties such as Young’s modulus, shear modulus, and Poisson’s ratio are calculated using Equations (1)–(4).
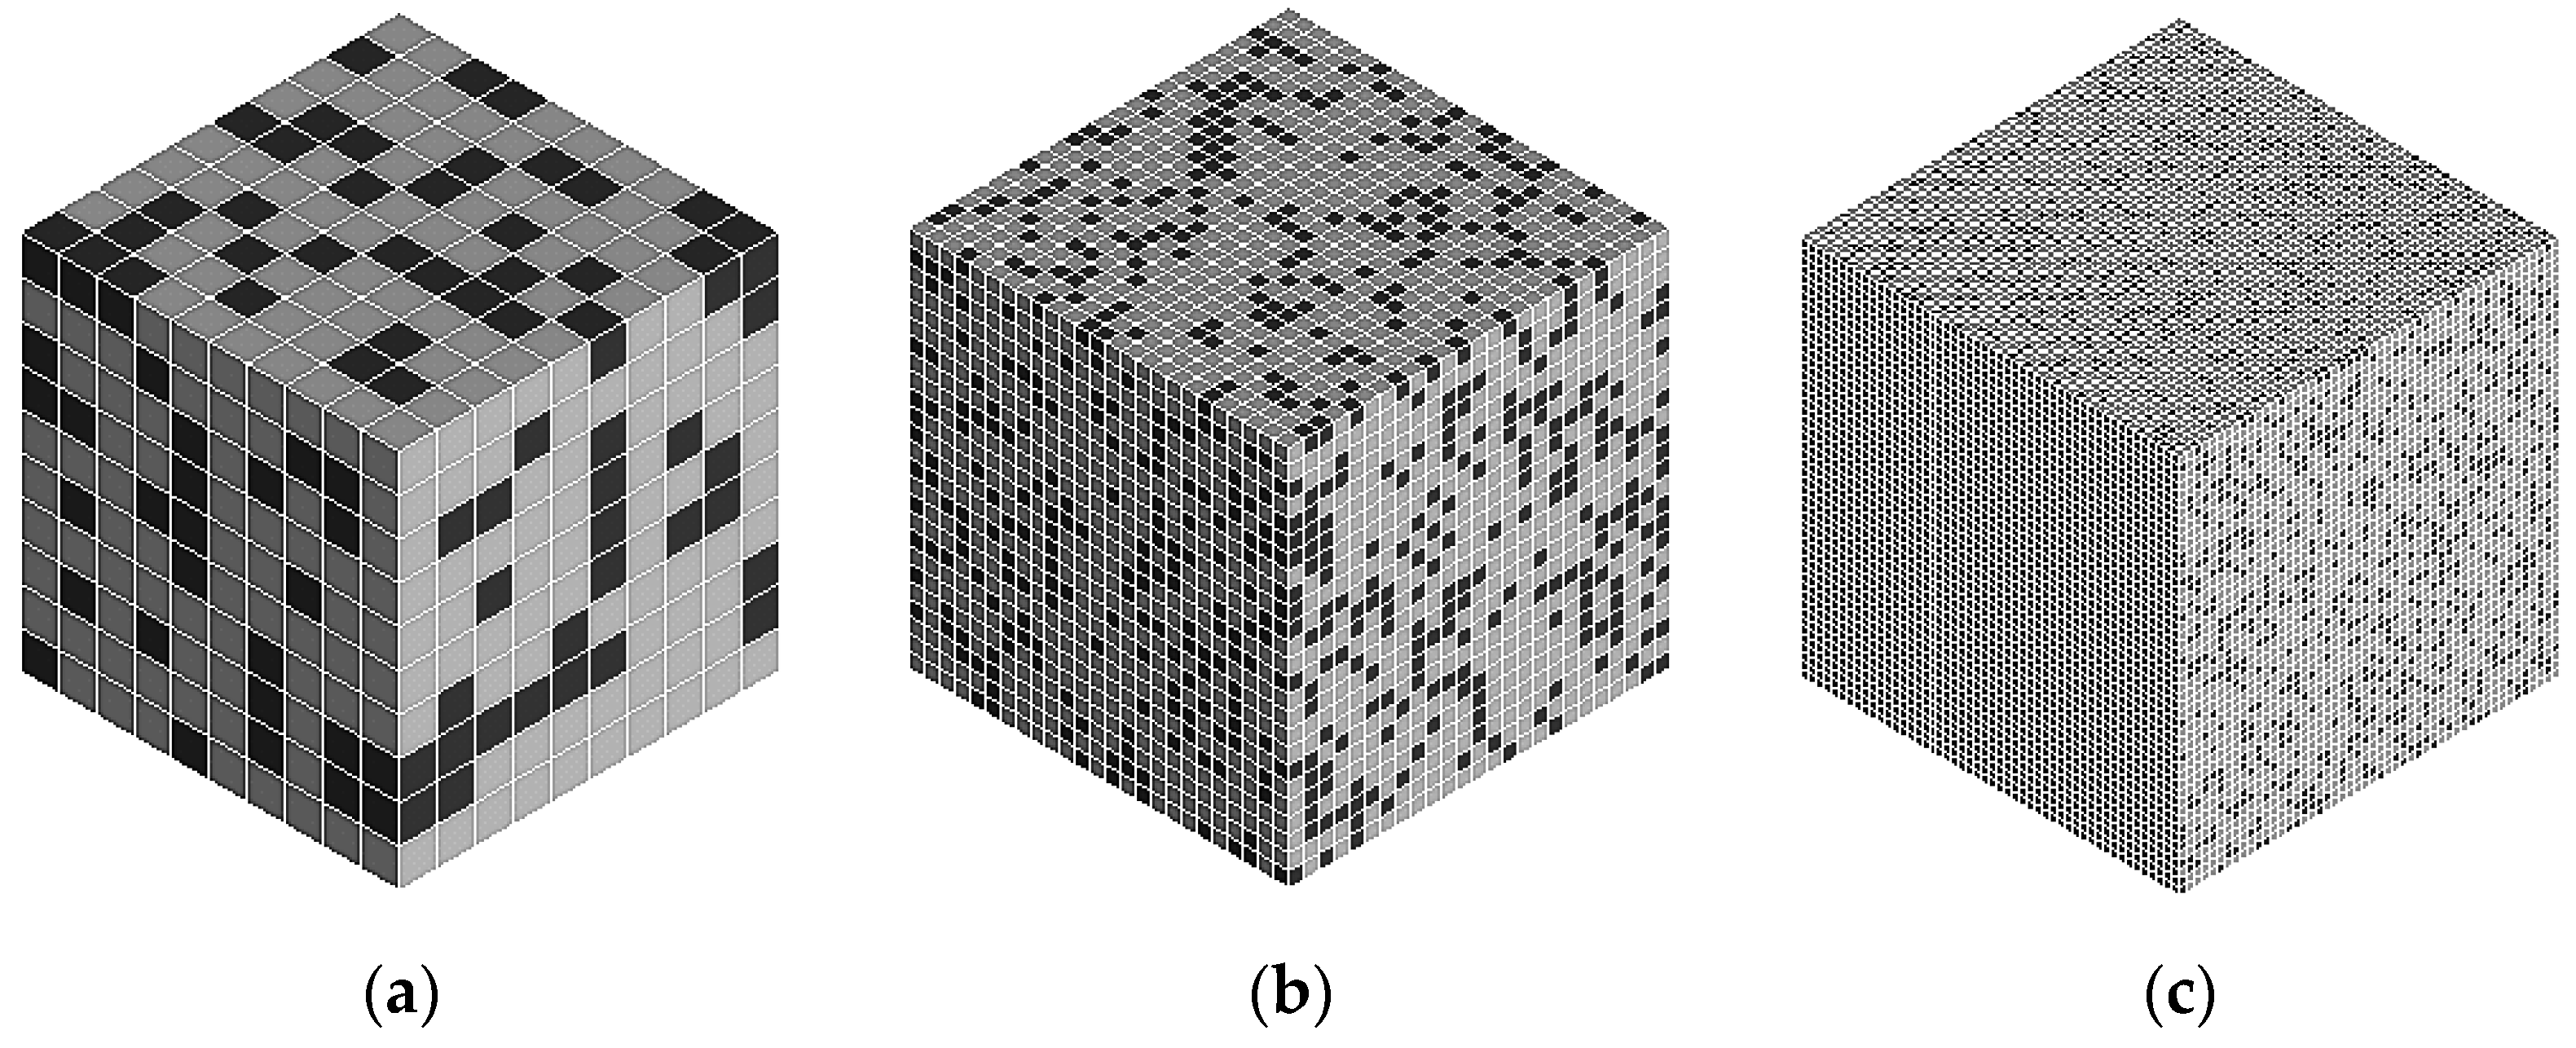
Figure 4. Microstructure-free finite element models of different element-to-RVE size ratios (a) 1/10; (b) 1/25; (c) 1/50 (The volume fraction of inclusions is 30%).
Jcs 06 00035 g004
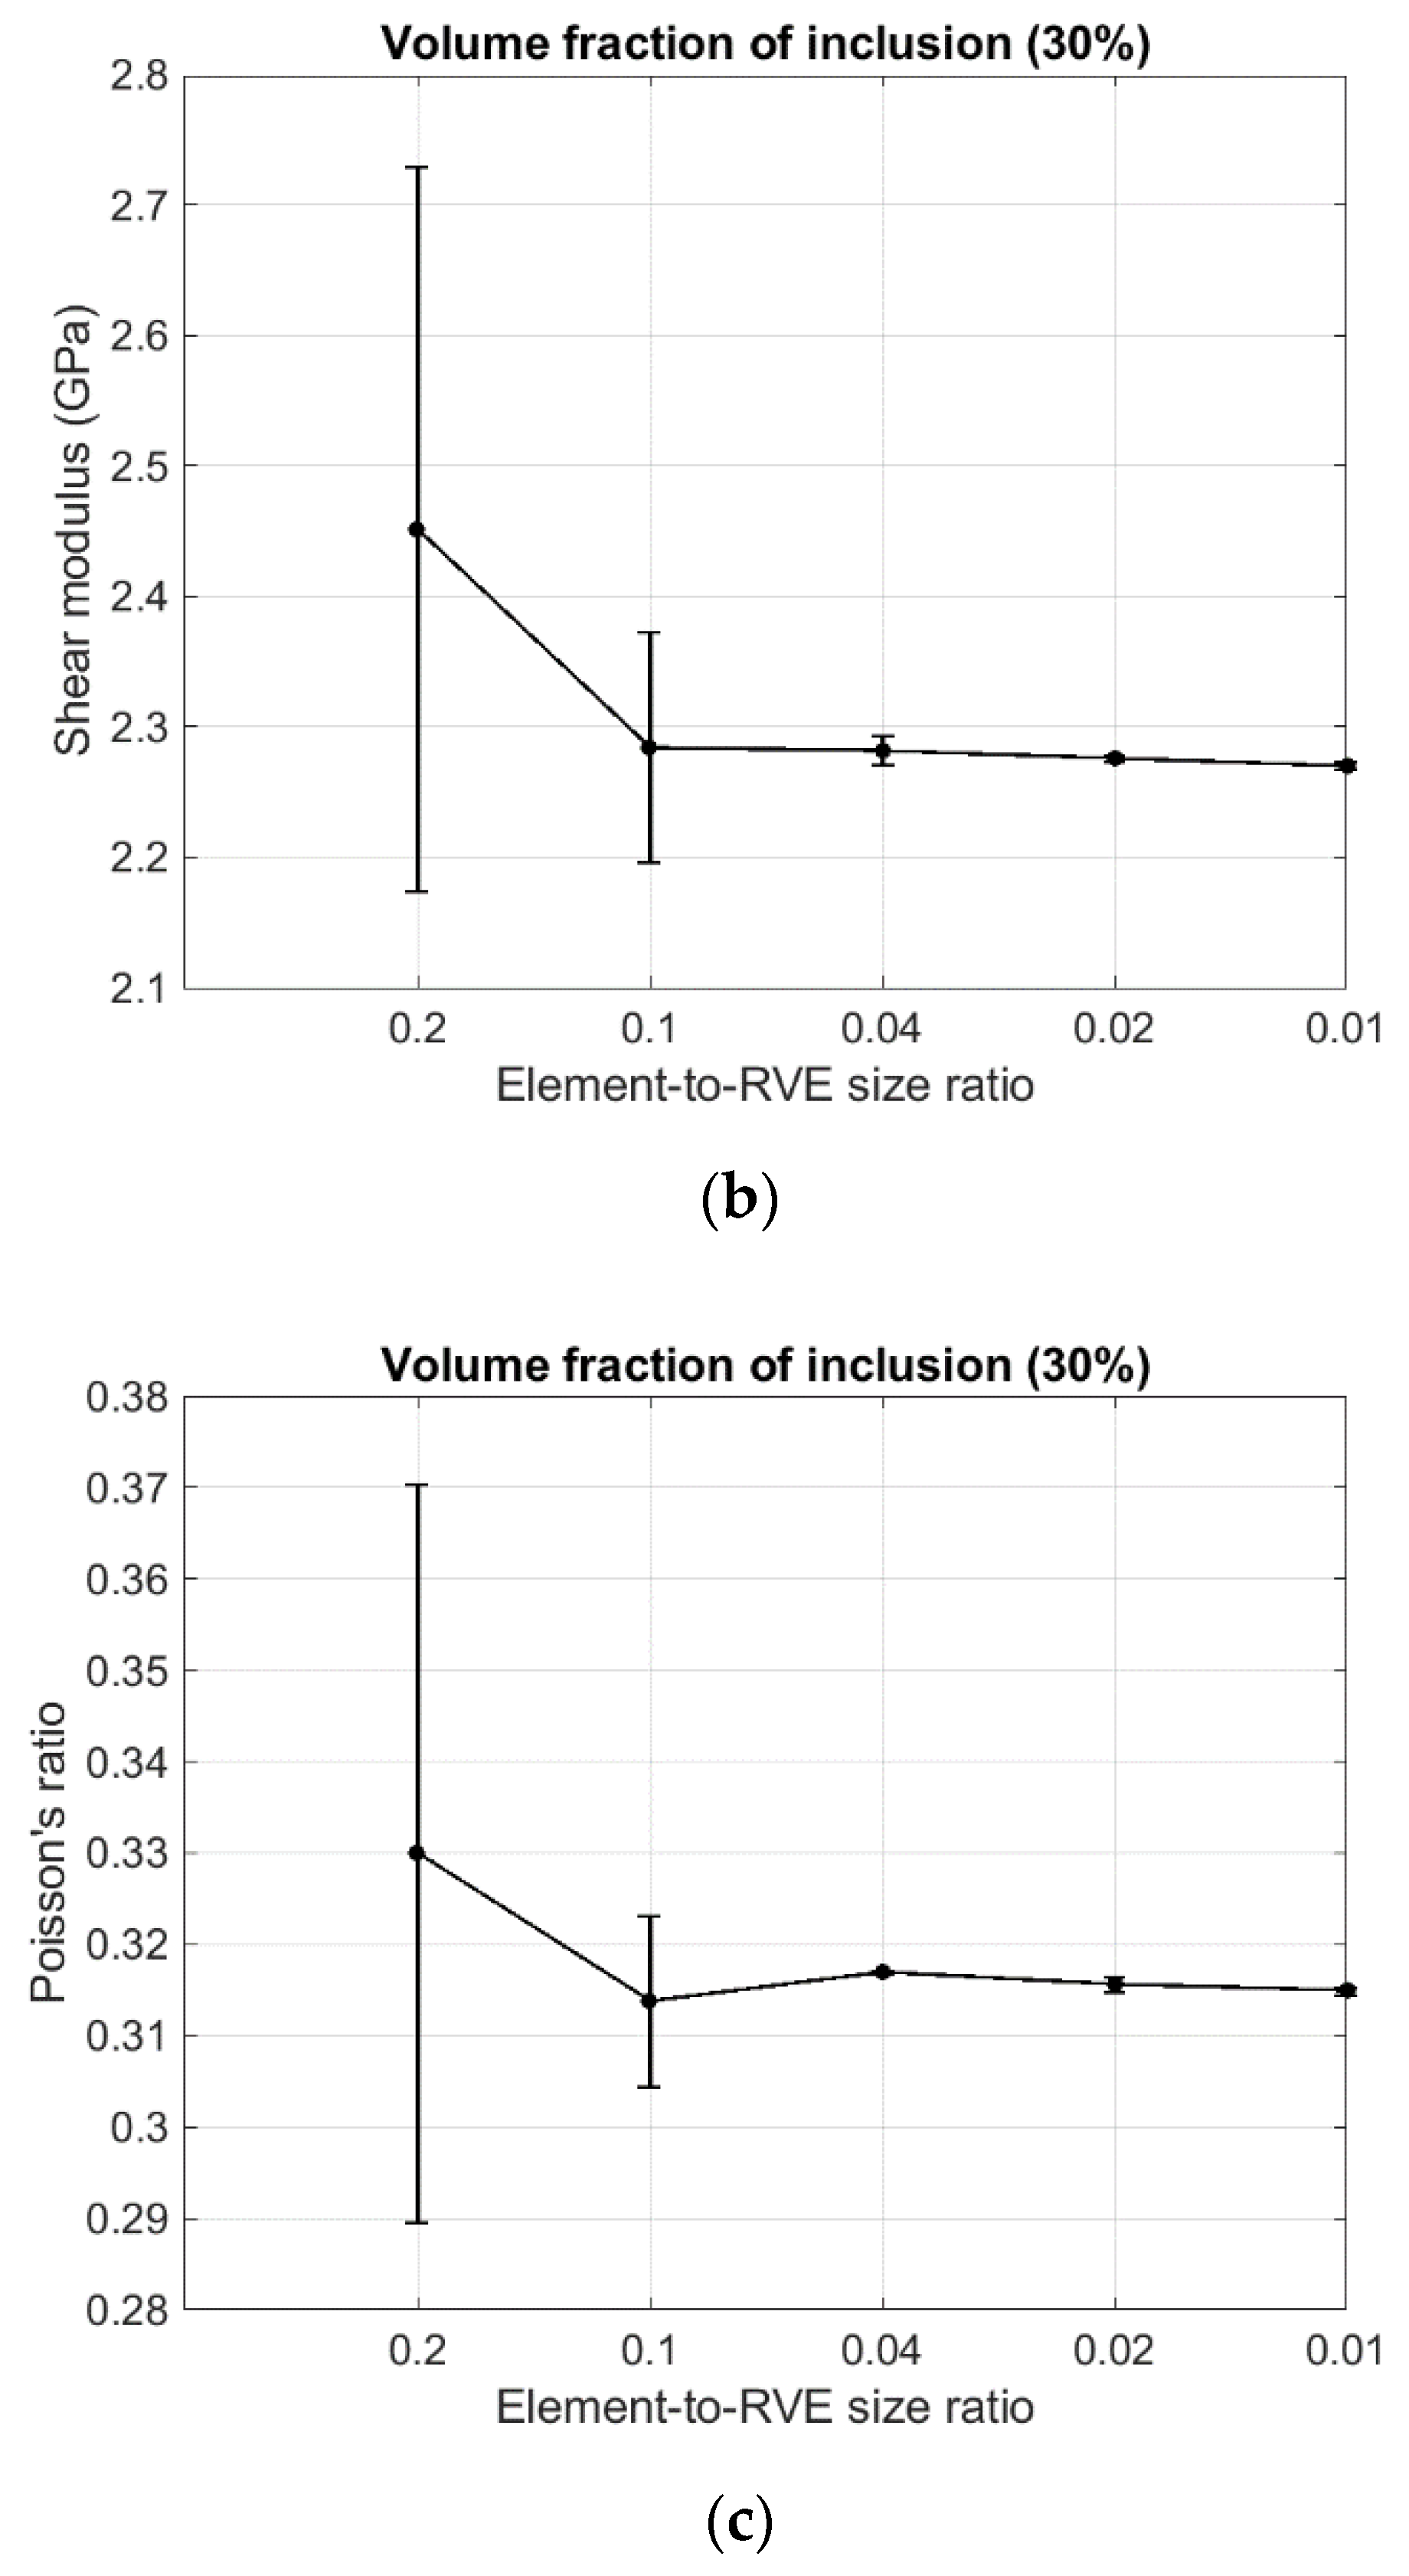
The effect of element-to-RVE size ratio on elastic properties predicted by the MF-FEM was studied using the same composite described in the previous section, with the volume fraction of inclusion elements set to 30%. The variations of RVE properties, averaged in the three loading orientations, with element-to-RVE size ratio, are shown in Figure 5. Similar to those computed by the MB-FEM, RVE properties predicted by the MF-FEM also show anisotropy if a large element-to-RVE size ratio is used; the degree of anisotropy is indicated by the error-bar length in the figure. With the element-to-RVE size ratio decreased, the anisotropy disappears, as shown in Figure 5. By comparing Figure 3 and Figure 5, one can observe that the variations of properties with element-to-RVE size ratio shown in Figure 5 are much smaller than those in Figure 3, indicating that even with a relatively larger element-to-RVE size ratio, and thus a smaller number of elements, the MF-FEM is still able to predict RVE properties with reasonable accuracy.
Comparison of RVE properties computed by the MF-FEM and the MB-FEM is displayed in Figure 6. With the inclusion-to-RVE (or element-to-RVE for the MF-FEM) size ratio of 0.02, differences in RVE properties computed by the two types of finite element models are negligible, suggesting that the MF-FEM is able to replace the MB-FEM in the prediction of effective properties of particulate composites.

4. Validation of MF-FEM against Experimental Data and Comparison with Popular Micromechanics Models

In this section, the MF-FEM was validated against experimental data previously reported in the literature and compared with popular micromechanics models. Two representative cases of experimental data were selected for the validation. One is WC–cobalt alloy, where the phase properties are close to each other [24], and the other is glass particulate reinforced polyester, where the phase properties have a large contrast [25]. Using a dynamic resonance method, Doi et al. [24] measured the Young’s modulus, shear modulus, bulk modulus, and Poisson’s ratio for a series of WC–cobalt alloys, with volume fractions of WC varying from 0.55 to 0.91. Properties of WC and cobalt used in the study are listed in Table 2.
Richard [25] conducted a series of tensile tests on specimens of glass microsphere filled polyester composites to measure their Young’s modulus and Poisson’s ratio; the composites had volume fractions of glass microsphere varying from 0.0 to 0.464. The phase material properties used in Richard’s study are listed in Table 3. Bulk modulus and shear modulus of the composites and phase materials were calculated using the elasticity relationships.
Although there exists a large number of micromechanics models available for comparison [23,26,27], we selected the models that have explicit analytical solutions, explicitly developed for particulate composites and widely used in the current literature. Based on the above considerations, we chose Voigt–Reuss (V–R) bounds, Hashin–Shtrikman (H–S) bounds, the generalized self-consistent (GSC) scheme, the Mori–Tanaka (M–T) method, and the Voigt–Reuss–Hill (V–R–H) average for comparison.
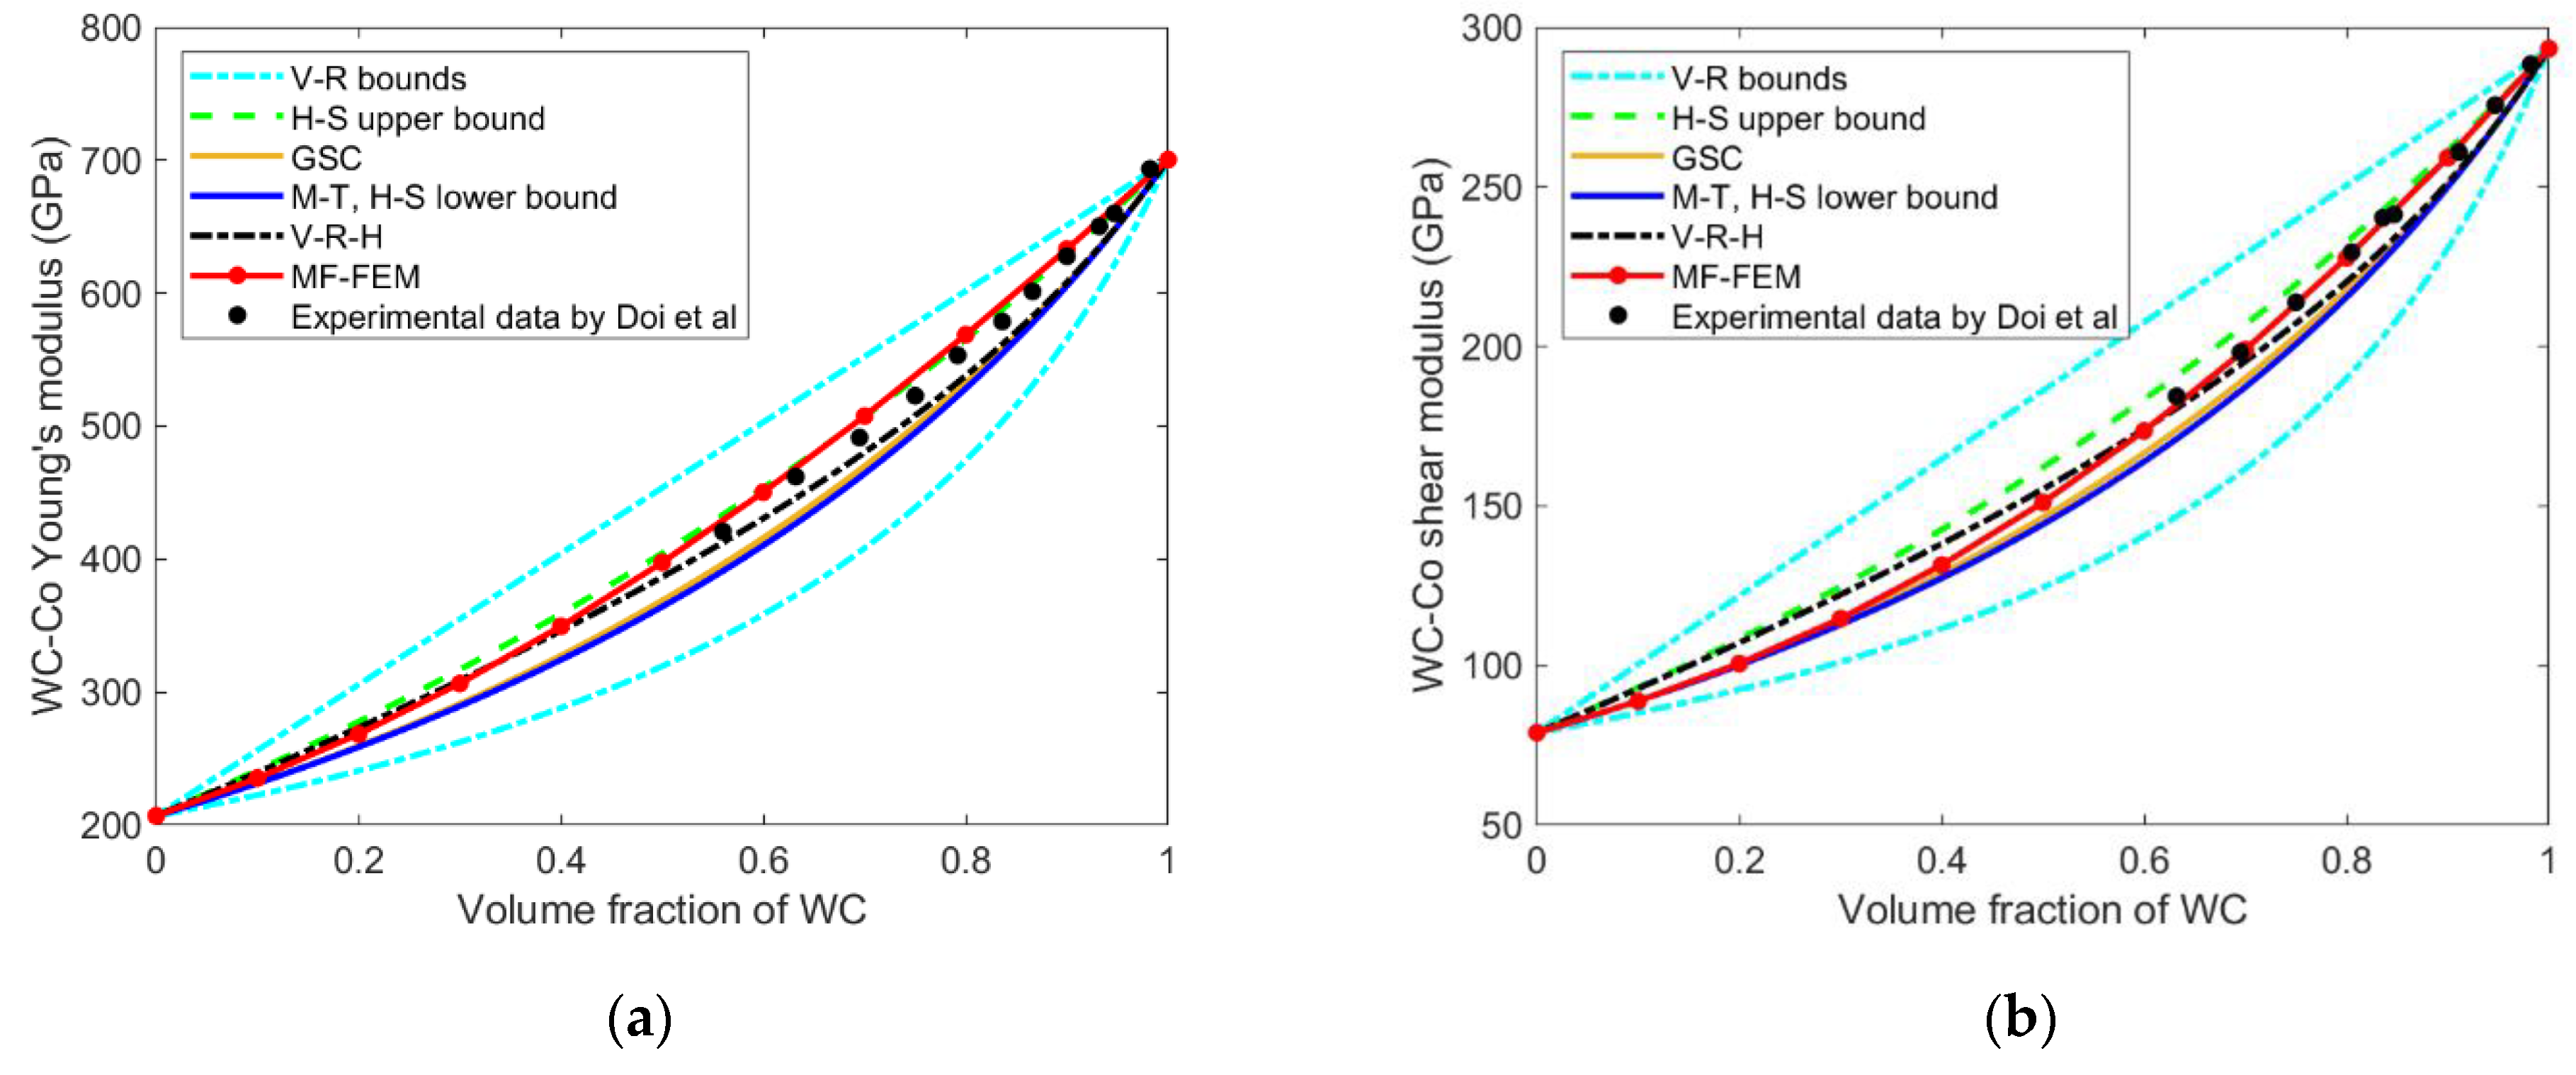
Figure 7 and Figure 8 show the results of validation and comparison. As it can be observed from Figure 7, for the WC–cobalt alloys, all the properties computed by the MF-FEM, except Poisson’s ratio, had excellent agreement with the experimental data and the predictions by the GSC and the M–T methods.
For the glass–polyester composites, as can be seen from Figure 8a,b, at low volume fractions, the MF-FEM predictions were well congruous with the experimental data and the predictions of GSC and M–T methods. However, a deviation trend occurred among the curves with the increase of glass volume fraction. Unfortunately, experimental data of high volume-fraction of glass were not available for the validation. Experimental data of bulk modulus and Poisson’s ratio, as displayed in Figure 8c,d, showed much greater scatterness, and the agreement between the experimental data and the MF-FEM predictions was not as good as in the Young’s modulus or shear modulus.
It should be pointed out that the specific loading and constraint conditions used in the experiments are not available in the literature, which may be considerably different from those described in Table 1 and used in the MF-FEM. This may explain the differences between the experimental data and the MF-FEM predictions.
From Figure 7 and Figure 8 it can be noticed that compared with the experimental data, micromechanics models such as GSC and M–T underestimate composite Young’s modulus, shear modulus, and bulk modulus, which may become even more significant for composites with a large contrast of phase properties and a high volume-fraction of inclusions. On the other hand, the predictions of MF-FEM are generally higher than the experimental data; the possible reason is that porosity may exist in the experimental materials, while the MF-FEM considers the materials as non-porous.

5. Discussion

Although there exist differences between the MF-FEM predictions and the experimental data, composite properties computed by the MF-FEM are in excellent agreement with those produced by the MB-FEM, as shown in Figure 6. The MF-FEM will become a more powerful and more efficient tool than the conventional MB-FEM in the design of particulate composites.
The MF-FEM has a number of advantages over the MB-FEM for the prediction of composite properties. There is no need to create a geometric model for the composite microstructure, which is usually tedious and time-consuming. There is no need to determine the size of RVE. Mesh quality is always guaranteed, and the number of elements does not change with the complexity of the composite microstructure. Once a universal element-to-RVE size ratio is determined, even a convergence study is not required, which is always necessary for the conventional MB-FEM. A high volume-fraction of inclusion can be easily achieved in the MF-FEM.
However, limitations of the MF-FEM are also obvious. The MF-FEM is not able to predict stress distribution in the phase materials, because the microstructure is not represented. If the inclusion-to-RVE size ratio is not adequately small, composite properties predicted by the MF-FEM will have low accuracy.

6. Conclusions

Based on the study results, it can be reasonably concluded that the MF-FEM is able to replace the conventional MB-FEM for the prediction of composite properties at the macroscopic level, but the MF-FEM is not effective for the study of composite damage at the microscopic level.

Funding

This research was funded by the Natural Sciences and Engineering Research Council (NSERC) via grant RGPIN-2019-05372 and the Research Manitoba via grant RM47950.The APC was funded by both NSERC and Research Manitoba.

Institutional Review Board Statement

Not applicable.

Informed Consent Statement

Not applicable.

Data Availability Statement

Not applicable.

Conflicts of Interest

The author has no conflict of interest to declare.

References

  1. Raghavan, P.; Li, S.; Ghosh, S. Two scale response and damage modeling of composite materials. Finite Elem. Anal. Des. 2004, 40, 1619–1640. [Google Scholar] [CrossRef]
  2. Gad, S.I.; Attia, M.A.; Hassan, M.A.; El-Shafei, A.G. Predictive computational model for damage behavior of metal-matrix composites emphasizing the effect of particle size and volume fraction. Materials 2021, 14, 2143. [Google Scholar] [CrossRef]
  3. Ferdous, W.; Manalo, A.; Yu, P.; Salih, C.; Abousnina, R.; Heyer, T.; Schubel, P. Tensile fatigue behavior of polyester and vinyl ester based GFRP laminates—A comparative evaluation. Polymers 2021, 13, 386. [Google Scholar] [CrossRef]
  4. Gusev, A.A. Representative volume element size for elastic composites: A numerical study. J. Mech. Phys. Solids 1997, 45, 1449–1459. [Google Scholar] [CrossRef]
  5. Sherwood, J.D. Packing of spheroids in three-dimensional space by random sequential addition. J. Phys. A Math. Gen. 1997, 30, L839. [Google Scholar] [CrossRef]
  6. Cooper, D.W. Random-sequential-packing simulations in three dimensions for spheres. Phys. Rev. A 1988, 38, 522. [Google Scholar] [CrossRef]
  7. Adamczyk, Z.; Weronski, P. Random sequential adsorption of spheroidal particles: Kinetics and jamming limit. J. Chem. Phys. 1996, 105, 5562–5573. [Google Scholar] [CrossRef] [Green Version]
  8. Buryachenko, V.A.; Pagano, N.J.; Kim, R.Y.; Spowart, J.E. Quantitative description and numerical simulation of random microstructures of composites and their effective elastic moduli. Int. J. Solids Struct. 2003, 40, 47–72. [Google Scholar] [CrossRef]
  9. Torquato, S.; Uche, O.U.; Stillinger, F.H. Random sequential addition of hard spheres in high Euclidean dimensions. Phys. Rev. E 2006, 74, 061308. [Google Scholar] [CrossRef] [Green Version]
  10. Zhou, J.; Qi, L.; Gokhale, A.M. Microstructure model for discontinuously reinforced composite by modified random sequential absorption method. J. Eng. Mater. Technol. 2016, 138, 021001. [Google Scholar] [CrossRef]
  11. Catalanotti, G. On the generation of RVE-based models of composites reinforced with long fibres or spherical particles. Compos. Struct. 2016, 138, 84–95. [Google Scholar] [CrossRef] [Green Version]
  12. Segurado, J.; Llorca, J. A numerical approximation to the elastic properties of sphere-reinforced composites. J. Mech. Phys. Solids 2002, 50, 2107–2121. [Google Scholar] [CrossRef]
  13. Yang, L.; Sycheva, A.V.; Black, D.M.; Eastell, R. Site-specific differential effects of once-yearly zoledronic acid on the hip assessed with quantitative computed tomography: Results from the HORIZON Pivotal Fracture Trial. Osteoporos. Int. 2013, 24, 329–338. [Google Scholar] [CrossRef]
  14. Smith, J.C. Experimental values for the elastic constants of a particulate-filled glassy polymer. J. Res. Natl. Bur. Stand. A Phys. Chem. 1976, 80, 45–49. [Google Scholar] [CrossRef]
  15. Genin, G.M.; Birman, V. Micromechanics and structural response of functionally graded, particulate-matrix, fiber-reinforced composites. Int. J. Solids Struct. 2009, 46, 2136–2150. [Google Scholar] [CrossRef] [Green Version]
  16. Harper, L.T.; Qian, C.; Turner, T.A.; Li, S.; Warrior, N.A. Representative volume elements for discontinuous carbon fibre composites–Part 2: Determining the critical size. Compos. Sci. Technol. 2012, 72, 204–210. [Google Scholar] [CrossRef]
  17. Drugan, W.J.; Willis, J.R. A micromechanics-based nonlocal constitutive equation and estimates of representative volume element size for elastic composites. J. Mech. Phys. Solids 1996, 44, 497–524. [Google Scholar] [CrossRef]
  18. Chen, L.; Gu, B.; Zhou, J.; Tao, J. Study of the effectiveness of the RVEs for random short fiber reinforced elastomer composites. Fibers Polym. 2019, 20, 1467–1479. [Google Scholar] [CrossRef]
  19. Kanit, T.; Forest, S.; Galliet, I.; Mounoury, V.; Jeulin, D. Determination of the size of the representative volume element for random composites: Statistical and numerical approach. Int. J. Solids Struct. 2003, 40, 3647–3679. [Google Scholar] [CrossRef]
  20. Kari, S.; Berger, H.; Rodriguez-Ramos, R.; Gabbert, U. Computational evaluation of effective material properties of composites reinforced by randomly distributed spherical particles. Compos. Struct. 2007, 77, 223–231. [Google Scholar] [CrossRef]
  21. Trias, D.; Costa, J.; Turon, A.; Hurtado, J. Determination of the critical size of a statistical representative volume element (SRVE) for carbon reinforced polymers. Acta Mater. 2006, 54, 3471–3484. [Google Scholar] [CrossRef]
  22. Pelissou, C.; Baccou, J.; Monerie, Y.; Perales, F. Determination of the size of the representative volume element for random quasi-brittle composites. Int. J. Solids Struct. 2009, 46, 2482–2855. [Google Scholar] [CrossRef] [Green Version]
  23. Pindera, M.-J.; Khatam, H.; Drago, A.S.; Bansal, Y. Micromechanics of spatially uniform heterogeneous media: A critical review and emerging approaches. Compos. Part B 2009, 40, 349–378. [Google Scholar] [CrossRef]
  24. Doi, H.; Fujiwara, Y.; Miyake, K.; Oosawa, Y. A systematic investigation of elastic moduli of WC-Co alloys. Metall. Mater. Trans. B 1970, 1, 1417–1425. [Google Scholar] [CrossRef]
  25. Richard, T.G. The mechanical behavior of a solid microsphere filled composite. J. Compos. Mater. 1975, 9, 108–113. [Google Scholar] [CrossRef]
  26. Christensen, R.M. A critical evaluation for a class of micromechanics models. J. Mech. Phys. Solids 1990, 38, 379–404. [Google Scholar] [CrossRef]
  27. Raju, B.; Hiremath, S.R.; Mahapatra, D.R. A review of micromechanics based models for effective elastic properties of reinforced polymer matrix composites. Compos. Struct. 2018, 204, 607–619. [Google Scholar] [CrossRef]
Figure 1. Composite RVEs with inclusions of different shapes: (a) spherical inclusions; (b) almond-shaped inclusions (aspect ratio = 2); (c) pill-shaped inclusions (aspect ratio = 2).
Jcs 06 00035 g001
Figure 2. RVE of particulate composite.
Jcs 06 00035 g002
Figure 3. Variations of RVE elastic properties with inclusion-to-RVE size ratio: (a) Young’s modulus; (b) shear modulus; (c) Poisson’s ratio.
Jcs 06 00035 g003
Figure 5. Variation of RVE properties with element-to-RVE size ratio: (a) Young’s modulus; (b) shear modulus; (c) Poisson’s ratio.
Jcs 06 00035 g005aJcs 06 00035 g005b
Figure 6. Comparison of RVE properties computed by the MF-FEM and the MB-FEM: (a) Young’s modulus; (b) shear modulus; (c) Poisson’s ratio.
Jcs 06 00035 g006
Figure 7. Validation and comparison against experimental data of WC–cobalt alloy [24]: (a) Young’s modulus; (b) shear modulus; (c) bulk modulus; (d) Poisson’s ratio.
Jcs 06 00035 g007aJcs 06 00035 g007b
Figure 8. Validation comparison against experimental data of glass–polyester [25]: (a) Young’s modulus; (b) shear modulus; (c) bulk modulus; (d) Poisson’s ratio.
Jcs 06 00035 g008
Table 1. RVE boundary conditions for characterization of composite elastic properties.
RVE SurfaceYoung’s Modulus (Ei, i = x, y, z) and Poisson’s Ratio (νij, i, j = x, y, z)Shear Modulus (Gij, i, j = x, y, z)
Ex, vxy, vxzEy, vyx, vyzEz, vzx, vzyGxyGyzGzx
x = 0ux = 0ux = 0ux = 0ux = uy = uz = 0FreeFree
y = 0uy = 0uy = 0uy = 0Freeux = uy = uz = 0Free
z = 0uy = 0uy = 0uz = 0FreeFreeux = uy = uz = 0
x = 100ux = 1ux (coupled DOFs)ux (coupled DOFs)uy = 1, ux (coupled DOFs)FreeFree
y = 100uy (coupled DOFs) *uy = 1uy (coupled DOFs)Freeuz = 1, uy (coupled DOFs)Free
z = 100uz (coupled DOFs)uz (coupled DOFs)uz = 1FreeFreeux = 1, uz (coupled DOFs)
* Homogeneous boundary condition, i.e., all nodes on the surface y = 100 are forced to have the same displacement uy.
Table 2. Properties of WC and cobalt phases [24].
PhaseYoung’s Modulus
(GPa)
Shear Modulus
(GPa)
Cobalt206.9979.00
WC700.43293.31
Table 3. Properties of glass microsphere and polyester [25].
PhaseYoung’s Modulus
(GPa)
Poisson’s Ratio
Polyester1.690.45
Glass microsphere68.950.21
Publisher’s Note: MDPI stays neutral with regard to jurisdictional claims in published maps and institutional affiliations.