Article

Improved Wear and Corrosion Resistance in TiC-Reinforced SUS304 Stainless Steel

1
Department of Materials Science and Engineering, National Tsing Hua University, Hsinchu 300044, Taiwan
2
High Entropy Materials Center, National Tsing Hua University, Hsinchu 300044, Taiwan
*
Author to whom correspondence should be addressed.
J. Compos. Sci. 2023, 7(1), 34; https://doi.org/10.3390/jcs7010034
Submission received: 22 November 2022 / Revised: 17 December 2022 / Accepted: 6 January 2023 / Published: 11 January 2023
(This article belongs to the Special Issue Metal Composites)

Abstract

:
Herein, the vacuum arc-melting process is applied to incorporate various amounts of Ti and C into SUS304 austenitic stainless steel based on the high-entropy alloy concept to obtain wear- and corrosion-resistant alloys with in situ carbide reinforcements. Five compositions containing the equivalent of 5, 10, 15, 20, and 25 volume percentages of TiC in SUS304 stainless steel, named A1, A2, A3, A4, and A5, respectively, were designed, melted, and solidified by the arc-melting method. Microstructural analyses, hardness measurements, immersion tests in four corrosive solutions, electrochemical measurements in a 3.5 wt % NaCl(aq) solution, and tribological tests were conducted to determine the properties and explain the relevant mechanisms. A1 exhibited a eutectic structure between FCC dendrites, while A2, A3, A4, and A5 possessed proeutectic dendritic TiC, FCC dendrites enveloping the TiC dendrites, and a eutectic structure. A5 represents the optimal composition. Its hardness, wear resistance, and corrosion resistance are 2, 14, and 4 times higher than those of SUS304, respectively. Additionally, its wear resistance is 2.5 times that of high-chromium cast iron. Consequently, A5 could have a 2.5-fold longer lifetime in wear operation. Therefore, A5 could be potentially applied in corrosive and abrasive environments, such as rotary shafts, rotors, bearings, and structural parts in food, chemical, and optoelectronic industries.

1. Introduction

High-entropy alloys (HEAs) contain five or more major elements, each with a composition between 5 and 35 at.%. This compositional concept is entirely different from traditional alloys based on one or two major elements. HEAs have four core effects, namely, high entropy, lattice distortion, sluggish diffusion, and cocktail effects, which are more significant than traditional metals and alloys and strongly affect various properties [1,2,3,4,5,6]. Medium-entropy alloys (MEAs), which contain three or four major elements, also exhibit a certain degree of the four effects [7,8]. Therefore, HEAs and MEAs are a new trend in metal design. In recent years, the concept of HEAs and MEAs has been extended to other fields, such as functional coatings [9], ceramics [10], and polymers [11], broadening the scope of material innovation.
For example, composites based on Fe–TiC were recently developed, featuring improved wear resistance owing to the presence of hard carbide particles [12]. However, these composites were difficult to fabricate, and some bottlenecks were encountered in their production. Similarly, powder metallurgy was used to fabricate composites with a high-volume fraction of TiC, but porosity and contaminants were a problem because of reduced wettability [13]. Fabricating the composites through the conventional melting method was also difficult due to the strong oxidation tendency of Ti [14,15,16]. Even with the strong reducing effect of Al and Mg powder on TiO2 powder in graphite, cast iron, and iron mixture, the volume fractions of TiC in the cast alloys were usually lower than 10% [15]. Furthermore, among the Fe–TiC composites, Fe-based matrices, including high-chromium cast iron, alloy steel, and Hadfield steel, exhibited poor corrosion resistance, accelerating the wear loss under corrosive and wear environments. In addition, the high content of Mn in tough Hadfield steel can cause neurological symptoms that can lead to Parkinson’s disease. The people at risk of this hazard include workers in manganese-based manufacturing industries, such as welders, steelworkers, and miners [17,18,19,20]. Mn is also more susceptible to corrosion in NaCl(aq) and H2SO4(aq) than Ni [21].
Because SUS304 austenitic stainless steel possesses excellent corrosion resistance, high toughness, and non-toxicity [22], in this study, various amounts of Ti and C were incorporated into the base composition of SUS304 stainless steel to form medium-entropy composites, and arc melting was used to prepare the cast alloys. This was performed to obtain wear- and corrosion-resistant alloys with in situ carbide reinforcements (or SUS304 stainless steel-TiC composites), which could be employed under corrosive and wear environments. In addition, because TiC is chemically stable, extremely hard, and coherent with the austenite matrix [23,24,25,26,27], it is expected that incorporating TiC could effectively improve the wear and corrosion resistance of SUS304 stainless steel [28,29,30,31].

2. Materials and Methods

2.1. Sample Preparation and Characterization

Ti and C were added into SUS304 stainless steel to create an alloy with excellent wear resistance in corrosive environments. Five compositions were designed to have the equivalent of 5, 10, 15, 20, and 25 volume percentages of TiC in SUS304 stainless steel, which were named as A1, A2, A3, A4, and A5, respectively. Table 1 presents the composition and configurational entropy of each alloy. All alloys could be categorized as medium-entropy alloys (1R < configurational entropy < 1.5R).
The alloys were arc-melted in a protective Ar atmosphere and solidified in a water-cooled Cu mold. The raw materials were granular Fe, Cr, Ni, Ti, and graphite (>99 wt % purity). The microstructures and chemical compositions were analyzed using SEM and EDS (Zeiss Gemini S300, ZEISS, Oberkochen, Germany), and EPMA (JXA–iHP200F, JEOL, Tokyo, Japan). The phases were identified using XRD (D2 PHASER, Bruker, Billerica, MA, USA) with a 2θ scanning range of 20–100° at a scanning speed of 1°/min. The typical radiation was produced at 30 kV and 20 mA with a Cu target.

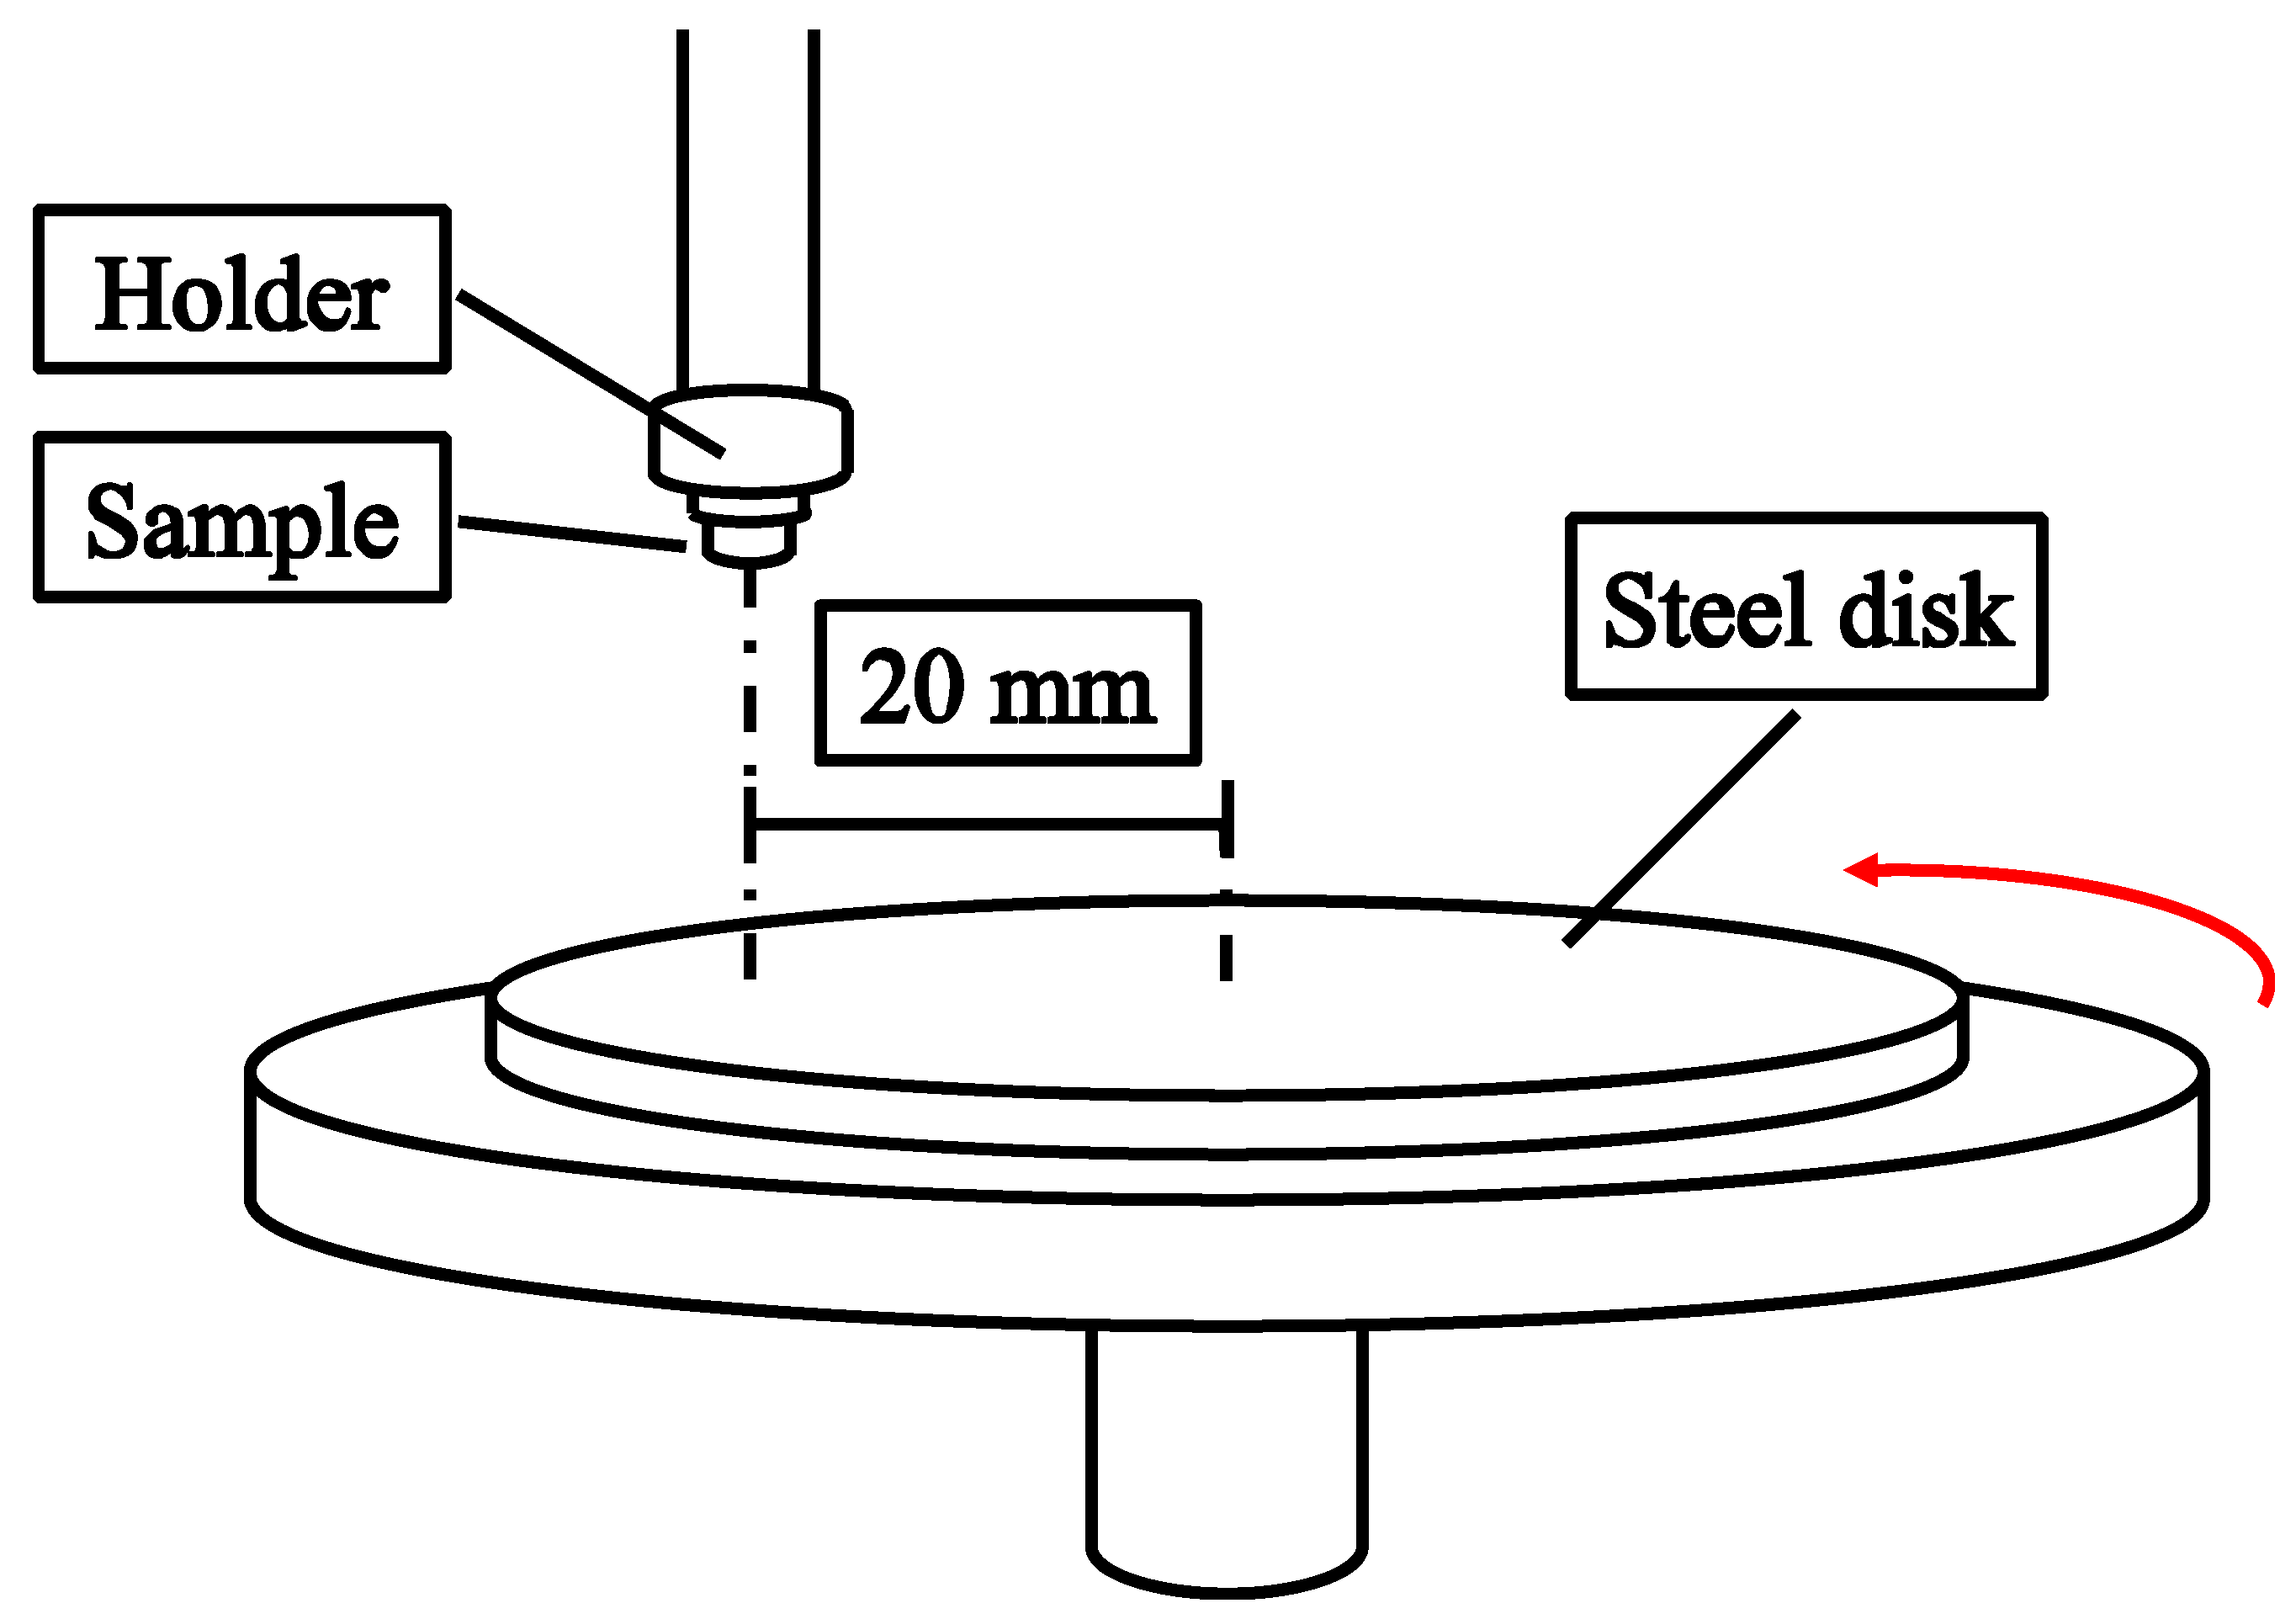
2.2. Tribological and Mechanical Testing

A pin-on-disk wear-testing machine was used to investigate the adhesive wear behavior in dry sliding conditions. The testing samples were 8 mm diameter and 3 mm high cylinders, which were fixed on the holder and slid against a 75 mm diameter SKH–51 steel plate with a hardness of 890 HV, as shown in Figure 1. Sliding was conducted along a 20 mm radius circle. The loading weight and rotation speed were 3 kgf and 239 rpm, respectively. The wear distance was 5400 m. The wear resistance was defined using Equation (1):
w r = L Δ V
where Wr is the wear resistance, L is the wear distance, and ΔV is the volumetric loss, which can be obtained by dividing the weight loss by the density of the material. The worn surface was analyzed using SEM and EDX to investigate the effect of the doping carbide. Moreover, the wear resistance of the designed alloys was compared with that of SUS304 stainless steel and high-chromium cast iron to assess the improvement.
The hardness tests were conducted using a Vickers hardness tester (Mitutoyo 810–420 HV–114, Mitutoyo, Sakado, Japan). The parameters of the diamond pyramid were a 10 kgf load, 150 m/s indentation speed, and 12-second indentation duration.

2.3. Electrochemical Measurements in 3.5 wt % NaCl Solution

The dimensions of the samples for the electrochemical measurements were 10 × 10 × 2 mm3. The samples were cold-embedded into epoxy resin and connected with a Cu wire using solder. The sample surface was ground and polished with a series of SiC sandpaper up to grit #2000 and subsequently cleaned with distilled water and acetone.
The tests were performed with a 3.5 wt % NaCl(aq) solution. The solution was degassed with purified N2 gas to remove the dissolved O2. The polarization experiment was composed of a three-electrode cell with a saturated calomel electrode (SCE) as the reference electrode, a working electrode, and a Pt sheet as the counter electrode. The current and potential were measured using a potentiostat/galvanostat instrument (Ivium–n–Stat, Ivium Technologies, Eindhoven, The Netherlands), which could continuously monitor the potential, time period, and total current. The total current density was divided by the exposed surface area of the sample. The potential values were expressed on the SCE scale, which is 0.241 V lower than the standard hydrogen electrode (SHE). The potentiodynamic test determined the corrosion potential (Ecorr), corrosion current density (jcorr), transpassivation potential (Etr), and passive current density (jpass). The potentiodynamic polarization measurements were measured using an open current potential (OCP) with a 1 mV/s scan rate. The OCP indicated whether there was stable pitting on the samples. The OCP was recorded as a steady state for 30 min before testing. Then, the testing sample was cathodically polarized to −1.2 V (SCE) for 10 min to remove the existing surface film. The scans were started at a potential of −1 V and automatically ended at a potential of 1 V, which was higher than Etr. To ensure the reproducibility of the results, the tests were repeated at least three times for each condition.

2.4. Sinking Corrosion Test in 1.5 M Four Corrosive Solutions

The dimensions of the corrosion testing samples were 10 × 10 × 2 mm3. The sample surface was ground and polished with a series of SiC sandpaper up to grit #2000 and subsequently cleaned with distilled water and acetone. The corrosive solutions were 1.5 M HCl, H2SO4, HNO3, and C6H8O7 acid solutions. The mass of specimens was measured per week. The mass loss percentage after immersion for different durations was calculated using Equation (2):
w e i g h t   l o s s   r a t i o = c u r r e n t   m a s s o r i g i n a l   m a s s original   mass × 100 %

3. Results

3.1. Microstructure, Phases, and Compositions

Figure 2 shows the as-cast microstructures of A1, A2, A3, A4, and A5, which show typical cast dendritic and interdendritic structures. Figure 3 shows the crystal structures, as analyzed using XRD. Table 2 lists the chemical compositions of each phase, as analyzed using EPMA. All samples contained a TiC phase (black) and austenite matrix (light-gray region, FCC) in which A1 had a eutectic structure in the finally solidified region between the FCC dendrites. A2, A3, A4, and A5 contained proeutectic dendritic TiC (black), dendritic FCC enveloping the TiC dendritic, and a eutectic structure in the finally solidified region between the FCC dendrites. The volume fraction of TiC dendrites increased and that of the eutectic phase decreased with an increasing TiC content, whereas A4 and A5 exhibited M7C3 carbides (gray region) in addition to TiC. As expected, the TiC phase in all the samples had an approximate stoichiometric ratio of 1:1 because TiC has a considerably larger heat of formation than the other carbides formed from Fe, Cr, and Ni. Additionally, some C (2–4 at%) was dissolved in the FCC matrix of A2–A5 but not in A1, which indicates that some Cr-rich carbide precipitates may have formed in the matrix. XRD analysis identified a second FCC phase with a slightly smaller lattice constant as the (Fe and Ni) phase, which is believed to be a eutectic FCC phase with a higher Cr content than that of the proeutectic FCC.

3.2. Tribological and Mechanical Properties

SUS304 and high-chromium cast iron were tested to compare the wear resistance with that of the designed alloys. This study analyzes and discusses the wear behavior, wear resistance, friction coefficient, and wear surface of the tested materials.
Figure 4 shows the wear resistances of A1, A2, A3, A4, A5, SUS304 stainless steel, and high-chromium cast iron. The wear resistance of A1 and A2 was slightly lower than that of the SUS304 stainless steel. A3 exhibited a slightly higher wear resistance than that of SUS304, and A4 and A5 displayed a significantly higher wear resistance than that of SUS304. Notably, A5 possessed the highest wear resistance, which was 14 times higher than that of SUS304 and 2.5 times higher than that of the considerably harder high-chromium cast iron. This demonstrates that A5 could have a 2.5-fold longer lifetime than that of high-chromium cast iron when applied under the same wear conditions.
Figure 5 shows the friction coefficient as a function of wear distance for A1, A2, A3, A4, A5, SUS304 stainless steel, and high-chromium cast iron. For the first several hundred meters, the friction coefficient increased to its maximum average level, after which it remained at that fluctuation level until the end of the test. Moreover, the average friction coefficient increased with the ratio of carbide.
Figure 6 shows the worn surfaces of the tested samples. A1, A2, and A3 had fewer large proeutectic TiC particles and showed obvious scratches on the surface. Moreover, there was a strong O element signal on the surface (dark phase under the BEI mode), indicating that the interfacial temperature was sufficiently high to cause oxidation [32]. As A4 and A5 had a higher amount of proeutectic dendritic TiC, the wear debris stacked beside the apophysis surface and caused strong oxidation in the stacking region.
Figure 7 shows a plot of the hardness and wear resistance of A1, A2, A3, A4, A5, SUS304, and high-chromium cast iron. The hardness increased with an increasing TiC volume fraction mainly because TiC and M7C3 particles are harder than the austenite matrix [33,34]. As a higher volume fraction of TiC and M7C3 carbides occupies more volume in an alloy, the overall hardness is expected to increase [16,35]. Notably, although the hardness of A5 is 70% that of high-chromium cast iron, it exhibits a 2.5-fold higher wear resistance than that of the latter. This indicates that TiC-reinforced 304 stainless steel can effectively resist wear damage.

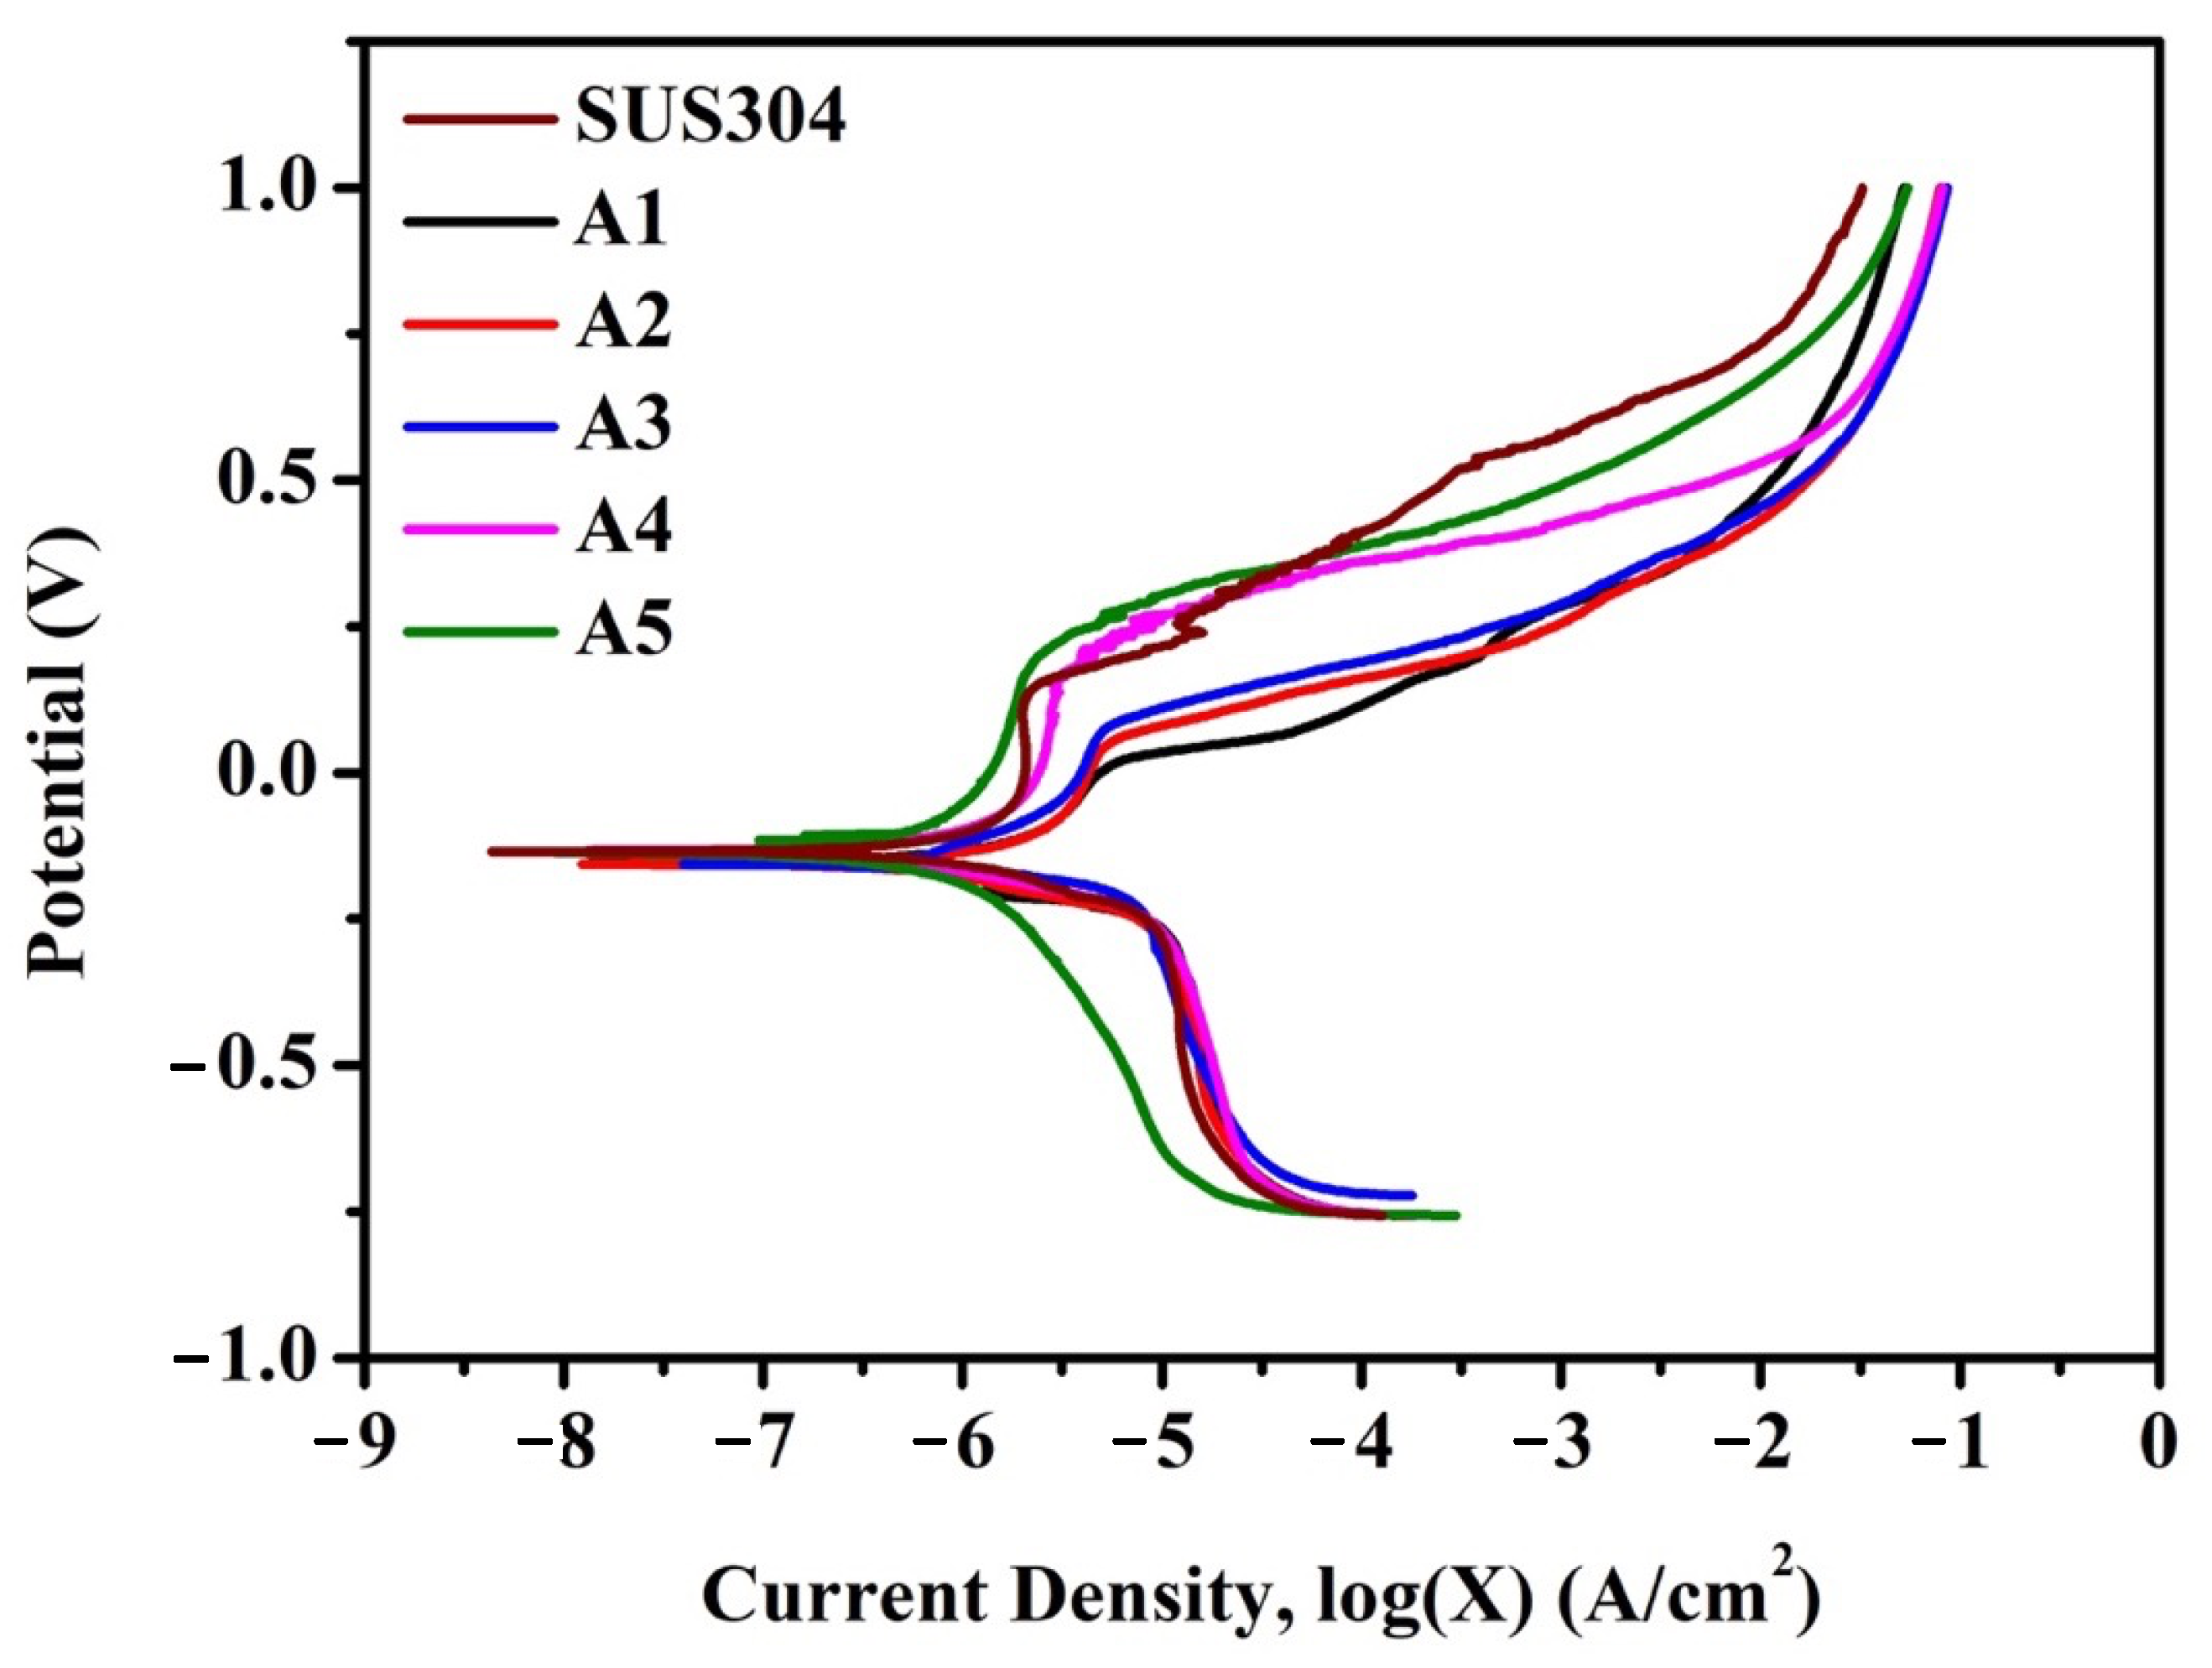
3.3. Electrochemical Analysis for Corrosion Resistance in 3.5 wt % NaCl Solution

Figure 8 and Table 3 show the polarization curves of the alloys and their electrochemical characteristics in a 3.5 wt % NaCl solution, respectively. As stainless steel corrodes, it forms a passive surface layer to protect the inner alloy. Therefore, the transpassive potential and passive current density are two main factors for assessing the corrosion resistance of stainless steel [36,37]. The alloy with the largest Etr shows the best corrosion resistance.
A1, A2, and A3 had a lower Ecorr and Etr and a higher jcorr and jpass than SUS304, but the interiority improved with an increased TiC content. Following the same trend, A4 and A5 showed better corrosion resistance in every aspect than SUS304, and A5 showed the best performance. The jcorr of A5 was only one-quarter of that of SUS304, and the Etr of A5 was higher than that of SUS304 by approximately 50%.

3.4. Mass Loss Analysis for Corrosion Resistance

Figure 9 shows the mass loss of A1, A2, A3, A4, and A5 in 1.5 M HCl, H2SO4, HNO3, and C6H8O7 solutions. A1 and A2 experienced severe corrosion in the HCl solution. A2 exhibited a better corrosion resistance than A1 because the mass loss curve of A1 and A2 flattened out at 168 and 334 h, respectively. A3 showed a milder reaction than A1 and A2 as its mass loss curve flattened out at 1344 h. The corrosion reaction of A4 and A5 clearly did not terminate at 1680 h, exhibiting a significantly better corrosion resistance than A1, A2, and A3. Additionally, A5 had a significantly higher corrosion resistance than A4 and exhibited only a 3% mass loss ratio.
In the 1.5 M H2SO4 solution, A1, A2, A3, and A4 were severely corroded within 168 h, Additionally, they exhibited poor corrosion resistance in a sulfur-rich environment. However, A5 had a negligible mass loss ratio and was the only alloy with corrosion resistance in a 1.5 M H2SO4 solution.
In the 1.5 M HNO3 solution, all alloys showed a small mass loss of <1%, and all demonstrated excellent corrosion resistance. Moreover, the mass loss slightly increased with a higher ratio of carbide.
In the 1.5 M C6H8O7 solution, all alloys demonstrated a negligible mass loss and showed excellent corrosion resistance.

4. Discussion

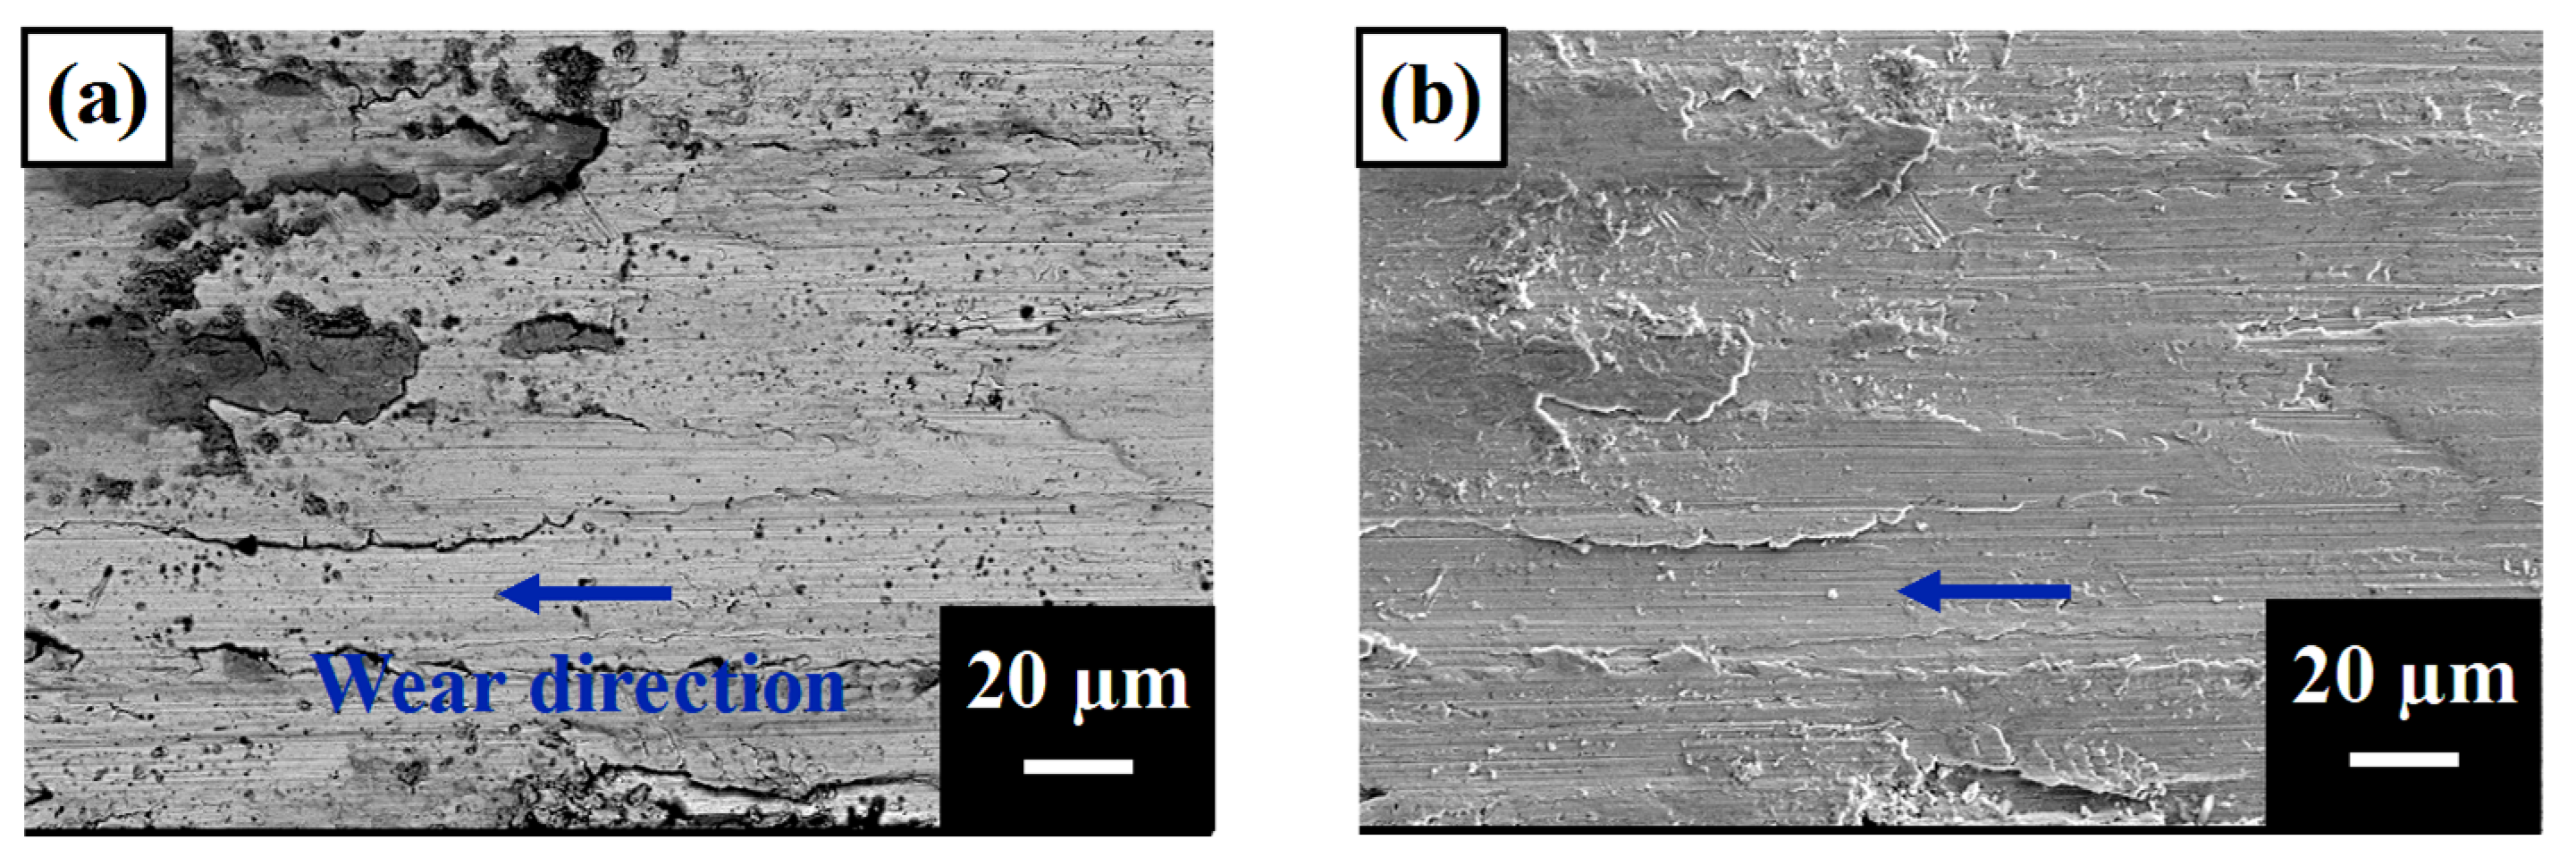
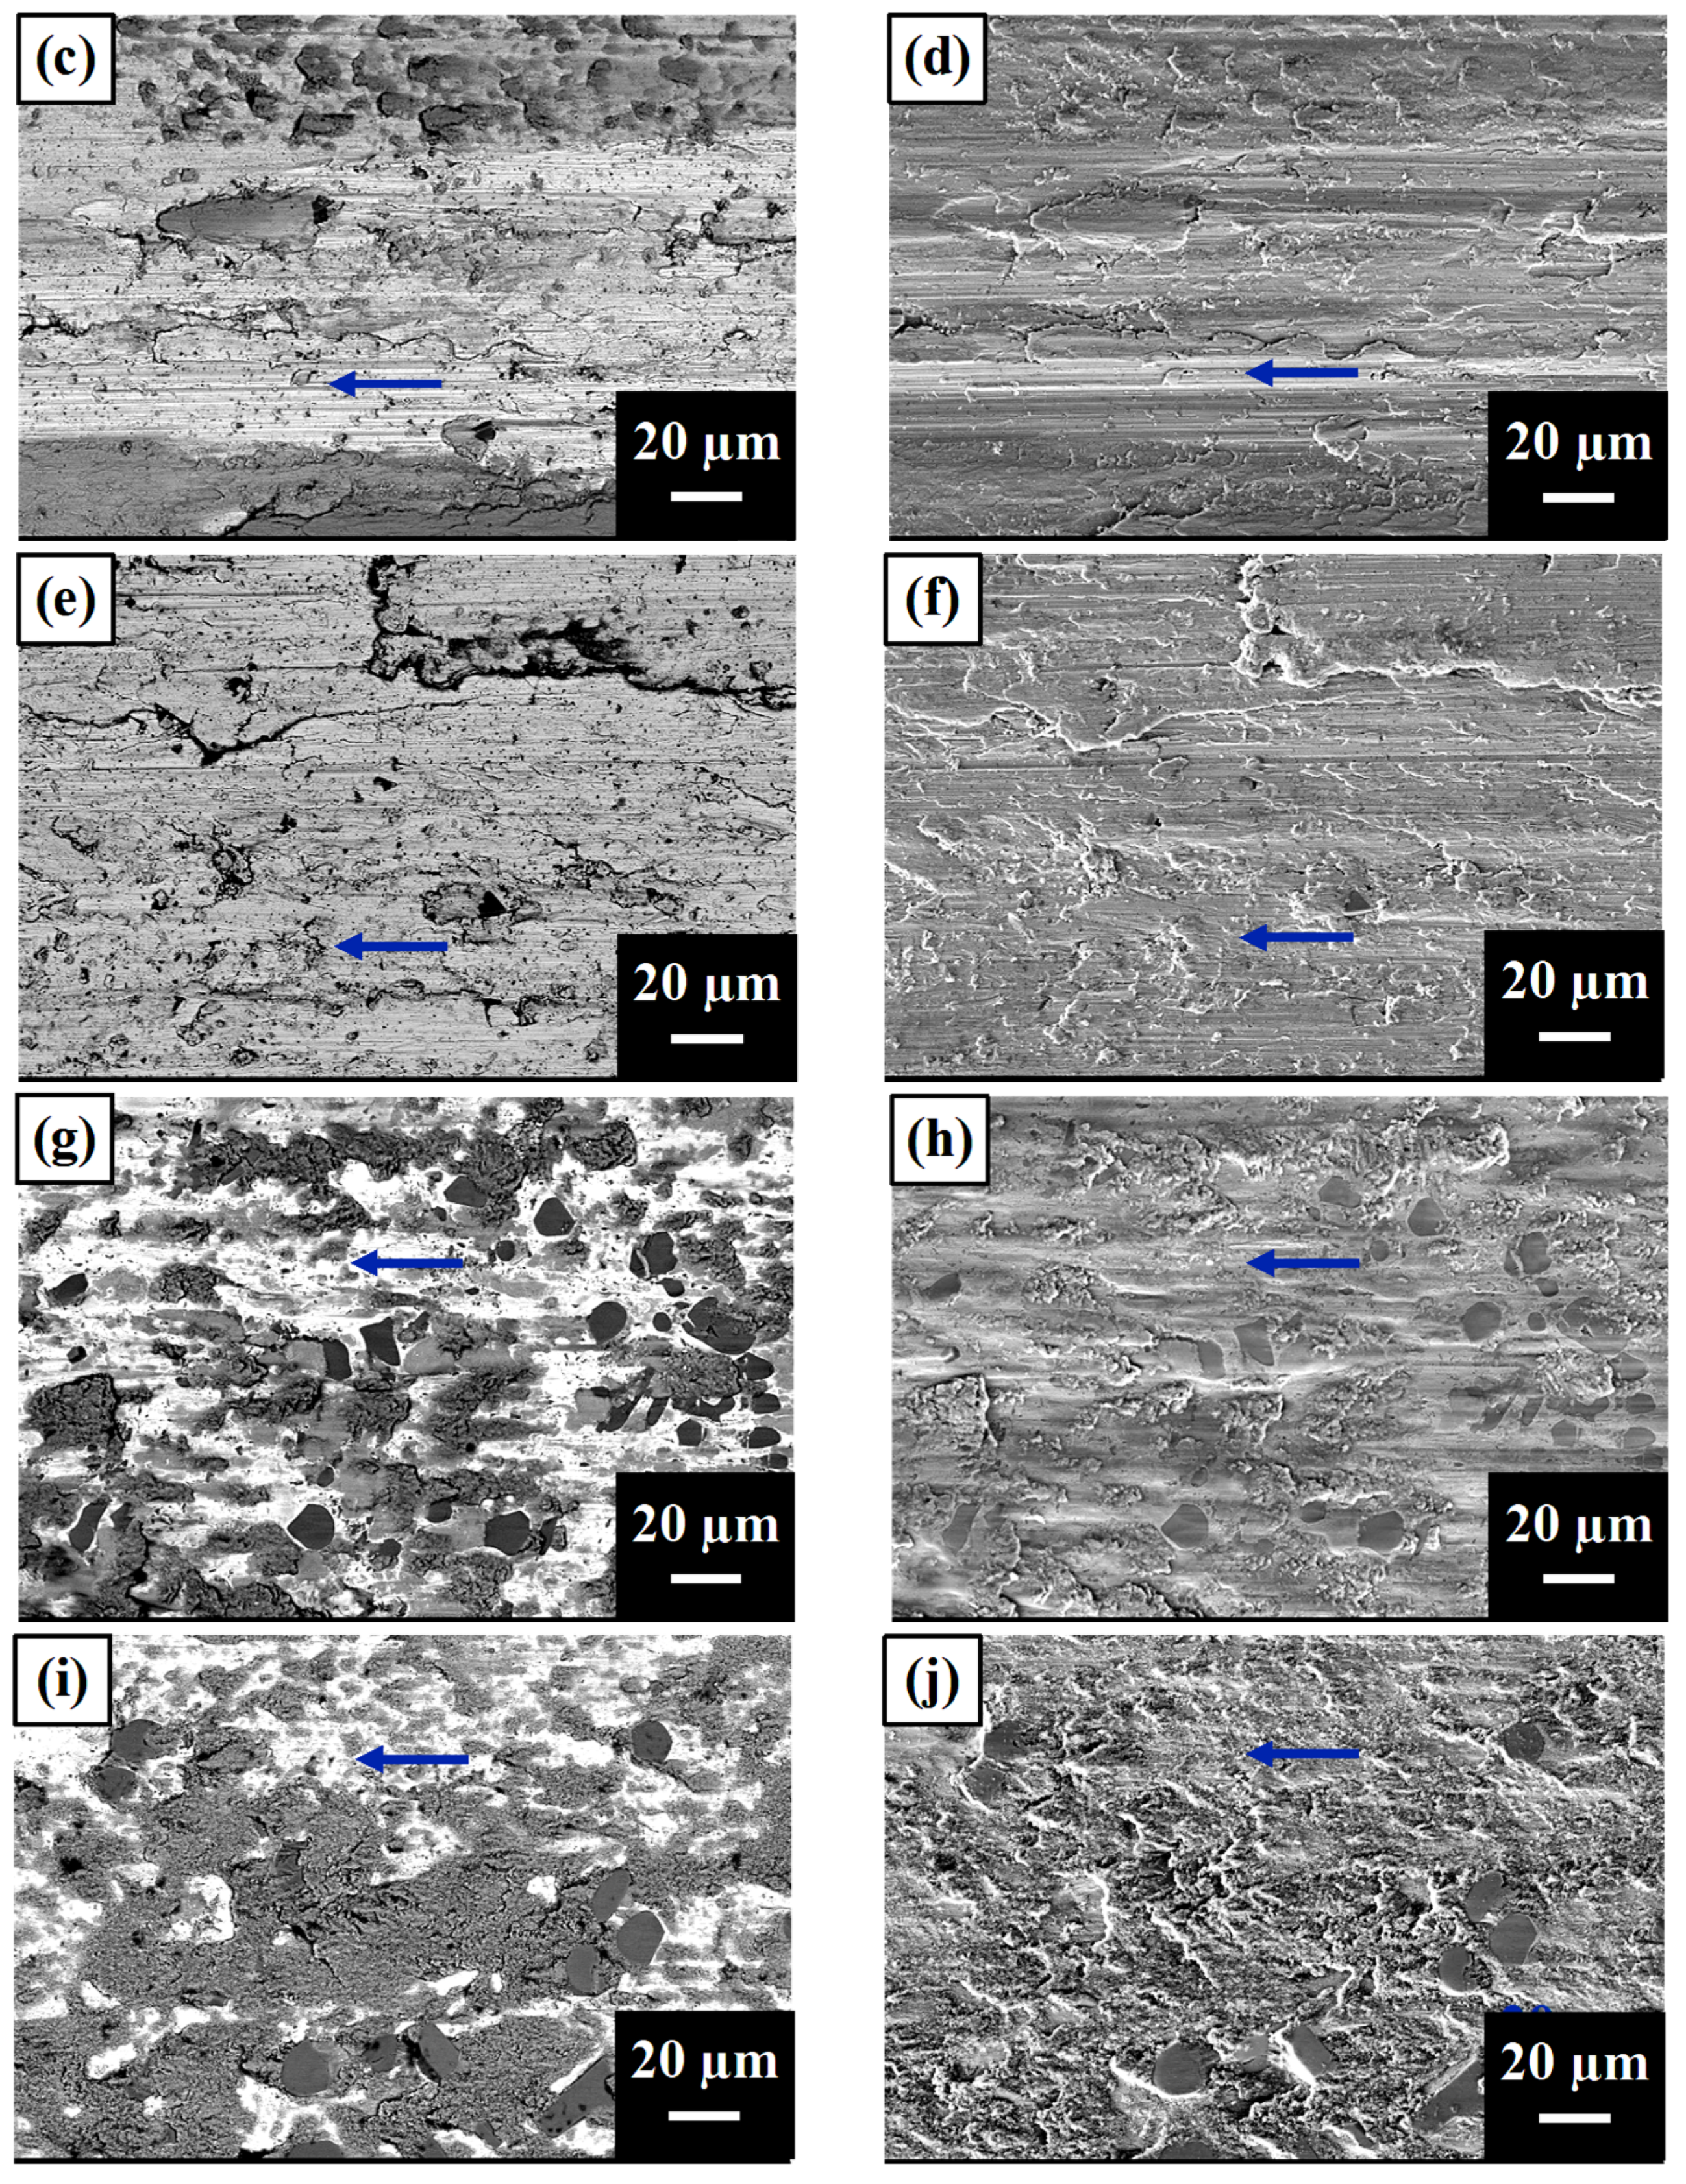
4.1. Morphology Analysis for Wear Behavior

Because changes in morphology could be used to explain variations in wear resistance, the morphology of the prepared materials was analyzed after the pin-on-disk wear tests. Notably, TiC has a high hardness [14], which makes it brittle under high stress [27,33]. Thus, it was expected that friction stress perpendicular to the needle-like TiC in the eutectic structure during the wear test would easily bend and break the needles. However, it was also expected that the resistance to fracture of the block-like TiC particles under friction stress would be significantly higher than that of the needle-like TiC. As A1 and A2 had a high proportion of needle-like TiC, they showed an inferior wear resistance to that of SUS304, even though they exhibited increased hardness with increasing amounts of TiC. However, as blocky carbide is tougher and more difficult to break than the needle-like carbide [38], A3, which had a higher proportion of blocky TiC and a higher C content, strengthened the FCC matrix. Thus, A3 exhibited better wear resistance and hardness than A1, A2, and SUS304. In previous studies, M7C3 carbides showed better wear resistance than TiC [39] because they have lower hardness [40] and better toughness [41], which allows them to avoid cracking. Therefore, A4 and A5, which feature a different morphology of M7C3 carbides, exhibited a significantly higher wear resistance. Furthermore, their hardness was enhanced due to the higher proportion of TiC and M7C3. This was especially evident in A5, which contained the highest amount of TiC and M7C3 and exhibited the highest hardness and wear resistance.
Furthermore, it was found that the friction coefficient varied with distance. For the first several hundred meters, the contact of the sample and steel disk had large asperities in the surfaces, which were broken to create a smooth contact surface. After that, the friction coefficient fluctuations were caused by bonding and debonding during adhesive wear. During this process, the fluctuation of the friction coefficient was related to the formation and rupture of micro-joints and the resulting debris rubbing into the wearing interface. The contact surface between the testing sample and the steel disk began to weld and bond to resist the relative motion, thereby increasing the friction coefficient until the micro-joints ruptured. The friction coefficient decreased as the micro-joints degenerated and formed wear debris [42,43,44,45]. Notably, as the volume fraction of carbides increased, the surface became rougher, and the friction coefficient increased during the wear test. In regard to the different fluctuation patterns between different alloys, it should be noted that the difference is related to the formation of the wear debris. The wear debris affected the friction coefficient because it increased the surface roughness of the rubbing surfaces, which caused the fluctuations. Regarding the friction coefficient of the alloys, it is noted that A1 and A2 exhibited many needle-like TiC protrusions that most likely broke off to form wear debris. Thus, their friction coefficient curves exhibit a greater fluctuation with the variation in roughness. However, as the amounts of carbides increased (i.e., in alloys A3, A4, and A5), A3 started to form block-like TiC particles, which had better resistance to fracture. As a result, the friction coefficient curve of A3 showed a lower fluctuation than those of A1 or A2 because its rubbing surface exhibited less roughness variation. Similarly, A4 and A5 contained more block-like TiC particles, as well as M7C3, which resulted in better toughness and improved wear resistance while producing less wear debris. Thus, the friction coefficient curves of A4 and A5 were stable.
Although the hardness of the alloys increased with the TiC volume fraction, the wear resistance only increased from A3 to A5. Thus, while hardness typically has a positive correlation with wear resistance, the morphology of carbides also plays an important role in resisting fracture, as explained above.

4.2. Composition Analysis for Corrosion Behavior

These results show that A1, A2, and A3 had lower corrosion resistance than SUS304 owing to the localized attack of the composites at the TiC particle–matrix interface [46]. Moreover, A1, A2, and A3 had lower Ni and Cr contents in the FCC dendrite relative to those in SUS304, which led to less suitable features and the formation of a relatively weak passive film [47,48]. The improvement observed with an increasing TiC content was also consistent with the gradually increasing Ni and Cr contents. Following the same Cr and Ni content trend, A4 and A5 had better corrosion resistance than SUS304. Apart from the improved corrosion resistance originating from the increased Cr and Ni contents in the FCC matrix, it is believed that the volume fraction of the chemically stable TiC and M7C3 positively contributed to improving the corrosion resistance [49,50], as the exposed area fraction of the alloy matrix correspondingly reduces when the carbide content increases.
For the corrosion behavior in the 1.5 M HCl solution, the austenite matrix reacted with Cl ions to cause mass loss [51]. However, there were limited Cl ions in the corrosive solution; the mass loss of the alloys terminates when the Cl ions are depleted. Therefore, the sample with a lower mass loss and a longer time to depletion was considered to have better corrosion resistance. Because Ni and Cr contents led to better corrosion resistance than Fe in the austenite matrix [52], the corrosion resistance increased with the higher ratio of Ni and Cr contents. Additionally, TiC and M7C3 carbides also covered the exposed austenite matrix to protect it from corroding. Therefore, the corrosion resistance improved with a greater carbide ratio and higher Ni and Cr contents in the austenite matrix.
Substituting Cl ions with SO42– ions results in a similar concept, as the SO42– ions react with the austenite matrix [53]. The A1–A4 terminated surfaces corroded within 168 h, indicating that they had poor corrosion resistance in a sulfuric environment. However, the alloy showed better corrosion resistance in sulfuric environments owing to the high ratio of Ni [54] and Cr [55] contents in the austenite matrix, and even the higher ratio of carbides. Thus, A5 exhibited the best corrosion resistance because it possessed the greatest content of Ni, Cr, and carbide.
As for the 1.5 HNO3 solution, because NO3 ions corrode TiC [56], the corrosion resistance decreased with the TiC ratio. This is also the reason why a higher carbide content displayed a higher mass loss at 1680 h (the final test duration).

5. Conclusions

This study applied the HEA concept to incorporate various amounts of Ti and C into SUS304 stainless steel to create an alloy with good wear and corrosion resistance by in-site precipitating carbide reinforcements. Five compositions were designed to have equivalent 5, 10, 15, 20, and 25 volume percentages of TiC in SUS304 and were named as A1, A2, A3, A4, and A5, respectively. The following conclusions were drawn from this study:
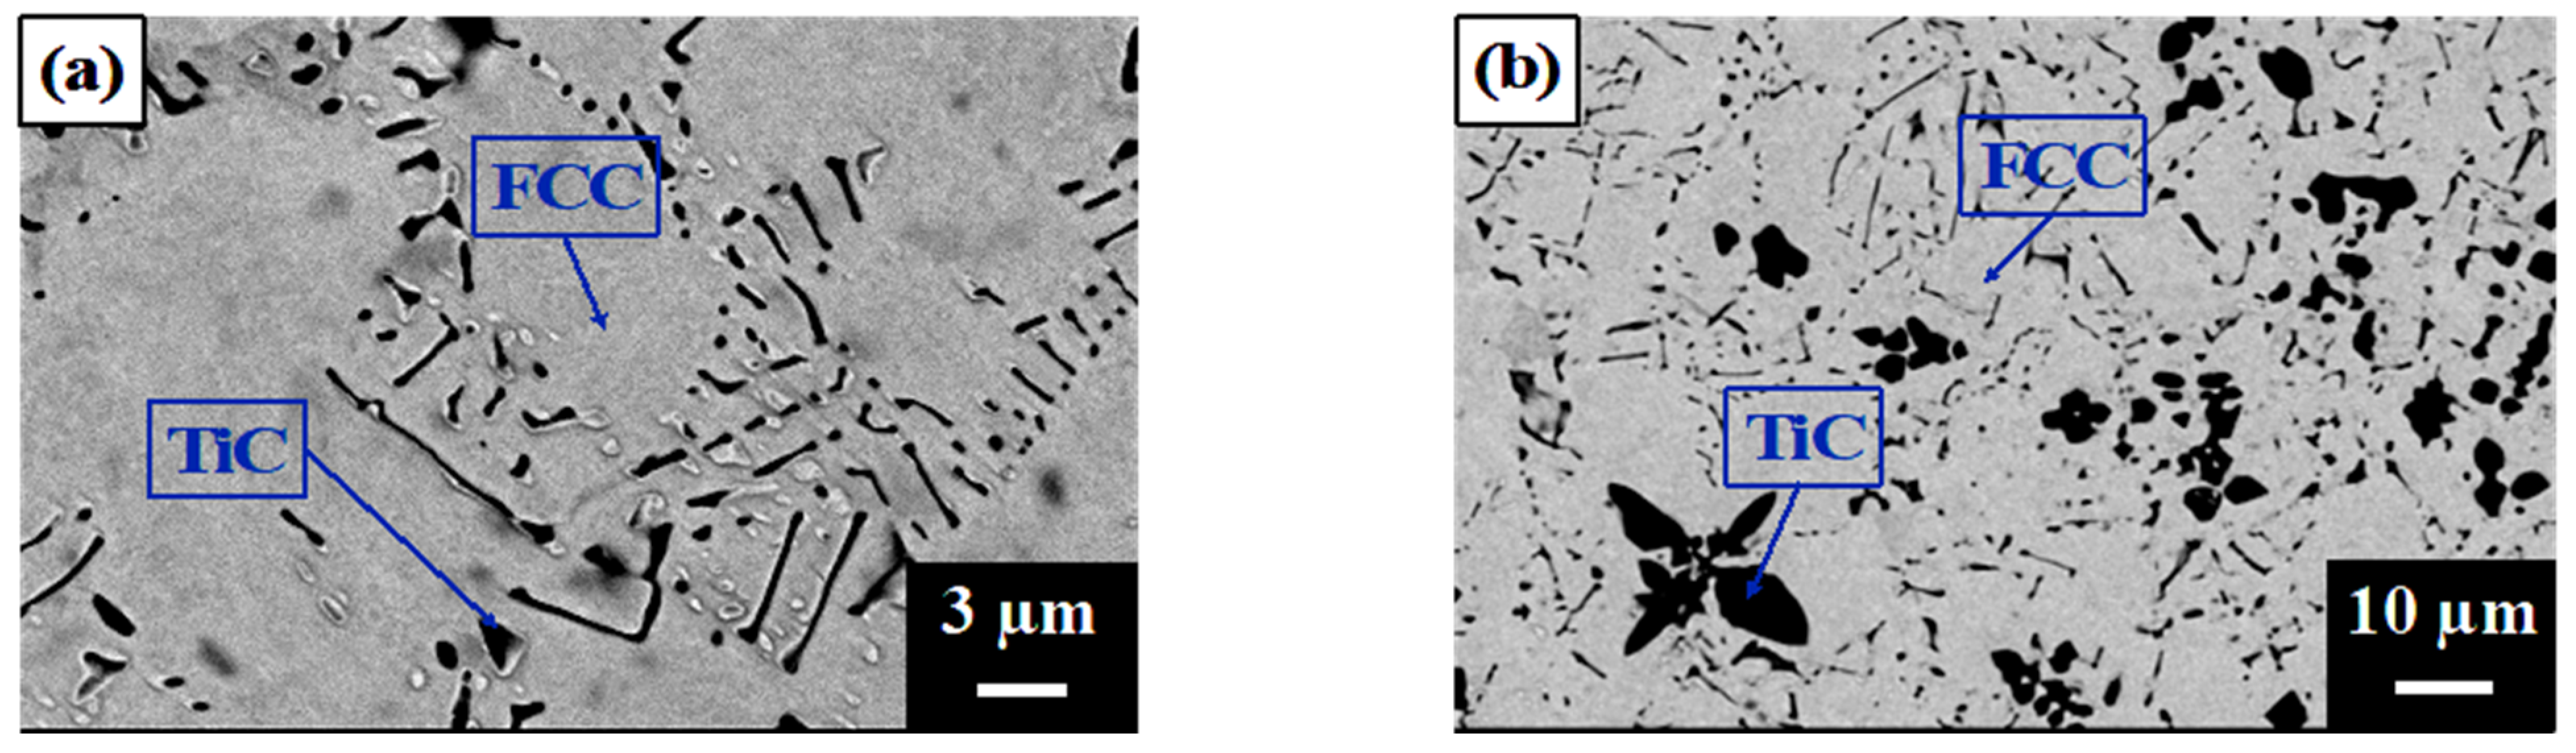
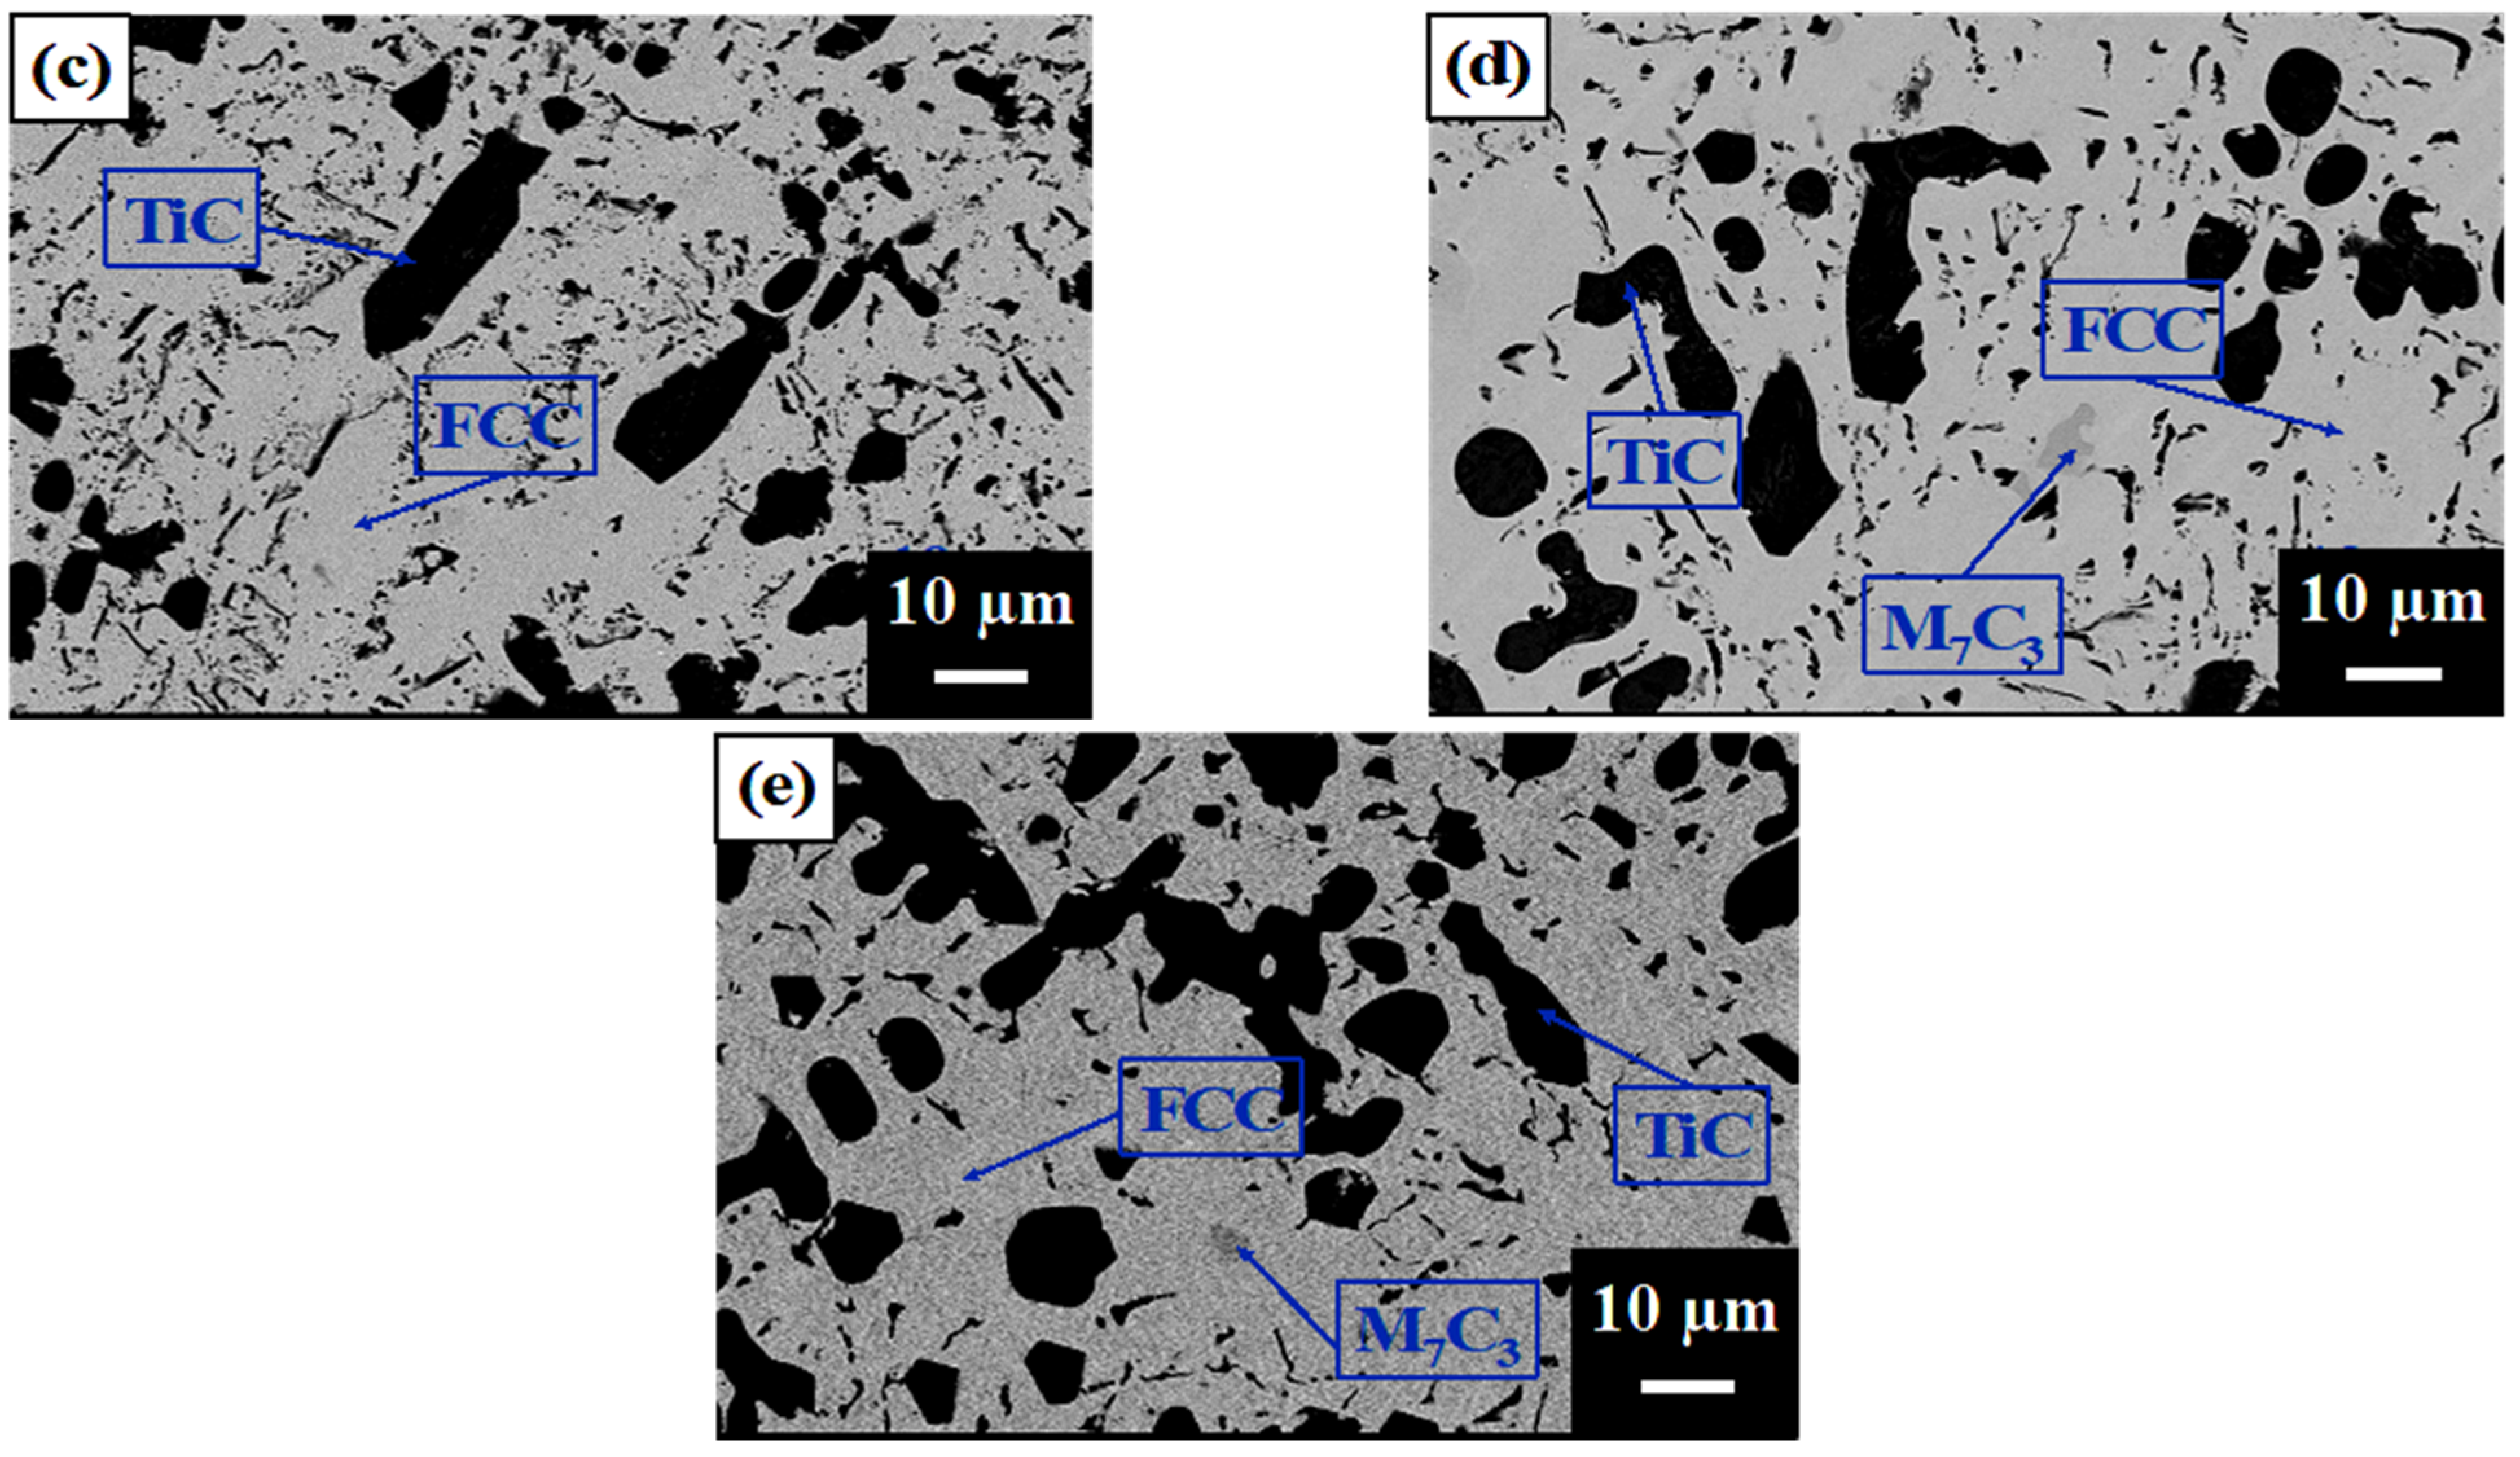
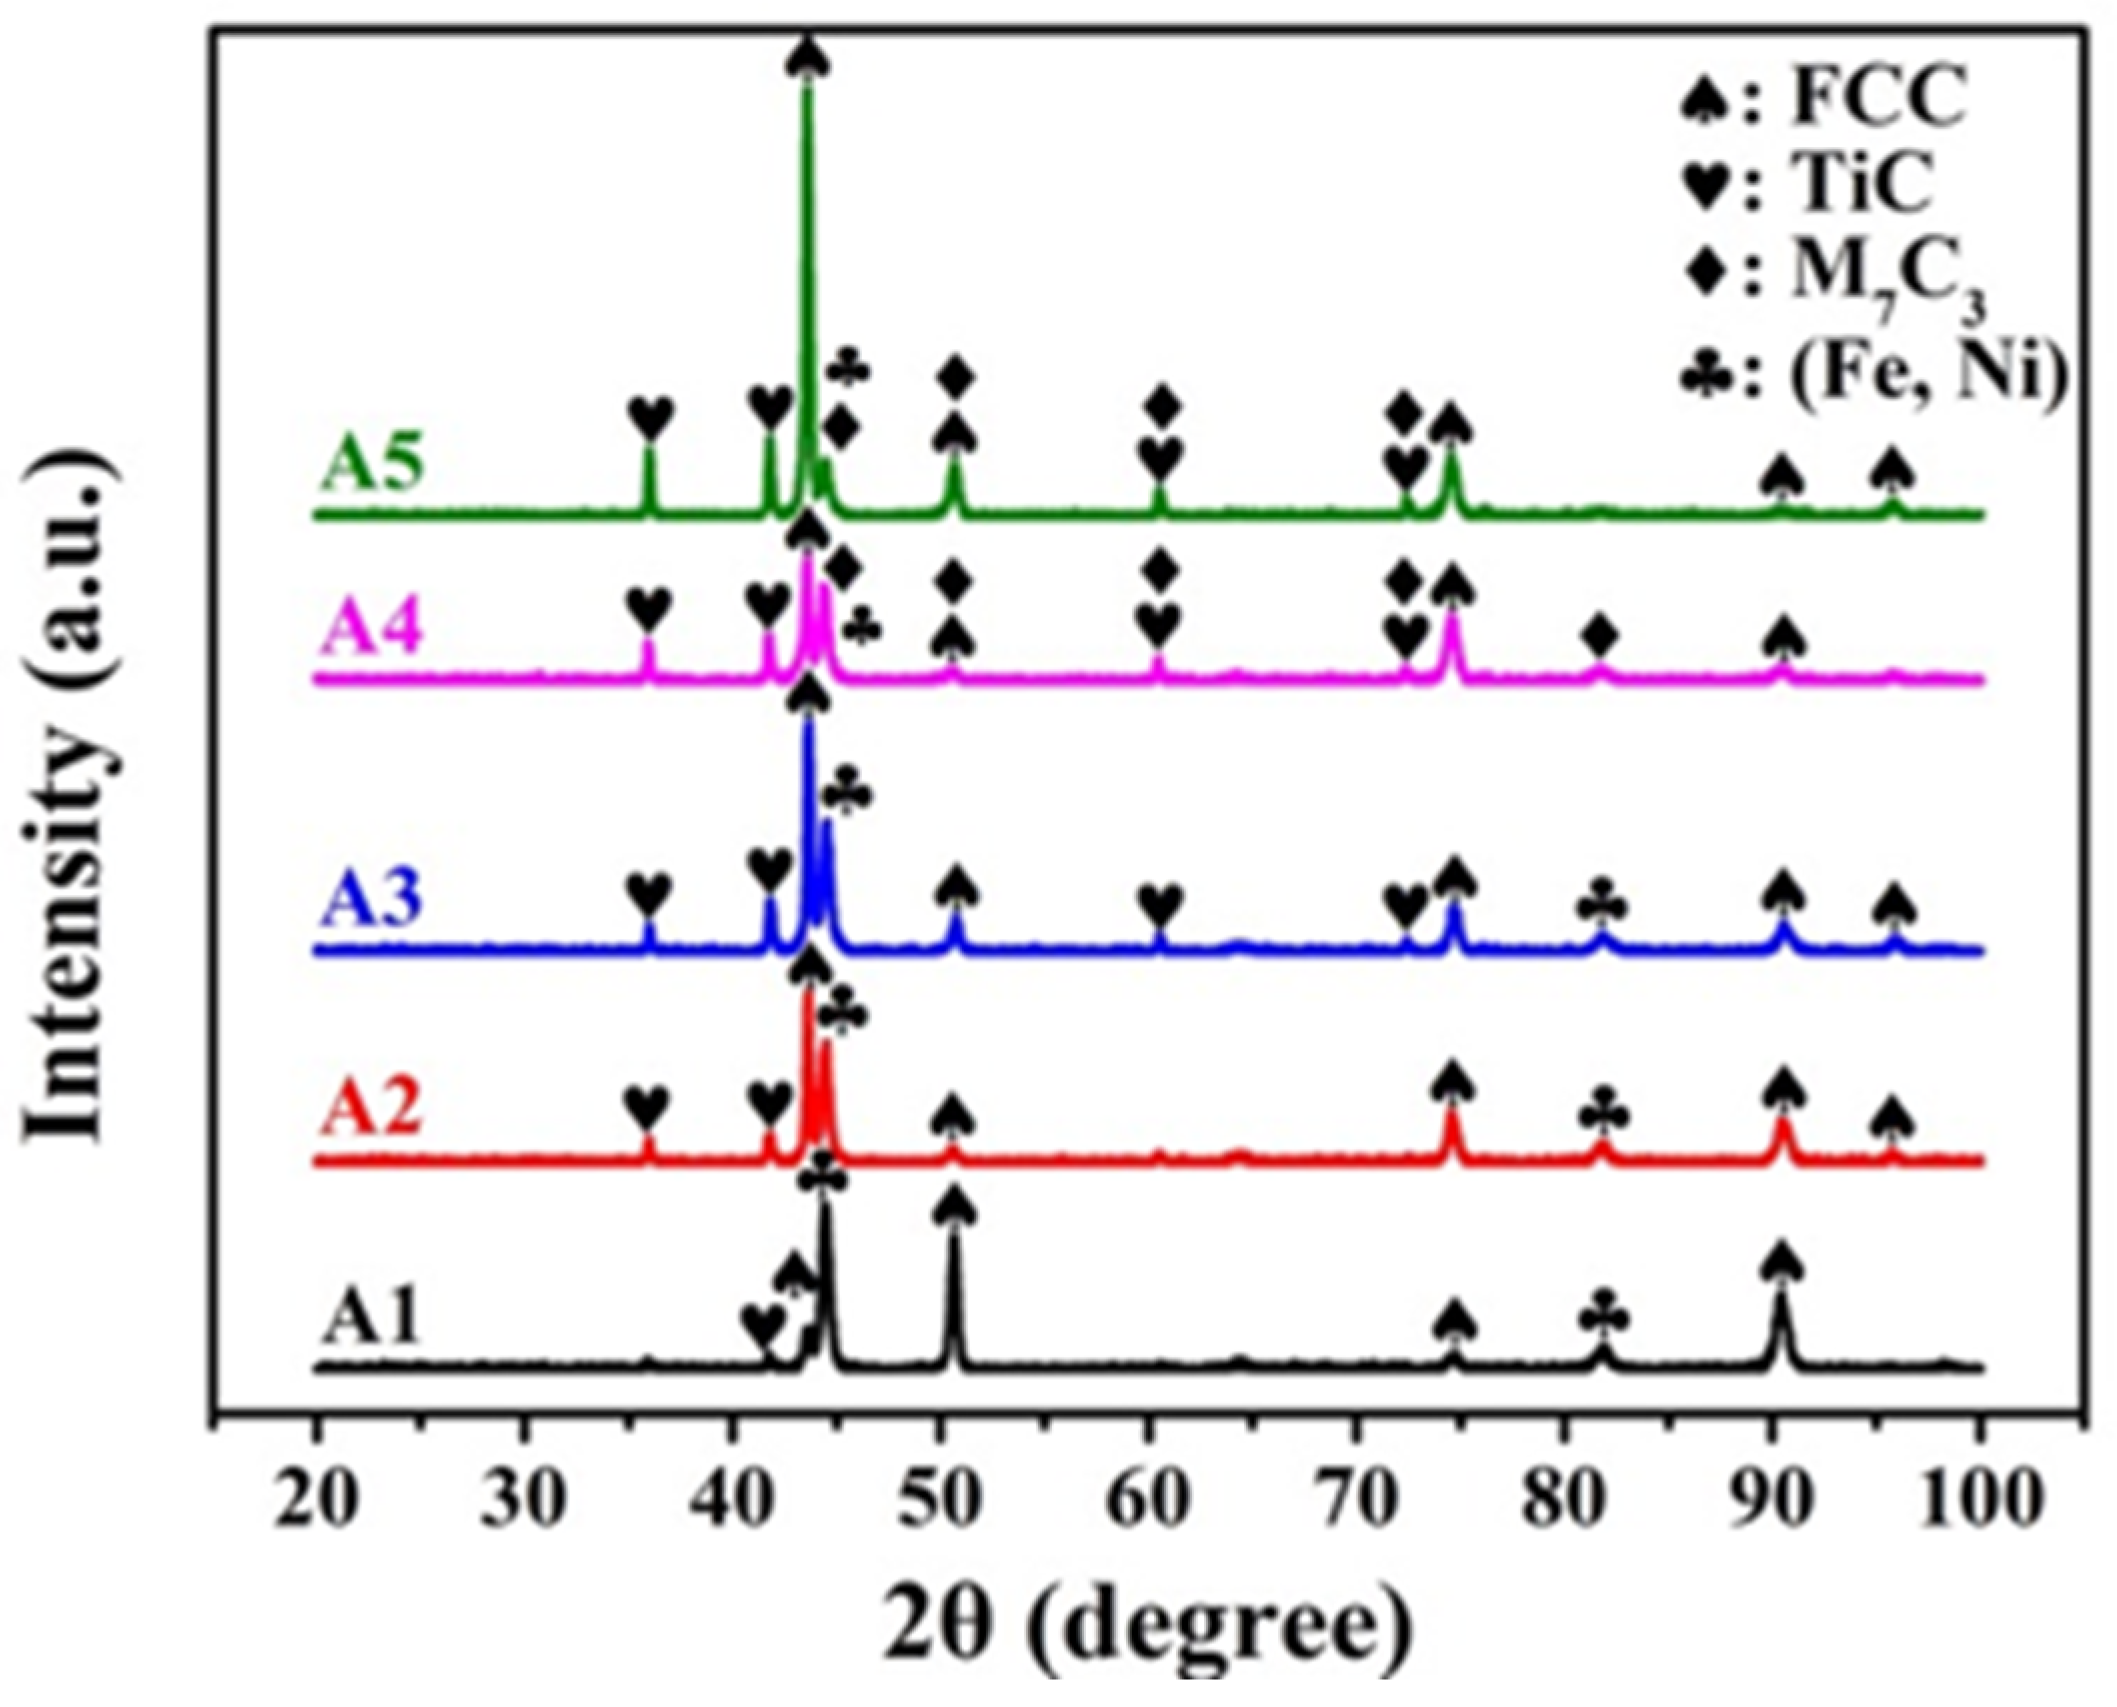
  • All alloys contained a TiC phase and an austenite matrix (FCC) in which A1 had a eutectic structure between the FCC dendrites, and A2, A3, A4, and A5 contained proeutectic dendritic TiC, dendritic FCC enveloping the TiC dendrite, and a eutectic structure. The volume fraction of the TiC dendrites increased, but that of the eutectic phase decreased with an increasing TiC content, and A4 and A5 had M7C3 carbides in addition to TiC. A second FCC phase with a slightly smaller lattice constant was identified as a (Fe and Ni) phase, which was the eutectic FCC phase with a higher Cr content than the proeutectic FCC.
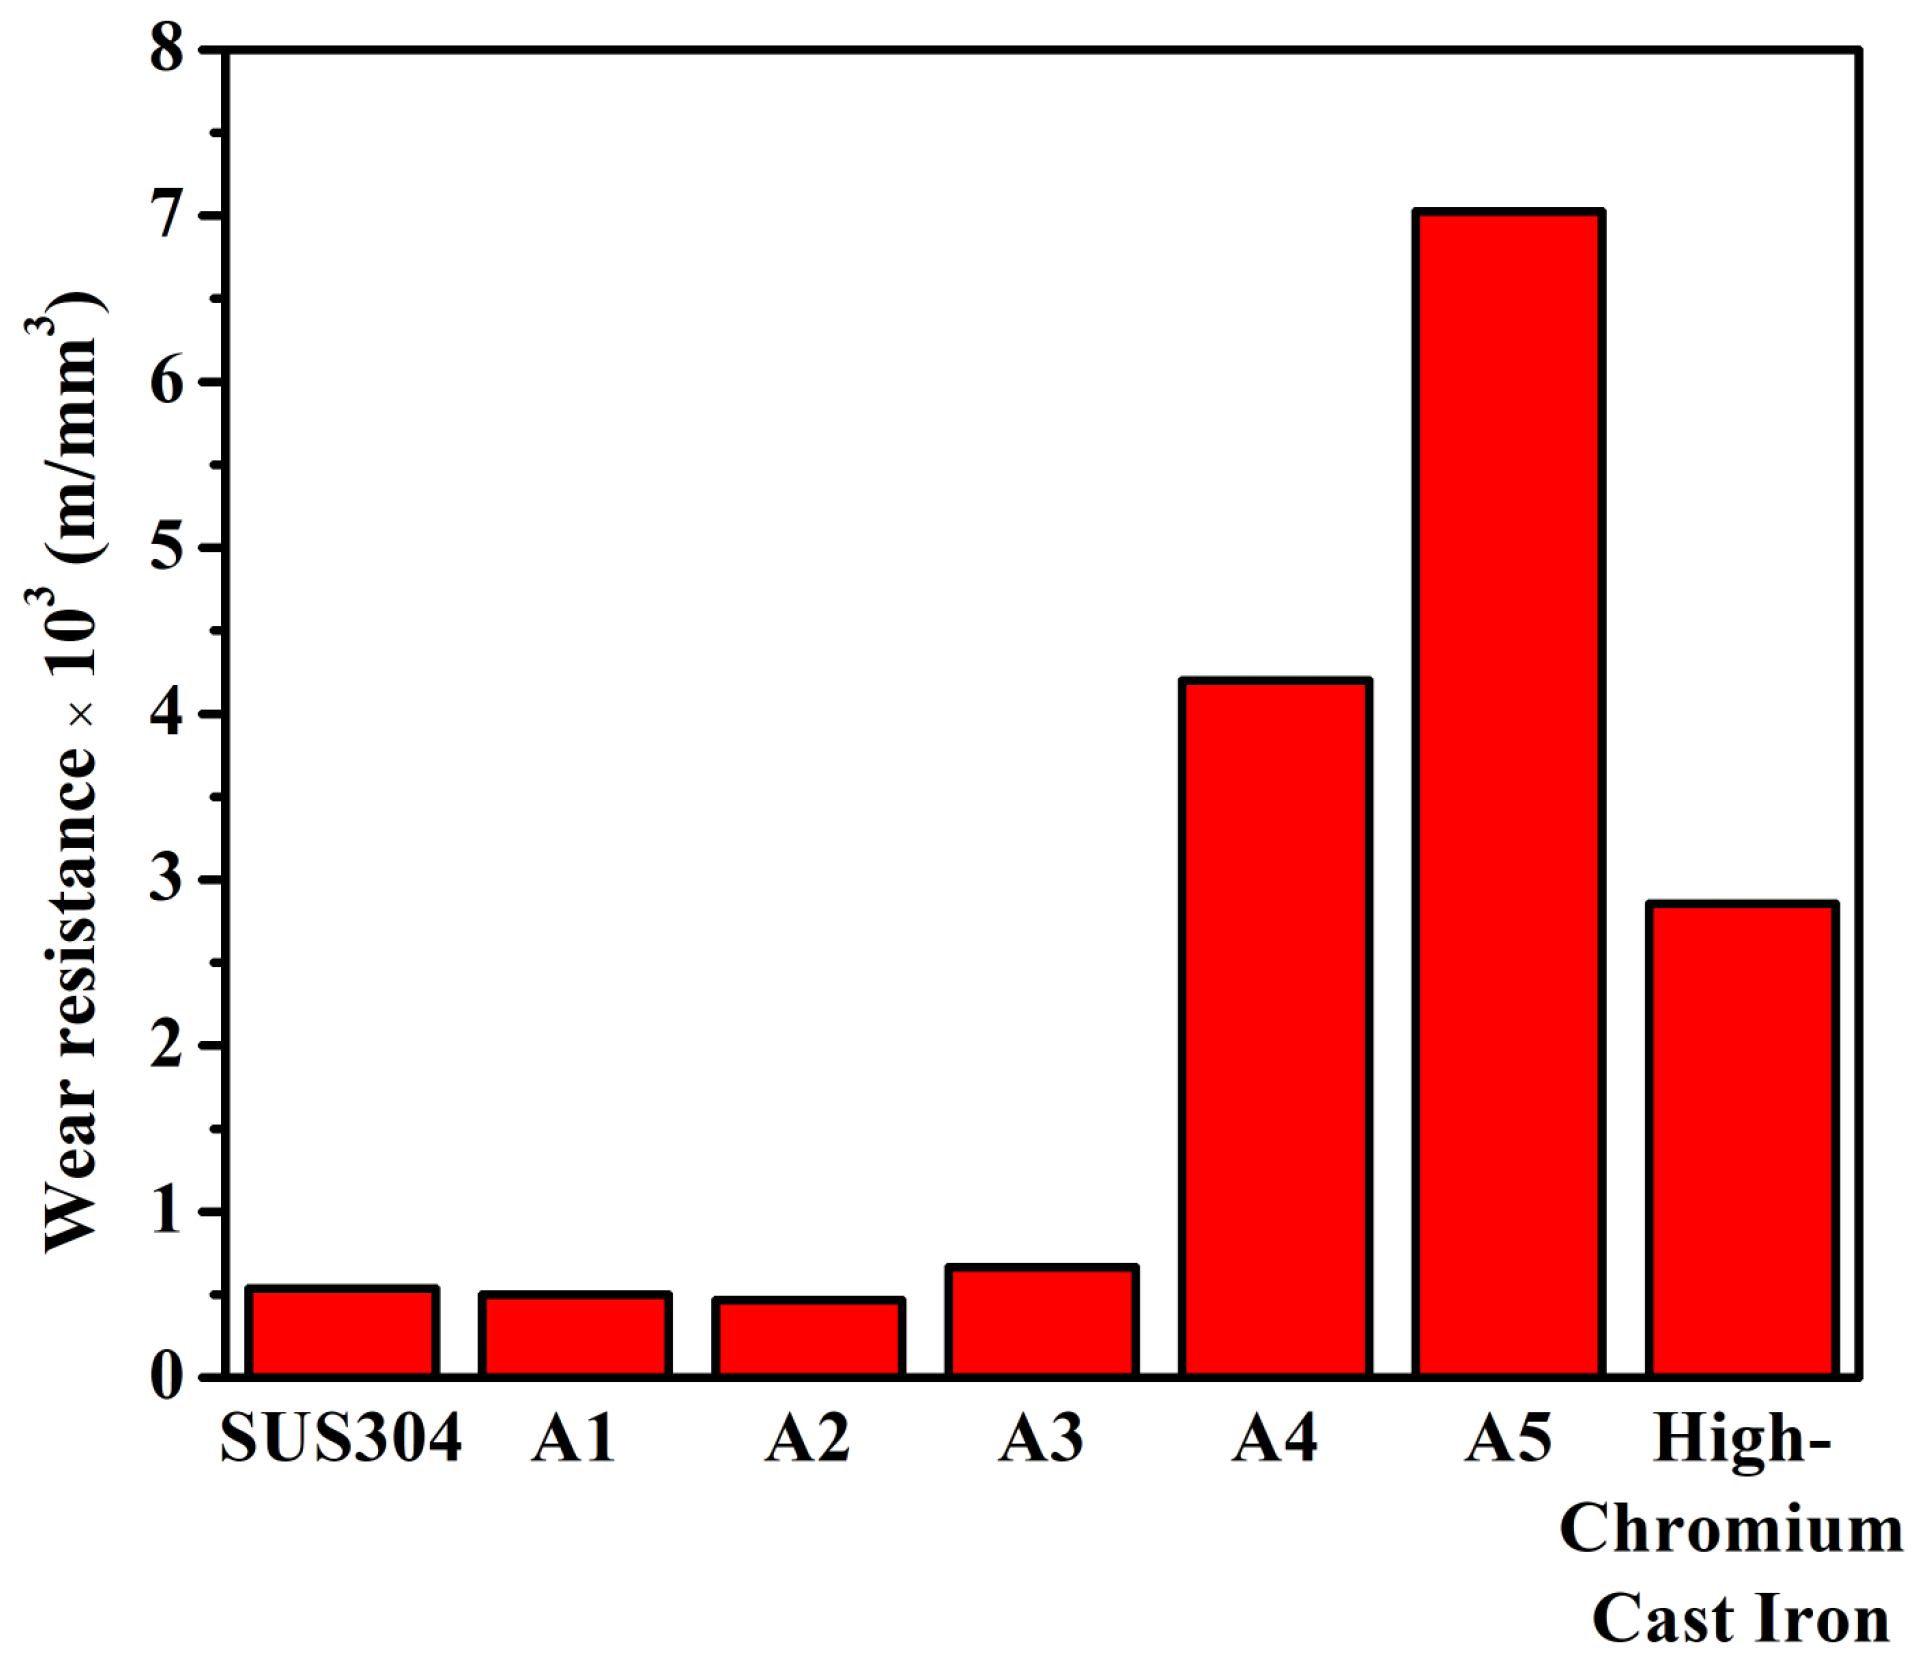
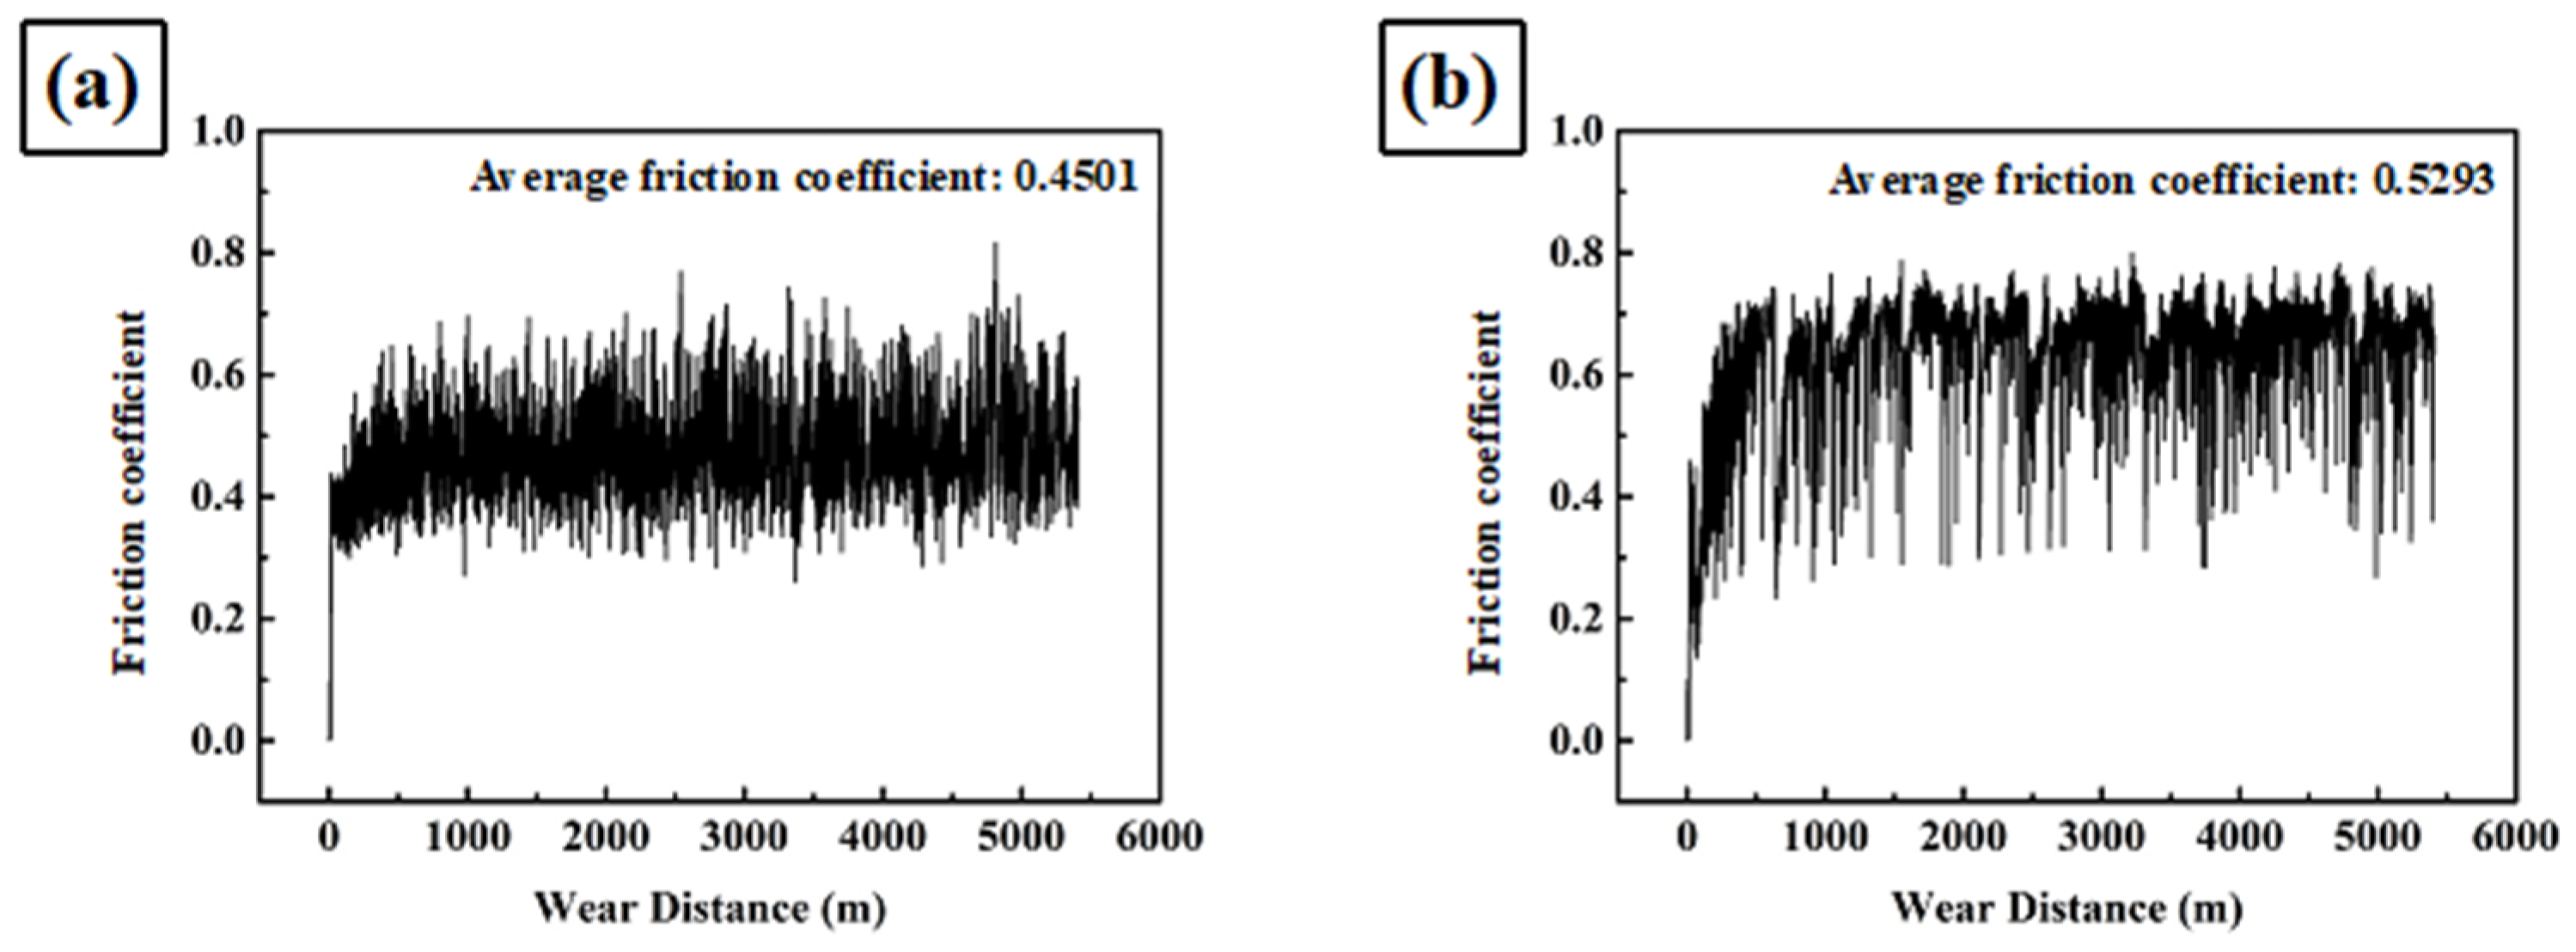
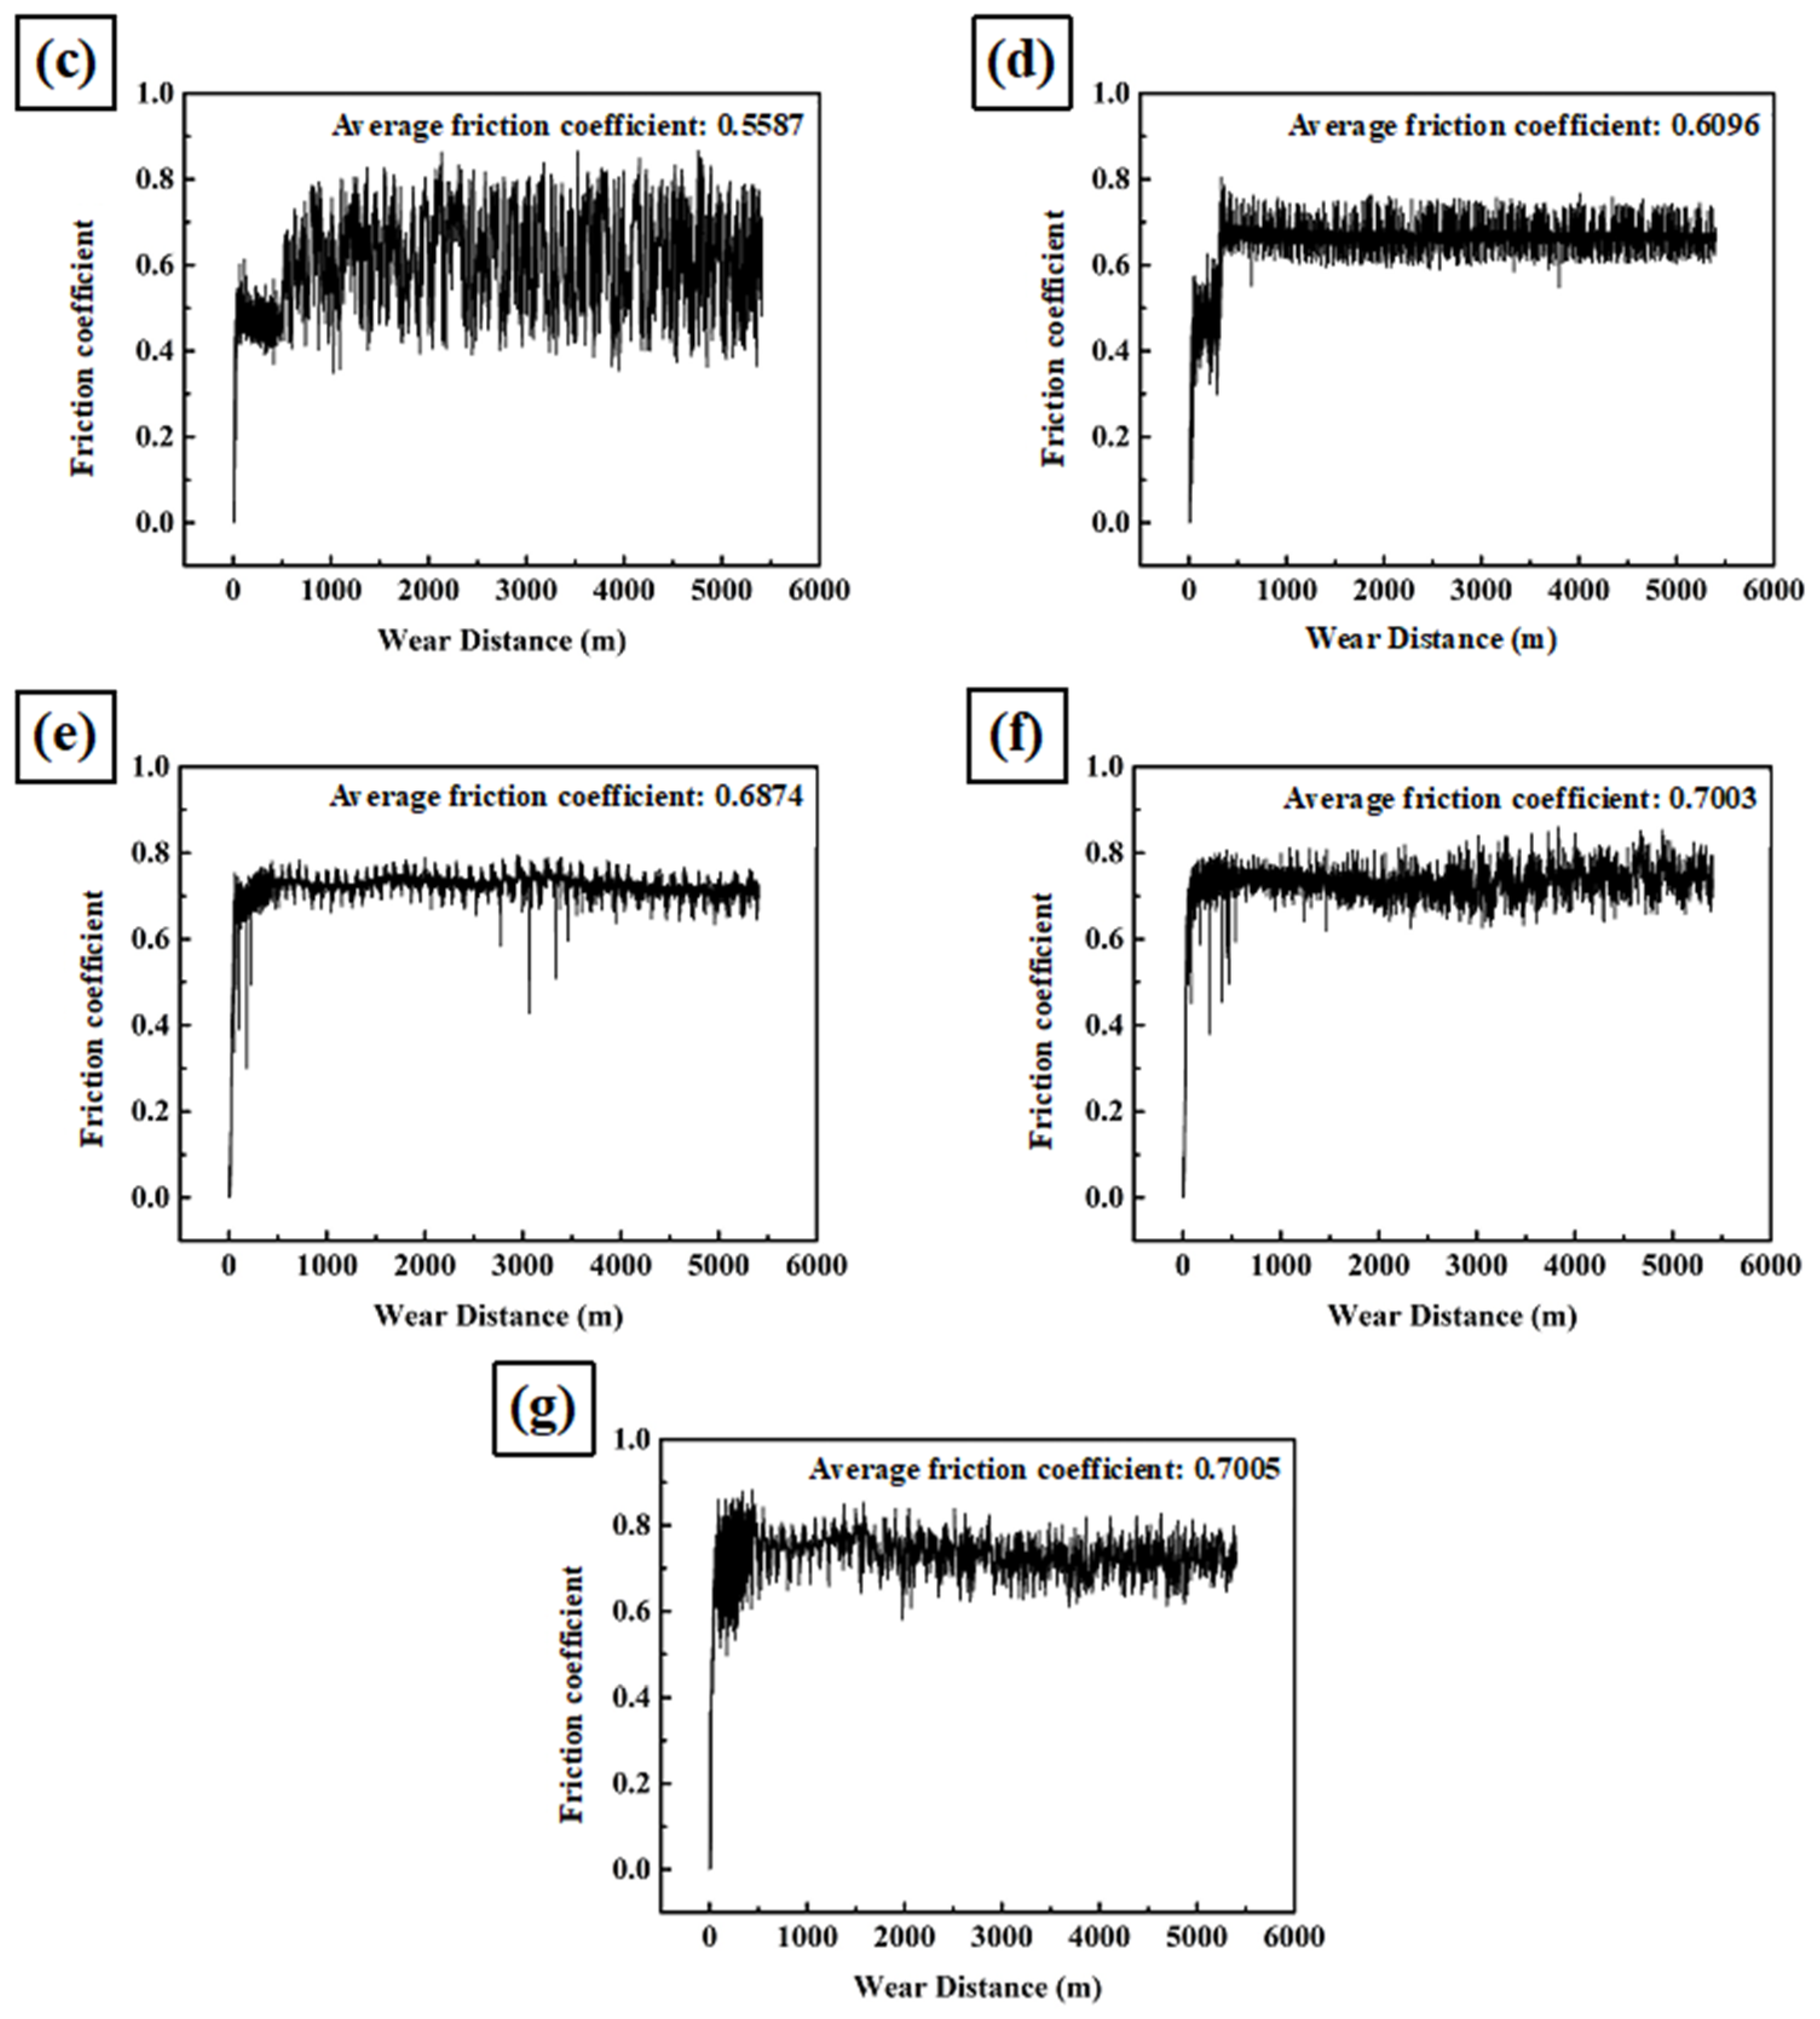
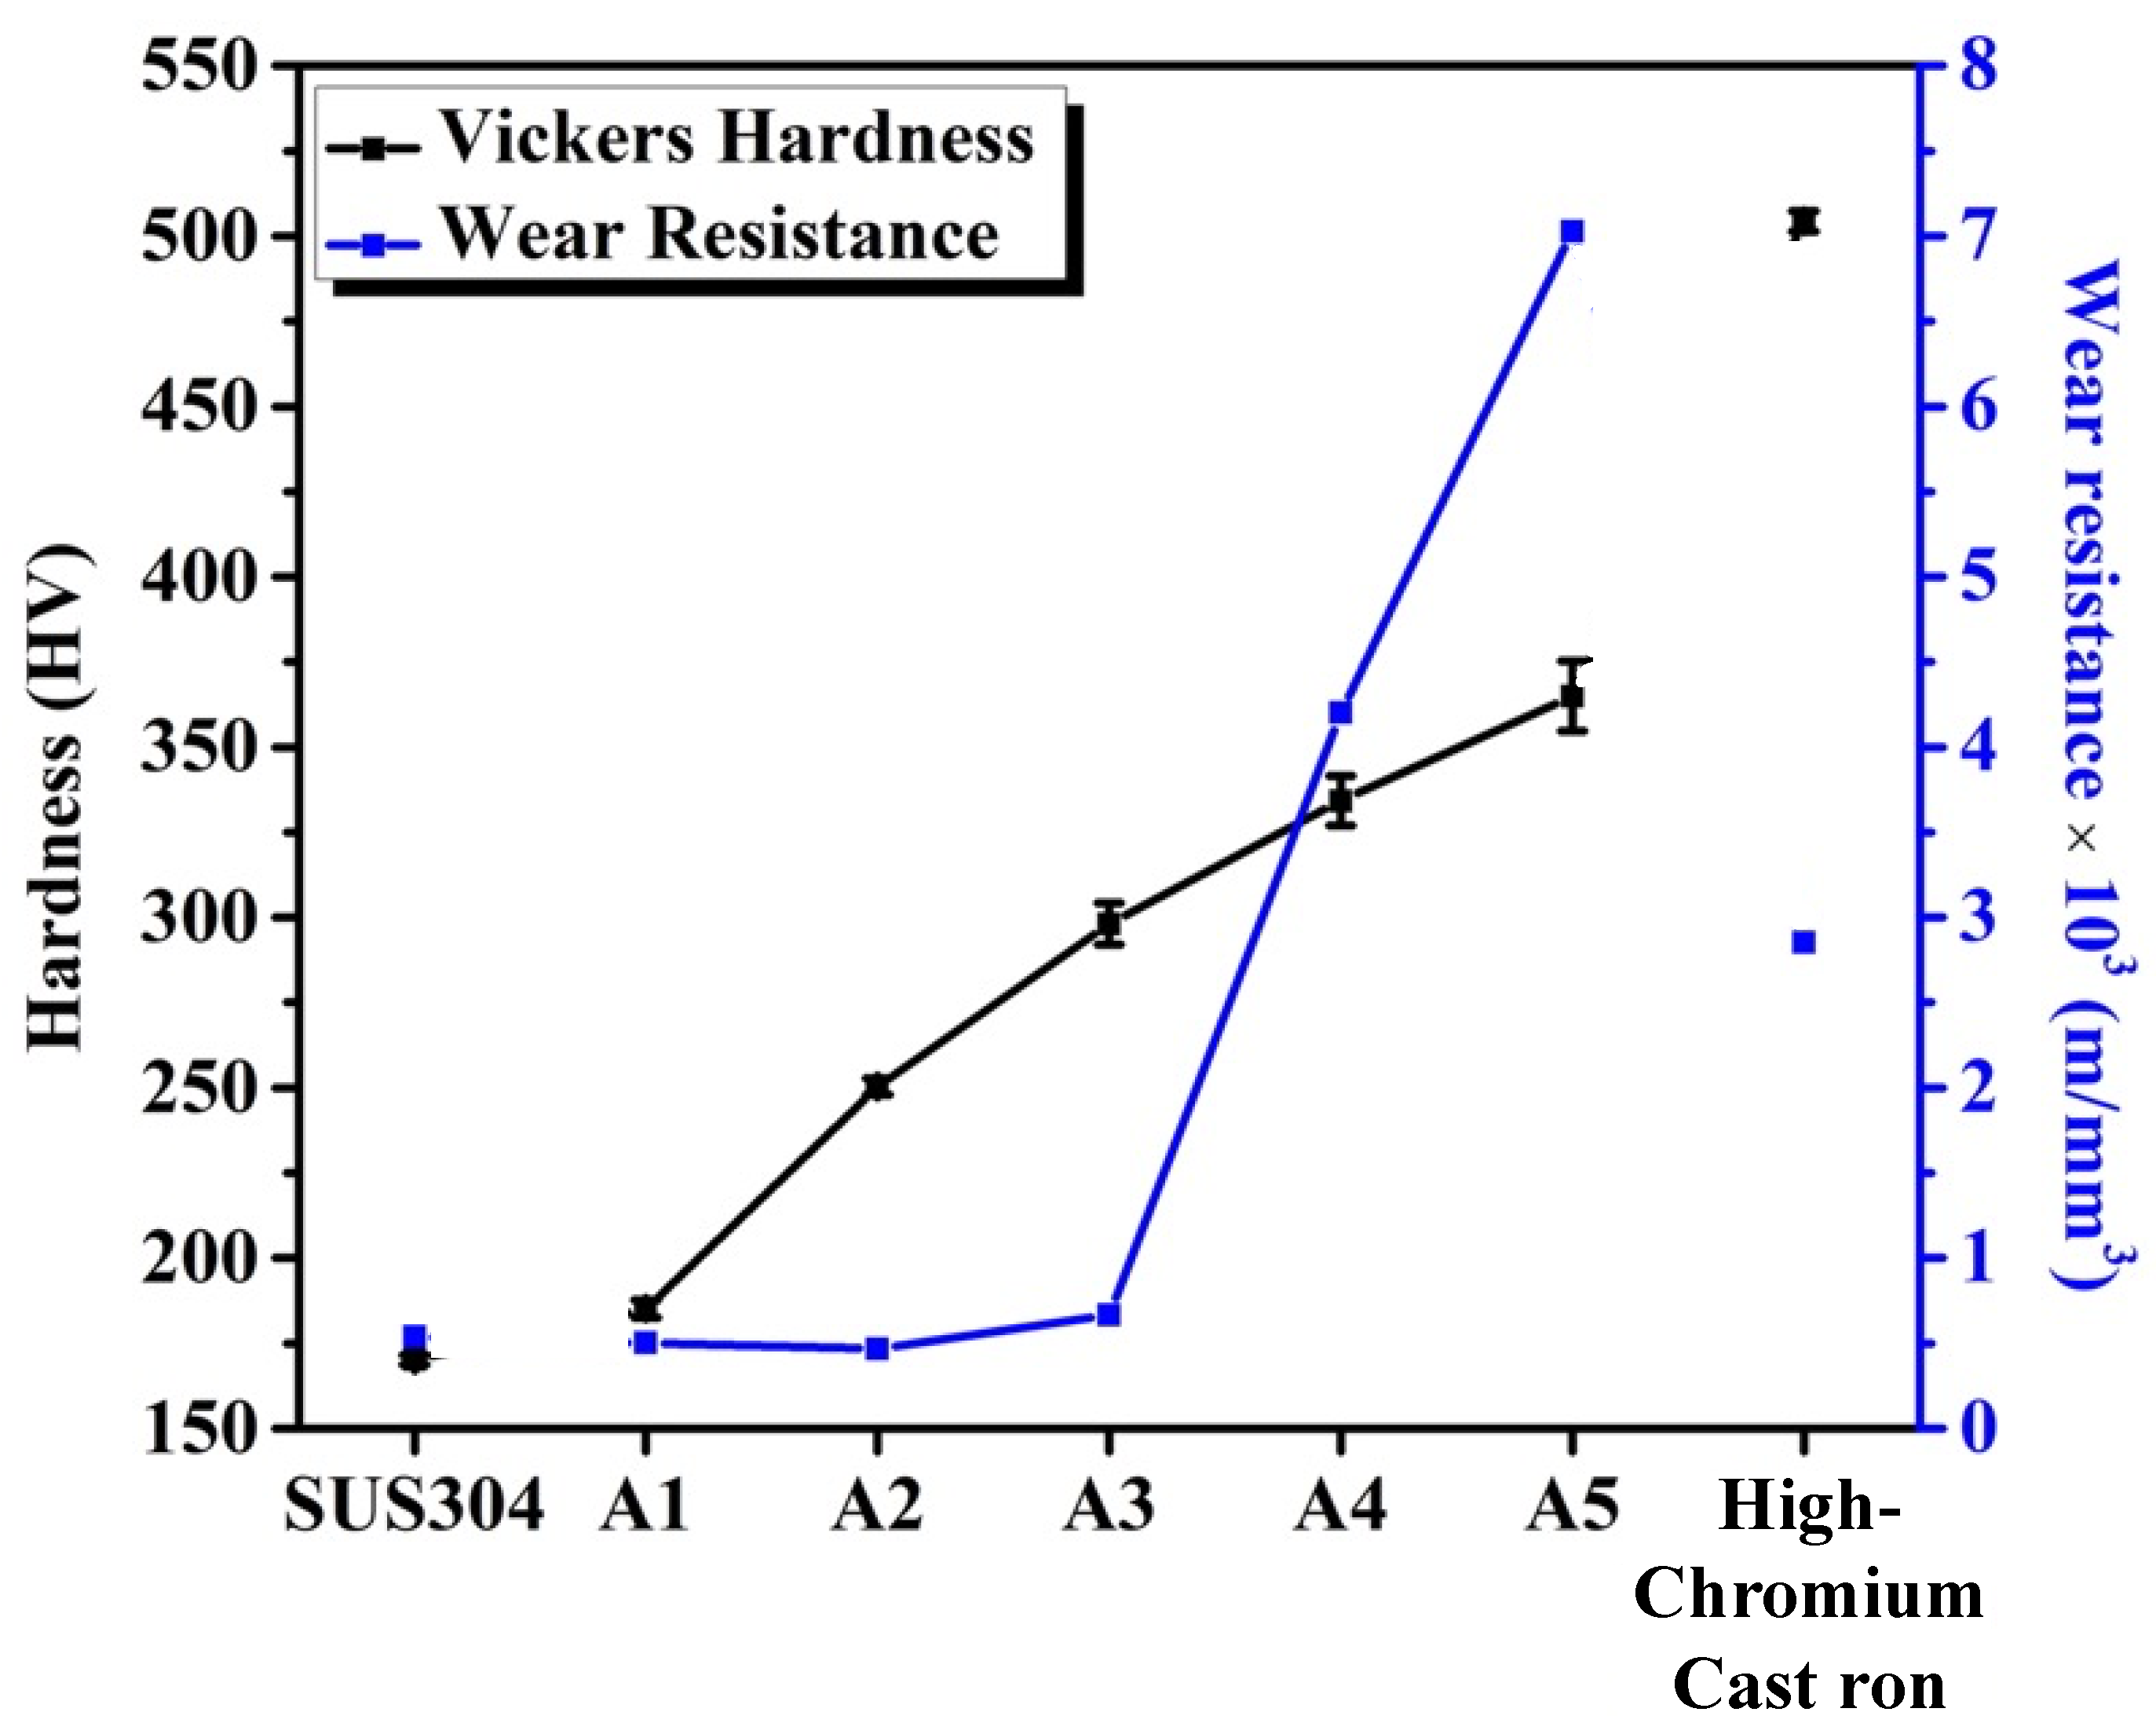
  • The hardness of the alloys increased from 185 HV (A1) to 365 HV (A5). The microstructural morphology affected the wear resistance during the adhesive wear tests. A1 and A2 had needle-like TiC with poor wear resistance, which was lower than that of SUS304. A4 and A5, having more block-like TiC and M7C3 carbides, showed good wear resistance. Notably, A5 exhibited the best wear resistance, followed by A4. Both A4 and A5 performed considerably better than high-chromium cast iron.
  • A4 and A5 exhibited better corrosion resistance in every aspect than SUS304, with A5 exhibiting the best performance. Apart from the improved corrosion resistance owing to the increased Cr and Ni contents of the FCC matrix, the increased volume fraction of chemically stable TiC and M7C3 also positively contributed to the improved corrosion resistance, as the exposed area fraction of the alloy matrix correspondingly reduced when the carbide content increased. A5 showed excellent corrosion resistance in all the acid solutions. A4 exhibited good corrosion resistance in all the acid solutions, except in the H2SO4 solution.
  • A5 exhibited the best wear and corrosion resistance, thus, demonstrating great potential to be applied in wear and corrosive environments, such as rotary shafts, rotors, bearings, and structural parts in food, as well as in the chemical and optoelectronic industries. Apart from its poor performance in the sulfuric acid solution, A4 also exhibited good wear and corrosion resistance. Therefore, this could be used as a low-cost alternative to A5.
  • Overall, this study provides a conceptual design for improved SUS304 stainless steel with enhanced mechanical and anti-corrosive properties. In particular, A4 and A5 alloys could be applied for commercial use. Furthermore, this study investigated the microstructure and properties of alloys and revealed the effect of incorporating carbides in 304 stainless steel. Thus, similar alloy designs could be applied to improve other Fe–Cr–Ni stainless steel systems.

Author Contributions

Conceptualization, C.-J.L. and J.-W.Y.; data curation, C.-J.L.; formal analysis, C.-J.L. and J.-W.Y.; funding acquisition, J.-W.Y.; investigation, C.-J.L.; project administration, C.-J.L.; resources, C.-J.L.; supervision, J.-W.Y.; validation, C.-J.L.; visualization, C.-J.L.; writing—original draft preparation, C.-J.L.; writing—review and editing, J.-W.Y. All authors have read and agreed to the published version of the manuscript.

Funding

This work was financially supported by the “High Entropy Materials Center” through The Featured Areas Research Center Program within the framework of the Higher Education Sprout Project of the Ministry of Education (MOE) and through Project MOST 107-3017-F-007-003 of the Ministry of Science and Technology (MOST) of Taiwan.

Data Availability Statement

Not applicable.

Acknowledgments

We would like to thank Su-Yueh Tsai (of the Instrumentation Center at NTHU) for assisting with the high-resolution hyper probe analysis.

Conflicts of Interest

The authors declare no conflict of interest.

References

  1. Yeh, J.W.; Chen, S.K.; Lin, S.J.; Gan, J.Y.; Chin, T.S.; Shun, T.T.; Tsau, C.H.; Chang, S.Y. Nanostructured high-entropy alloys with multiple principal elements: Novel alloy design concepts and outcomes. Adv. Eng. Mater. 2004, 6, 299–303. [Google Scholar] [CrossRef]
  2. Yeh, J.W. Recent progress in high entropy alloys. Ann. Chim. Sci. Mat. 2006, 31, 633–648. [Google Scholar] [CrossRef]
  3. Yeh, J.W. Alloy Design Strategies and Future Trends in High-Entropy Alloys. JOM 2013, 65, 1759–1771. [Google Scholar] [CrossRef]
  4. Tsai, M.H.; Yeh, J.W. High-Entropy Alloys: A Critical Review. Mater. Res. Lett. 2014, 2, 107–123. [Google Scholar] [CrossRef]
  5. Ye, Y.F.; Wang, Q.; Lu, J.; Liu, C.T.; Yang, Y. High-entropy alloy: Challenges and prospects. Mater. Today 2016, 19, 349–362. [Google Scholar] [CrossRef]
  6. Yeh, J.W.; Lin, S.J. Breakthrough applications of high-entropy materials. J. Mater. Res. 2018, 33, 3129–3137. [Google Scholar] [CrossRef]
  7. George, E.P.; Raabe, D.; Ritchie, R.O. High-entropy alloys. Nat. Rev. Mater. 2019, 4, 515–534. [Google Scholar] [CrossRef]
  8. Garcia Filho, F.D.C.; Ritchie, R.O.; Meyers, M.A.; Monteiro, S.N. Cantor-derived medium-entropy alloys: Bridging the gap between traditional metallic and high-entropy alloys. J. Mater. Res. Technol. 2022, 17, 1868–1895. [Google Scholar] [CrossRef]
  9. Yan, X.H.; Li, J.S.; Zhang, W.R.; Zhang, Y. A brief review of high-entropy films. Mater. Chem. Phys. 2018, 210, 12–19. [Google Scholar] [CrossRef]
  10. Oses, C.; Toher, C.; Curtarolo, S. High-entropy ceramics. Nat. Rev. Mater. 2020, 5, 295–309. [Google Scholar] [CrossRef]
  11. Wu, C.F.; Arifin, D.E.S.; Wang, C.A.; Ruan, J.J. Coalescence and split of high-entropy polymer lamellar cocrystals. Polymer 2018, 138, 188–202. [Google Scholar] [CrossRef]
  12. Ghahabi, E.; Shajari, Y.; Razavi, M.; Mobasherpour, I.; Fard, S.A.T. Effect of iron content on the wear behavior and adhesion strength of TiC-Fe nanocomposite coatings on low carbon steel produced by air plasma spray. Ceram. Int. 2020, 46, 2670–2676. [Google Scholar] [CrossRef]
  13. Huang, L.; Pan, Y.F.; Zhang, J.X.; Liu, A.J.; Du, Y.; Luo, F.H. Densification, microstructure and mechanical performance of TiC/Fe composites by spark plasma sintering. J. Mater. Res. Technol. JMRT 2020, 9, 6116–6124. [Google Scholar] [CrossRef]
  14. Ni, Z.; Sun, Y.; Xue, F.; Bai, J.; Lu, Y. Microstructure and properties of austenitic stainless steel reinforced with in situ TiC particulate. Mater. Des. 2011, 32, 1462–1467. [Google Scholar] [CrossRef]
  15. Das, K.; Bandyopadhyay, T.K.; Chatterjee, S. Synthesis and characterization of austenitic Steel matrix composite reinforced with in-situ TiC particles. J. Mater. Sci. 2005, 40, 5007–5010. [Google Scholar] [CrossRef]
  16. prava Dalai, R.; Das, S.; Das, K. Development of TiC reinforced austenitic manganese steel. Can. Metall. Q. 2014, 53, 317–325. [Google Scholar] [CrossRef]
  17. Au, C.; Benedetto, A.; Aschner, M. Manganese transport in eukaryotes: The role of DMT1. Neurotoxicology 2008, 29, 569–576. [Google Scholar] [CrossRef] [Green Version]
  18. Squitti, R.; Gorgone, G.; Panetta, V.; Lucchini, R.; Bucossi, S.; Albini, E.; Alessio, L.; Alberici, A.; Melgari, J.M.; Benussi, L.; et al. Implications of metal exposure and liver function in Parkinsonian patients resident in the vicinities of ferroalloy plants. J. Neural. Transm. 2009, 116, 1281–1287. [Google Scholar] [CrossRef]
  19. Perl, D.P.; Olanow, C.W. The neuropathology of manganese-induced Parkinsonism. J. Neuropathol. Exp. Neurol. 2007, 66, 675–682. [Google Scholar] [CrossRef] [Green Version]
  20. Zhang, P.; Lokuta, K.M.; Turner, D.E.; Liu, B. Synergistic dopaminergic neurotoxicity of manganese and lipopolysaccharide: Differential involvement of microglia and astroglia. J. Neurochem. 2010, 112, 434–443. [Google Scholar] [CrossRef]
  21. Pulkkinen, H.; Apajalahti, H.; Papula, S.; Talonen, J.; Hänninen, H. Pitting Corrosion Resistance of Mn-Alloyed Austenitic Stainless Steels. Steel Res. Int. 2014, 85, 324–335. [Google Scholar] [CrossRef]
  22. Koyama, S.; Tsuneto, T. Direct Bonding of SUS304 Stainless Steel by Metal Salt Generation Bonding Technique with Formic Acid. Procedia Mater. Sci. 2016, 12, 95–99. [Google Scholar] [CrossRef]
  23. Lo, K.H.; Shek, C.H.; Lai, J.K.L. Recent developments in stainless steels. Mater. Sci. Eng. R Rep. 2009, 65, 39–104. [Google Scholar] [CrossRef]
  24. Zhang, Q.L.; Wang, R.G.; Kato, M.; Nakasa, K. Observation by atomic force microscope of corrosion product during pitting corrosion on SUS304 stainless steel. Scr. Mater. 2005, 52, 227–230. [Google Scholar] [CrossRef]
  25. Kattamis, T.Z.; Suganuma, T. Solidification Processing and Tribological Behavior of Particulate Tic-Ferrous Matrix Composites. Mater. Sci. Eng. A 1990, 128, 241–252. [Google Scholar] [CrossRef]
  26. Wang, Y.S.; Zhang, X.Y.; Li, F.C.; Zeng, G.T. Study on an Fe-TiC surface composite produced in situ. Mater. Des. 1999, 20, 233–236. [Google Scholar] [CrossRef]
  27. Blatsi, C.; Patsidis, A.C.; Psarras, G.C. Dielectric Properties and Energy Storage of Hybrid/Boron Nitride/Titanium Carbide/Epoxy Nanocomposites. J. Compos. Sci. 2022, 6, 259. [Google Scholar] [CrossRef]
  28. Doǧan, Ö.N.; Hawk, J.A.; Tylczak, J.H.; Wilson, R.D.; Govier, R.D. Wear of titanium carbide reinforced metal matrix composites. Wear 1999, 225, 758–769. [Google Scholar] [CrossRef]
  29. Galgali, R.K.; Ray, H.S.; Chakrabarti, A.K. Wear characteristics of TiC reinforced cast iron composites Part 1—Adhesive wear. Mater. Sci. Technol. 2013, 14, 810–815. [Google Scholar] [CrossRef]
  30. Zhi, X.H.; Xing, J.D.; Fu, H.G.; Gao, Y.M. Effect of titanium on the as-cast microstructure of hypereutectic high chromium cast iron. Mater. Charact. 2008, 59, 1221–1226. [Google Scholar] [CrossRef]
  31. Bedolla-Jacuinde, A.; Correa, R.; Quezada, J.G.; Maldonado, C. Effect of titanium on the as-cast microstructure of a 16%chromium white iron. Mater. Sci. Eng. A 2005, 398, 297–308. [Google Scholar] [CrossRef]
  32. Matsuo, T.T.; Kiminami, C.S.; Fo, W.B.; Bolfarini, C. Sliding wear of spray-formed high-chromium white cast iron alloys. Wear 2005, 259, 445–452. [Google Scholar] [CrossRef]
  33. Wu, Q.L.; Sun, Y.S.; Yang, C.D.; Xue, F.; Song, F.M. Microstructure and mechanical properties of common straight carbon steels strengthened by TiC dispersion. Mater. Trans. 2006, 47, 2393–2398. [Google Scholar] [CrossRef] [Green Version]
  34. Tang, X.H.; Chung, R.; Li, D.Y.; Hinckley, B.; Dolman, K. Variations in microstructure of high chromium cast irons and resultant changes in resistance to wear, corrosion and corrosive wear. Wear 2009, 267, 116–121. [Google Scholar] [CrossRef]
  35. Yu, S.K.; Sasaguri, N.; Matsubara, Y. Effects of retained austenite on abrasion wear resistance and hardness of hypoeutectic high Cr white cast iron. Int. J. Cast Metals Res. 1999, 11, 561–566. [Google Scholar] [CrossRef]
  36. Kouřil, M.; Novák, P.; Bojko, M. Limitations of the linear polarization method to determine stainless steel corrosion rate in concrete environment. Cem. Concr. Compos. 2006, 28, 220–225. [Google Scholar] [CrossRef]
  37. Izquierdo, J.; Martin-Ruiz, L.; Fernandez-Perez, B.M.; Rodriguez-Raposo, R.; Santana, J.J.; Souto, R.M. Scanning microelectrochemical characterization of the effect of polarization on the localized corrosion of 304 stainless steel in chloride solution. J. Electroanal. Chem. 2014, 728, 148–157. [Google Scholar] [CrossRef]
  38. Atabaki, M.M.; Jafari, S.; Abdollah-pour, H. Abrasive Wear Behavior of High Chromium Cast Iron and Hadfield Steel—A Comparison. J. Iron Steel Res. Int. 2012, 19, 43–50. [Google Scholar] [CrossRef]
  39. Chotěborský, R.; Hrabě, P.; Müller, M.; Savková, J.; Jirka, M. Abrasive wear of high chromium Fe-Cr-C hardfacing alloys. Res. Agric. Eng. 2008, 54, 192–198. [Google Scholar] [CrossRef] [Green Version]
  40. De Carvalho, M.; Xavier, R.; Pontes, C.; Morone, C.; Boccalini, M.; Sinatora, A. Microstructure, mechanical properties and wear resistance of high speed steel rolls for hot rolling mills. Iron Steelmak. 2002, 29, 27–32. [Google Scholar]
  41. Guo, J.; Ai, L.; Wang, T.; Feng, Y.; Wan, D.; Yang, Q. Microstructure evolution and micro-mechanical behavior of secondary carbides at grain boundary in a Fe–Cr–W–Mo–V–C alloy. Mater. Sci. Eng. A 2018, 715, 359–369. [Google Scholar] [CrossRef]
  42. Talib, N.; Nasir, R.M.; Rahim, E.A. Tribological behaviour of modified jatropha oil by mixing hexagonal boron nitride nanoparticles as a bio-based lubricant for machining processes. J. Clean. Prod. 2017, 147, 360–378. [Google Scholar] [CrossRef]
  43. Singh, Y.; Garg, R.; Kumar, S. RETRACTED ARTICLE: Friction and Wear Characterization of Modified Jatropha Oil (Jatropha Curcas) Using Pin on Disc Tribometer. Energy Sources Part A Recovery Util. Environ. Eff. 2019, 44, 2018–2029. [Google Scholar] [CrossRef]
  44. Yoon, E.S.; Kong, H.S.; Kwon, O.K.; Oh, J.E. Evaluation of frictional characteristics for a pin-on-disk apparatus with different dynamic parameters. Wear 1997, 203, 341–349. [Google Scholar] [CrossRef]
  45. Mahdavian, S.M.; Mai, Y.W.; Cotterell, B. Friction Metallic Transfer and Debris Analysis of Sliding Surfaces. Wear 1982, 82, 221–232. [Google Scholar] [CrossRef]
  46. Srivastava, A.K.; Das, K. Corrosion Behaviour of TiC-Reinforced Hadfield Manganese Austenitic Steel Matrix In-Situ Composites. Open J. Met. 2015, 5, 11–17. [Google Scholar] [CrossRef] [Green Version]
  47. Okamoto, G. Passive film of 18-8 stainless steel structure and its function. Corr. Sci. 1973, 13, 471–489. [Google Scholar] [CrossRef]
  48. Olsson, C.O.A.; Landolt, D. Passive films on stainless steels—Chemistry, structure and growth. Electrochim. Acta 2003, 48, 1093–1104. [Google Scholar] [CrossRef]
  49. Peissl, S.; Mori, G.; Leitner, H.; Ebner, R.; Eglsäer, S. Influence of chromium, molybdenum and cobalt on the corrosion behaviour of high carbon steels in dependence of heat treatment. Mater. Corr. 2006, 57, 759–765. [Google Scholar] [CrossRef]
  50. Hegde, A.; Patil, A.; Tambrallimath, V. Corrosion behaviour of sintered austenitic stainless steel composites. Int. J. Eng. Res. Technol. 2014, 3, 14–17. [Google Scholar] [CrossRef]
  51. Caliskan, N.; Akbas, E. Corrosion inhibition of austenitic stainless steel by some pyrimidine compounds in hydrochloric acid. Mater. Corros.–Werkst. Korros. 2012, 63, 231–237. [Google Scholar] [CrossRef]
  52. Asteman, H.; Spiegel, M. Investigation of the HCl (g) attack on pre-oxidized pure Fe, Cr, Ni and commercial 304 steel at 400 °C. Corr. Sci. 2007, 49, 3626–3637. [Google Scholar] [CrossRef]
  53. Hermas, A.A.; Morad, M.S. A comparative study on the corrosion behaviour of 304 austenitic stainless steel in sulfamic and sulfuric acid solutions. Corr. Sci. 2008, 50, 2710–2717. [Google Scholar] [CrossRef]
  54. Peled, P.; Harush, S.; Itzhak, D. The effect of Ni addition on the corrosion behaviour of sintered stainless steel in H2SO4. Corr. Sci. 1988, 28, 327–329. [Google Scholar] [CrossRef]
  55. Wang, Z.; Paschalidou, E.-M.; Seyeux, A.; Zanna, S.; Maurice, V.; Marcus, P. Mechanisms of Cr and Mo Enrichments in the Passive Oxide Film on 316L Austenitic Stainless Steel. Front. Mater. 2019, 6, 232. [Google Scholar] [CrossRef] [Green Version]
  56. Liu, X.L.; Jiang, Y.; Zhang, H.B.; He, Y.H. Corrosion behavior of porous Ti3SiC2 in nitric acid and aqua regia. Trans. Nonferrous Met. Soc. China 2017, 27, 584–590. [Google Scholar] [CrossRef]
Figure 1. Schematic diagram of the pin-on-disk test to determine the adhesive wear.
Jcs 07 00034 g001
Figure 2. SEM images of the as-cast microstructures of (a) A1, (b) A2, (c) A3, (d) A4, and (e) A5.
Jcs 07 00034 g002aJcs 07 00034 g002b
Figure 3. XRD phase analysis of A1, A2, A3, A4, and A5.
Jcs 07 00034 g003
Figure 4. Wear resistance of A1, A2, A3, A4, and A5, SUS304 stainless steel, and high-chromium cast iron.
Jcs 07 00034 g004
Figure 5. Friction coefficient as a function of wear distance of (a) SUS304, (b) A1, (c) A2, (d) A3, (e) A4, (f) A5, and (g) high-chromium cast iron.
Jcs 07 00034 g005aJcs 07 00034 g005b
Figure 6. SEM images of worn surfaces of (a) A1 BEI, (b) A1 SEI, (c) A2 BEI, (d) A2 SEI, (e) A3 BEI, (f) A3 SEI, (g) A4 BEI, (h) A4 SEI, (i) A5 BEI, and (j) A5 SEI. The arrow indicates the wear direction.
Jcs 07 00034 g006aJcs 07 00034 g006b
Figure 7. Vickers hardness and wear resistance of A1, A2, A3, A4, A5, SUS304, and high-chromium cast iron.
Jcs 07 00034 g007
Figure 8. Polarization curves of A1, A2, A3, A4, A5, SUS304, and high-chromium cast iron.
Jcs 07 00034 g008
Figure 9. Mass loss ratio of A1, A2, A3, A4, and A5 in corrosive solutions: (a) 1.5 M HCl(aq), (b) 1.5 M H2SO4(aq), (c) 1.5 M HNO3(aq), and (d) 1.5 M C6H8O7(aq).
Jcs 07 00034 g009
Table 1. Chemical composition of designed alloys in atomic percent.
AlloysElements (at.%)
FeCrNiTiCConfigurational
Entropy
A169.1318.067.112.852.850.95 R
A265.0116.986.695.665.661.09 R
A360.9515.926.278.438.421.19 R
A456.9514.885.8611.1611.151.26 R
A553.0113.855.4513.8513.841.32 R
Table 2. EPMA analysis of the chemical composition of each phase in A1, A2, A3, A4, and A5.
AlloysElements (at.%)
FeCrNiTiC
A1Black phase (TiC)0.60.60.148.449.3
Light-gray phase (FCC)76.116.26.01.30.4
A2Black phase (TiC)0.40.70.147.951.0
Light-gray phase (FCC)70.816.76.80.94.0
A3Black phase (TiC)0.50.90.148.150.0
Light-gray phase (FCC)70.816.97.51.53.1
A4Black phase (TiC)1.00.90.151.346.5
Gray phase (M7C3)43.311.34.215.924.2
Light-gray phase (FCC)71.717.87.10.92.3
A5Black phase (TiC)0.50.80.147.249.6
Gray phase (M7C3)29.448.51.50.719.9
Light-gray phase (FCC)69.520.17.00.52.9
Table 3. Electrochemical parameters of A1, A2, A3, A4, A5, SUS304, and high-chromium cast iron in 3.5 wt % NaCl solution at room temperature.
SamplesEcorr (V)jcorr × 10−8 (A/cm2)Etr (V)jpass × 10−6 (A/cm2)
SUS304−0.13443250.1282070
A1−0.1525333−0.0023573
A2−0.15625680.0423890
A3−0.15720800.0644083
A4−0.13148080.1662612
A5−0.13510470.1781702
Disclaimer/Publisher’s Note: The statements, opinions and data contained in all publications are solely those of the individual author(s) and contributor(s) and not of MDPI and/or the editor(s). MDPI and/or the editor(s) disclaim responsibility for any injury to people or property resulting from any ideas, methods, instructions or products referred to in the content.

