1. Introduction
Energy storage has become one of the main drivers of technological progress, as industrial and transportation activities are now heavily reliant on the combustion of fossil fuels [
1]. The search for environmentally friendly, commercially available, and energy-efficient systems is the objective of numerous research efforts. Batteries, fuel cells, and supercapacitors (SCs) are the most common electrical energy storage devices, each working based on different principles [
2,
3,
4]. The main principle of batteries and fuel cells is based on converting electrical energy into chemical energy through redox reactions in the anode and cathode materials [
5]. SCs (ultracapacitors or electric double-layer capacitors) are versatile devices with fast charging and discharging capabilities that store electrical energy via electrostatic charge separation. Energy storage is held at the interface between an aqua or organic electrolyte and an active electrode material [
6]. These devices find applications across industries, including automotive, aerospace, renewable energy, and electronics, where they provide backup power, stabilize voltage, and enhance energy-harvesting efficiency [
7].
The active material is traditionally activated carbon characterized by an extensive surface area. Various polymer materials are introduced to this active material, shaping it into a functional electrode [
8,
9]. To address the inherent insulating properties of the polymers, a variety of conductive materials are incorporated, effectively enhancing the electrode’s conductivity. The mass fraction of the polymer binder is 10–20 wt.%, and the conductive additive is 5–15 wt.% of the total electrode mass [
10]. The low conductivity of the electrode necessitates the use of a metal with high conductivity, called a current collector. During charging, electrons quickly spread throughout the two-dimensional surface of the electrode to the current collector, and they only need to pass through the thickness of the electrode to reach all of the active material [
11]. The current collector also functions as a substrate and mechanical support for the electrode material. Although some electrode compositions can form a separate film or sheet, the substrate usually plays a crucial role in maintaining the structural integrity of the electrode throughout the production and service life of the device. Traditionally, the electrode consists of 80% active material by mass, while the other 20 wt.% is made up of inactive elements (binder and conductive additive) [
12,
13]. To enhance the specific energy of supercapacitors, it is imperative to not only employ advanced active materials capable of storing higher energy densities, but also to reduce the inactive weight by fabricating electrodes without the need for binders [
14,
15].
Carbon materials are used as the main material for electrodes in energy storage devices—such as electrically conducting additives, substrates for active materials, electron converters, intercalation hosts, substrates for current-carrying wires—and as agents for controlling thermal conductivity, porosity, surface area, and permeability [
16]. Since carbon material is the main material for capacitor electrodes, it is clear that the final characteristics of carbon-based supercapacitors will be directly related to the physical and chemical characteristics of carbon electrodes. Currently, activated carbon (AC) is widely used as the main material for EC electrodes due to its high specific capacitance and reasonable cost. AC can be obtained from carbon-rich organic precursors through carbonization in an inert atmosphere, followed by activation processes such as oxidation in CO
2, steam, or KOH to control the specific surface area and pore volume [
17]. Natural materials such as coconut shell, wood, resin or coal, apricot kernels (AK), rice husks (RH), walnut shells (WS), or synthetic materials such as polymers can be used as precursors [
18].
Activated carbons are renowned for their high surface area and diverse pore size distribution, which facilitates the accumulation of electrical charge [
19,
20]. Electrode capacitance, a critical factor, is influenced by electrical conductivity, pore size, electrolyte type, and surface chemical composition. Traditionally, particles of activated carbon are affixed to a metallic foil with the aid of binders, leading to the challenge of creating electrodes based on activated carbons without a metallic base and binding agents. To address this challenge, different researchers explored the impact of carbon nanotubes (CNTs) in the fabrication of AC-based electrodes [
21,
22]. Electrodes based on AC and CNT offer a compelling synergy of advantages, including flexibility, durability, long cycle life, chemical stability, and versatility. Activated carbons provide a structure that promotes significant energy storage capacity, while carbon nanotubes enhance electrical conductivity, facilitating fast charge and discharge. These materials, derived from waste sources, are environmentally friendly and reduce binder dependency, simplifying electrode fabrication.
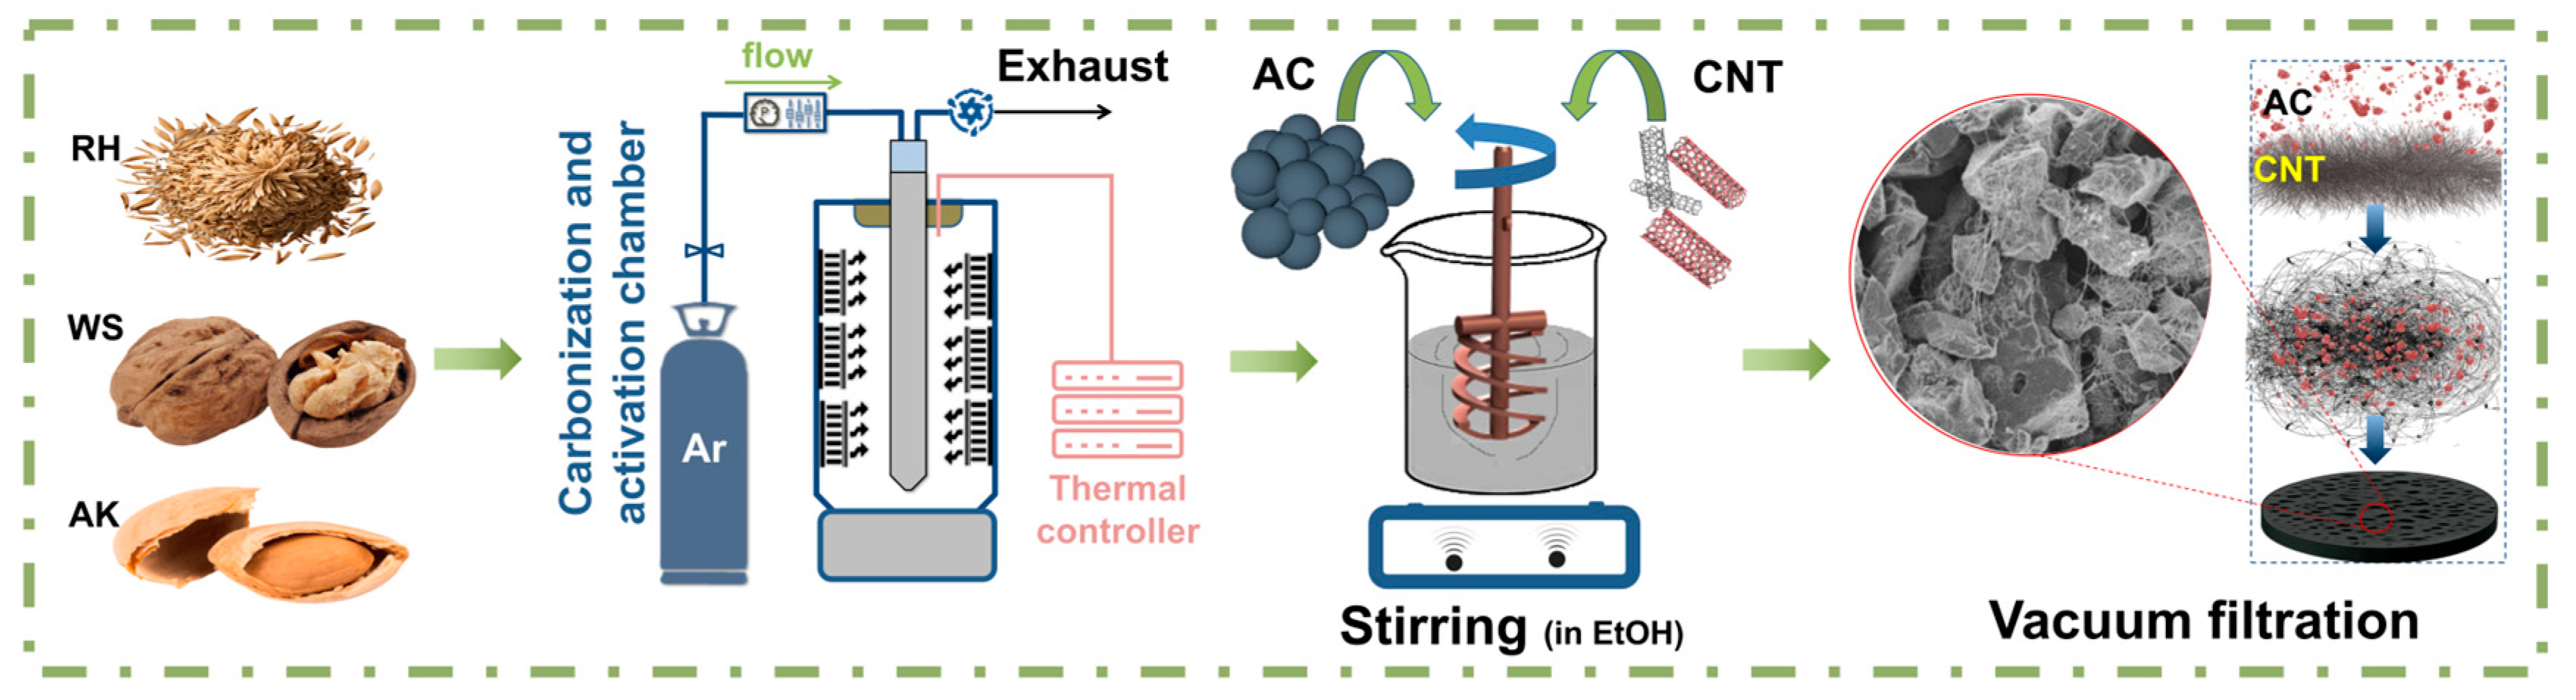
In this study, we developed binder-free electrodes from AC particles coated with carbon nanotubes (AC/CNT). The AC-derived different biomass was synthesized by using a carbonization process and chemical activation via KOH in an inert atmosphere (Ar). The introduction of the CNTs additionally expands the surface area of electrodes, leading to increased ion transportation and a large rise in specific capacitance. Therefore, this study proposed an electrode that can achieve higher specific capacitance, flexibility, and low vulnerability to structural damage due to the synergy between AC and CNT. Also, electrochemical properties such as specific capacitance, power density, energy density, and cycle stability were evaluated.
3. Results and Discussion
In
Figure 2a, the DSC curve shows peaks in each sample that can be recognized as decomposition stages. Each sample has a small endothermic curve corresponding to the evaporation of water, followed by exothermic shifts. Most of the exothermic peaks fall within the range of 350–500 °C, which may be associated with the pyrolysis of pectin, glucose, or sucrose present in the starting material, and additional fragmentation of hemicellulose through thermal depolymerization [
24,
25]. Finally, the highest temperature (345 °C) represents the highest rate of decomposition of cellulose [
26].
In the TG analysis, the weight loss due to sample pyrolysis is consistent with the DSC results. Three main decomposition regions were observed in all samples, covering temperature ranges of 50–250 °C, 250–370 °C, and 370–600 °C. The first region is related to water evaporation and partial loss of low-molecular-weight compounds from room temperature to 200 °C, consistent with the DSC data. The decomposition range of pectin, hemicellulose sugars, and cellulose is known to be 200–400 °C [
27]. In region III, at temperatures of 400–600 °C, lignin decomposition occurs during pyrolysis [
28]. The highest weight loss in each region was observed in the RH sample compared to the other samples.
Figure 3a provides a profound view into the structural characteristics of obtained activated carbons through Raman spectroscopy. Notably, the Raman spectra reveal a remarkable distinction between all three activated carbons. Activated carbon sourced from AK exhibits the highest G peak intensity among the samples. This heightened G peak signifies a significant degree of graphitization within this sample, implying enhanced electrical conductivity and potential suitability for applications demanding a highly ordered carbon structure.
Figure 2.
DSC and TG of the thermal decomposition of various biomasses at a heating rate of 5 K min−1 in a nitrogen flow of 50 mL min−1. (a) TG analysis, (b) DSC analysis, and (c) heat release.
Figure 2.
DSC and TG of the thermal decomposition of various biomasses at a heating rate of 5 K min−1 in a nitrogen flow of 50 mL min−1. (a) TG analysis, (b) DSC analysis, and (c) heat release.
XRD patterns, shown in
Figure 3b, exhibit the characteristics of all samples which stand out with their significant graphitized structure, emphasizing their exceptional graphitic content, which is advantageous for applications requiring high electrical conductivity. Importantly, the XRD results also uncover the presence of iron derivatives (Fe
+, Fe
3O
4, FeN) on the surface of all activated carbon samples, which can be explained by the influence of chemical activation in a steel reactor.
In
Figure 3c, we present the results of the EDAX analysis conducted on all samples under examination. The figure provides a comprehensive depiction of the samples’ elemental composition, specifically the presence of carbon, oxygen, and iron, characterized through the “FeKα” and “FeKβ” X-ray emission lines originating from iron (Fe) within the samples. These lines correspond to electron transitions within the K-shell of iron atoms, thereby elucidating the iron content within the material. Furthermore, the AC sourced from AK showcases the presence of “FeKes”, tentatively interpreted as the “Fe K escape peak”, signifying secondary X-ray emissions induced by the egress of select K-shell electrons from the sample following primary X-ray excitation. This representation yields invaluable insights into the iron composition within the scrutinized material, with variations in peak intensity or energy potentially furnishing quantitative data. It is imperative to underscore that the overall quantified iron content was remarkably low. This meticulous concordance between the outcomes of the EDAX analysis and the X-ray diffraction (XRD) data fortifies our comprehension of the structural composition of AC derived from RH, particularly regarding its iron content.
Figure 3.
Raman (a), XRD (b), and EDAX (c) analysis of the prepared activated carbons.
Figure 3.
Raman (a), XRD (b), and EDAX (c) analysis of the prepared activated carbons.
Figure 4a offers a comprehensive analysis of the nitrogen adsorption–desorption isotherms of AC from different biomass. All samples exhibit a characteristic Type I isotherm, which indicates a prevalence of microporous structures within the materials. Notably, the curve for AC-derived RH indicates a lower adsorption capacity compared to the other samples. This suggests a relatively smaller surface area available for ion adsorption. Isotherms for activated carbon derived from WS and AK display the dominance of microporosity and indicate higher adsorption capacities due to a high surface area available for efficient adsorption.
Figure 4b reveals the Differential Pore Size Distributions (PSD) of activated carbon derived from AK, RH, and WS. The RH-derived AC exhibits a single peak in the mesopore range; the PSDs revealed that the peak centered at ~2 nm wide, suggesting a dominant pore size with uniformity. In contrast, the WS-derived AC displays a broader distribution of pore sizes, offering versatility for diverse applications. Meanwhile, the AK-derived AC presents two narrow peaks, centered at ~2 nm and 2.5 nm.
Figure 4c presents a comparative analysis of the cumulative PSDs in the mesopore range for three activated carbon samples (RH, WS, and AK). These results offer detailed information on the textural properties and characteristics that can significantly influence their ion adsorption performance. The AC derived from RH exhibits the highest cumulative pore volume and signifies the presence of substantial mesopore volume in comparison with the other samples. This implies a predominant mesopore size or a higher density of mesopores within an investigated size range. Importantly, all three curves maintain a consistent plateau starting from 3 nanometers and extending beyond, indicating a stable mesopore structure in this range. In contrast, the curves representing AC derived from WS and AK exhibit lower profiles. This observation could be indicative of a more significant development of microporous structures within these materials. Importantly, this trend aligns with the findings presented in
Figure 4a. These findings hold significant implications for applications demanding high adsorption capacities for ions within this size bracket.
Figure 5 show SEM images of the AC electrode based on AK/CNTs under magnification. A uniform distribution of AC coated with CNTs is shown. The combination of a large surface area of AC with conductive CNTs increases the mass of active materials and leads to high electrolyte accessibility. The resulting electrode has a developed, uniform, porous structure with many cells. Carbon nanotubes form a uniform coating on the surface of AC particles, exhibiting strong adhesion that enhances the creation of self-supporting films. Our experiments aimed to produce a flexible and exceptionally efficient hybrid electrode utilizing distinct weight ratios of AC/CNT electrodes, specifically 90/10, 95/5, and 97/3 (
Table 1). Notably, the most substantial values were achieved at the weight ratio of 90:10. Electrodes with lower CNT weight ratios (95/5 and 97/3) exhibited reduced specific capacitance and greater brittleness. The electrochemical attributes of these electrodes’ specific capacitances are depicted in
Figure 6d.
To identify the optimal ratio of components for a self-supporting supercapacitor electrode without a metal current collector, the electrochemical properties of electrodes with different ratios of AC, CNT, and conductive additive were studied.
Figure 6a represents cyclic voltammetry curves of electrodes with 80:10:10 and 85:10:5 ratios of AC, CNT, and CB, respectively, where AK derived AC (denoted as AK_80_10_10 and AK_85_10_5) at a scan rate of 1 mV s
−1 and in the potential range of 0 and 1 V.
It can be seen in the figure that the behavior of these electrodes is typical for an electrical double layer, as indicated by the curves having a similar geometry characteristic to supercapacitors with an electrical double layer. Cyclic voltametric curves of the samples taken for the two-electrode cell configuration do not have clear redox peaks. The area under the CV curve for the AK_85_10_5 electrode is lower than that of the AK_80_10_10 electrode.
Figure 6b shows the galvanostatic charge–discharge curves in the potential range from 0 to 1 V for the AK_80_10_10 and AK_85_10_5 electrodes at current densities of 1 and 2 A g
−1. It can be seen that the electrodes exhibit electric double layer behavior since the charge–discharge curves are symmetrical. As in the case of CV, from GCD it is clear that the specific capacitance of the AK_85_10_5 (118 and 96 F g
−1) electrode is larger than the AK_80_10_10 (96.4 and 61 F g
−1) electrode both at 1 and 2 A g
−1.
The AK_85_10_5 electrode showed better specific capacitance and energy density (maximum energy densities of 4.8 vs. 4.4 Wh kg
−1 at the same power densities) than the AK_80_10_10 sample because there was more active material, while resistance (see EIS curve), rate capability (
Figure 6c), and power density (1.5 vs. 0.24 Wh kg
−1 at the maximum power density of 1.2 kWh kg
−1)—which are dependent on the conductive capability of the electrode (based on conductive additive content)—were neither better nor worse.
Figure 6d shows specific capacitances upon different scan rates of electrodes with varied content of AC (derived from AK) and CNT, denoted as AK_90_10, AK_95_5, and AK_97_3. The highest specific capacitance of 137 F g
−1 at 1 mV s
−1 was achieved by the electrode with 10% content of CNT. From the graph, it is clear that the best ratio of AC and CNT is 90:10 in terms of specific capacitance. Based on the above, we can come to the conclusion that for a self-supporting electrode of a supercapacitor, the most optimal ratio of the active, binding, and conducting components is 85:10:5. The electrochemical performance of electrodes with this composition with active material derived from other bioprecursors can be further evaluated.
Figure 6.
Electrochemical analysis of the electrodes based on AK measured in a two-electrode system using an aqueous electrolyte (1 M Li2SO4): (a) CV curves of the AK_80_10_10 and AK_85_10_5 electrodes at a potential scan rate of 1 mV s−1; (b) GCD curves of the AK_80_10_10 and AK_85_10_5 electrodes at a current density of 1 and 2 A g−1; (c) scan rate capabilities of the AK_80_10_10 and AK_85_10_5 electrodes at 1, 5, 10, 20, 40, 80, 160, 300, and 500 mV s−1; (d) scan rate capabilities of the AK_90_10, AK_95_5, and AK_97_3 electrodes at 1, 5, 10, 20, 40, 80, 160, 300, and 500 mV s−1.
In the case of WS, the best electrochemical characteristics were shown by an electrode with an active, binding, and conductive ratio of 85:10:5. From
Figure 7a it is clear that the area of the CV curve at 1 mV s
−1 of the WS_85_10_5 electrode is not much larger than WS_80_10_10, to which the specific capacitance of 133 F g
−1 corresponds. When charging and discharging at a current density of 1 A g
−1 (
Figure 2b), the difference in specific capacitances becomes clearer. So, the WS_85_10_5 electrode showed 105.7 F g
−1 at 1 A g
−1, while the WS_80_10_10 electrode showed 98 F g
−1 at the same current density.
Despite the fact that the WS_85_10_5 and WS_80_10_10 electrodes have almost the same specific capacitances and energy densities at low currents, at high currents these electrodes exhibit different rate capabilities. When the scanning speed increases to 500 mV s−1, the specific capacitance of the WS_85_10_5 electrode drops to 10 F g−1, while for the WS_80_10_10 electrode it drops to 6 F g−1, which corresponds to 4.6 and 7.6% capacity retention, respectively. And with an increase in the charge–discharge current density to 5 A g−1, the WS_85_10_5 electrode showed a specific capacitance of 32.7 F g−1, which is much greater than the specific capacitance of the WS_80_10_10 electrode, which showed 8.4 F g−1. At a maximum power density of 1.2 kWh kg−1, these electrodes had energy densities of 0.3 and 1.1 W kg−1, respectively.
Figure 7.
Electrochemical analysis of the electrodes based on RH and WS measured in a two-electrode system using an aqueous electrolyte (1 M Li2SO4): (a) CV and (b) GCD curves of the RH and WS-based electrodes, with different ratios of the components at a potential scan rate of 1 mV s−1 and at a current density of 1 A g−1, respectively; (c) scan rate capabilities of the electrodes at 1, 5, 10, 20, 40, 80, 160, 300, and 500 mV s−1; (d) current rate capabilities of the AK, RH and WS-based electrodes with different ratios of the components at 250, 500, 1000, 2000, and 5000 mA g−1.
In the case of RH, the electrode with components at a ratio of 85:10:5 showed higher specific capacitances and energy densities than those with a component ratio of 80:10:10 only at low charge–discharge currents. Thus, at 1 mV s
−1, the RH_85:10:5 electrode showed a specific capacitance equal to 125.6 F g
−1, and at 1 A g
−1 86.4 F g
−1, with a maximum energy density of 4 Wh kg
−1 (
Figure 7). The RH_80:10:10 electrode at 1 mV s
−1 showed a specific capacitance of 109 F g
−1, and at 1 A g
−1 85 F g
−1, with a maximum energy density of 3.54 Wh kg
−1. But, with increasing charge–discharge currents, the capacity of the RH_85:10:5 electrode drops more than that of the RH_80:10:10. Thus, at 500 mV s
−1 and 5 A g
−1, the specific capacitance of the RH_85:10:5 electrode drops to 4.9 and 2 F g
−1, with an energy density of 0.07 Wh kg
−1 at a maximum power of 1.2 kWh kg
−1. Conversely, the specific capacitance of the RH_80:10:10 electrode at 500 mV s
−1 is equal to 8.1 F g
−1, and at 5 A g
−1 20 F g
−1, with an energy density equal to 0.7 Wh kg
−1 at a maximum power of 1.2 kWh kg
−1. Furthermore, in the
Supplementary Materials, we provide a comprehensive comparison table that contrasts the performance of our current study with relevant data from the existing literature in the field of similar research [
29,
30,
31,
32,
33,
34].
A clearer distinction in the conductivity, rate, and power-handling capacities of the electrodes is evident from the electrochemical impedance spectra. EIS was conducted at a voltage amplitude of 5 mV over the frequency range from 100 kHz to 10 mHz as shown in
Figure 3a–c. In the cases of AK and WS, electrodes with the 85:10:5 ratio of components exhibit better charge transfer capabilities and higher rates of ion diffusion, whereas the RH_80_10_10 electrode demonstrates superior kinetics of charge transfer than the RH_85_10_5 electrode.
Figure 8d represents the galvanostatic charge/discharge cycling stability test conducted at 2 A g
−1. All the samples demonstrate good capacity retention over 96%, except the RH_85_10_5 electrode, which exhibits only 85,5%. The Coulombic efficiency of all the electrodes is near 99%, indicating that no side reactions occur during charging/discharging processes.


 ,
, 


