Abstract
Composites materials like jute/epoxy exhibit high hardness and are considered as difficult-to-machine materials. As a result, alternatives to conventional machining become essential to post-process the composites. Accordingly, due to its non-thermal nature, abrasive water jet machining has recently come to be seen as one of the most promising machining methods for composite materials. In the current study, the impact of machining parameters such as traverse speed (TS), standoff distance (SOD) and abrasive mass flow rate (MFR) on machined surface roughness (Ra) has been investigated. In addition, the optimum combination of process parameters to machine a jute fiber-reinforced polymer composite with minimum Ra is predicted. The experimental results are analyzed using Taguchi and Response Surface Methodology (RSM) approaches to determine the optimum set of process parameters to achieve the lowest roughness values. Without making any changes in the machining conditions, the optimum set of values is determined for two conditions by reinforcing the fiber with 45° inclination and 90° inclination. The results reflect the different optimum combinations for each fiber inclination. For 45° fiber inclination, to achieve the minimum Ra value, the predicted combination is TS = 30 mm/min, SOD = 2 mm and MFR = 0.35 kg/min. When the fiber inclination is 90°, the predicted optimum combination is TS = 25 mm/min, SOD = 2 mm, and MFR = 0.35 kg/min. It is evident from the results that the optimum combination will be changed according to the machining conditions as well as material properties. The results confirm the effect of fiber orientation on surface roughness. The specimen with 45° fiber inclination produces a lower Ra with an average of 4.116 µm, and the specimen with 90° fiber inclination generates a higher Ra with an average of 4.961 µm.
1. Introduction
In the wake of growing mass production, the manufacturing sector is constantly looking for technologies that can turn raw materials into useful merchandise with minimal wastage. The requirement has propelled innovations not only in the field of materials and manufacturing but also in machining. The unprecedented use of hard-to-machine materials, such as polymers and their composites, in various advanced engineering applications has necessitated the application of compatible machining methods. Machining fiber-reinforced polymers (FRP) is a challenging task due to the heterogeneous structure of the material [1]. The heterogeneity arises from distinct fiber reinforcements and the polymer matrix material, which widely differ in their mechanical, physical, and thermal properties. Adopting conventional machining processes to machine FRP leads to machining damage such as matrix cracking, fiber pull-out, fiber fracture, burrs, delamination, and debonding [2,3]. Thus, different non-conventional machining processes, such as laser machining [4], electrical discharge machining [5], electro-chemical machining [6], and abrasive water jet machining (AWJM) [7], are used to machine FRP. Amongst numerous non-conventional machining methods, AWJM is considered the ideal method for machining FRP [8].
AWJM is a non-traditional machining technique suitable for machining materials that are susceptible to heat and temperature [9]. Here, an abrasive-laden water jet is sent at very high pressures through an orifice and is made to impinge on the material surface [10]. Material removal occurs due to the erosion of the material caused by the impingement of the jet. AWJM is advantageous, considering its capability to machine intricate geometries with minimal stresses, distortion, and heat-affected zones. Additionally, the absence of chemicals prevents any chemical changes in the work material and makes the process environment friendly.
The quality of AWJM is assessed through the kerf width and the surface roughness at the machined area, which are, in turn, dependent on the process parameters of AWJM. Process parameters that significantly affect performance include water pressure, feed and flow rate of abrasives, nature and type of abrasives used, and cutting parameters such as standoff distance, impingement angle, and traverse speed [11]. It is reported that AWJM-machined surfaces are characterized by two wear zones [12]. First is the cutting wear zone generated through the cutting action of the abrasives impinging on the material surface at acute angles [13,14]. The second deformation wear zone is produced when the abrasives strike the material surface at obtuse impact angles [15]. Smaller impact angles produce smooth cutting surfaces, while large impact angles produce a distorted and rough machined surface [16].
To reduce the production lead time and ensure damage-free machining, optimizing the AWJM process parameters is mandatory. Optimization of the process parameter not only helps the production process but also reduces the associated production cost. Researchers widely use the Taguchi optimization technique to optimize the process parameters of AWJM while processing FRP with a minimum number of experiments. Madival et al. [17] reported that the traverse speed is the highest contributing factor to the material removal rate, top kerf width, and bottom kerf width, respectively. Thakur et al. [18] used the Taguchi design along with grey relational analysis to optimize the AWJM process parameters to machine carbon nanotube-filled epoxy/carbon composites and found that an increase in water jet pressure contributes to a reduction in surface roughness, delamination factor, kerf width, and at the same time, promotes improvement in the material removal rate. They also highlighted that the standoff distance is the least significant parameter influencing the machining quality. Kavimani et al. [19] used the Taguchi design along with grey relation analysis to study the influence of AWJM process (input) parameters such as transverse speed, standoff distance, and jet pressure on the quality of the machined surface (output response) of SiC-filled polymer composite. They concluded that standoff distance and transverse speed are significant contributors. Gopal et al. [20] employed a multi-objective optimization technique for optimizing the AWJM process parameters for machining an epoxy/glass fiber/grinding wheel particle composite. They inferred that the surface roughness and the kerf angle are affected by the quantity of filler content within the composite, while the standoff distance is the factor that decides the machining outcome. Karataş et al. [21] optimized AWJ drilling process parameters using the Taguchi design and multi-objective optimization for carbon fiber-reinforced composites with different fiber orientation angles. They inferred that the most influential parameters influencing the kerf angle and roundness error were the jet pressure and standoff distance. Chenrayan et al. [22] used hybrid gray relational analysis and principal component analysis to minimize delamination and kerf taper while using the AWJM process to machine glass–carbon FRP. They found that the most significant factor that can minimize the kerf angle is water jet pressure, while the abrasive mass flow rate, followed by standoff distance, was the controlling factor in reducing delamination. Jute fiber composites are finding applications in in many areas. One of the important applications is their use in the aerospace industry to produce nonstructural components such as seat backs, luggage compartments, etc.
2. Research Motivation
In view of the growing concern for environmental degradation, there is an urgent need to imbibe sustainability in almost all engineering fields. The extensive application of FRP in various areas has led to the generation of large quantities of waste that is not biodegradable. Though some thermoplastic matrices can be recycled, it is hard to recycle thermosets. Thermoset FRP consists of a thermoset resin as the matrix and is generally reinforced with synthetic fibers. To make thermoset FRP nature friendly, there is a growing thrust towards the incorporation of biodegradable natural fibers in place of synthetic fibers. Plant-based natural fibers are gaining traction and are seen as a worthy replacement for their synthetic counterparts [23]. Jute fiber is one such natural fiber that can prepare lightweight FRP, making it sustainable and biodegradable [24]. Also, it is essential to mention that the final property of FRP depends not only on the type of fibers used as reinforcements but also on the fiber orientation within the laminates [25]. Though the mechanical properties of jute-reinforced FRP are comparable to the mechanical properties of synthetic fiber-reinforced FRP, jute-reinforced FRP pose a greater challenge in machining, as jute fibers are flammable [26]. Thus, optimization of machining parameters is very important for jute/epoxy FRP. Though some of the literature available discusses the optimization of FRP, there is, to the best of the author’s knowledge, very little that optimizes the machining parameters for jute-reinforced FRP with different fiber orientations. To fill the research gap and add to the current literature knowledge base, the present work focuses on preparing jute fiber-reinforced epoxy composites with 45° and 90° fiber orientation. The prepared FRP are machined with the help of AWJM. The AWJM process parameters are optimized using the Taguchi method and Response Surface Methodology.
3. Methods and Methodology
3.1. Material Preparation
The fiber-reinforced composites were fabricated using the hand layup technique. The matrix material used was general-purpose polyester resin. K6 hardener was used as the hardener material. The ratio of hardener to resin used was 1:10. Woven jute fiber mats were used as the reinforcement material. In this work, for 100 g mixture of resin and jute fibers, the weight of the reinforcement material taken was 35 g, and the remaining 65 g was the resin (35:65 weight ratio). To maintain this desired fiber and resin ratio, the fiber mats were trimmed to the required size before starting the layup process. The downside supporting iron plate (mold) was thoroughly cleaned to get rid of dust and stuck materials, and a wax-based mold-releasing agent was sprayed. Wax-based releasing agents are a mixture of wax, solvents, and other additives. They are easy to apply and provide a good release barrier between the composite material and the mold. Once all these arrangements were made, the first fiber mat was placed with a fiber orientation of 90°, and the resin was added evenly over the mat using a brush. After sufficient resin was added, the roller was passed over to press against the mat and remove air bubbles. This stacking procedure was continued until the composite’s required thickness was obtained. Once the stacking process was over, the releasing agent-coated top iron plate was placed at the top, and the entire mold was wrapped in a polythene sheet. This wrapped composite was placed under the load for a period of 48 for curing purposes. The curing temperature used was 60 °C, and the load applied was 100 kg/cm2. The composite was unwrapped once the curing was over, and excess material from all four sides was trimmed off. The same method was repeated for the preparation of 45° fiber orientation composite. Figure 1a shows actual images of the composite preparation process, and Figure 1b represents a schematic diagram of the specimen preparation process.
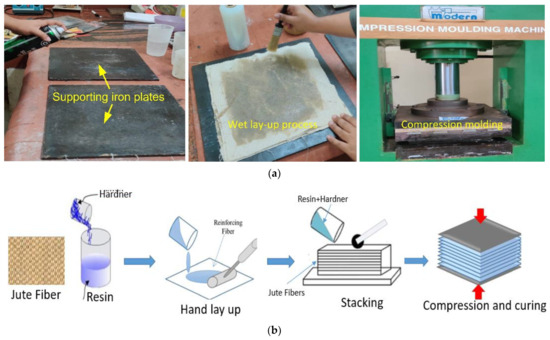
Figure 1.
(a) Hand layup specimen preparation process. (b) Schematic representation of hand layup specimen preparation process.
3.2. Materials Used
The resin used was the general purpose epoxy resin which is commercially known as BISPHENOL-A (BPA) manufactured by Huntsman Polymers, Mumbai, India. This resin is a thermoset resin that will convert from liquid to solid through a polymerization process or cross linking.
Jute fibers are natural fibers extracted from the Corchorus plant, which will grow nearly 3 m height. The main plant ingredients that make up jute fibers are cellulose (a key component of plant fibre) and lignin (a major component of wood fibre). Thus, it is a ligno-cellulosic fibre that has some wood and some textile content. The density of the jute fiber varied from 1.48–1.50 gm/cm3. Jute fiber has good strength, its tenacity will vary from 3.5–7 gm/denier. Jute fibers appear in different colors such as yellow to brown depending on growing conditions. The fiber breaking elongation is 1–1.2% under normal atmospheric conditions. Jute fiber is a very good insulator of heat and electricity and its elasticity is low.
The viscosity of the K6 hardener is low. This hardener is available in liquid form and it cures at room temperature. It is frequently used in manual layup applications. Due to its high reactivity, it cures quickly at room temperature. This hardener acts as catalyst, develops the cross links in resin and cures the resin at room temperature. The laminates that are produced using this hardener can be subjected to an operating temperature range of 20 °C to 100 °C.
3.3. Abrasive Water Jet Machining
The process parameters, standoff distance (SOD), traverse speed (TS) and abrasive mass flow rate (MFR), were chosen as variable input parameters. Each process parameter was varied at three levels. Considered input parameters and their levels are presented in Table 1. The levels were selected based on the previous literature on AWJM of composites [27].

Table 1.
Process input parameters.
Machining was conducted using the CNC-controlled 5-axis abrasive water jet cutting system (Omax Corp., Kent, WA, USA: model no. MAXIEM1515) by securely mounting the specimens on a cardboard sheet with double-sided glue tape. Before starting the cutting process, the machine was checked to confirm the use of a fresh nozzle. Also, the MFR was adjusted precisely to the considered values. The TS of various levels was set to accurate values. Standoff values were set accurately. The mixing ratio of abrasive and water was checked and fixed to the accurate value. The pressure of the water jet was fixed to 200 MPa, and the jet inclination was maintained at 900 to the workpiece. The complete machining set-up is illustrated in Figure 2.
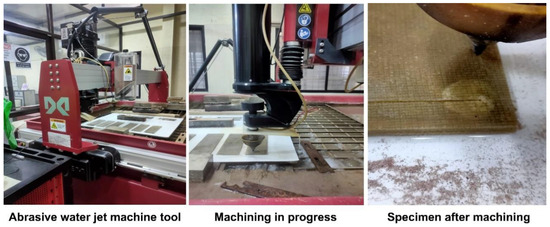
Figure 2.
Abrasive waterjet machining arrangements.
3.4. Abrasive Material Used
Garnet was used as the abrasive material for machining. Almandine, a kind of garnet that is well known for its toughness and sharp edges, was chosen because of its widespread use and affordable price. Almandine can cut through a variety of materials, including composites, metals and ceramics. Almandine garnet rates between 7.5 and 8.0 on the Mohs scale for hardness. Various mesh sizes are available, ranging from coarse 50 mesh to extremely fine 230 mesh. Since it is a very popular and efficient abrasive size for waterjet machining, garnet with a mesh size of 80 was used in this work. The most popular and efficient abrasive for waterjet machining is mesh 80 garnet. When compared to several other abrasives, garnet is non-toxic and non-hazardous. Thus, it does not immediately affect human health or the environment.
3.5. Measurement of Surface Roughness
Surface roughness after machining was measured with Taylor Hobson Surtronic 3+ surface roughness measuring instrument. The roughness was measured for both 45° and 90° fiber inclination composites. The average values of three readings measured at various places were considered as final Ra values. The set-up used for the measurement of Ra is presented in Figure 3.
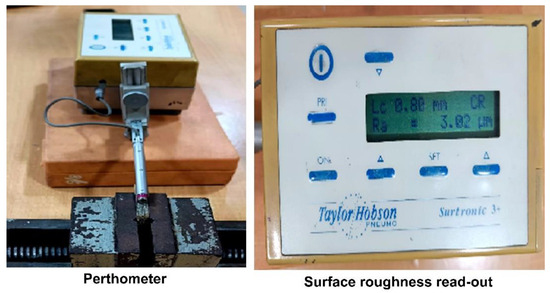
Figure 3.
Measurement of surface roughness using perthometer.
4. Results and Analysis
4.1. Conduction of Experiment and Data Acquisition
A total of 27 experiments were conducted with various combinations of input parameters that were determined using the Design of Experiments method. The L27 full factorial array was utilized to obtain the combination for each experiment. Table 2 displays the combination of the L27 array and the average values of Ra for both 45° and 90° fiber inclinations.

Table 2.
L27 array combination and estimated Ra for 45° and 90° fiber inclination.
4.2. Normal Probability Plots
Figure 4 represents the normal probability chart of the experiment. In statistics, a normal probability chart is a graphical tool used to assess whether a dataset follows a normal distribution (Gaussian distribution). It is well known that the obtained dataset closely follows a normal distribution. The points on the plot will approximately form a straight line. The deviations from that straight line specify departures from normality. If the points lie roughly along a straight line, it suggests that the obtained data follow a normal distribution. Since many statistical tests and procedures are based on the assumption of normally distributed data, these normal probability charts are handy for assessing the assumption of normality in statistical analyses. By referring to the plots, it is observed that the collected data form a line without much deviation. This indicates that the data collected for 45° fiber inclination as well as for 90° inclination follow the normal distribution.
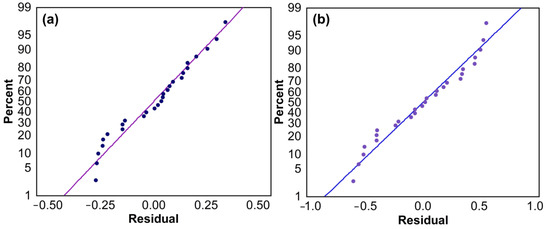
Figure 4.
Normal probability plots for data collected for (a) 45° fiber inclination, (b) 90° fiber inclination.
4.3. Regression Equations
The regression equation for surface roughness considering the TS, SOD and MFR is presented in Equations (1) and (2) for 45° and 90° fiber inclinations, respectively. A Linearity Assumption has been made while generating this equation. Regression equations help us to calculate surface roughness values mathematically for any values of input parameters. From the 45° fiber orientation, it is proven that even though all the parameters have a prominent influence over surface roughness, the parameter MFR is dominating other parameters. From the equation predicted for 90° fiber inclination, it is clear that the parameter SOD is the leading influencing one. Table 3 and Table 4 are the regression tables for 45° and 90° fiber inclinations.
Ra 45 = 7.32 − 0.0616 TS + 0.320 SOD − 6.800 MFR
Ra 90 = 3.83 + 0.0007 TS + 0.724 SOD − 0.0422 MFR

Table 3.
Regression table for 45° fiber inclination.

Table 4.
Regression table for 90° fiber inclination.
4.4. Main Effect Plots
A gradient line in the main effect plots shows how the selected parameters affect performance. The steeper the line, the higher the influence. Accordingly, Figure 5 displays the influence of process variables on the mean Ra value when machining composites have fibers with 45° inclinations. Abrasive MFR displays a steeper slope in comparison to the other two input parameters, indicating a greater impact on surface roughness. A slight variation in the MFR causes surface roughness to change drastically. Hence, while varying the levels of this parameter, one should take the utmost care. It is not recommended to change the level of this parameter from the optimum value. The parameter SOD exhibits a moderate slope, indicating a moderate impact on surface roughness. Hence, a small amount of variation in the level of this parameter can be implemented according to our requirement. By displaying the smaller slope, the parameter TS suggests the least impact. It means that the level of this parameter can be fixed at any value between the chosen ranges. In the case of composites with a 90° fiber orientation, the maximum slope was denoted by SOD, indicating a greater influence. The MFR was moderately influential followed by TS. Therefore, changes in the level of the parameter SOD are not recommended. The parameter MFR can be moderately varied and the parameter TS can be fixed at any level between the selected ranges.
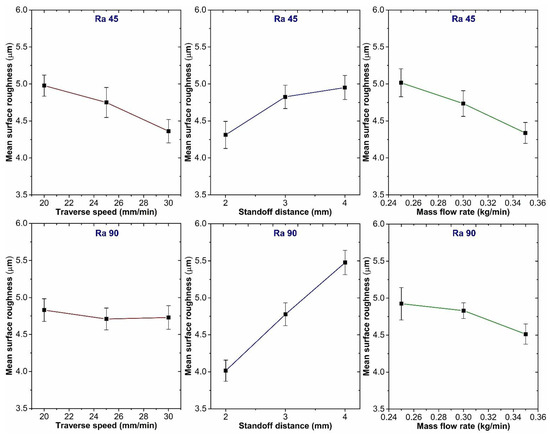
Figure 5.
Main effect plots for 45° and 90° fiber inclinations.
4.5. ANOVA Analysis
Table 5 and Table 6 show the ANOVA for surface roughness. It is carried out at 95% of α value. The results show that as the fiber orientation changes, the predominant parameters affecting the surface roughness also change. From the analysis table obtained for 45° fiber inclination, it is clear that all the variables have a significant effect on surface roughness, but the MFR dominates the other two variables. In the case of composites with a 90° fiber inclination, SOD is highly influential variable, while TS is the least significant one.

Table 5.
Analysis of variance for Ra 45, using adjusted SS for tests.

Table 6.
Analysis of variance for Ra 90, using adjusted SS for tests.
Figure 6 depicts the contribution of each parameter in the generation of surface roughness during the machining process of the 45° fiber inclination specimen. Even though all three considered variables contribute almost at an equal level, MFR is the dominant one. Similarly, Figure 7 represents the percentage contribution of each parameter and the interaction effect on the generation of roughness when the fiber inclination is 90°. It is clear from the figure that SOD has a higher contribution in comparison with other variables.
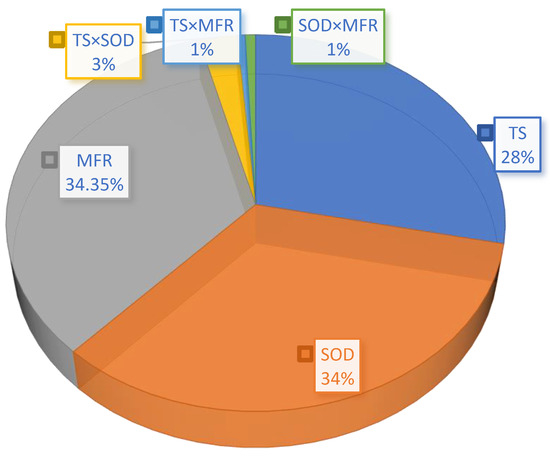
Figure 6.
Contribution of each parameter to surface roughness in percentage (45°).
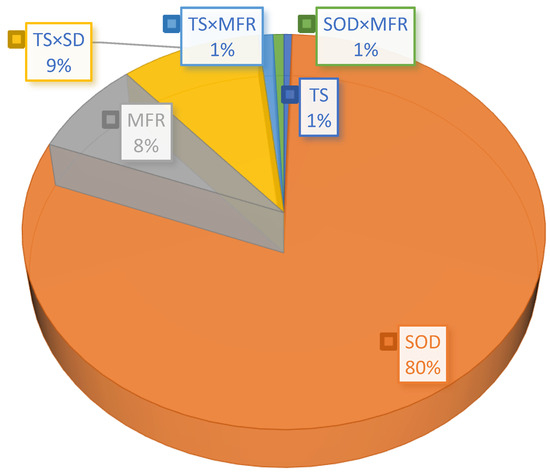
Figure 7.
Contribution of each parameter to surface roughness in percentage (90°).
4.6. Effect of Control Factors on Surface Roughness
4.6.1. Effect of Standoff Distance on Surface Roughness
Surface roughness in both the cases increased as the SOD increased. Higher SOD allows the water jet to expand prior to impingement which may increase vulnerability to external drag from the surrounding environment. Therefore, an increase in the SOD results in an increased jet diameter as cutting is initiated which in turn, reduces the kinetic energy density of the jet at impingement [28]. Hence it is desirable to have a lower SOD which produces a smoother surface due to increased kinetic energy.
4.6.2. Effect of Abrasive Mass Flow Rate on Surface Roughness
In the case of abrasive flow rate, the higher the abrasive flow rate, the larger the amount of cutting particles involved in the cutting processes. When the abrasive flow rate is increased, the jet can cut through the laminate easily, and as a result, the cut surface becomes smoother. However, roughness increases with an increase in abrasive MFR up to a certain limit, and beyond that limit, it was found to decrease. This is due to the fact that an increase in the mass of abrasive particles results in an inter-collision of particles among themselves and hence, causes a loss of kinetic energy [29,30].
4.6.3. Effect of Traverse Speed on Surface Roughness
An increase in TS increased the surface roughness magnitude. When the TS is less, a large number of cutting particles are involved in the cutting action and cutting particles are impinged on the same area. Due to this, the initial impinging particles cut the material and the later impinging cutting particles smoothen cut surfaces which leads to a better surface finish. Hence, always it is better to go with the lower TS [31,32].
4.6.4. Effect of Fiber Inclination on Surface Roughness
In addition to the process variables, surface roughness is also dependent on fiber orientation. For fixed process variables, when the machining was carried out on the specimens whose fiber orientation was 45° and 90°, the different values of surface roughness were obtained, which proves the effect of fiber inclination on surface roughness. A similar trend was noted by Azmir et al. [29,33], when the cutting was performed on composites with different fiber inclinations such as 0°, 22.5° and 90°. The minimum surface roughness was noted when cutting composites with a 22.5° orientation. However, in the present study, no clear trend was noted. It is believed that both constituents of fibers and the interstitial matrix experienced independent shear fracture during the material removal process. However, the real effect of cutting orientation is a very important subject for discussion, and it may well depend on the nature of fibers, mechanic fracture of fibers and cohesiveness of the matrix.
4.7. Taguchi Response Tables
The Taguchi response for data means is shown in Table 7 and Table 8. When the fiber inclination is 45°, the abrasive MFR has the highest rating, indicating a higher influence on surface roughness. The next best influential variable denoted was SOD followed by TS. For 90° fiber orientation as per the ranking allotted, SOD has a dominating influence on surface roughness followed by MFR and TS. Taguchi response tables not only identify the parameters’ ranking, but they also provide the output values for each level of parameter. Hence, by selecting the level of each parameter that yields the lowest roughness values and combining them, an optimum combination of parameters can be obtained. In the present work, for a 45° fiber inclination level 3 of TS, level 1 of SOD and level 3 of MFR produce minimum roughness. By selecting and combining these parameters, the optimum combination obtained was: TS = 30 mm/min, SOD = 2 mm and MFR = 0.35 kg/min. Similarly, for 90° fiber inclination, the optimum combination was TS = 25 mm/mim, SOD = 2 mm and MFR = 0.35 mm/min.

Table 7.
Taguchi response table for Ra 45 versus TS, SOD, MFR (smaller is better).

Table 8.
Taguchi response table for Ra 90 versus TS, SOD, MFR (smaller is better).
4.8. RSM Optimization Plots
The optimization plots provide an optimum set of levels that should be set for the AWJM process parameters in order to obtain the required output. For this particular work, the Response Surface Methodology (RSM) optimum plot is obtained which provides the optimum level of each AWJM variable in order to obtain the minimum surface roughness. The RSM optimum plots are plotted for both 45° and 90° fiber orientation cases and are shown in Figure 8. According to the plot, for the present experimentation condition, to attain minimum roughness on 45° fiber inclination composites, the optimum combination should be TS = 30 mm/mim, SOD = 2 mm and MFR = 0.35 kg/min. In a similar way, to obtain the minimum roughness on the 90° fiber inclination specimen, the combination should be TS = 25 mm/mim, SOD = 2 mm and MFR = 0.35 mm/min, which is similar to Taguchi optimum combinations.
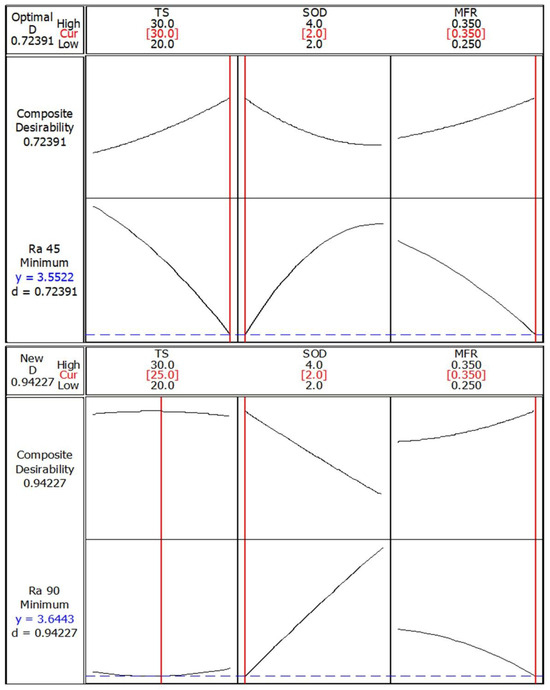
Figure 8.
Optimization plots for surface roughness for fiber inclinations of 45° and 90°.
4.9. Surface Plots
Figure 9, Figure 10 and Figure 11 represent the surface plots for the composite when the fiber inclination is 45° with various combinations of input parameters and levels. From the figures, it is clear that changes in TS, SOD and MFR have a significant influence on surface roughness. A change in TS does not have much influence on surface roughness, unlike the abrasive MFR which has a huge influence. The lowest value of delamination was obtained for the combination TS = 30 mm/min, SOD = 2 mm and MFR = 0.35 kg/min.
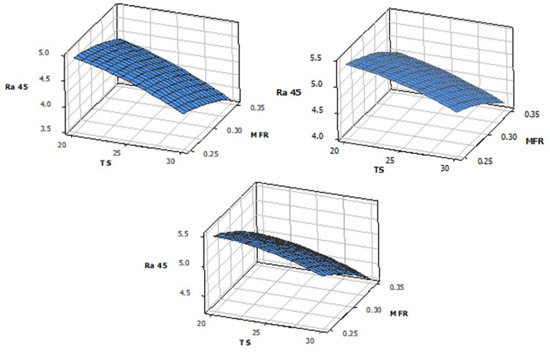
Figure 9.
Interaction effect of TS and MFR on surface roughness when SOD is 2 mm, 3 mm and 4 mm.
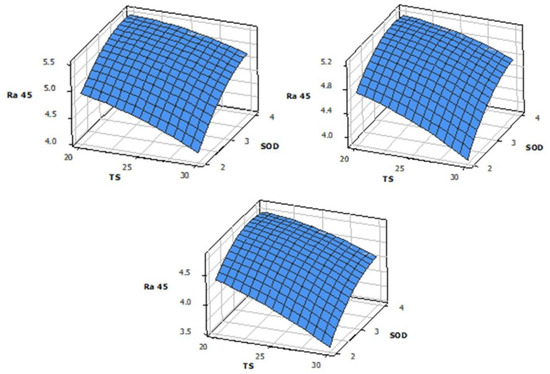
Figure 10.
Effect of TS and SOD with MFR when it is 0.25 kg/min, 0.3 kg/min and 0.35 kg/min.
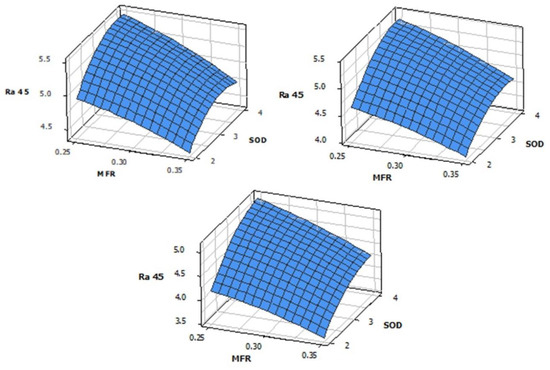
Figure 11.
Effect of MFR and SOD with TS when it is 20 mm/min, 25 mm/min and 30 mm/min.
Figure 12, Figure 13 and Figure 14 illustrate the surface plot for the specimen with 90° fiber inclination. It appears that variations in TS do not have a significant impact on surface roughness. However, changes in the parameter SOD result in a significant deviation in the graph, indicating a high level of influence. The best combination for this specimen is TS = 25 mm/mim, SOD = 2 mm and MFR = 0.35 mm/min.
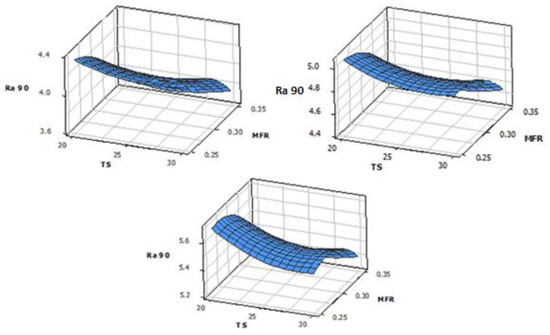
Figure 12.
Effect of TS and MFR with SOD when it is 2 mm 3 mm and 4 mm.
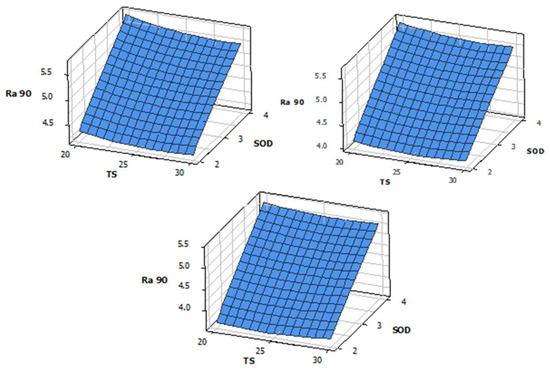
Figure 13.
Effect of TS and SOD with MFR when it is 0.25 kg/min, 0.3 kg/min and 0.35 kg/min.
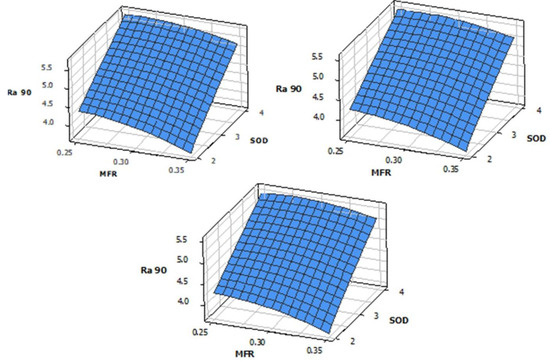
Figure 14.
Effect of MFR and SOD with TS when it is 2 mm, 3 mm and 4 mm.
5. Conclusions
The main conclusions drawn from this experimental work are:
Due to their superior properties and low cost, jute fiber-reinforced polymer composites are finding wide applications in various fields such as the automotive industry, construction industry, aerospace industry, sports, and recreation industry, etc.
During the fabrication process in all these industries, cutting of the above composite to the required size is very essential.
The result of this work will be very helpful in carrying out the quality cutting process.
The parameter abrasive MFR has the greatest influence on the surface roughness of the specimen with 45° fiber inclination and the parameter SOD dominates other parameters when the fiber orientation is 90°. TS has the least influence on both specimens. The optimum combination of process parameters predicted to achieve the minimum surface roughness is restricted to only for the present experiment conditions.
Minimum surface roughness is achieved in 45° fiber inclination when the TS is 30 mm/min, SOD is 2 mm and MFR is 0.35 kg/min. Under the selected conditions, Ra of 3.552 µm is obtained. Similarly, to achieve minimum surface roughness on 90° fiber inclination specimens, TS of 25 mm/min, SOD of 2 mm and MFR of 0.35 kg/min should be utilized. Under the selected conditions, the obtained value of Ra is 3.664 µm.
The optimum combination of parameters obtained from the Taguchi and Response Surface Methodology techniques are similar.
The average values of Ra obtained for 45° and 90° fiber inclinations are 4.11 µm and 4.96 µm, respectively. This difference in Ra values signifies the effect of reinforced fiber inclination on surface roughness.
Further research work can be carried out to find out an in-depth analysis of the relationship between surface roughness and fiber orientation. Also, the work can be extended to study and predict the influence of process variables on delamination.
Author Contributions
Conceptualization, B.R.N.M.; data curation, J.G. and A.H.; formal analysis, S.R.P., A.H. and G.B.; investigation, B.R.N.M.; methodology, B.R.N.M.; resources, J.G., S.R.P., T.S. and E.M.; writing—original draft, B.R.N.M.; writing—review and editing, J.G., S.R.P., A.H., G.B. and E.M. All authors have read and agreed to the published version of the manuscript.
Funding
This research received no external funding.
Data Availability Statement
Data are contained within the article.
Acknowledgments
The authors would like to acknowledge the support rendered by Advanced Composite Material Testing Laboratory during fabrication, Advanced Materials Testing Laboratory during testing and MIT Workshops in preparation of samples using Abrasive Water Jet Machine.
Conflicts of Interest
The authors declare no conflict of interest.
References
- Jagadeesh, P.; Rangappa, S.M.; Suyambulingam, I.; Siengchin, S.; Puttegowda, M.; Binoj, J.S.; Gorbatyuk, S.; Khan, A.; Doddamani, M.; Fiore, V.; et al. Drilling Characteristics and Properties Analysis of Fiber Reinforced Polymer Composites: A Comprehensive Review. Heliyon 2023, 9, e14428. [Google Scholar] [CrossRef] [PubMed]
- Ali, N.H.; Shihab, S.K.; Mohamed, M.T. Influence of Ceramic Particles Additives on the Mechanical Properties and Machinability of Carbon Fiber/Polymer Composites. Silicon 2023, 15, 5485–5502. [Google Scholar] [CrossRef]
- Mohit, H.; Rangappa, S.M.; Siengchin, S.; Gorbatyuk, S.; Manimaran, P.; Alka Kumari, C.; Khan, A.; Doddamani, M. A Comprehensive Review on Performance and Machinability of Plant Fiber Polymer Composites. Polym. Compos. 2022, 43, 608–623. [Google Scholar] [CrossRef]
- Schwartzentruber, J.; Spelt, J.K.; Papini, M. Prediction of Surface Roughness in Abrasive Waterjet Trimming of Fiber Reinforced Polymer Composites. Int. J. Mach. Tools Manuf. 2017, 122, 1–17. [Google Scholar] [CrossRef]
- Armagan, M.; Arici, A.A. Cutting Performance of Glass-Vinyl Ester Composite by Abrasive Water Jet. Mater. Manuf. Process. 2017, 32, 1715–1722. [Google Scholar] [CrossRef]
- Sisodia, V.; Gupta, S.K.; Salunkhe, S.; Murali, A.P.; Kumar, S. An Experimental Investigation on Machining of Hardened AISI 440C Stainless Steel Using Abrasive Water Jet Machining Process. J. Mater. Eng. Perform. 2023, 1–17. [Google Scholar] [CrossRef]
- Wan, L.; Xiong, J.; Cai, J.; Wu, S.; Kang, Y.; Li, D. Feasible Study on the Sustainable and Clean Application of Steel Slag for Abrasive Waterjet Machining. J. Clean. Prod. 2023, 420, 138378. [Google Scholar] [CrossRef]
- Natarajan, Y.; Raj, K.L.N.; Tandon, P. Measurement and Analysis of Pocket Milling Features in Abrasive Water Jet Machining of Ti-6Al-4V Alloy. Arch. Civ. Mech. Eng. 2022, 23, 42. [Google Scholar] [CrossRef]
- Wang, H.; Yuan, R.; Zhang, X.; Zai, P.; Deng, J. Research Progress in Abrasive Water Jet Processing Technology. Micromachines 2023, 14, 1526. [Google Scholar] [CrossRef]
- Sabarinathan, P.; Annamalai, V.E.; Rajkumar, K. Optimization of Process Parameter in Abrasive Water Jet Machining of Blue-Fired Grain-Reinforced Glass Fiber Polymer Composite. In Trends in Manufacturing and Engineering Management; Springer: Singapore, 2021; pp. 217–226. [Google Scholar]
- Pereszlai, C.; Geier, N.; Poór, D.I.; Balázs, B.Z.; Póka, G. Drilling Fibre Reinforced Polymer Composites (CFRP and GFRP): An Analysis of the Cutting Force of the Tilted Helical Milling Process. Compos. Struct. 2021, 262, 113646. [Google Scholar] [CrossRef]
- Wang, B.; Gao, H. Conventional Machining Processes of Fibre Reinforced Polymer Composites. In Advances in Machining of Composite Materials: Conventional and Non-Conventional Processes; Springer: Berlin/Heidelberg, Germany, 2021; pp. 45–70. [Google Scholar]
- Handa, D.; Sooraj, V.S. Thermal Investigations on Eccentric Sleeve Grinding of Fibre Reinforced Composites. J. Manuf. Process. 2022, 84, 1404–1427. [Google Scholar] [CrossRef]
- Mishra, Y.K.; Gupta, S.K.; Mishra, S.; Singh, D.P. Laser Beam Drilling of Fiber Reinforced Composites Using Nd: YAG and CO2 Laser: A Review. Mater. Today Proc. 2023. [Google Scholar] [CrossRef]
- Roldan-Jimenez, L.; Bañon, F.; Valerga, A.P.; Fernandez-Vidal, S.R. Design and Analysis of CFRP Drilling by Electrical Discharge Machining. Polymers 2022, 14, 1340. [Google Scholar] [CrossRef]
- Dhanvijay, M.R.; Kulkarni, V.A.; Doke, A. Experimental Investigation and Analysis of Electrochemical Discharge Machining (ECDM) on Fiberglass Reinforced Plastic (FRP). J. Inst. Eng. Ser. C 2019, 100, 763–769. [Google Scholar] [CrossRef]
- Rajesh, M.; Rajkumar, K.; Annamalai, V.E. Abrasive Water Jet Machining on Ti Metal-Interleaved Basalt-Flax Fiber Laminate. Mater. Manuf. Process. 2021, 36, 329–340. [Google Scholar] [CrossRef]
- Arun, A.; Rajkumar, K.; Vishal, K. Process Parameters for Optimization in Abrasive Water Jet Machining (AWJM) of Silicon-Filled Epoxy Glass Fibre Polymer Composites. J. Inorg. Organomet. Polym. Mater. 2023, 33, 1339–1356. [Google Scholar] [CrossRef]
- Madival, A.S.; Doreswamy, D.; Shetty, R.; Naik, N.; Gurupur, P.R. Optimization and Prediction of Process Parameters during Abrasive Water Jet Machining of Hybrid Rice Straw and Furcraea Foetida Fiber Reinforced Polymer Composite. J. Compos. Sci. 2023, 7, 189. [Google Scholar] [CrossRef]
- Thakur, R.K.; Singh, K.K. Experimental Investigation and Optimization of Abrasive Water Jet Machining Parameter on Multi-Walled Carbon Nanotube Doped Epoxy/Carbon Laminate. Measurement 2020, 164, 108093. [Google Scholar] [CrossRef]
- Kavimani, V.; Gopal, P.M.; Sumesh, K.R.; Kumar, N.V. Multi Response Optimization on Machinability of SiC Waste Fillers Reinforced Polymer Matrix Composite Using Taguchi’s Coupled Grey Relational Analysis. Silicon 2022, 14, 65–73. [Google Scholar] [CrossRef]
- Gopal, P.M.; Kavimani, V.; Arunkumar, K. Multi-Objective Optimization on Abrasive Water Jet Machining of Epoxy/Glass Fiber/Grinding Wheel Particle Composite through Hybrid Optimization Technique. Multiscale Multidiscip. Model. Exp. Des. 2023, 6, 697–707. [Google Scholar] [CrossRef]
- Karataş, M.A.; Motorcu, A.R.; Gökkaya, H. Study on Delamination Factor and Surface Roughness in Abrasive Water Jet Drilling of Carbon Fiber-Reinforced Polymer Composites with Different Fiber Orientation Angles. J. Braz. Soc. Mech. Sci. Eng. 2021, 43, 22. [Google Scholar] [CrossRef]
- Chenrayan, V.; Manivannan, C.; Shahapurkar, K.; Zewdu, G.A.; Maniselvam, N.; Alarifi, I.M.; Alblalaihid, K.; Tirth, V.; Algahtani, A. An Experimental and Empirical Assessment of Machining Damage of Hybrid Glass-Carbon FRP Composite during Abrasive Water Jet Machining. J. Mater. Res. Technol. 2022, 19, 1148–1161. [Google Scholar] [CrossRef]
- Rangasamy, G.; Mani, S.; Kolandavelu, S.K.S.; Alsoufi, M.S.; Ibrahim, A.M.M.; Muthusamy, S.; Panchal, H.; Sadasivuni, K.K.; Elsheikh, A.H. An Extensive Analysis of Mechanical, Thermal and Physical Properties of Jute Fiber Composites with Different Fiber Orientations. Case Stud. Therm. Eng. 2021, 28, 101612. [Google Scholar] [CrossRef]
- Yu, T.; Tuerhongjiang, T.; Sheng, C.; Li, Y. Phosphorus-Containing Diacid and Its Application in Jute/Poly (Lactic Acid) Composites: Mechanical, Thermal and Flammability Properties. Compos. Part A Appl. Sci. Manuf. 2017, 97, 60–66. [Google Scholar] [CrossRef]
- Markopoulos, A.P.; Manolakos, D.E.; Vaxevanidis, N.M. Artificial neural network modelling of surface quality characteristics in abrasive water jet machining of trip steel sheet. J. Intell. Manuf. 2008, 19, 283–292. [Google Scholar] [CrossRef]
- El-Hofy, M.; Helmy, M.O.; Escobar-Palafox, G.; Kerrigan, K.; Scaife, R.; El-Hofy, H. Abrasive Water Jet Machining of Multidirectional CFRP Laminates. In Proceedings of the 19th CIRP Conference on Electro Physical and Chemical Machining, Bilbao, Spain, 23–27 April 2018. [Google Scholar]
- Azmira, M.A.; Ahsanb, A.K. A study of abrasive water jet machining process on glass/epoxy composite laminate. J. Mater. Process. Technol. 2009, 209, 6168–6173. [Google Scholar] [CrossRef]
- Ramakrishnan, S. Investigating the effects of abrasive water jet machining parameters on surface integrity, chemical state in machining of Ti-6Al-4V. Mater. Today Commun. 2022, 31, 103480. [Google Scholar] [CrossRef]
- Ramesha, K.; Santhosh, N.; Kiran, K.; Manjunath, N.; Naresh, H. Effect of the Process Parameters on Machining of GFRP Composites for Different Conditions of Abrasive Water Suspension Jet Machining. Arab. J. Sci. Eng. 2019, 44, 7933–7943. [Google Scholar] [CrossRef]
- Manivannan, J.; Rajesh, S.; Mayandi, K.; Rajini, N.; Ayrilmis, N. Investigation of abrasive water jet machining parameters on turkey fibre reinforced polyester composites. Mater. Today Proc. 2021, 45, 8000–8005. [Google Scholar] [CrossRef]
- Sumesh, K.R.; Kanthavel, K. Abrasive Water Jet Machining of Sisal/Pineapple Epoxy Hybrid Composites with the Addition of Various Fly ash Filler. Mater. Res. Express 2020, 1, 103480. [Google Scholar] [CrossRef]
Disclaimer/Publisher’s Note: The statements, opinions and data contained in all publications are solely those of the individual author(s) and contributor(s) and not of MDPI and/or the editor(s). MDPI and/or the editor(s) disclaim responsibility for any injury to people or property resulting from any ideas, methods, instructions or products referred to in the content. |
© 2023 by the authors. Licensee MDPI, Basel, Switzerland. This article is an open access article distributed under the terms and conditions of the Creative Commons Attribution (CC BY) license (https://creativecommons.org/licenses/by/4.0/).