Article

Multifunctional Graphene–Polymer Nanocomposite Sensors Formed by One-Step In Situ Shear Exfoliation of Graphite

1
Department of Mechanical Engineering, University of Texas Rio Grande Valley, Edinburg, TX 78539, USA
2
Mechanical and Aerospace Engineering Department, Rutgers University, New Brunswick, NJ 08854, USA
3
Department of Electrical & Computer Engineering, University of Texas Rio Grande Valley, Edinburg, TX 78539, USA
*
Authors to whom correspondence should be addressed.
J. Compos. Sci. 2023, 7(8), 309; https://doi.org/10.3390/jcs7080309
Submission received: 16 June 2023 / Revised: 19 July 2023 / Accepted: 24 July 2023 / Published: 27 July 2023
(This article belongs to the Section Polymer Composites)

Abstract

:
Graphene nanocomposites are a promising class of advanced materials for sensing applications; yet, their commercialization is hindered due to impurity incorporation during fabrication and high costs. The aim of this work is to prepare graphene–polysulfone (G−PSU) and graphene–polyvinylidene fluoride (G−PVDF) nanocomposites that perform as multifunctional sensors and are formed using a one-step, in situ exfoliation process whereby graphite is exfoliated into graphene nanoflakes (GNFs) directly within the polymer. This low-cost method creates a nanocomposite while avoiding impurity exposure since the raw materials used in the in situ shear exfoliation process are graphite and polymers. The morphology, structure, thermal properties, and flexural properties were determined for G−PSU and G−PVDF nanocomposites, as well as the electromechanical sensor capability during cyclic flexural loading, temperature sensor testing while heating and cooling, and electrochemical sensor capability to detect dopamine while sensing data wirelessly. G−PSU and G−PVDF nanocomposites show superior mechanical characteristics (gauge factor around 27 and significantly enhanced modulus), thermal characteristics (stability up to 500 °C and 170 °C for G−PSU and G−PVDF, respectively), electrical characteristics (0.1 S/m and 1 S/m conductivity for G−PSU and G−PVDF, respectively), and distinguished resonant peaks for wireless sensing (~212 MHz and ~429 MHz). These uniquely formed G−PMC nanocomposites are promising candidates as strain sensors for structural health monitoring, as temperature sensors for use in automobiles and aerospace applications, and as electrochemical sensors for health care and disease diagnostics.

Graphical Abstract

1. Introduction

Multifunctional flexible sensors are gaining more and more importance these days due to applications in the automotive, aerospace, bio, and structural health, marine, and energy sectors [1,2,3,4]. Strain sensors can be made from different materials like metals and polymers with different fillers. Polymers are intrinsically poor in electrical and thermal conductivity and require conductive fillers to enhance those properties for sensing applications. Among different conductive fillers, graphene (single, few, and multi-layer) and exfoliated graphite are of great interest due to their exceptional mechanical properties [5], thermal and electrical conductivities, stability, and large surface area [6,7]. This class of graphene-enhanced thermoplastic polymer matrix composite, henceforth referred to as G−PMC, depends on the unique properties of both graphene/graphite and the polymer to sense its environment. Graphene materials (graphene, graphene oxide, graphene composites) with varying properties can be synthesized by electrochemical exfoliation [8]. Khakpour et al. exfoliated a graphite source to deposit graphene oxide and reduced graphene oxide layers on conductive substrates [9]. Generally, methods utilized to produce graphene are multi-step, expensive, and have the potential to include impurities during fabrication and transfer to the target polymer matrix [5]. Moreover, the mixing of defect-free and inert pristine graphene with polymers is inhomogeneous and can lead to agglomeration in the matrix. Among these methods, melt processing shows the most potential for commercialization with certain limitations (poor dispersion and material degradation) [6].
Nosker and Lynch et al. invented a method that describes the fabrication process of a G−PMC formed by combining graphite and a thermoplastic polymer in a melt-processing method that applies a succession of shear strain events to the molten polymer phase, which exfoliates the graphite into graphene nanoflakes (GNFs) and distributes the GNFs uniformly within the polymer matrix [10,11,12,13,14,15,16]. The shear rate induces a shear stress that is higher than the interlayer shear strength of graphite in order to separate the graphene layers within the molten polymer. Thus, graphite is converted to GNFs within the polymer, GNFs are uniformly distributed within the polymer matrix, and there is ample opportunity for in situ functionalization between newly created GNF edges and the polymer (i.e., during processing, a fracture occurs across the graphene basal plane resulting in reactive edges available to bond with the surrounding polymer while no other impurities are present to bond with the GNF edges). Graphite is exfoliated to create GNF particles with a varying degree of graphene layers in each particle. The degree of exfoliation increases with mixing time during melt-processing (i.e., with increased exposure to shear strain events). This in situ shear exfoliation method does not create graphene as a stand-alone material. Rather, this in situ shear exfoliation method creates a nanocomposite with beneficial and tunable properties at a low cost.
In previous work using this in situ shear exfoliation method, 35 wt. % graphite was exfoliated within polyetheretherketone (PEEK) to create GNF-enhanced PEEK nanocomposites [17]. Morphology and X-ray diffraction results indicated surface crystallization of PEEK on GNF surfaces, very good planar adhesion, and size reduction of GNFs in both the c-axis direction and in diameter due to the fracture across the basal plane; spectroscopic analysis from Raman and XPS spectra indicated in situ formation of chemical bonding between created GNFs and PEEK, and mechanical property results showed a 400% increase in tensile modulus.
Here, we use this one-step, in situ shear exfoliation method to convert graphite into multilayer graphene directly within polysulfone and within polyvinylidene fluoride (PVDF) to prepare G−PSU and G−PVDF nanocomposites that perform as multifunctional sensor materials. PSU is a thermoplastic that contains a characteristic aryl group connected by sulfonyl and ether groups [18]. With different conductive fillers and in combination with different metals, PSU has been used as a humidity sensor, gas sensor, strain sensor, and biosensor [18,19,20,21,22,23]. However, the nanofiller that provides excellent functionalities to the composite is expensive and makes the resultant sensor economically less attractive. PVDF is a semi-crystalline thermoplastic polymer with favorable characteristics such as a low cost, good mechanical properties, resistance to chemicals, thermal stability, and unique pyroelectric and piezoelectric properties [24,25]. With enhanced properties, G−PSU and G−PVDF nanocomposites show promise as materials for many sensor applications.
Traditional sensors require a battery power supply to acquire signals in monitoring systems, which increases the complexity. Further, this battery-powered sensor cannot always be easily adjusted, and so may not be feasible to employ in hostile situations or for in vivo biomedical applications [26,27]. Thus, wireless sensing technology has become a viable feature for avoiding active electronics and has drawn a lot of attention in recent years. A passive resistive inductive capacitive (RLC) strain monitoring circuit based on flexible electronics with a wireless readout mechanism eliminates any active circuit elements in the implant. The method utilizes resonant frequency measurements with a network analyzer or impedance analyzer, where the readout system and sensor communicate wirelessly via electromagnetic inductive coupling. The sensor comprised a series RLC circuit with variable resistance and capacitance that changes with strain. The corresponding shift in RLC resonant frequency signal can be wirelessly recorded using mutual induction between the sensor and readout system coils. The schematic of the readout system and sensor electrical circuit is shown in Figure S1. The sensor resonant frequency is given in Equation (1), where Ls and Cs denote the inductance and capacitance, respectively.
f s = 1 2 π L s C s
In this study, we show the effects of in situ shear exfoliation of graphite into GNFs directly within PSU and PVDF during uniform shear melt-mixing on the electromechanical, electrochemical, and thermoresistive properties (Figure 1). A simple schematic of the in situ shear exfoliation process is shown in Figure 1d and further detailed in [17]. The properties improve with increased GNF filler loading, making them suitable for multifunctional sensors like structural, biological, and temperature sensors. Firstly, we show that our method can produce G−PMC nanocomposites with up to 40 wt. % GNFs within PSU or PVDF. Next, using 35–40 wt. % samples we show the G−PMC nanocomposites are promising as strain sensors under cyclic loading and as temperature sensors in the temperature range of 10–80 °C. Lastly, we investigated G−PMC nanocomposites for wireless and electrochemical sensing.

2. Materials and Methods

Mined graphite (Asbury Carbons mills grade 3627 with 99.2% purity and an average diameter ranging from 250 to 300 μm) was combined with polysulfone (Udel® 1700, Solvay Advanced Polymers) to make G−PSU and with polyvinylidene fluoride (Kynar 720, Arkema) to make G−PVDF. This grade of PVDF is reported by Arkema to have a specific gravity of 1.77–1.79, a melting temperature of 165–172 °C, and tensile strength of 34–55 MPa. This grade of PSU has a specific gravity of 1.24, a melting temperature of 149 °C, and tensile strength of 70.3 MPa.
To prepare G−PSU, graphite and PSU were dry-blended in weight concentrations from 20 to 40 wt. % graphite in PSU in two 500 g batch sizes to help distribute the graphite amongst PSU pellets, added to the hopper of a modified injection molding machine with a unique screw design by Randcastle Extrusion Systems, Inc. (Cedar Grove, NJ, USA), and tensile specimens molded (ASTM D638 Type I with dimensions 3.4 mm by 12.5 mm by 165 mm and a gauge length of 70 mm), as shown in Figure 1d. Materials were processed under a dry nitrogen blanket at 100 RPM and at processing temperatures of approximately 360 °C. The stainless-steel mold temperature was set at 105 °C using a PID temperature controller. Prior to injection molding, PSU and graphite were placed in a furnace at 160 °C for more than 12 h to remove volatiles. The unique screw design imparts uniform shear to exfoliate graphene layers from the bulk-layered graphite material, converts graphite into graphene nanoflakes (GNFs) with various numbers of layers in the c-axis direction, and uniformly distributes GNFs within the PSU, in a similar manner to that described in the previous work [17].
G−PVDF nanocomposites were prepared using a Randcastle micro-batch mixer that imparts elongational flow, folding, and uniform shear to exfoliate graphite into GNFs within PVDF. Prior to melt-processing, PVDF was placed under vacuum for more than 4 h, and graphite was placed in a convection oven at 185 °C for approximately 12 h to remove volatiles. PVDF was added to the batch mixer using starve-feeding followed by the proper graphite concentration, and the components were mixed under a dry nitrogen environment at a processing temperature of approximately 204 °C (but varied slightly with concentration) for a mixing time of 90 min (after the graphite was added). The shear rate during processing is critical to allow exfoliation of nanoplatelets and to achieve uniform distribution of the nanofiller within the polymer matrix [28,29]. Thus, the target processing RPM was over 100 RPM in order to achieve sufficient shear stress to efficiently exfoliate graphite into GNFs and varied as 150, 120, 120, 200, and 15 RPM for 0, 5, 10, 20, and 30 wt. % GNFs in PVDF, respectively. The shear rate depends on RPM and the geometry of the processing machine. The corresponding shear rate was calculated for each starting graphite concentration in PVDF and is shown in Table 1. Notice that for 30 wt. % GNFs in PVDF, the machine was limited to 15 RPM due to increasing viscosity at this high concentration and the current (amp) limitation of this specific machine. The extrudate and bulk pieces from the batch mixer were grounded, placed in a vacuum to remove volatiles for more than 4 h, and molded into ASTM D638 Type V tensile specimens using a mini-molding machine.
Material characterization of the G−PMCs included morphology, structure, thermal properties, and mechanical properties. Morphology was viewed using a Zeiss field emission scanning electron microscope (SEM). G−PSU and G−PVDF samples were cold fractured, mounted on typical aluminum studs with carbon black tape, and gold coated with a thickness of 5 nm. Raman data were collected using a Renishaw inVia reflex system with a 633 nm laser and 50× magnification, and the 40 wt. % G−PSU results are presented. Raman specimens were cut from the tensile specimens to approximate dimensions of 10 mm × 10 mm × 3 mm with the top surface investigated after polishing with a course grade emery paper. Thermogravimetric analysis (TGA) was performed using a TA Instrument Q5000 under a nitrogen atmosphere up to 1000 °C with a ramp rate of 5 °C/min and results for 35 wt. % G−PSU sample are presented. TGA Specimens were cut from tensile specimens having a mass of approximately 35.6 mg. Mechanical properties were determined using an MTS Qtest/25 Elite Controller. G−PSU samples were tested in flexural according to ASTM D790 at a crosshead speed of 1.34 mm/min. G−PVDF Type V specimens were tested in tension according to ASTM D638 using an extensometer to measure strain.
The electromechanical sensor capability of G−PSU and G−PVDF samples was tested by cyclically loading and unloading specimens in 3-point flexural loading using an Instron 5982 universal testing system while simultaneously monitoring the current as a function of time under a potential of 10 volts using a Keithley 2450 source measure unit. Cyclic loading of 40G−PSU was performed over 50 cycles at a 10 N load followed by 50 cycles at a 20 N load, and specimens were manually loaded and unloaded. For G−PVDF sensor testing, G−PVDF extrudate was compression molded into thin sheets and attached to a tensile bar composed of PEEK. The tensile bar was cyclically loaded, and the G−PVDF acted as the sensor to measure the resistance over time during the cyclic loading and unloading procedure. One loading cycle was approximately 1 min and 30 s, which included loading to 20 N (approximately 30 s), holding the 20 N load for 30 s, unloading to 0 N (instant de-load and manual force zero), and holding 0 N for 30 s.
Temperature sensor testing was performed on 40G−PSU, a high GNF concentration, since GNFs enhance thermal conductivity. Thus, 40 G−PSU specimens (dimensions according to ASTM D 638 Type 1 tensile specimens) were subject to heating with a heat gun up to 80 °C and cooling down to 10 °C by evaporating liquid nitrogen under the sample while monitoring the temperature with a thermal imager (RSE600, Fluke Corporation, Everett, WA, USA) and simultaneously measuring the change in resistance using Keithley 2450 source measure unit under the voltage potential of 10 V.
To monitor the sensor data wirelessly, a passive wireless resonant circuit was fabricated, and the bending data were obtained from the resonant frequency. For the inductor coil of the sensor and readout system, a copper coil with a wire diameter of 1.5 mm was used. The coil inductances of the sensor and readout side were 11.6 µH and 11 µH, respectively. The frequency response of the sensor was remotely monitored through the minimum of the input return loss (S11) in the readout device using an HP8752C network analyzer.
Electrochemical sensing was performed using a three-electrode system where the working electrode was G−PSU (or G−PVDF, respectively), silver wire was the counter electrode, and platinum wire was the reference electrode. The dimensions of the G−PSU and G−PVDF specimens were 10 mm × 10 mm × 1.5 mm. Electrochemical impedance spectroscopy (EIS) was used to evaluate the performance of G−PSU and G−PVDF as electrochemical sensors for dopamine detection. To evaluate the performance of G−PVDF and G−PSU as electrochemical sensors, we used the experimental setup shown in Figure S2. We measured impedance with Fe2+/Fe3+ redox couple as analytes. Then, dopamine was added with concentrations of 1 mM, 2 mM, and 3 mM while running an EIS test in the frequency range from 10 to 105 Hz.

3. Results and Discussion

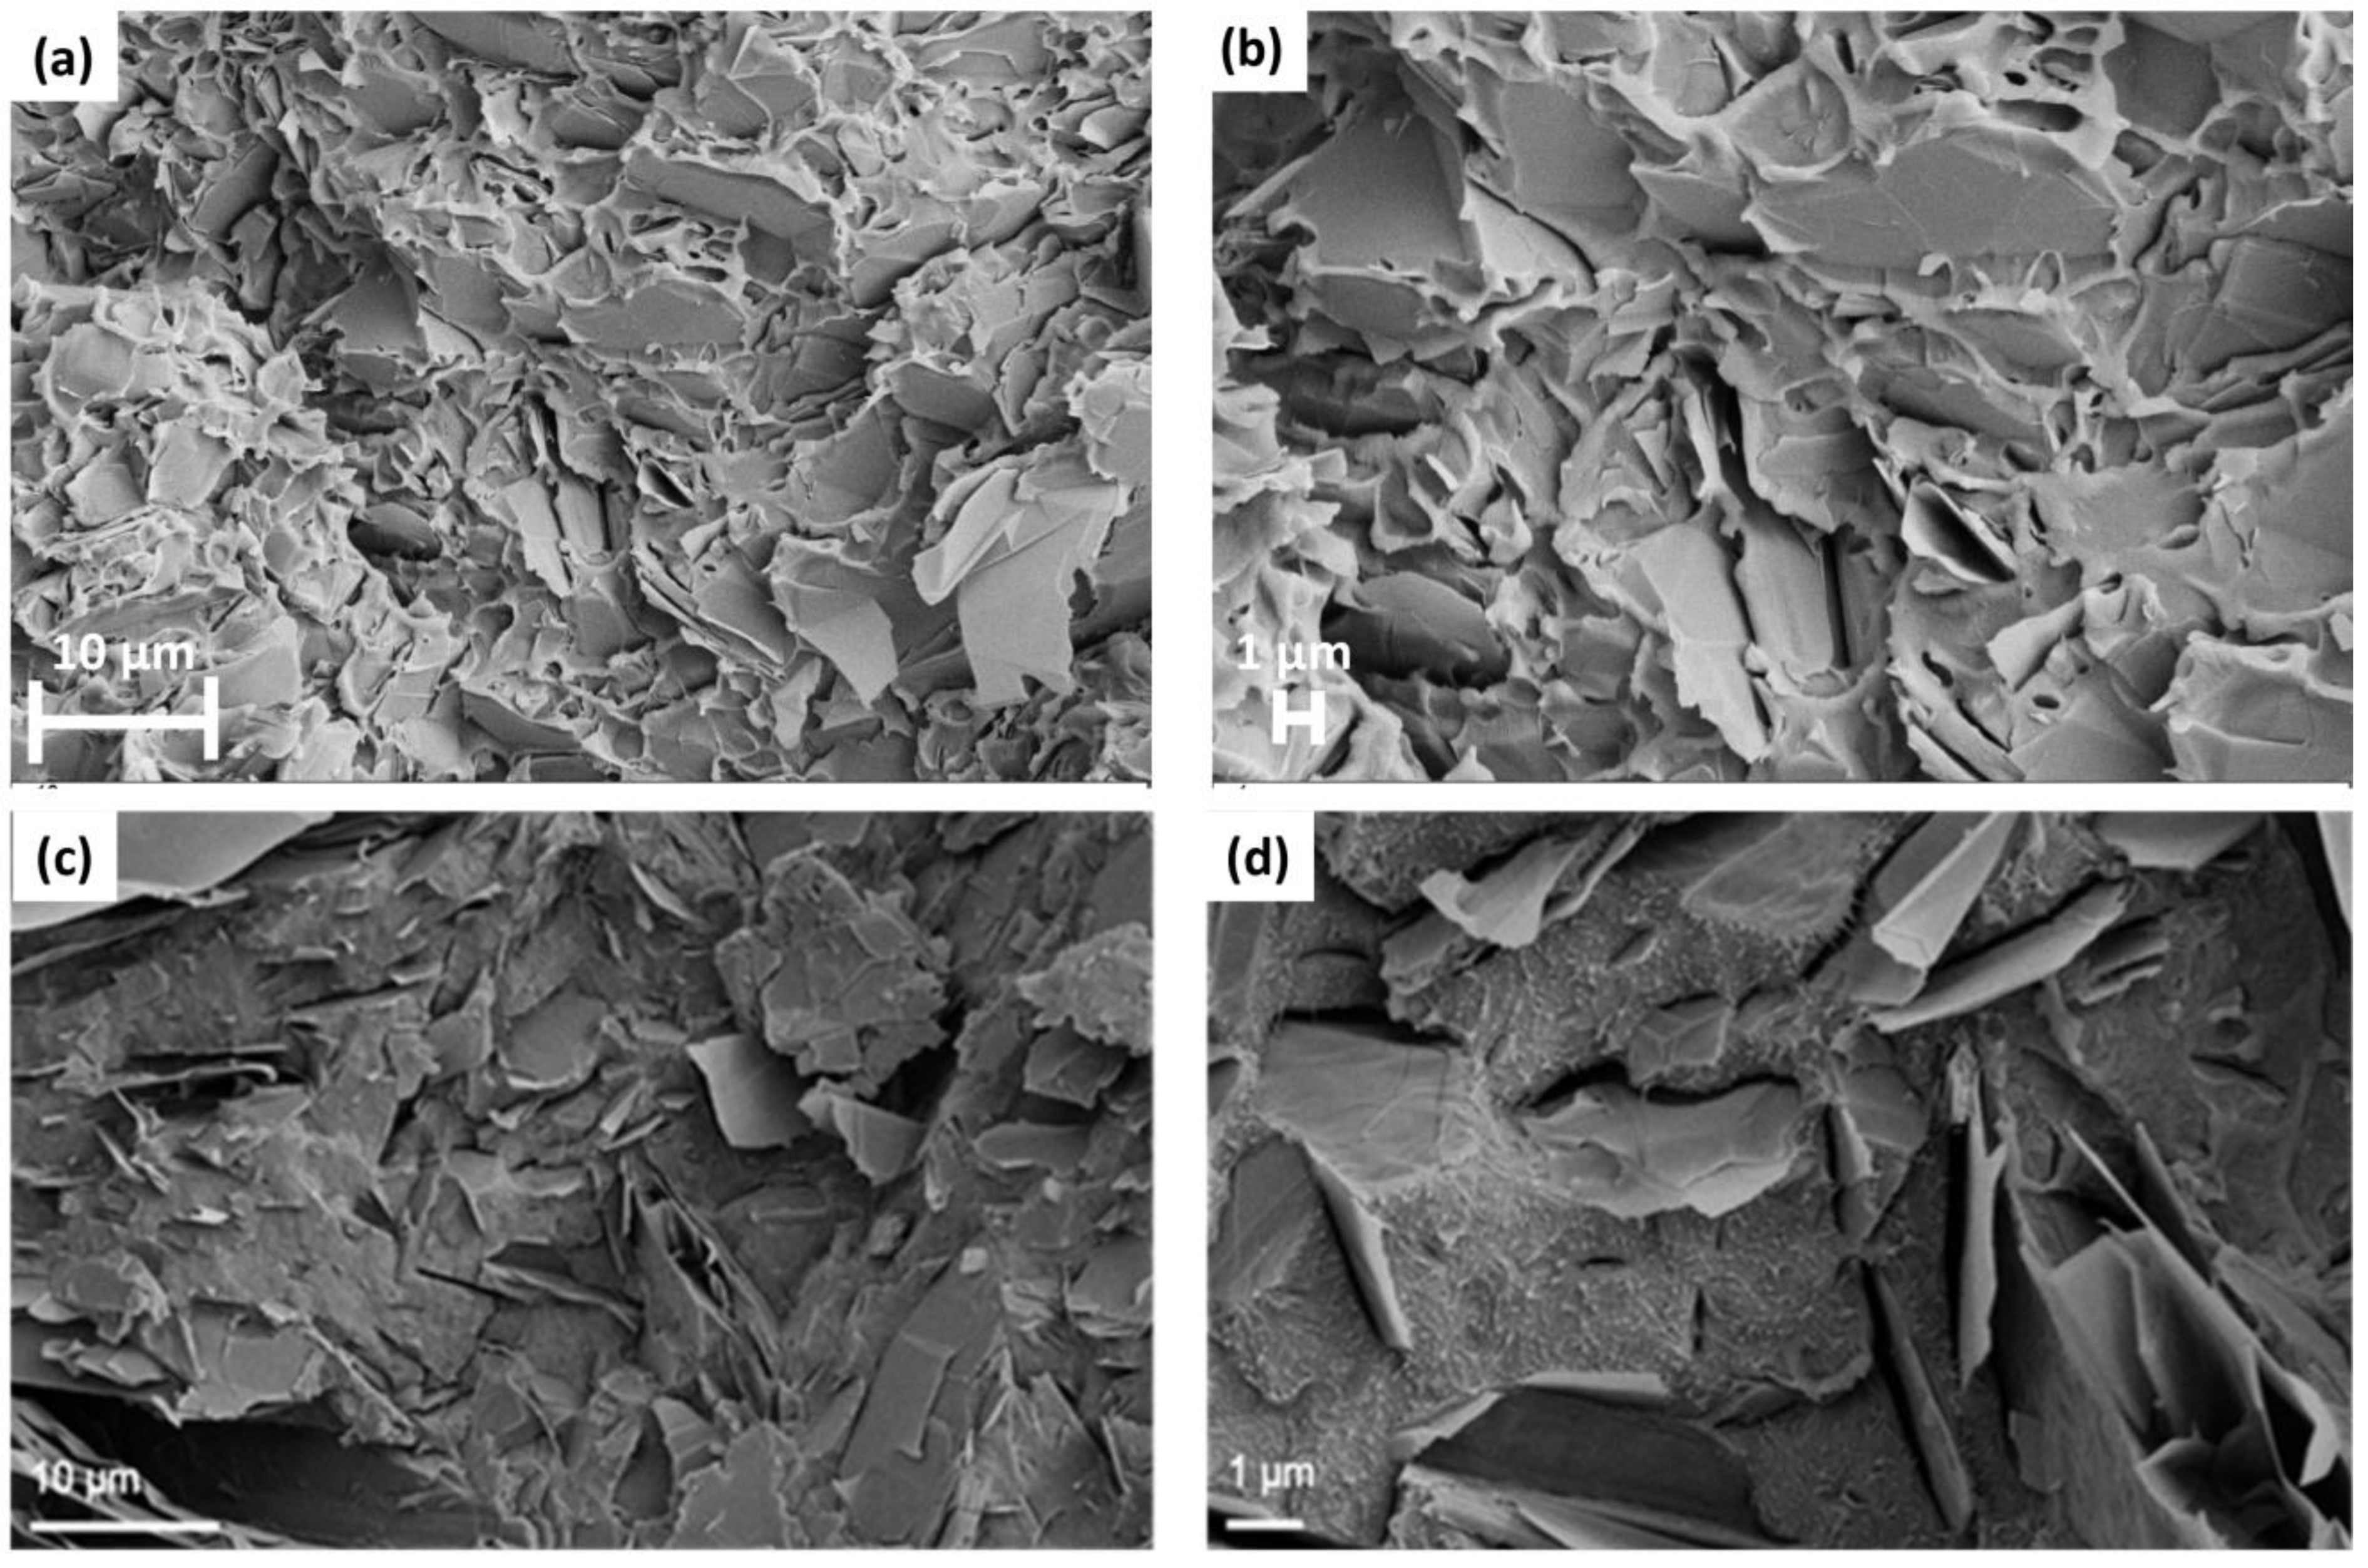
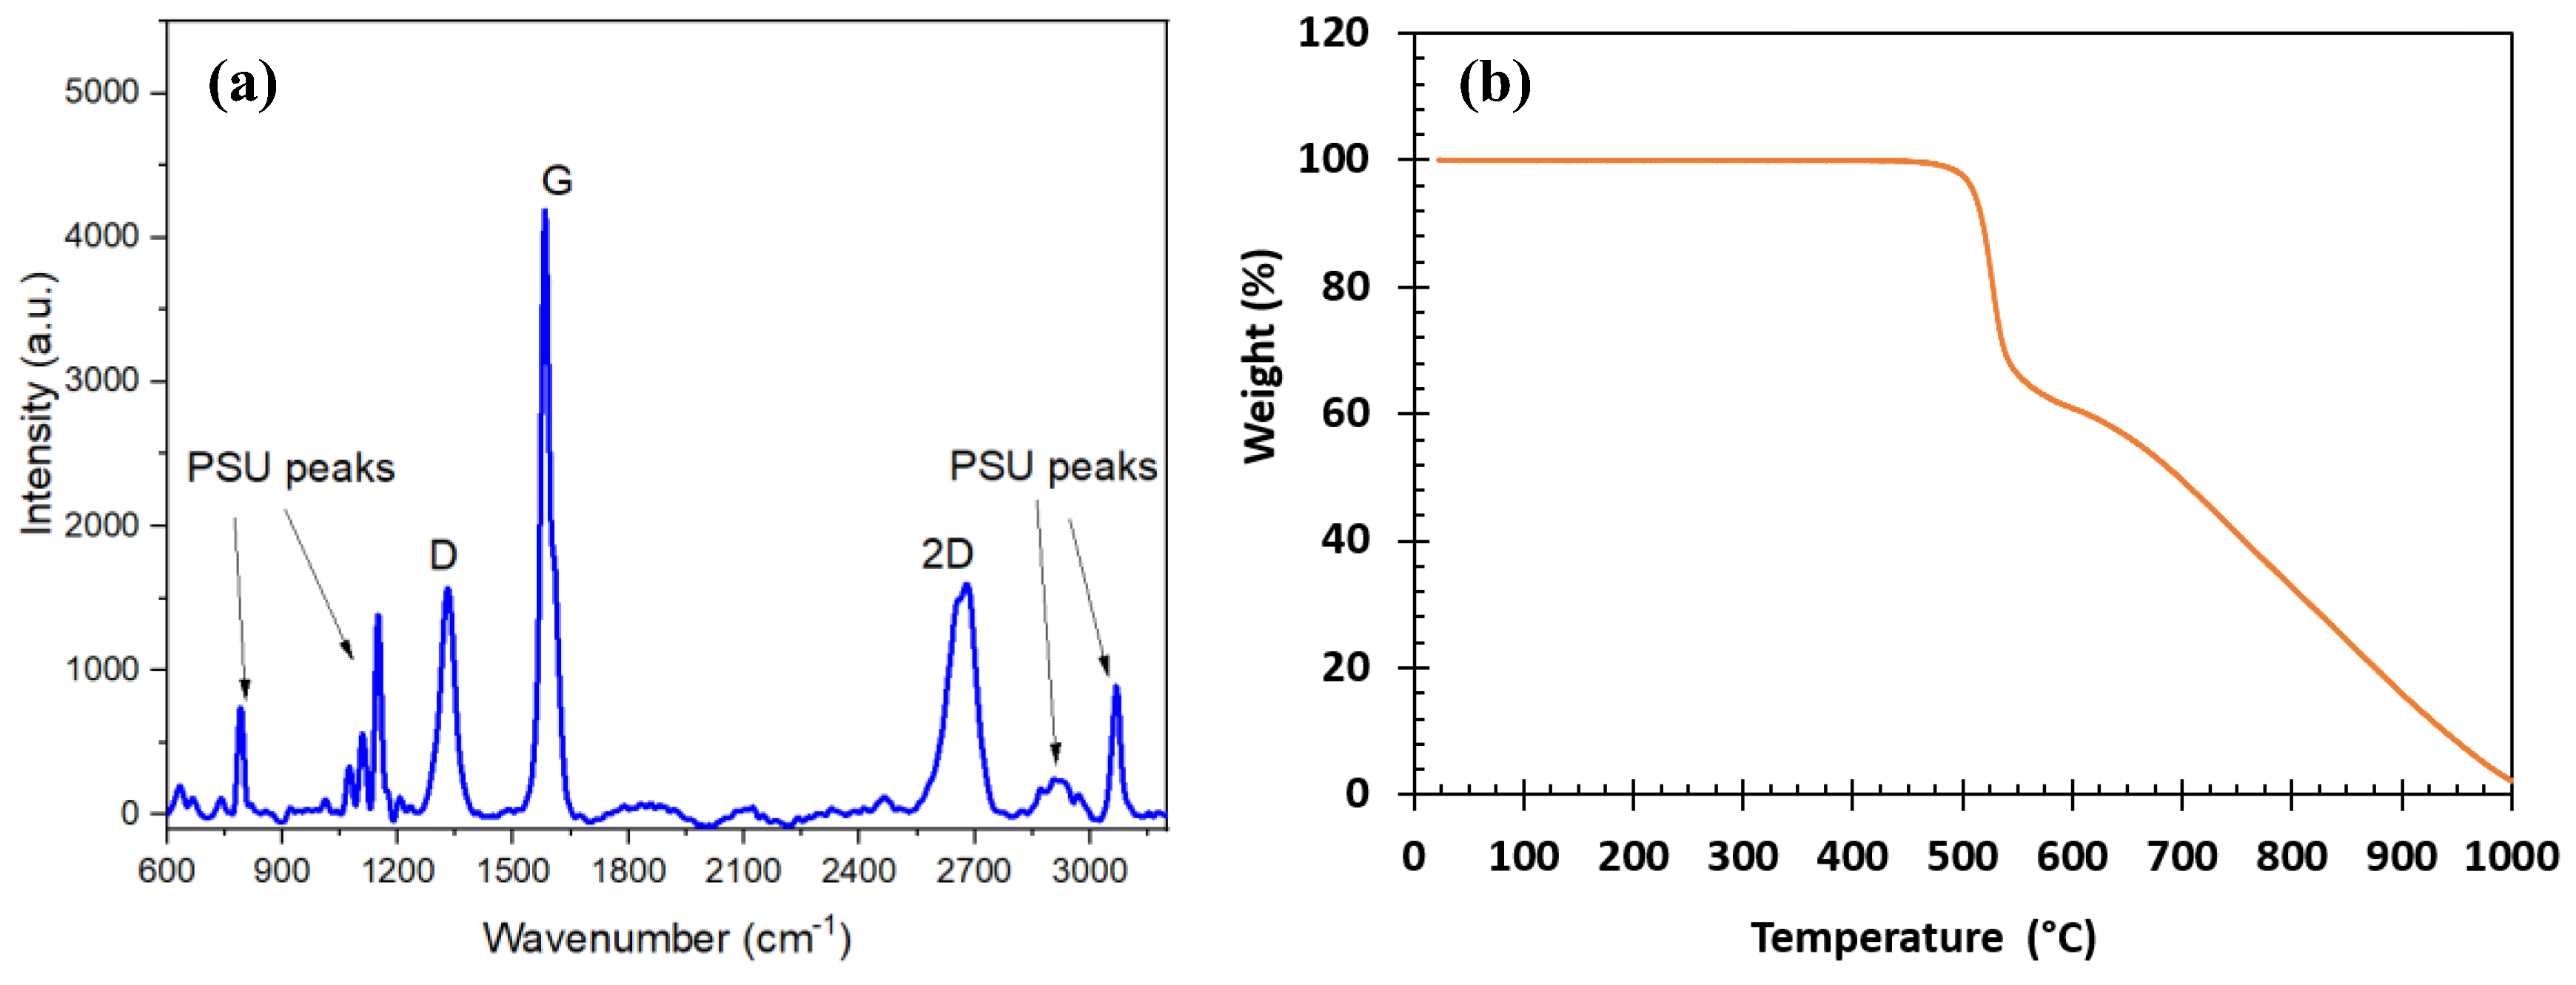
3.1. Material Characterization

The morphology of 40G−PSU is displayed in Figure 2a,b, with SEM images showing GNFs uniformly distributed in the polymer matrix. No filler agglomeration was observed from the SEM images. This uniform distribution of GNFs within PSU is similar to our previous work investigating in situ exfoliation of graphite into GNFs within an Ecoflex 00–30 using an infrared thermography approach [30,31]. The original graphite flake diameter was ~300 µm; however, the GNF size measured in SEM images is ~10 µm, indicating a shear-induced fracture across the basal plane resulting in edge sites that are available to form covalent bonds with surrounding polymer molecules. The conformal coating of the GNFs by the polymer indicates strong interfacial adhesion between them (Figure 2b). The morphology of 30 wt. % GNFs in PVDF is shown in the SEM micrographs at different magnifications in Figure 2c,d. At high magnification (20,000×), the particle–matrix interaction between GNFs and PVDF is visible in Figure 2d. There is very good adhesion between GNF planar surfaces and the PVDF matrix, as well as between visible GNF edges and the PVDF matrix. There is some gap spacing between GNFs and PVDF, which is due to the pull out during cold fracturing used to prepare SEM specimens and not indicative of the morphology.
The Raman spectrum of 40 wt. % G−PSU is presented in Figure 3a. Typical peaks associated with graphene can be observed at ~1350 cm−1 for the D band, ~1580 cm−1 for the G band, ~1650 cm−1 for the D’ band, and ~2680 cm−1 for the 2D band. The intensity ratio of the 2D and G band (I(2D/G)) is ~0.4–0.5, representing GNFs with less than 10 layers [32]. Additionally, the I(D/G) ratio is also high (>0.4), indicating covalent bond formation between GNF and the polymer [17]. Figure 3b shows the TGA plot of 35 wt. % G−PSU. Even though the onset degradation temperature is similar, temperatures corresponding to 60% and lower weight loss are higher than for PSU, indicating a resistance to thermal transfer by GNFs and strong bonding between GNF and the polymer matrix [33]. Differential scanning calorimetry analysis is also presented in Figure S3 and Table S1.
Flexural mechanical properties are shown for G−PSU in Figure 4a,b, and tensile mechanical properties are shown for G−PVDF in Figure 4c,d. The flexural modulus increases with GNF concentration in PSU by 67%, 130%, and 190% for 20, 30, and 40 wt. % GNFs in PSU, respectively (Figure 4b), and the tensile modulus increases with GNF concentration in PVDF by 148, 291, and 558% for 5, 10, and 20 wt. % GNFs in PVDF, respectively (Figure 4c). GNF reinforcement of PSU and PVDF significantly increases the modulus, but the strength of the composite is similar to the polymer. Since there are beneficial mechanical properties, the nanocomposite may be used for structural strain sensing with a wide loading range.

3.2. Electromechanical Strain Sensing

Under an external load, the distance between graphene in the composite and the structure of the hexagonal honeycomb will change, resulting in a change in resistance and therefore current flow through the composite sensor [34]. Electrons tunnel or hop from one graphene flake to another (if the filler content is above the percolation threshold in the composite), and that is why the change in distance between graphene flakes changes the resistance to electron flow [31].
To determine the repeatability of the sensor strain performance, a 40 wt. % G−PSU sample was subjected to 10 and 20 N load (within the elastic regime) 50 times, as shown in Figure 5a. The experimental setup for this test is shown in Figure S4. An ASTM D 638 Type I sample with silver paint contact pads and the copper electrode was subjected to cyclic loads that were manually operated. Results show the consistent amplitude of resistance change for 50 cycles at 10 N load and 20 N load with a slight variation due to the manual loading technique, indicating the durability of the 40 G−PSU sensors during long service life. The sensor showed reversible and self-sensing behavior, which has been described as an advantage of 2D nanofillers (e.g., graphene) vs. 1D nanofillers (e.g., CNT) [35]. The gauge factor (percentage change in resistance vs. change in strain) for the cyclic testing with a 20 N load was found to be 27. This is significantly higher than for the CNT-polysulfone strain sensor and comparable to other reported graphene nanocomposite sensors [4,20,36]. Figure 5b shows the sensor performance of 20G−PVDF with a cyclic change in resistance following the 35 loading/unloading cycles. The mechanically loaded specimen is represented by each trough in the resistance, while the unloaded specimen is represented by each crest. The change in resistance is attributed to the distance between GNFs being altered when under tensile strain.

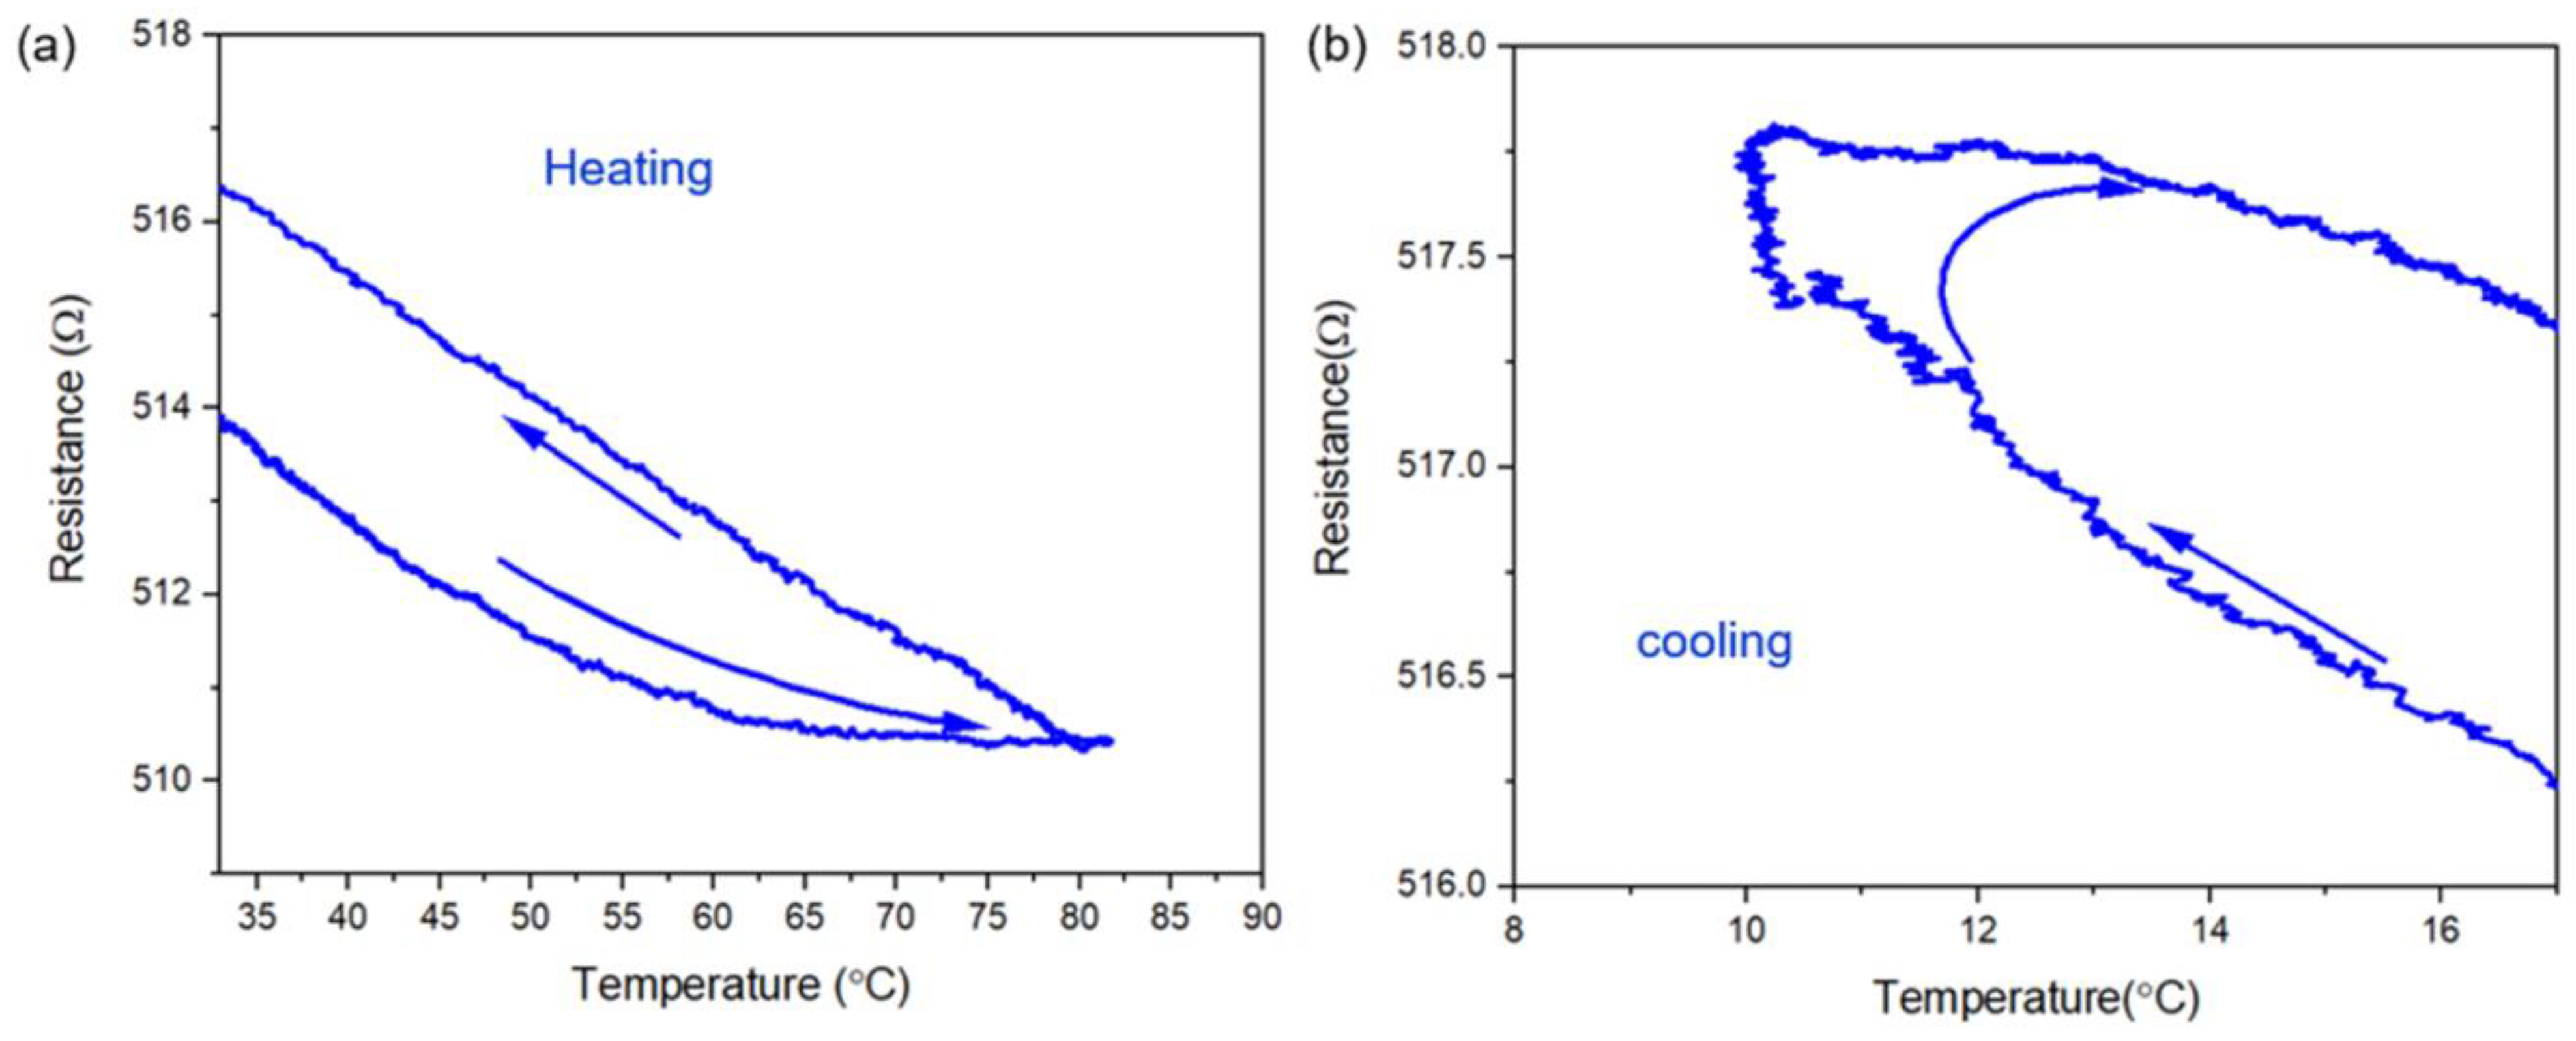
3.3. Temperature Sensing

The resistance and temperature change with time, as well as thermal images, are presented for 40G−PSU during heating and cooling in Figure 6 and Figure 7, respectively. Results show there is a consistent change in resistance with temperature rise and fall during heating with a heat gun and cooling with evaporating liquid nitrogen. The sensor was tested from ~10 °C to 80 °C, indicating wide applicability as a temperature sensor in different weather conditions. After the heating and cooling stop, the resistance recovers almost at the same rate as the temperature, indicating minimal hysteresis (Figure 8). The hysteresis (difference in resistance change at the same temperature during heating and subsequent cooling) can be as high as ~20%, whereas in our case it was only 0.42% [23]. Thermal images (from thermal video recording during the entire test) show a uniform temperature profile across the sample area being heated, indicating uniform dispersion of the nanofillers in the polymer composite (Figure 7b and Figure 8b) [30,31].
Since G−PSU is stable up to 500 °C (3b), the potential of the sensor under different temperature regimes and harsh conditions (like corrosive environments) will be tested in the future. Polysulfone is already a widely accepted material used in the automotive industry (steering column lock switches, relay insulators, and pistons) and in medical equipment (nebulizers and dialysis components) [8]. Therefore, G−PSU, with its excellent temperature sensing properties, can be a suitable strain and temperature sensor for the automotive, medical, and aerospace industries. Additionally, the nanocomposites’ good electrical and thermal properties and chemical stability make them an economically viable material for molded interconnect devices for consumer electronic, telecommunication, automotive, and medical technologies, as well as lightweight structural parts for collaborative robots (i.e., Cobots).

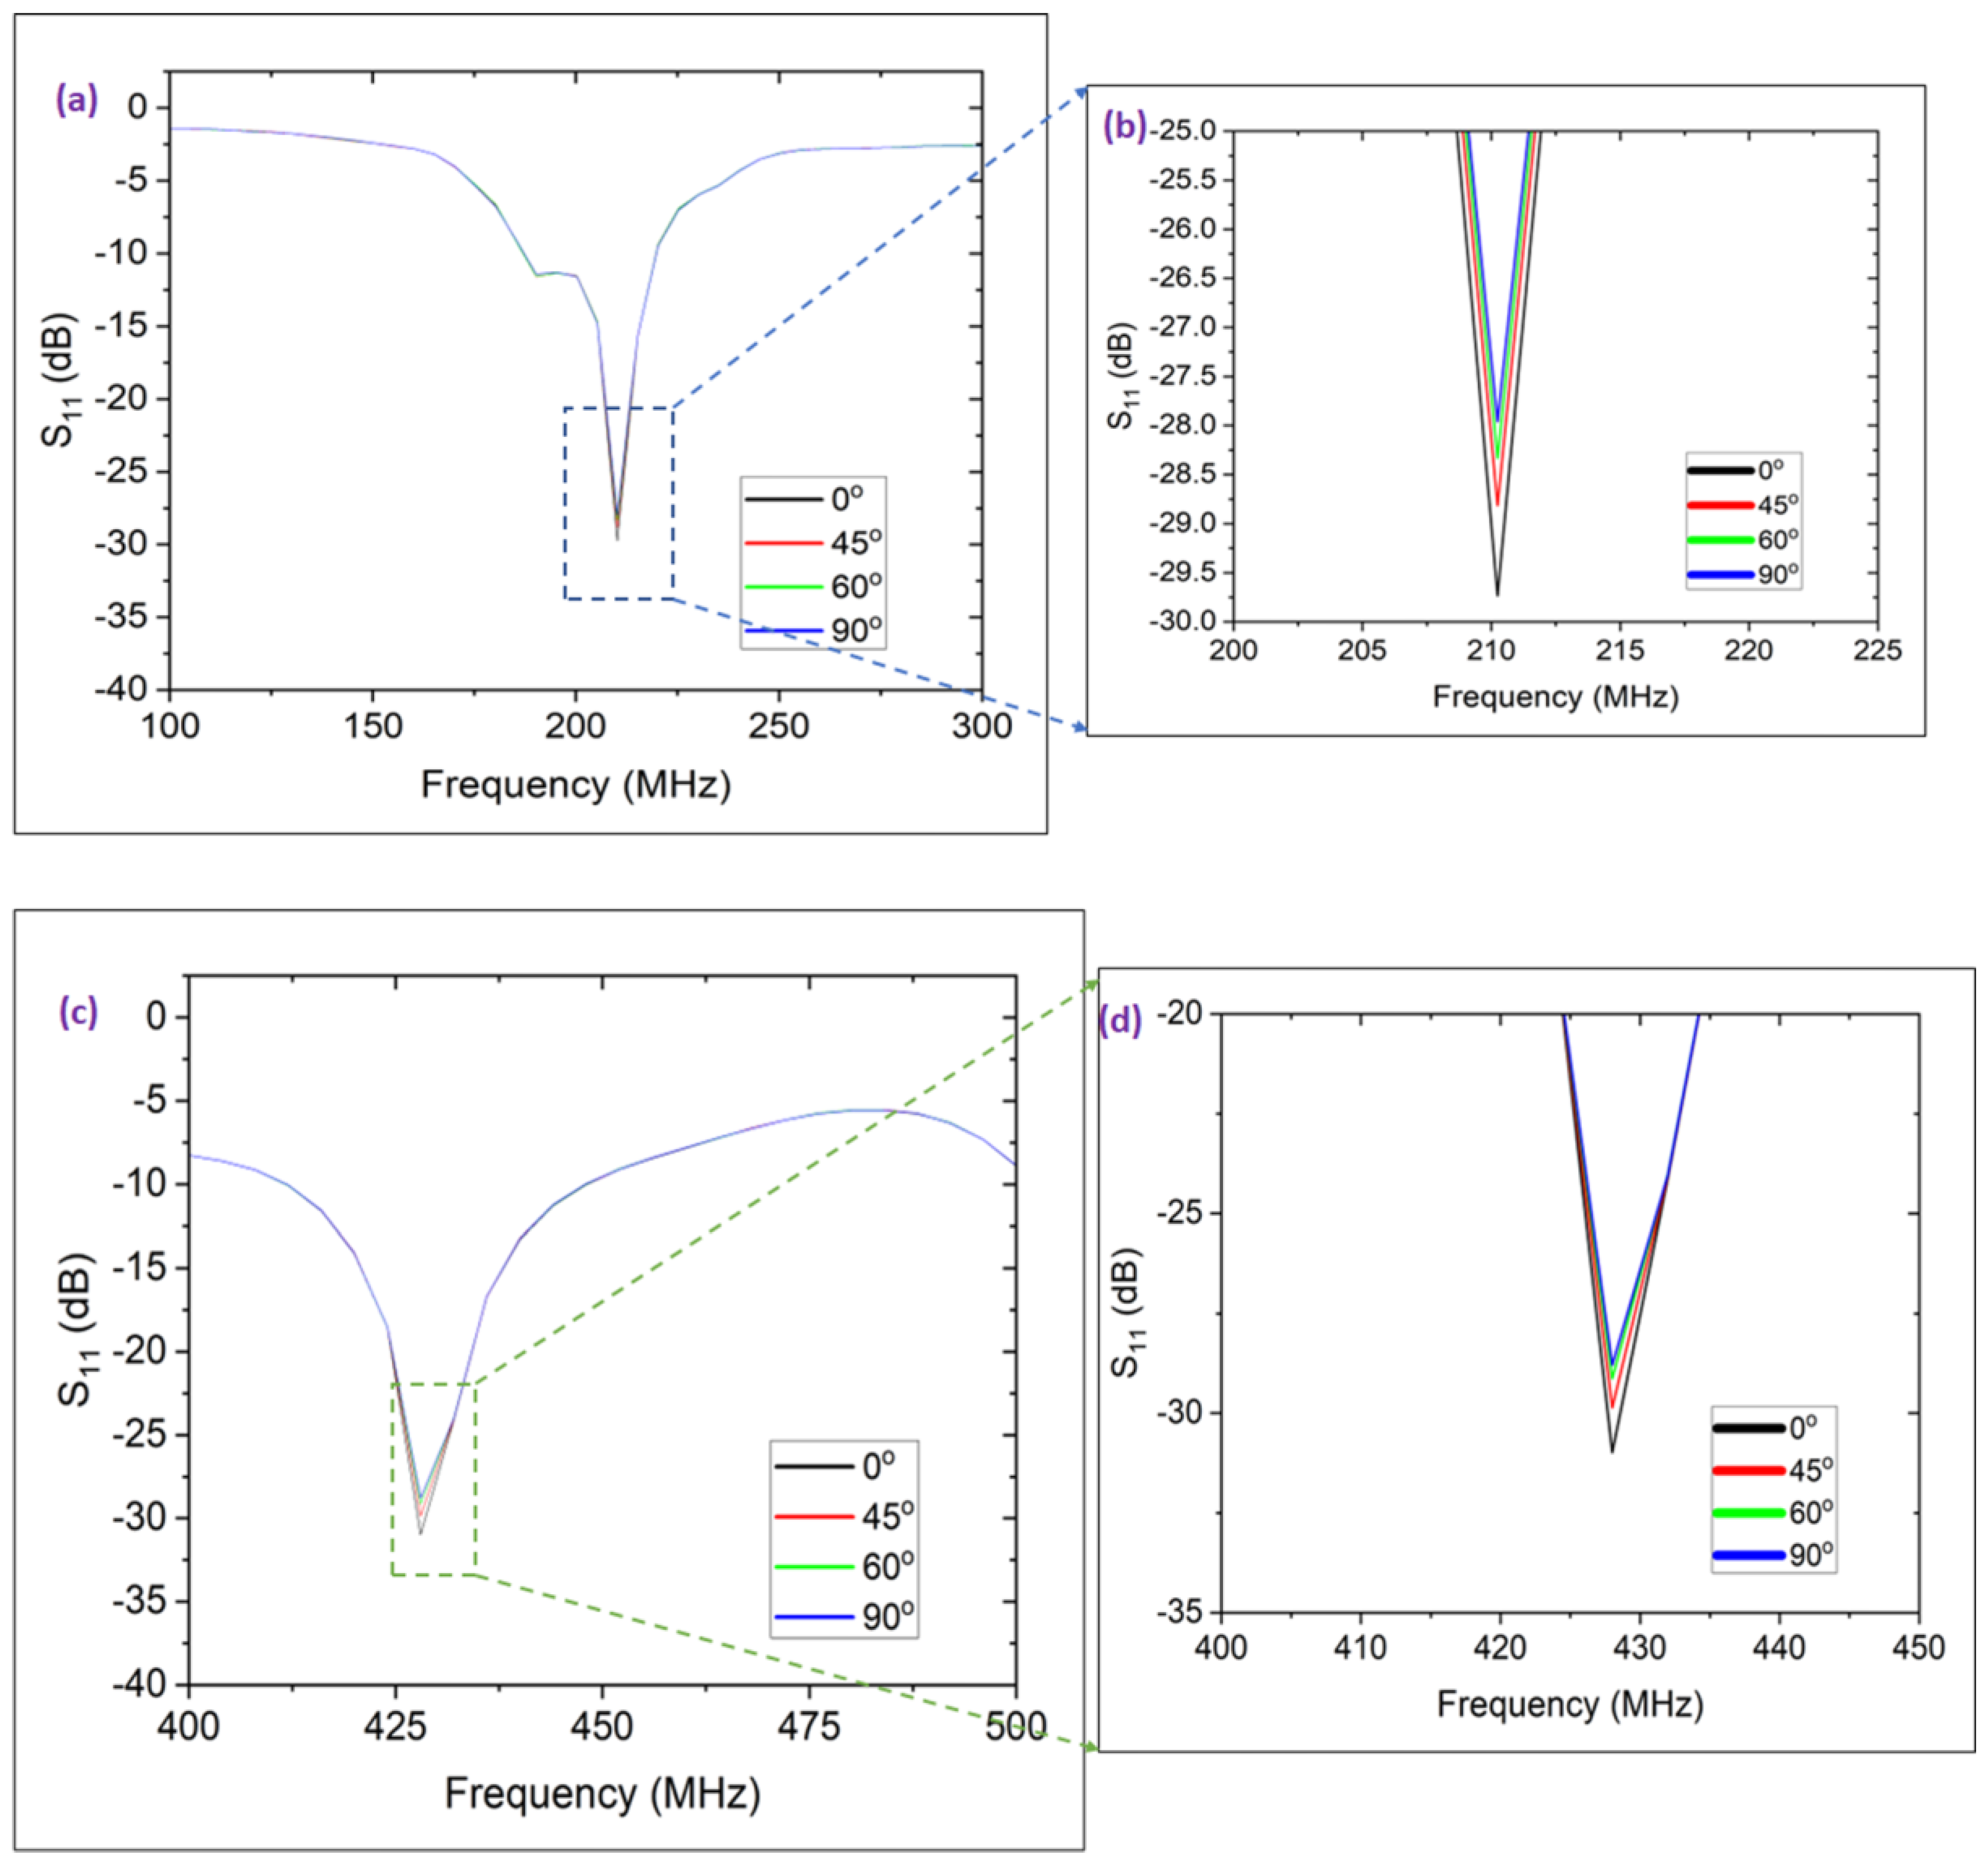
3.4. Wireless Sensing

Due to bending at different angles around a roller with a diameter of 43 mm, a change in capacitance and resistance was observed in the sensor. Input return loss (S11) with frequency for bending at different angles of the 40 wt. % G−PSU and 30 wt. % G−PVDF are shown in Figure 9. The resonant frequencies of the G−PSU and G−PVDF remain closely in the range ~212 MHz and ~429 MHz, respectively, while the signal amplitude of them gradually decreases due to the bending from 0° to 90°. The decrease in amplitude signifies the change in sensor resistance and the small peak shift was due to the change in sensor capacitance. As a result, the passive wireless RLC circuit enabled reliable signal detection capacitance.

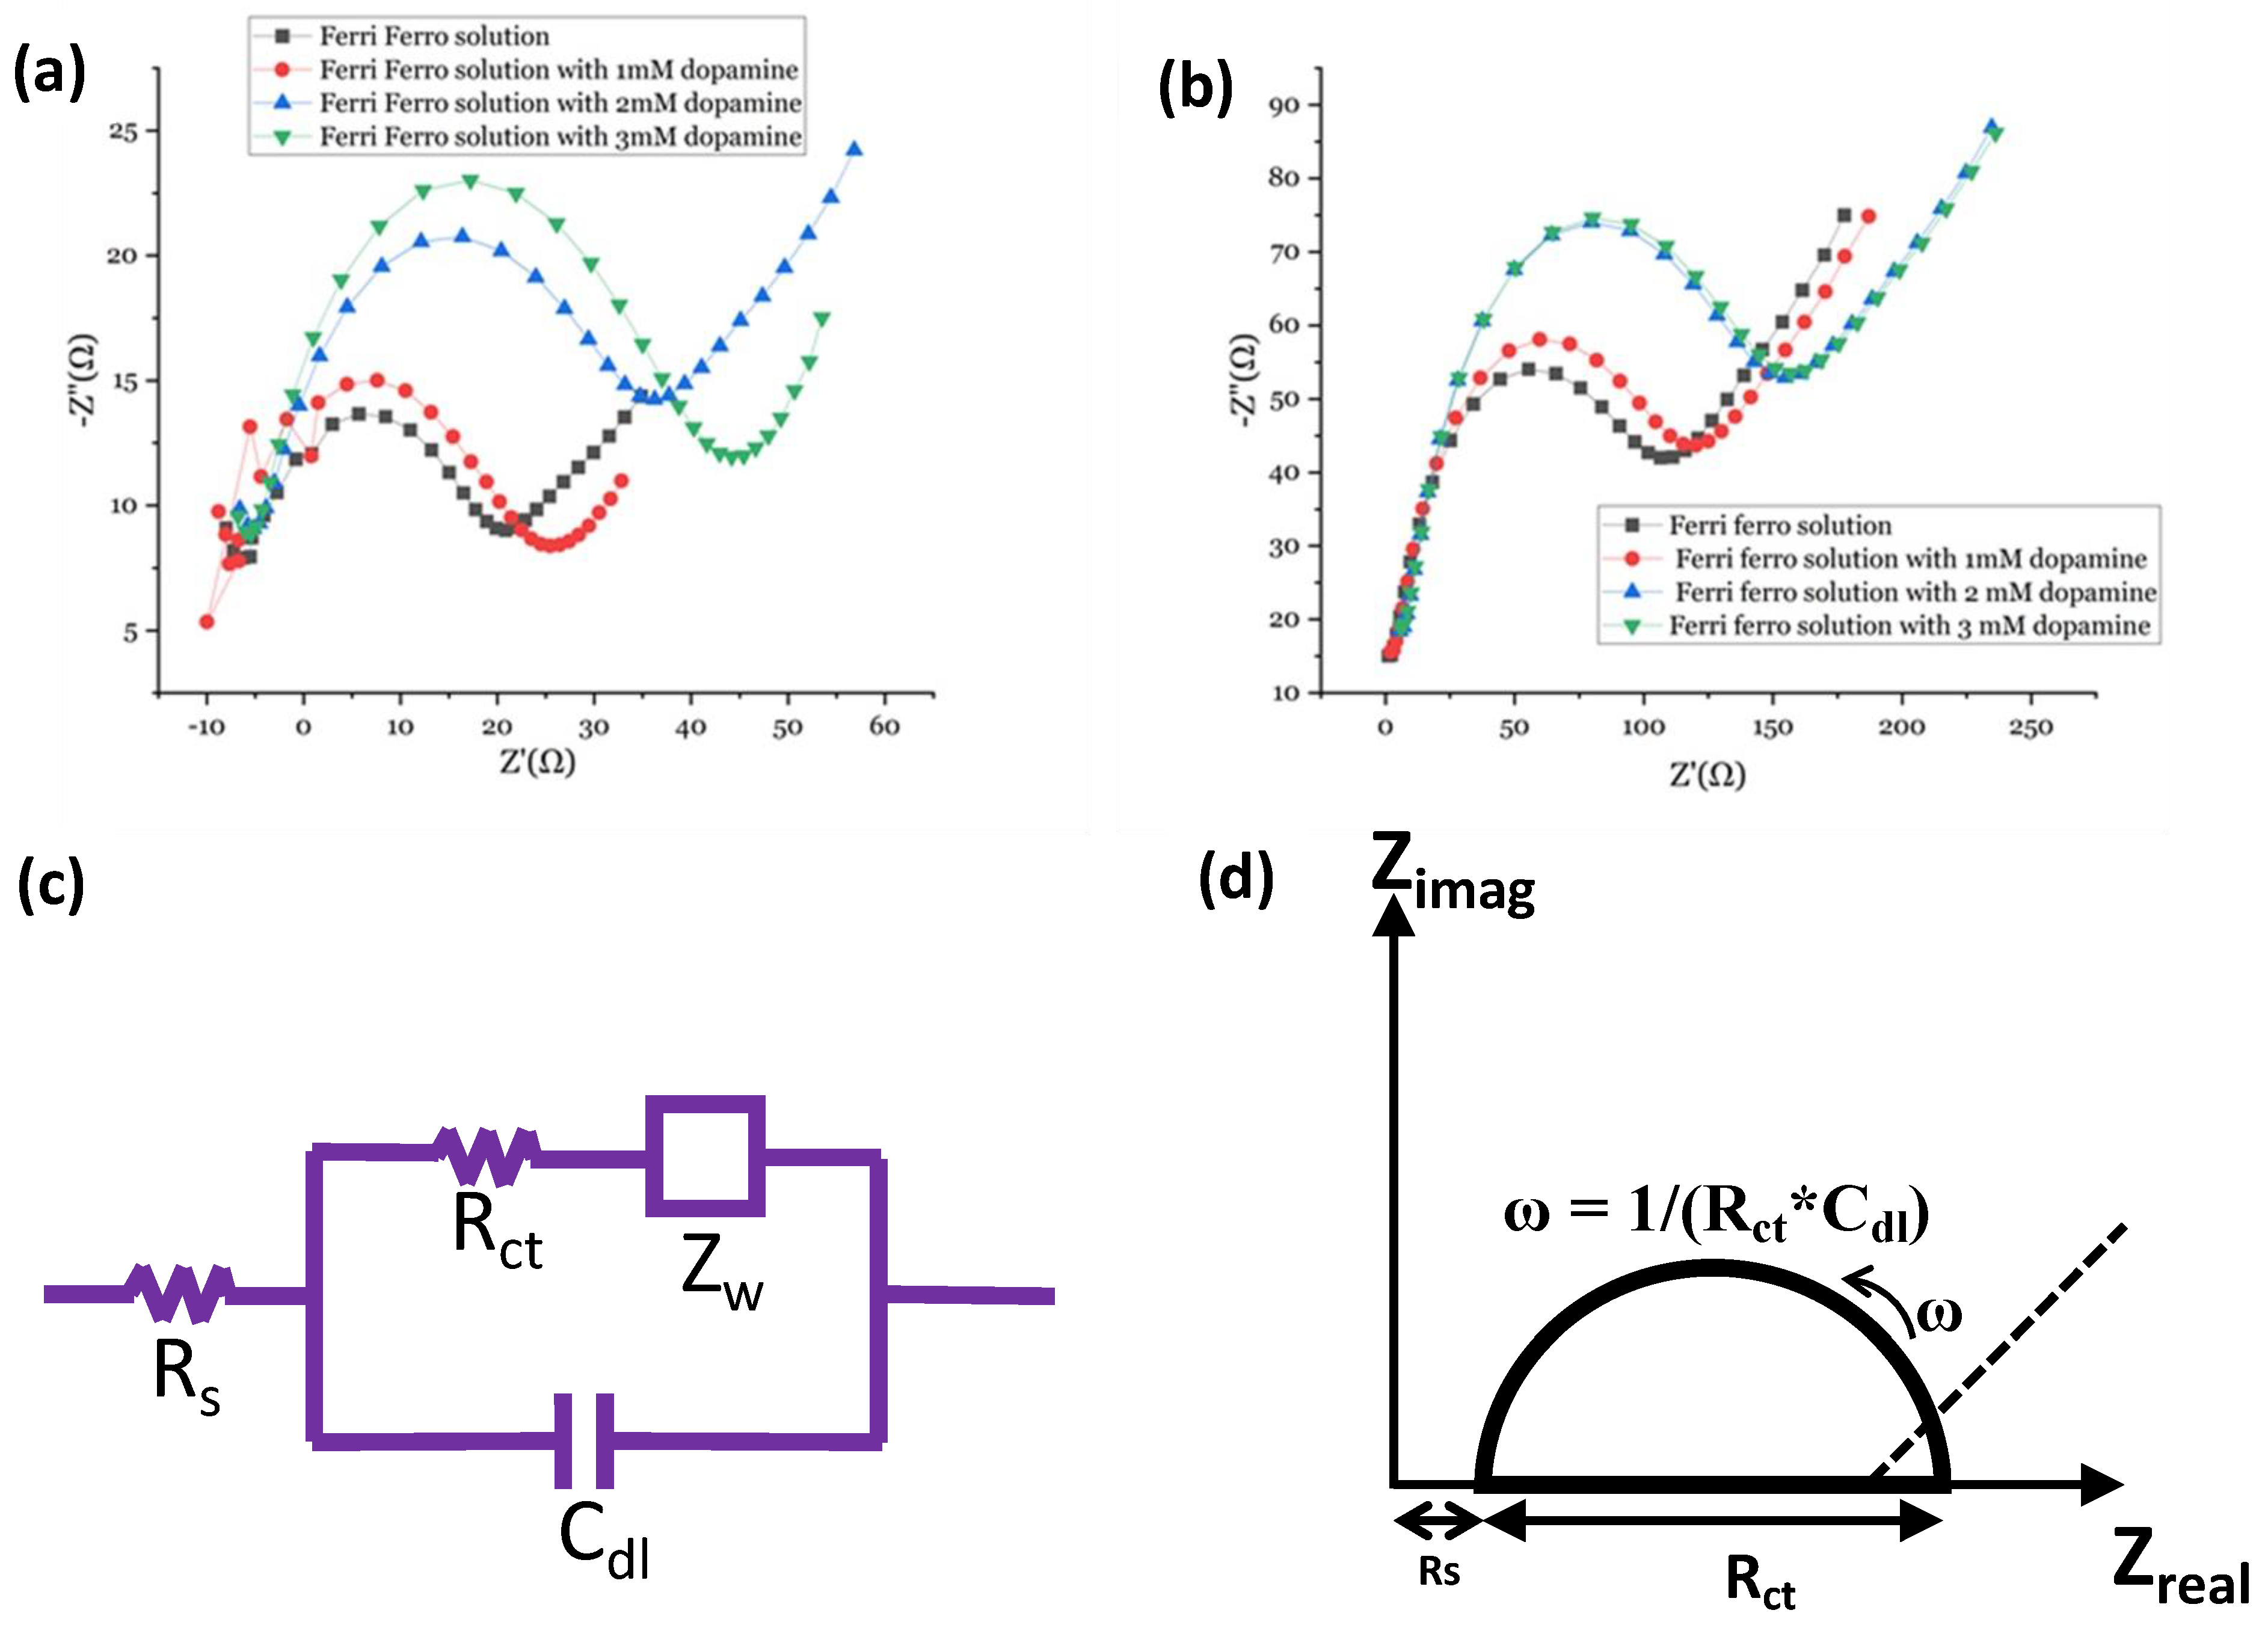
3.5. Electrochemical Sensing

The resulting Nyquist diagrams for G−PSU (40 wt. %) and G−PVDF (30 wt. %) (Figure 10a,b) show a semicircle for the electron transfer-restricted process at higher frequencies, followed by a straight line for the diffusion-limited electron transfer process at lower frequencies. The equivalent circuit is obtained by the best-fitting model (the Randles circuit and its representing Nyquist plot are shown in Figure 10c,d) to obtain the charge transfer resistance. It is evident that the semi-circular region’s width increases with rising dopamine levels due to polarization resistance. In the case of G−PSU, the electron charge transfer resistance for Fe2+/Fe3+ solution is 119 Ω, for 1 mM, 2 mM, and 3 mM dopamine concentrations and the electron charge transfer resistance is 40.8 Ω, 52 Ω and 55.1 Ω, respectively. In the case of G−PVDF, for Fe2+/Fe3+ redox couple, 1 mM, 2 mM, and 3 mM dopamine concentrations the electron charge transfer resistance is 55.8 Ω, 128 Ω, 158 Ω, and 164 Ω, respectively. The calculated limit of detection (LOD) is 3.671 mM and 4.515 mM for G−PSU and G−PVDF, respectively.

4. Conclusions

In conclusion, by in situ exfoliation of graphite into graphene within PSU and PVDF matrices, we were able to fabricate a multifunctional material especially suitable for strain, dopamine, wireless, and temperature sensing due to GNF enhancement of PSU and PVDF electrical and thermal properties. A G−PSU nanocomposite with 35–40 wt. % filler loading was able to detect strain in the elastic regime with a gauge factor of 27 and minimal hysteresis for 50 cycles. As a temperature sensor, G−PSU was able to detect the temperature in the range of 10–80 °C with a temperature coefficient of the resistance value of 0.0003 °C−1 and minimal hysteresis. Additionally, the G−PSU and G−PVDF nanocomposites were able to detect dopamine as an electrochemical sensor in the millimolar range. We believe that this research will open the door for commercially viable electrically and thermally conductive graphene thermoplastic nanocomposites with uniform nanofiller dispersion and distribution for application in different industries such as the automotive, medical, aerospace, robotics, consumer electronics, and telecommunications industries.

5. Patents

U.S. Patent Application Reference: Lynch-Branzoi, Jennifer K.; Ashraf, Ali. Conductive Polymer Nanocomposites Enhanced with In Situ Formation of 2D Nanoparticles for Structural Sensors and Smart Materials, US 2022/0112340, 14 April 2022.

Supplementary Materials

The following supporting information can be downloaded at: https://www.mdpi.com/article/10.3390/jcs7080309/s1, Figure S1: Schematic of a passive wireless sensor with a readout system; Figure S2: Experimental setup for electrochemical sensing of dopamine with G−PSU and G−PVDF; Figure S3: First heating curve; Figure S4: Experimental setup used for cyclic loading test; Table S1: Thermal property results for G−PVDF obtained using a DSC.

Author Contributions

Conceptualization, J.K.L.-B. and A.A.; methodology, J.K.L.-B. and A.A.; formal analysis, E.C., M.A.R. and D.G.; investigation, E.C., M.A.R. and D.G.; resources, J.K.L.-B., N.I. and A.A.; writing—original draft preparation, A.A., E.C., M.A.R. and D.G.; writing—review and editing, J.K.L.-B.; supervision, J.K.L.-B. and A.A. All authors have read and agreed to the published version of the manuscript.

Funding

Some of this research was funded by the National Science Foundation (NSF) under grant number ERI 2138574.

Data Availability Statement

The data that support the findings of this study are available from the corresponding author upon reasonable request.

Acknowledgments

The authors gratefully acknowledge the Materials Science and Engineering Department at Rutgers University for providing equipment and facilities for this research.

Conflicts of Interest

The authors declare no conflict of interest.

References

  1. Boland, C.S.; Khan, U.; Backes, C.; O’Neill, A.; McCauley, J.; Duane, S.; Shanker, R.; Liu, Y.; Jurewicz, I.; Dalton, A.B. Sensitive, high-strain, high-rate bodily motion sensors based on graphene–rubber composites. ACS Nano 2014, 8, 8819–8830. [Google Scholar] [CrossRef]
  2. Amjadi, M.; Kyung, K.U.; Park, I.; Sitti, M. Stretchable, skin-mountable, and wearable strain sensors and their potential applications: A review. Adv. Funct. Mater. 2016, 26, 1678–1698. [Google Scholar] [CrossRef]
  3. Balaji, R.; Sasikumar, M. Graphene based strain and damage prediction system for polymer composites. Compos. Part A Appl. Sci. Manuf. 2017, 103, 48–59. [Google Scholar] [CrossRef]
  4. Han, S.; Chand, A.; Araby, S.; Cai, R.; Chen, S.; Kang, H.; Cheng, R.; Meng, Q. Thermally and electrically conductive multifunctional sensor based on epoxy/graphene composite. Nanotechnology 2019, 31, 075702. [Google Scholar] [CrossRef] [PubMed]
  5. Jang, H.; Park, Y.J.; Chen, X.; Das, T.; Kim, M.S.; Ahn, J.H. Graphene-based flexible and stretchable electronics. Adv. Mater. 2016, 28, 4184–4202. [Google Scholar] [CrossRef]
  6. Papageorgiou, D.G.; Kinloch, I.A.; Young, R.J. Graphene/elastomer nanocomposites. Carbon 2015, 95, 460–484. [Google Scholar] [CrossRef]
  7. Sadasivuni, K.K.; Ponnamma, D.; Thomas, S.; Grohens, Y. Evolution from graphite to graphene elastomer composites. Prog. Polym. Sci. 2014, 39, 749–780. [Google Scholar] [CrossRef]
  8. Liu, F.; Wang, C.; Sui, X.; Riaz, M.A.; Xu, M.; Wei, L.; Chen, Y. Synthesis of graphene materials by electrochemical exfoliation: Recent progress and future potential. Carbon Energy 2019, 1, 173–199. [Google Scholar] [CrossRef] [Green Version]
  9. Khakpour, I.; Rabiei Baboukani, A.; Allagui, A.; Wang, C. Bipolar exfoliation and in situ deposition of high-quality graphene for supercapacitor application. ACS Appl. Energy Mater. 2019, 2, 4813–4820. [Google Scholar] [CrossRef]
  10. Nosker, T.J.; Lynch-Branzoi, J.K.; Hendrix, J.W.; Kear, B.H.; Chiu, G.; Tse, S. Covalent Conjugates of Graphene Nanoparticles and Polymer Chains and Composite Materials Formed Therefrom. US 11479652, 25 October 2022. [Google Scholar]
  11. Nosker, T.J.; Lynch-Branzoi, J.K.; Kear, B.H.; Hendrix, J.W.; Chiu, G. Graphene-reinforced polymer matrix composites. US 11225558, 18 January 2022. [Google Scholar]
  12. Nosker, T.J.; Lynch-Branzoi, J.K.; Kear, B.H.; Hendrix, J.W.; Chiu, G. In Situ Exfoliation Method to Fabricate a Graphene-Reinforced Polymer Matrix Composites. US 11174366, 16 November 2021. [Google Scholar]
  13. Nosker, T.; Lynch, J.; Hendrix, J.; Kear, B.; Chiu, G.; Tse, S. In Situ Exfoliation Method to Fabricate A Graphene-Reinforced Polymer Matrix Composite. US 11098175, 24 August 2021. [Google Scholar]
  14. Nosker, T.; Lynch, J.; Kear, B.; Hendrix, J.; Chiu, G. In Situ Exfoliation Method to Fabricate a Graphene-Reinforced Polymer Matrix Composite. US 10253154, 9 April 2019. [Google Scholar]
  15. Nosker, T.; Lynch, J.; Hendrix, J.; Kear, B.; Chiu, G.; Tse, S. In situ exfoliation method to fabricate a graphene-reinforced polymer matrix composite (G−PMC). US 9896565, 20 February 2018. [Google Scholar]
  16. Lynch-Branzoi, J.K.; Nosker, T.J.; Kear, B.H.; Chang, C.T. Use of Graphene-Polymer Composites to Improve Barrier Resistance of Polymers to Liquid and Gas Permeants. US 11479653, 25 October 2022. [Google Scholar]
  17. Lynch-Branzoi, J.K.; Ashraf, A.; Tewatia, A.; Taghon, M.; Wooding, J.; Hendrix, J.; Kear, B.H.; Nosker, T.J. Shear exfoliation of graphite into graphene nanoflakes directly within polyetheretherketone and a spectroscopic study of this high modulus, lightweight nanocomposite. Compos. Part B Eng. 2020, 188, 107842. [Google Scholar] [CrossRef]
  18. Ciobanu, M.; Marin, L.; Cozan, V.; Bruma, M. Aromatic polysulfones used in sensor applications. Rev. Adv. Mater. Sci. 2009, 22, 89–96. [Google Scholar]
  19. Ordóñez, S.S.; Fàbregas, E. New antibodies immobilization system into a graphite–polysulfone membrane for amperometric immunosensors. Biosens. Bioelectron. 2007, 22, 965–972. [Google Scholar] [CrossRef] [PubMed]
  20. Bautista-Quijano, J.; Avilés, F.; Aguilar, J.; Tapia, A. Strain sensing capabilities of a piezoresistive MWCNT-polysulfone film. Sens. Actuators A Phys. 2010, 159, 135–140. [Google Scholar] [CrossRef]
  21. Sánchez, S.; Pumera, M.; Cabruja, E.; Fàbregas, E. Carbon nanotube/polysulfone composite screen-printed electrochemical enzyme biosensors. Analyst 2007, 132, 142–147. [Google Scholar] [CrossRef] [PubMed]
  22. Sánchez, S.; Pumera, M.; Fàbregas, E.; Bartrolí, J.; Esplandiu, M.J. Carbon nanotube/polysulfone soft composites: Preparation, characterization and application for electrochemical sensing of biomarkers. Phys. Chem. Chem. Phys. 2009, 11, 7721–7728. [Google Scholar] [CrossRef]
  23. Cen-Puc, M.; Pool, G.; Oliva-Avilés, A.; May-Pat, A.; Avilés, F. Experimental investigation of the thermoresistive response of multiwall carbon nanotube/polysulfone composites under heating-cooling cycles. Compos. Sci. Technol. 2017, 151, 34–43. [Google Scholar] [CrossRef]
  24. He, F.; Fan, J.; Lau, S. Thermal, mechanical, and dielectric properties of graphite reinforced poly (vinylidene fluoride) composites. Polym. Test. 2008, 27, 964–970. [Google Scholar] [CrossRef]
  25. An, N.; Liu, S.; Fang, C.; Yu, R.; Zhou, X.; Cheng, Y. Preparation and properties of β-phase graphene oxide/PVDF composite films. J. Appl. Polym. Sci. 2015, 132, 41577. [Google Scholar] [CrossRef]
  26. Boutry, C.M.; Chandrahalim, H.; Streit, P.; Schinhammer, M.; Hänzi, A.C.; Hierold, C. Characterization of miniaturized RLC resonators made of biodegradable materials for wireless implant applications. Sens. Actuators A Phys. 2013, 189, 344–355. [Google Scholar] [CrossRef]
  27. Kananian, S.; Alexopoulos, G.; Poon, A.S. Robust Wireless Interrogation of Fully-Passive RLC Sensors. IEEE Trans. Circuits Syst. I Regul. Pap. 2022, 69, 1427–1440. [Google Scholar] [CrossRef]
  28. Li, Y.; Shimizu, H. Toward a stretchable, elastic, and electrically conductive nanocomposite: Morphology and properties of poly [styrene-b-(ethylene-co-butylene)-b-styrene]/multiwalled carbon nanotube composites fabricated by high-shear processing. Macromolecules 2009, 42, 2587–2593. [Google Scholar] [CrossRef]
  29. Rath, T.; Li, Y. Nanocomposites based on polystyrene-b-poly (ethylene-r-butylene)-b-polystyrene and exfoliated graphite nanoplates: Effect of nanoplatelet loading on morphology and mechanical properties. Compos. Part A Appl. Sci. Manuf. 2011, 42, 1995–2002. [Google Scholar] [CrossRef]
  30. Rahman, M.A.; Rahman, M.M.; Ashraf, A. Automatic dispersion, defect, curing, and thermal characteristics determination of polymer composites using micro-scale infrared thermography and machine learning algorithm. Sci. Rep. 2023, 13, 2787. [Google Scholar] [CrossRef]
  31. Ashraf, A.; Jani, N.; Farmer, F.; Lynch-Branzoi, J.K. Non-destructive investigation of dispersion, bonding, and thermal properties of emerging polymer nanocomposites using close-up lens assisted infrared thermography. MRS Adv. 2020, 5, 735–742. [Google Scholar] [CrossRef]
  32. Backes, C.; Paton, K.R.; Hanlon, D.; Yuan, S.; Katsnelson, M.I.; Houston, J.; Smith, R.J.; McCloskey, D.; Donegan, J.F.; Coleman, J.N. Spectroscopic metrics allow in situ measurement of mean size and thickness of liquid-exfoliated few-layer graphene nanosheets. Nanoscale 2016, 8, 4311–4323. [Google Scholar] [CrossRef] [Green Version]
  33. Nayak, L.; Rahaman, M.; Khastgir, D.; Chaki, T. Thermal and electrical properties of carbon nanotubes based polysulfone nanocomposites. Polym. Bull. 2011, 67, 1029–1044. [Google Scholar] [CrossRef]
  34. Wang, Y.; Wang, L.; Yang, T.; Li, X.; Zang, X.; Zhu, M.; Wang, K.; Wu, D.; Zhu, H. Wearable and highly sensitive graphene strain sensors for human motion monitoring. Adv. Funct. Mater. 2014, 24, 4666–4670. [Google Scholar] [CrossRef]
  35. Moriche, R.; Sánchez, M.; Prolongo, S.G.; Jiménez-Suárez, A.; Ureña, A. Reversible phenomena and failure localization in self-monitoring GNP/epoxy nanocomposites. Compos. Struct. 2016, 136, 101–105. [Google Scholar] [CrossRef]
  36. Acquarelli, C.; Paliotta, L.; Tamburrano, A.; De Bellis, G.; Sarto, M.S. Electro-mechanical properties of multilayer graphene-based polymeric composite obtained through a capillary rise method. Sensors 2016, 16, 1780. [Google Scholar] [CrossRef] [Green Version]
Figure 1. Schematic diagram representing multifunctional G−PMC sensor. (a) Strain sensor, (b) temperature sensor, (c) electrochemical sensing, and (d) shear exfoliation process.
Jcs 07 00309 g001
Figure 2. SEM images of (a,b) 40 wt. % G−PSU and (c,d) 30G−PVDF at different magnifications.
Jcs 07 00309 g002
Figure 3. (a) Raman spectrum of 40 wt. % G−PSU and (b) TGA of 35 wt. % G−PSU.
Jcs 07 00309 g003
Figure 4. Mechanical property results. (a) Flexural stress–strain curve for G−PSU, (b) flexural modulus for G−PSU, (c) tensile stress–strain curves for G−PVDF, and (d) tensile modulus for G−PVDF.
Jcs 07 00309 g004
Figure 5. (a) Manual cyclic loading of 40 wt. % G−PSU sample undergoing 50 cycles of 10 N and then 20 N loads during the same test. Due to manual loading, the time between each cycle was not controlled. (b) Cyclic loading of G−PVDF for 35 loading/unloading cycles of 20 N load.
Jcs 07 00309 g005
Figure 6. Thermal sensor heating test of G−PSU. (a) Plots showing a change in temperature with time during heating and recovery in the bottom and corresponding electrical resistance change on top, and (b) corresponding thermal images captured during the test.
Jcs 07 00309 g006
Figure 7. Thermal sensor cooling tests of G−PSU. (a) Plots showing a change in temperature with time during cooling and recovery in the bottom and corresponding electrical resistance change on top, and (b) corresponding thermal images captured during the test.
Jcs 07 00309 g007
Figure 8. Hysteresis of G−PSU sensor during (a) heating and (b) cooling. Arrows indicate progression of data collection during application of thermal input (heating/cooling) and after removal of the input, during which the sample returns back to its initial thermal state.
Jcs 07 00309 g008
Figure 9. Frequency response curve sensor due to bending at different angles for (a) G−PSU, (b) enlarged view of (a), (c) G−PVDF, and (d) enlarged view of (c).
Jcs 07 00309 g009
Figure 10. Electrical impedance spectroscopy analysis for different dopamine concentrations; (a) G−PSU, (b) G−PVDF, (c) Randles equivalent circuit, and (d) the representing equivalent Nyquist plot.
Jcs 07 00309 g010
Table 1. Batch mixer processing RPM and corresponding shear rates for each starting graphite concentration in PVDF.
% Graphite in PVDFRPMShear Rate (1/s)
01501202
5120962
10120962
202001602
3015120
Disclaimer/Publisher’s Note: The statements, opinions and data contained in all publications are solely those of the individual author(s) and contributor(s) and not of MDPI and/or the editor(s). MDPI and/or the editor(s) disclaim responsibility for any injury to people or property resulting from any ideas, methods, instructions or products referred to in the content.

