Article

A New Image Analysis Assisted Semi-Automatic Geometrical Measurement of Fibers in Thermoplastic Composites: A Case Study on Giant Reed Fibers

1
Departamento de Ingeniería Mecánica, Universidad de Las Palmas de Gran Canaria, 35017 Las Palmas de Gran Canaria, Spain
2
Polymer Processing Research Centre, School of Mechanical and Aerospace Engineering, Queen’s University of Belfast, Belfast BT9 5AH, UK
3
School of Mechanical and Aerospace Engineering, Queen’s University Belfast, Stranmillis Road, Belfast BT9 5AH, UK
4
Departamento de Ingeniería de Procesos, Universidad de Las Palmas de Gran Canaria, 35017 Las Palmas de Gran Canaria, Spain
*
Authors to whom correspondence should be addressed.
J. Compos. Sci. 2023, 7(8), 326; https://doi.org/10.3390/jcs7080326
Submission received: 30 June 2023 / Revised: 2 August 2023 / Accepted: 7 August 2023 / Published: 9 August 2023
(This article belongs to the Section Fiber Composites)

Abstract

:
This work describes a systematic method for the analysis of the attrition and residual morphology of natural fibers during the compounding process by twin-screw extrusion. There are several methods for the assessment of fiber lengths and morphology, although they are usually based on the use of non-affordable apparatus or time-consuming methods. In this research, the variation of morphological features such as the length, diameter and aspect ratio of natural fibers were analyzed by affordable optical scanning methods and open-source software. This article presents the different steps to perform image acquisition, refining and measurement in an automated way, achieving statistically representative results, with thousands of fibers analyzed per scanned sample. The use of this technique for the measurement of giant reed fibers in polyethylene (PE) and polylactide (PLA)-based composite materials has proved that there are no significant differences in the output fiber morphology of the compound, regardless of the fiber feed sizes, extruder scale, or the polymer used as matrix. The ratio of fiber introduced for the production of composites also did not significantly affect the final fiber size. The greatest reduction in size was obtained in the first kneading zone during compounding. Pelletizing or injection molding did not significantly modify the fiber size distribution.

1. Introduction

When natural fibers are used to produce biocomposites, they can be present in different formats, such as: particles, short or long fibers, continuous or discontinuous, aligned (uni-, bi- or multi-directionally) or randomly distributed, as well as forming woven fabrics or non-woven mats [1]. The morphology, orientation and distribution of the fibers are key issues that determine the processability and performance of the composites. The processability of composites based on short fibers and particles is usually easier and cheaper, while composites based on long fibers and fabrics are often more challenging to process, although they can also achieve better mechanical performance [2]. Therefore, fiber morphology, as well as distribution and integration within the matrix, has a decisive influence on the processability, mechanical properties, tribological behavior and general performance of the composites [3,4,5].
Compounding extrusion is a common process for the preparation of thermoplastic-based composites with random-oriented chopped fiber reinforcement and particles. This is a pre-process for the preparation of materials for ulterior processing (injection, compression or rotational molding). During the compounding process, one or more polymers are intimately blended with additives and fillers, such as short fibers, by using twin-screw extruders. Some of the key properties in the performance of extruded fiber compounds, in addition to the inherent fiber strength and the quality of the bonding interface within the matrix, are the length, diameter and aspect ratio of the fibers [4]. Fiber lengths in extruded thermoplastic compounds are usually in the order of a few millimeters, becoming even less than 1 mm after injection molding processes [6]. In terms of diameters, most lignocellulosic fibers for biocomposite production have diameters lower than a few hundred microns [7], dimensions which are reduced by attrition of the bundles during processing [5].
The physical degradation of lignocellulosic fibers during the compounding process is affected by parameters such as the feed and shear rate, as well as the rotation speed and geometric configuration of the screws [8]. The residual fiber morphology (length, diameter and aspect ratio) in molded parts is affected by several factors during compounding process, from the polymer matrix selection and the type of filler—which affect the processing temperature, viscosity and shear rate of the compound—to the fiber content or the screw profile, among others. Along the entire process, the fibers are subjected to severe stresses, which cause the breakage of fibers [4,5]; these stresses are due to hydrodynamic effects, fiber-fiber interactions and fiber-equipment interaction [9].
This work describes a systematic method for the analysis of the residual morphology of short fibers during and after compounding processes (molding stage). A wide variety of measurement approaches have been documented in the literature for the dimensional analysis of fibers in composite processing, but no standard has been accepted [10]. The methods found in bibliography range from time-consuming manual techniques [11], where fiber detection is done manually by clicking on the endpoints of the fibers; to fully automated systems, usually not affordable in terms of economic costs, incorporating automation in sample preparation and object detection, as well as analysis tools based on artificial intelligence (AI) and deep learning algorithms [12]. According to some authors, there are no “absolute” length values from one system to another, and a 20% variance is typically accepted as valid [12].
Most methods are based on the removal of the polymer matrix (destructive methods) and consist of four main steps:
  • Separation of the fibers from the matrix by pyrolysis [9] or chemical dilution [8,13]
  • Dispersion of the fibers on a surface (2D) or in a liquid or gaseous medium (3D) [14]
  • Image acquisition by microscopy, laser diffraction or high-resolution scanning [14]
  • Fiber detection: manually [15] or with the support of automated systems [10]
Non-destructive methods are mainly based on micro-CT [16] and advanced automated software for fiber identification, such as MorFi [12,17] or Ellix [18]. However, this method remains challenging [10,19] due to the variation in fiber widths and their intersections [15,20].
As an alternative to the rough hand-measuring methods and expensive automated equipment, this article presents a new approach based on affordable optical scanning methods (as also proposed in other works [21,22]), and the open-source software ImageJ2 [23]. This measurement method provides a statistically significant number of measurements at each sampling (thousands of data points per sample) and has been tested for the study of giant reed (Arundo donax L.) fibers during processing. From raw materials (fibers of two different lengths) to injection-molded samples (using two different extruders for compounding preparation), the method also assesses the variations found during the compounding stage throughout the twin-screw extruders. Some authors indicate that the viscosity of the polymer melt can affect the fiber’s attrition [5], and so two different matrices (PLA and HDPE), and four different fiber loadings (from 5 to 40%), have been analyzed. The proposed method combines elements from other techniques and aims to minimize the manual input to achieve highly reproducible measurements in a cost-effective way, in contrast with other research, which focus on expensive equipment, time consuming methods or measurement of a low number of objects, usually not exceeding 300 values [9,24,25].

2. Materials and Methods

Fibers from a giant reed were extracted from Arundo donax L. culms, as described elsewhere [26], and cut to nominally 1.5 and 3 mm average length, to assess the influence of fiber length in the feeding.
Two different polymer matrices were used in the research: high density polyethylene (HDPE, grade HD6081, from Total (Feluy, Belgium)) and polylactide (PLA, grade Luminy L105, from Corbion Polymers (Gorinchem, The Netherlands)). HDPE has a melt flow index (MFI) of 8 g/10 min (190 °C/2.16 kg) and a density of 960 kg/m3, while PLA has an MFI of 30 g/10 min (190 °C/2.16 kg) and a density of 1240 kg/m3, according to the manufacturers’ datasheets. These two matrices were selected to determine if their different properties influenced the fiber performance during the different steps of processing.
The compounding was prepared using two different extruders, to assess the effect of two similar configurations of the screw—although at different barrel size and L/D ratio—in the fibers’ shortening (ThermoScientific Process11 (Karlsruhe, Germany) and Collin ZK25 (Maitenbeth, Germany), with the screw configurations shown in Table 1). In addition, samples from various locations throughout the first extruder were taken to analyze the evolution of fiber morphology and dimensions along the compounding process (Figure 1).
Finally, the influence of the ratio of fiber used was also determined, by preparing compounds at 5, 10, 20 and 40% fiber loadings (in weight). The compound was injection molded in an Arburg 320S injection molding machine. The following temperature profile, from back to nozzle, was used: 175-180-185-185-190 °C, for HDPE; for PLA, the temperature profile was 190-195-200-205-210 °C, keeping a back pressure of 100 bar, a flow rate of 70 cm3/s and a holding pressure of 250 bar. The mold temperature was kept at 30 °C in both cases.
The procedure for the measurement of the fibers is summarized in the following steps, detailed in Section 2.1 below:
  • Sample preparation
  • Image acquisition
  • Pre-processing and segmentation
  • Object detection and measurement
  • Statistical analysis

2.1. Description of the Developed Methodology

2.1.1. Sample Preparation

After the preparation of the compound, thin films of approximately 200 microns thick were prepared by compressing the samples (approximately 1 g) in a hot press at 200 °C in between anti-adherent foils. The film specimen was obtained from pellets, extruded filaments and injection-molded parts fragments, depending on the processing step under study. In order to spread the fibers and obtain more accurate readings, the prepared films are folded together with a neat polymer film, melted and pressed again, in that way dispersing the fibers (Figure 2). A specimen prepared in this way is big enough to be statistically significant, as it contains several thousand fibers [22]. Compression of the composite materials is conducted by gradually applying pressure (increasing the pressure by 5 bar every 10 s up to 30 bar, obtaining a sample film thickness of about 200 microns) once the matrix is completely melted, to avoid or reduce the shear effects that can influence the shortening or separation of the fibers. Rheological and thermal analysis of the materials were considered to set temperature processing.

2.1.2. Image Acquisition

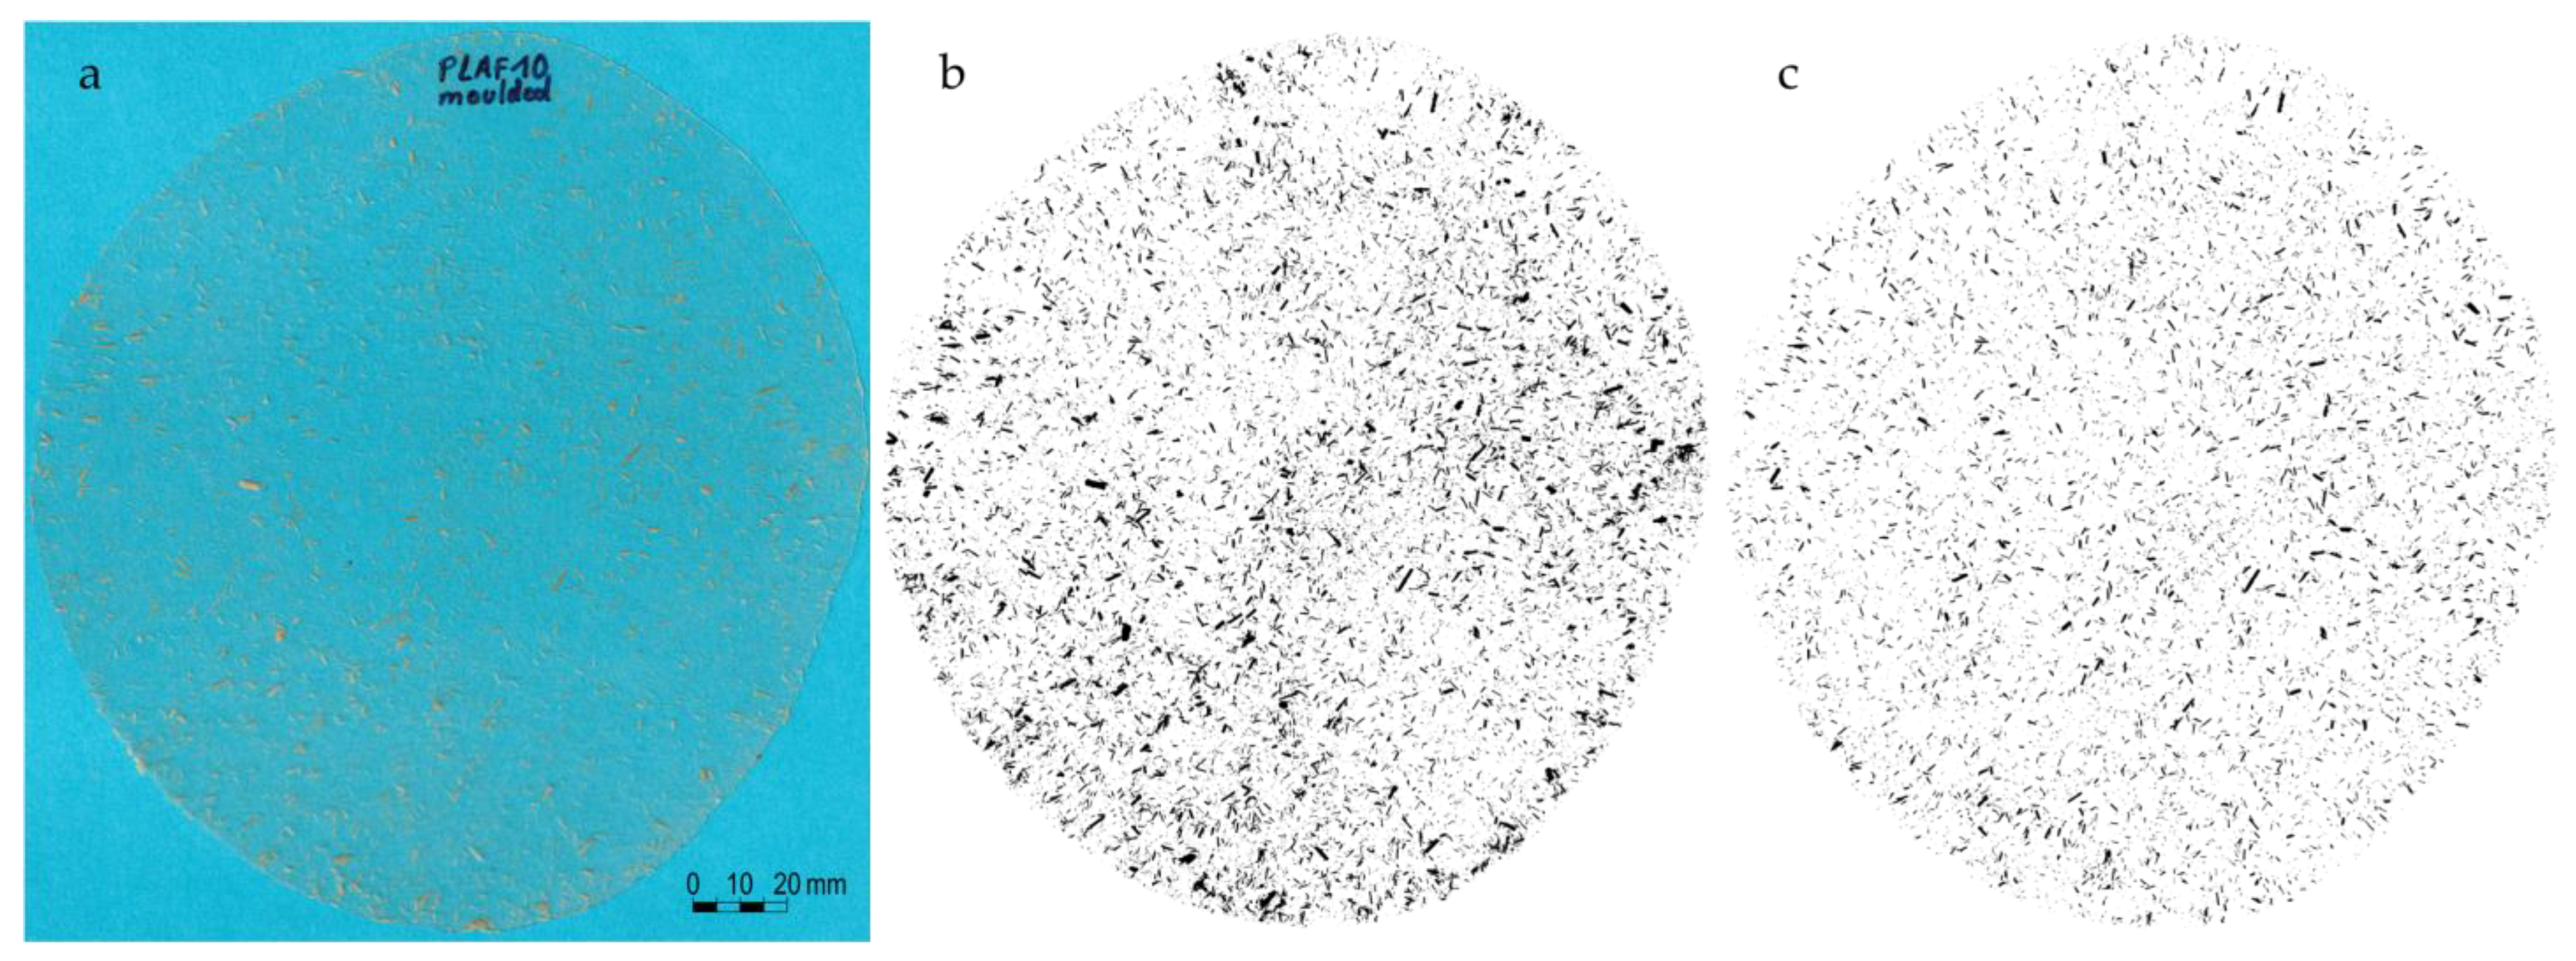
An image with thousands of fibers is captured using a flatbed document scanner (Canon CanoScan LiDE 400 (Tokyo, Japan)) at a high-resolution of 4800 dpi (dots per inch) [27]. This optical resolution corresponds to 5.29 microns per pixel, which is 2 to 10 times smaller than the diameter of commonly used natural fibers such as cotton, flax or hemp; that is, approximately less than half the fibers’ diameter. A blue piece of paper was used as a background to enhance the contrast with the fibers (yellowish) and facilitate identification (Figure 3a).

2.1.3. Pre-Processing and Segmentation

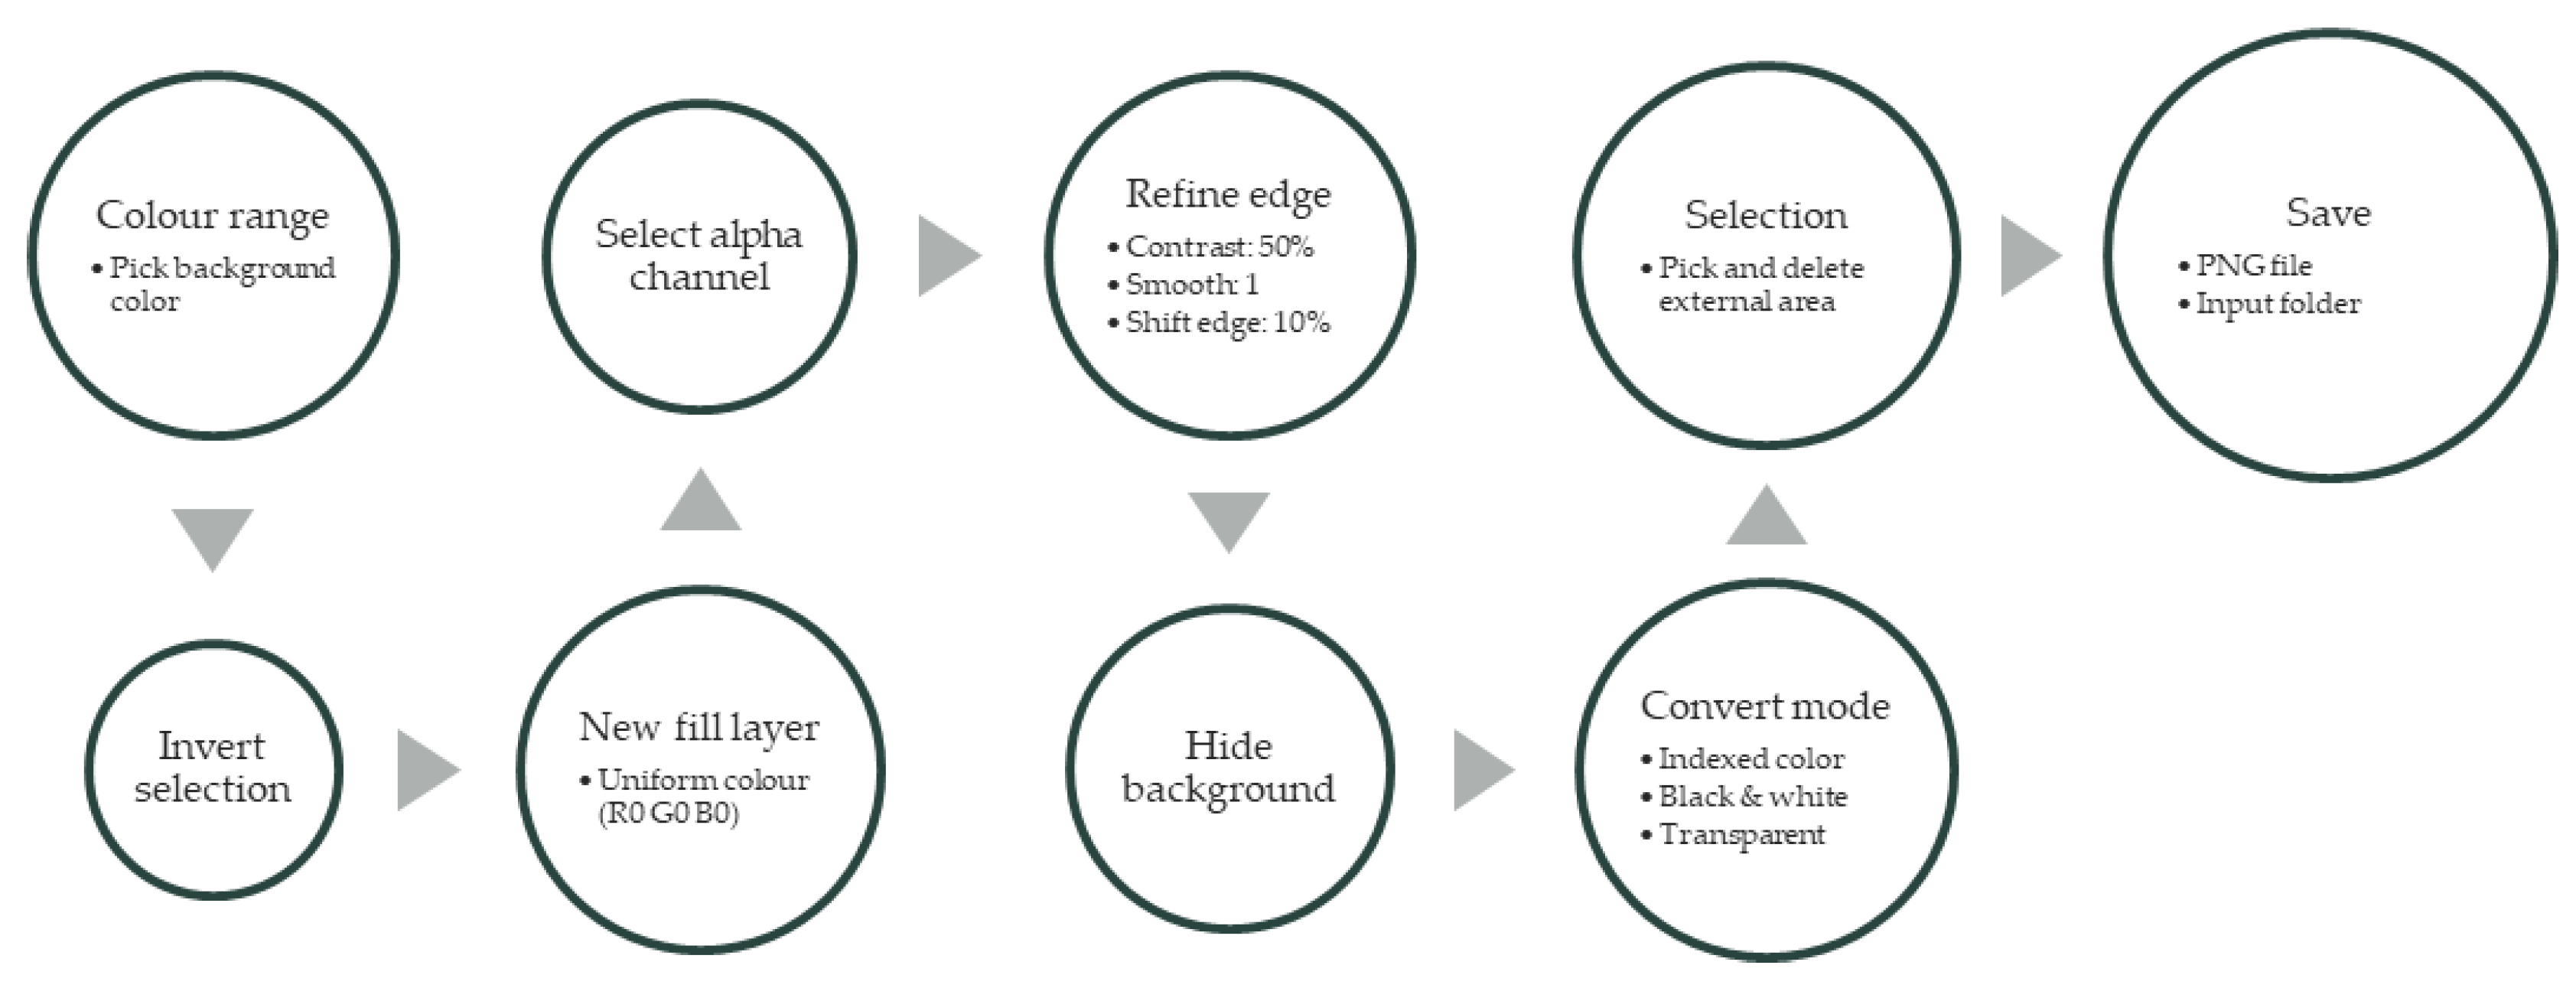
The objective of this stage is to convert the scanned color bitmap image into a binary (black and white) image. This consists of dividing the digital image into several segments where the objects of interest, namely the fibers, are separated from the background by a process of thresholding or binarization (Figure 3b). This task is performed using the photo-editing software Adobe Photoshop 24.7. For this purpose, an action script has been recorded with the necessary instructions to automate the processing (Figure 4). The binarization process is conducted through a selection based on the color range, the creation of a uniform color fill layer, the refinement of the mask edges and the conversion of the image to indexed color mode. Before running the binary segmentation, a selection is made on the working area of the image to avoid any possible shadows captured during the scanning process along the edge of the sample.
Adobe Photoshop is used not only for its potential and versatility in image editing, but also for its ability to manage massive files. In this way, the original file (.JPG), with a size of about 200 or 300 MB, is transformed into a black and white picture with a reduced size of only 1 or 2 MB, which is much faster and easier to process in ImageJ (analysis program). Alternatively, it would be possible to run the proposed method using exclusively open-source software if smaller images are processed, consequently with a lower number of fibers per sample. In that case the segmentation could be done directly by the ImageJ program used for the dimensional analysis, but several samples should be processed to reach a statistically significant data set.
Although the steps included in the action script for masking and selection can be adjusted and customized for each image, when working with batches of samples with the same background color and the same thermoplastic matrix, it is not necessary to modify these settings for each image, as the process is fully automated by executing the pre-programmed script.

2.1.4. Object Detection and Measurement

After image segmentation, ImageJ (FIJI) is used for morphological analysis and fiber measurement. ImageJ (Bethesda, Maryland, WA, USA) [23] is a Java-based image-processing program widely used in several areas of scientific research.
A procedure has been developed for fully-automatic fiber recognition based on some shape filtering criteria (Figure 5). After filtering, the selected objects are added to the ROI manager to later obtain a table with measurement results. Every binary object found in the picture is morphologically analyzed in terms of its feret diameters (maximum and minimum), aspect ratio, convexity and solidity [28]. The maximum feret diameter (L) determines the length of the fiber, while the minimum feret diameter (D) determines the thickness of the fiber. Aspect ratio is calculated as the length divided by the thickness. Other methods, based on “geodesic diameter” and “geodesic radius”, were also evaluated for fiber length and diameter calculations [10], but these were rejected as the dimensions were often overestimated.
The aim of the shape filtering is to identify individual fibers by avoiding or rejecting objects found on the binary image, such as bubbles, clusters, intersecting fibers and fine particles. By convention, particles with a length smaller than 200 μm are considered as ‘fine’ elements and not fibers [29]. After this step, a new picture of isolated fibers with no or little curvature is obtained (Figure 3c).
The admissible ranges for all morphological parameters are set in the “Shape filter” plugin for individual fiber recognition. Similar to the segmentation stage, all instructions are recorded in an ImageJ macro for automatic image processing. In this way, the file with the binary image (after segmentation) is read from an input folder and the filtered image is saved into an output folder (Figure S1). The measurement data results are saved in a CSV file for further analysis.
The adjustment of the morphological filtering parameters is performed by an iterative process and direct visualization of the results until the desired screening threshold is reached; that is, eliminating possible bubbles, clusters or intersecting fibers and fine particles. This is done by overlaying the filtered binary images on the scanned bitmap image, varying the selection ranges at each step until an image containing only individualized fibers is obtained. Although this task is initially tedious in the definition of the methodology, once the filter ranges are delimited, these settings can be applied for all fiber-reinforced composites of similar characteristics. However, it is also possible to vary the values of the ranges if, for example, the diameters or lengths of the analyzed fibers are larger or smaller.

2.1.5. Statistical Analysis

The statistical analysis is done using Jamovi 2.3.26, a free and open-source statistical platform. Measurement data are analyzed to obtain average and deviation values, as well as frequency distribution (tables and graphs) of the length, diameter and aspect ratio of the fibers at each stage of processing. The capability of importing a large amount of data into the statistical analysis software is useful to compare variations from one stage to another; i.e., from fed fibers to extruded compound, granulation or injection molding.

3. Results and Discussion

This section shows the results obtained from the above-described methodology for the case study selected; that is, the processing of giant reed fibers with two different matrices, in two different kinds of processing equipment, with two different starting fiber lengths and in different weight loadings.

3.1. Fibers Shortening along the Extruder

Samples at different zones of the Process 11 extruder, from hopper to die, were collected during the compounding process. The compounded material was taken out by opening the barrel of the twin-extruder after reaching a stable production rate.
After sample film preparation by platen press and measurement of the fibers according to the described method, it was found that:
  • The greatest reduction in fiber length and diameter occurs from the first zone of the extrusion process, where more than 85% of the fibers for HDPE and 90% for the PLA compound become shortened to less than 1 mm in length (Figure 6).
  • There is not much variation along the rest of the screw, either in length or diameter.
  • The processing leads to a narrower size distribution, that is, despite the most important reduction in length occurring in zone 1, fibers continue suffering further attrition, obtaining at the end of the process a composite with similar fiber length to those from zone one, but with lower variability. This effect was also observed by Hubbe and Grigsby [4].
At this point it is worth noting that although mean values and variance are widely used in the literature for the morphological characterization of fibers, as they allow a quick nominal size classification, they can be influenced and biased by a non-symmetrical distribution of the data [18]. For a more accurate analysis, distribution charts allow the reduction of the estimation error throughout the process. This explains the apparent increase in fiber diameter and length from zone 1 to zone 2; if fiber distribution is compared, and not only average values, it was found that the size reduction is obtained mainly in Section 1, remaining mostly unchanged along the remaining zones in the extruder.

3.2. Influence of Extruder Size

When comparing the production of identical compounding formulations produced by the two different extruders used in the study, it was found that:
  • Fiber attrition is slightly higher in the larger extruder (ZK25), which has a more aggressive screw configuration (Figure 7). For PLA composites with 20% lignocellulosic filler, the average fiber length is reduced by more than a quarter after extrusion, while for the smaller extruder the fiber shortening is only about a third.
  • The injection molding process seems not to significantly affect the residual fiber morphology. That is, both composites provided the same fiber length and diameter in the final part, regardless of the extruder in which the compound was prepared.

3.3. Influence of Fiber Length in the Feeding

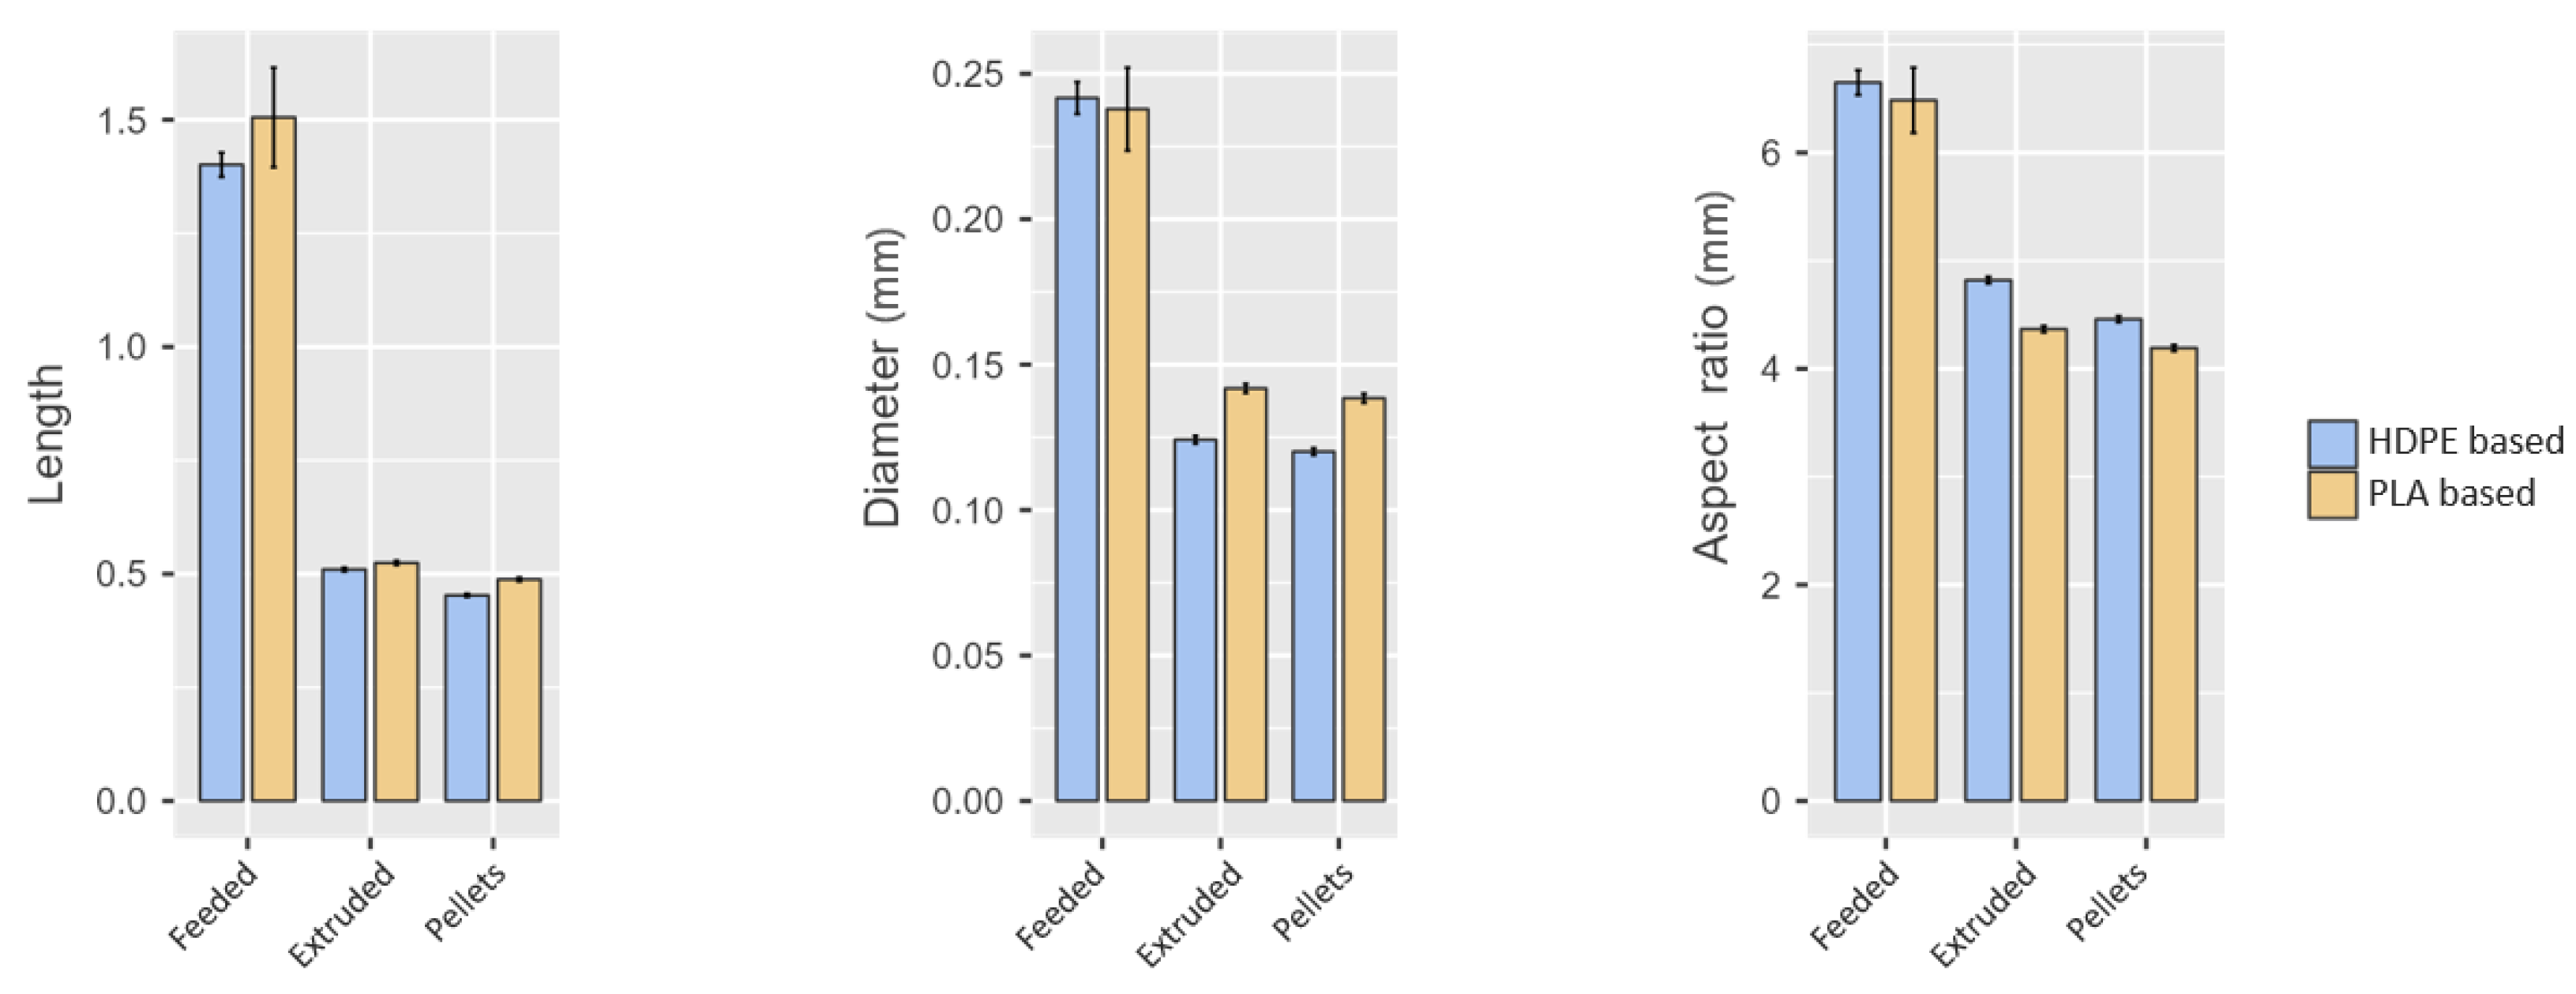
Despite using fibers that were twice as long for the extruder feed, the average fiber dimensions in the manufactured compound remains the same. The fiber size distribution (lengths and diameters) is practically identical at the end of the compounding process (Figure 8), regardless of the size of the input fibers. Only a small, non-significant difference is observed in the aspect ratio. The average value obtained for this morphological characteristic is slightly higher for composites produced from shorter fibers after extrusion and pelletizing.

3.4. Influence of Polymer Matrix

Regarding the effect of the thermoplastic resin on fiber attrition, only a slightly lower incidence of processing on the diameter or thickness of the fiber bundles is observed when PLA is used as the matrix (Figure 9). This might be due to the lower viscosity of the polymer (with an MFI about three times that for HDPE); the higher flow of material might then reduce the fiber attrition.

3.5. Influence of Filler Ratio

Having used fiber contents of 5, 10, 20 and 40% by weight, no significant differences were found when varying the filler ratio on the residual size of the fibers present in the composite material. Figure 10 shows the results obtained for the composites at 5 and 20%.

3.6. Method Validation

In order to validate the proposed methodology, the results obtained have been compared against those obtained by manual measurement. For this purpose, a scanned sample has been divided into sectors in order to have a manageable image for the hand-measurement procedure, thus containing only a few hundred fibers instead of thousands. The same sub-sample was analysed using the semi-automatic method and by hand, using the manual measurement tools provided by ImageJ. In the first instance, it was found that the number of objects (fibres) detected by the automatic procedure is four times the number of fibres that were identified manually. This difference is mainly due to the ability of automatic filtering to detect small particles that are difficult to pick out when fibres are selected by hand. By setting a shape criterion that fixes the minimum length for filtering at the smallest of the manually detected fibre lengths, the results obtained by both procedures are quite similar, as shown in Table 2.
The subsample analysed shows the residual fibre morphology in the extruded PLA compound with 5% fibre by weight. It was found that length and aspect ratio of the fibers, when the mean values are taken into account, shows a variation of 20% from one method to the other, which is within the typical variance [12]; the differences in mean diameter are only about 10%.
However, more representative than these mean values are the data distributions. As shown in Figure 11, the frequencies and distribution plots obtained by the proposed method correlate consistently with the manual measurement, both for the length and diameter or aspect ratio of the fibers. It is patent from this figure that the distribution of length and diameter (and therefore, aspect ratio) are very similar between both methods. As already mentioned, the semi-automatic procedure measures smaller particles that are discarded during the manual procedure, explaining the lower mean and median values found, particularly for lengths. On the other hand, the time needed for the processing of samples should be highlighted; the semi-automatic procedure only took less than 1 min to provide the results on 239 measurements, while the manual operation needed over 1 h to obtain only half of the results. When considering the time needed to obtain a significant number of measured elements, as shown for the entire sample (some thousands), versus the ones measured in this sub-sample (only about 100), it is clear that manual measurement might not provide optimal results. That is, the proposed method seems to slighly bias the fiber length to shorter lengths compared to the manual procedure, but nonetheless this method is considered as providing more significant results, due to the bigger size of the sample and the consideration of most elements in the image, not only those easier to measure by hand.

4. Conclusions

From the presented methodology, the following conclusions can be highlighted:
  • An alternative and affordable method for morphometric analysis of fibers during compounding processes, based on conventional optical scanner and open-source software, has been developed and validated. The present methodology, based on film pressing and optical scanning image analysis, is valid for thermoplastic composites using uncolored or natural matrices that allow visual identification of the dispersed phase of the composite.
  • The use of Adobe Photoshop for image segmentation allows handling of large samples to speed up the analysis process in ImageJ, obtaining good measurement reliability and a statistically significant number of measurements per sample. However, this software could be avoided if analyzing smaller images or if intending to obtain a lower number of measurements.
  • The “Shape filter” plugin has been proved for individual fiber recognition by using ImageJ.
After the application of the proposed methodology to the case study of giant reed fibers in different scenarios (starting fiber length, two different matrices, four different fiber loadings, two different twin-screw compounders) it can be concluded that:
  • The greatest reduction in fiber length occurs from the first kneading zone of the extrusion process, where more than 85% of the fibers for HDPE and 90% for the PLA compound result shortened to less than 1 mm in length.
  • The fiber size distributions are remarkably similar at the end of the compounding process, regardless of the size of the input fibers or the type of polymer matrix.
  • The average aspect ratio is reduced to less than 10 for all the compound formulations that were produced.
  • The injection molding process does not significantly affect the morphology of the fibers; that is, neither their length nor their diameter is affected during the process.
  • Results obtained agree with the observations made in other research. Further, the results obtained with the proposed methodology have been compared against those obtained by hand to validate the measurements, finding that the proposed method yields slightly lower fiber lengths than the manual procedure, although still under the accepted 20% variance, while diameters are within the same range.
  • The semi-automatic method proposed allows for the measurement of a high number of fibers, yielding more representative results, as smaller particles are not disregarded, and due to the higher number of samples analyzed in just a fraction of the time consumed during the manual process.

Supplementary Materials

The following supporting information can be downloaded at: https://www.mdpi.com/article/10.3390/jcs7080326/s1, Figure S1: ImageJ macro for automated fiber recognition and measurement.

Author Contributions

Conceptualization, L.S.; methodology, L.S. and Z.O.; validation, L.S.; formal analysis, L.S. and Z.O.; investigation, all authors; data curation, L.S.; writing—original draft preparation, L.S. and Z.O.; writing—review and editing, L.S., Z.O., E.C., G.G. and M.B.; visualization, L.S.; funding management: M.D.M.; supervision, Z.O. All authors have read and agreed to the published version of the manuscript.

Funding

Luis Suárez acknowledges funding through the Ph.D. grant program co-financed by the Canarian Agency for Research, Innovation and Information Society of the Canary Islands Regional Council for Employment, Industry, Commerce and Knowledge (ACIISI), and by the European Social Fund (ESF) (Grant number TESIS2021010008). Zaida Ortega also acknowledges the Spanish Ministry of Universities for funding the internship at QUB, through the grant received by Order UNI/501/2021 of 26 May 2021, coming from the European Union towards Next Generation funds (Plan de Recuperación, Transformación y Resiliencia del Gobierno de España: C21.I4.P1. Resolución del 2 de julio de 2021 de la Universidad de Las Palmas de Gran Canaria por la que se convocan Ayudas para la recualificación del sistema universitario español para 2021–2023).

Data Availability Statement

Data are available from the authors upon reasonable request.

Acknowledgments

Inv2Mac project (European Funding for Regional Development (FEDER), INTERREG MAC 2014–2020 program; grant number MAC2/4.6d/229).

Conflicts of Interest

The authors declare no conflict of interest. The funders had no role in the design of the study; in the collection, analysis, or interpretation of data; in the writing of the manuscript; nor in the decision to publish the results.

References

  1. Ismail, S.O.; Akpan, E.; Dhakal, H.N. Review on natural plant fibres and their hybrid composites for structural applications: Recent trends and future perspectives. Compos. Part C Open Access 2022, 9, 100322. [Google Scholar] [CrossRef]
  2. Visweswaraiah, S.B.; Selezneva, M.; Lessard, L.; Hubert, P. Mechanical characterisation and modelling of randomly oriented strand architecture and their hybrids—A general review. J. Reinf. Plast. Compos. 2018, 37, 548–580. [Google Scholar] [CrossRef]
  3. Bourmaud, A.; Mayer-Laigle, C.; Baley, C.; Beaugrand, J. About the frontier between filling and reinforcement by fine flax particles in plant fibre composites. Ind. Crops Prod. 2019, 141, 111774. [Google Scholar] [CrossRef]
  4. Hubbe, M.; Grigsby, W. From nanocellulose to wood particles: A review of particle size vs. the properties of plastic composites reinforced with cellulose-based entities. BioResources 2020, 15, 2030–2081. [Google Scholar] [CrossRef]
  5. Bourmaud, A.; Shah, D.U.; Beaugrand, J.; Dhakal, H.N. Property changes in plant fibres during the processing of bio-based composites. Ind. Crops Prod. 2020, 154, 112705. [Google Scholar] [CrossRef]
  6. Mallick, P.K. Thermoplastics and thermoplastic–matrix composites for lightweight automotive structures. In Materials, Design and Manufacturing for Lightweight Vehicles; Woodhead Publishing: Sawston, UK, 2020; pp. 187–228. ISBN 9780128187128. [Google Scholar]
  7. Zwawi, M. A review on natural fiber bio-composites, surface modifications and applications. Molecules 2021, 26, 404. [Google Scholar] [CrossRef]
  8. Dickson, A.; Teuber, L.; Gaugler, M.; Sandquist, D. Effect of processing conditions on wood and glass fiber length attrition during twin screw composite compounding. J. Appl. Polym. Sci. 2020, 137, 48551. [Google Scholar] [CrossRef]
  9. Goris, S.; Back, T.; Yanev, A.; Brands, D.; Drummer, D.; Osswald, T.A. A novel fiber length measurement technique for discontinuous fiber-reinforced composites: A comparative study with existing methods. Polym. Compos. 2018, 39, 4058–4070. [Google Scholar] [CrossRef]
  10. Di Giuseppe, E.; Castellani, R.; Dobosz, S.; Malvestio, J.; Berzin, F.; Beaugrand, J.; Delisée, C.; Vergnes, B.; Budtova, T. Reliability evaluation of automated analysis, 2D scanner, and micro-tomography methods for measuring fiber dimensions in polymer-lignocellulosic fiber composites. Compos. Part A Appl. Sci. Manuf. 2016, 90, 320–329. [Google Scholar] [CrossRef]
  11. Gamon, G.; Evon, P.; Rigal, L. Twin-screw extrusion impact on natural fibre morphology and material properties in poly(lactic acid) based biocomposites. Ind. Crops Prod. 2013, 46, 173–185. [Google Scholar] [CrossRef] [Green Version]
  12. Beaugrand, J.; Berzin, F. Lignocellulosic fiber reinforced composites: Influence of compounding conditions on defibrization and mechanical properties. J. Appl. Polym. Sci. 2013, 128, 1227–1238. [Google Scholar] [CrossRef]
  13. Rüppel, A.; Wolff, S.; Oldemeier, J.P.; Schöppner, V.; Heim, H.-P. Influence of Processing Glass-Fiber Filled Plastics on Different Twin-Screw Extruders and Varying Screw Designs on Fiber Length and Particle Distribution. Polymers 2022, 14, 3113. [Google Scholar] [CrossRef]
  14. Padovani, J.; Legland, D.; Pernes, M.; Gallos, A.; Thomachot-Schneider, C.; Shah, D.U.; Bourmaud, A.; Beaugrand, J. Beating of hemp bast fibres: An examination of a hydro-mechanical treatment on chemical, structural, and nanomechanical property evolutions. Cellulose 2019, 26, 5665–5683. [Google Scholar] [CrossRef]
  15. Berton, M.; Cellere, A.; Lucchetta, G. A new procedure for the analysis of fibre breakage after processing of fibre-reinforced thermoplastics. Int. J. Mater. Form. 2010, 3, 671–674. [Google Scholar] [CrossRef]
  16. Alemdar, A.; Zhang, H.; Sain, M.; Cescutti, G.; Müssig, J. Determination of fiber size distributions of injection moulded polypropylene/natural fibers using X-ray microtomography. Adv. Eng. Mater. 2008, 10, 126–130. [Google Scholar] [CrossRef]
  17. Berzin, F.; Vergnes, B.; Beaugrand, J. Evolution of lignocellulosic fibre lengths along the screw profile during twin screw compounding with polycaprolactone. Compos. Part A Appl. Sci. Manuf. 2014, 59, 30–36. [Google Scholar] [CrossRef]
  18. Le Moigne, N.; Van Den Oever, M.; Budtova, T.; Le, N.; Van Den Oever, M.; Budtova, T. A statistical analysis of fibre size and shape distribution after compounding in composites reinforced by natural fibres. Compos. Part A 2011, 42, 1542–1550. [Google Scholar] [CrossRef]
  19. Berzin, F.; Beaugrand, J.; Dobosz, S.; Budtova, T.; Vergnes, B. Lignocellulosic fiber breakage in a molten polymer. Part 3. Modeling of the dimensional change of the fibers during compounding by twin screw extrusion. Compos. Part A Appl. Sci. Manuf. 2017, 101, 422–431. [Google Scholar] [CrossRef]
  20. Wang, S.; Yatagawa, T.; Suzuki, H.; Ohtake, Y. Image Based Measurement of Individual Fiber Lengths for Randomly Oriented Short Fiber Composites. J. Nondestruct. Eval. 2022, 41, 1–16. [Google Scholar] [CrossRef]
  21. Albrecht, K.; Osswald, T.; Baur, E.; Meier, T.; Wartzack, S.; Müssig, J. Fibre Length Reduction in Natural Fibre-Reinforced Polymers during Compounding and Injection Moulding—Experiments Versus Numerical Prediction of Fibre Breakage. J. Compos. Sci. 2018, 2, 20. [Google Scholar] [CrossRef] [Green Version]
  22. Terada, M.; Yamanaka, A.; Kimoto, Y.; Shimamoto, D.; Hotta, Y.; Ishikawa, T. Evaluation of measurement method for carbon fiber length using an optical image scanner. Adv. Compos. Mater. 2018, 27, 605–614. [Google Scholar] [CrossRef]
  23. Schindelin, J.; Arganda-Carreras, I.; Frise, E.; Kaynig, V.; Longair, M.; Pietzsch, T.; Preibisch, S.; Rueden, C.; Saalfeld, S.; Schmid, B.; et al. Fiji: An open-source platform for biological-image analysis. Nat. Methods 2012, 9, 676–682. [Google Scholar] [CrossRef] [PubMed] [Green Version]
  24. Sadik, Z.; Ablouh, E.; Sadik, M.; Benmoussa, K.; Idrissi-Saba, H.; Kaddami, H.; Arrakhiz, F.Z. Use of 2D image analysis method for measurement of short fibers orientation in polymer composites. Eng. Solid Mech. 2020, 8, 233–244. [Google Scholar] [CrossRef]
  25. Terenzi, A.; Kenny, J.M.; Barbosa, S.E. Natural fiber suspensions in thermoplastic polymers. I. Analysis of fiber damage during processing. J. Appl. Polym. Sci. 2007, 103, 2501–2506. [Google Scholar] [CrossRef]
  26. Suárez, L.; Barczewski, M.; Kosmela, P.; Marrero, M.D.; Ortega, Z. Giant Reed (Arundo donax L.) Fiber Extraction and Characterization for Its Use in Polymer Composites. J. Nat. Fibers 2023, 20, 2131687. [Google Scholar] [CrossRef]
  27. Domenek, S.; Berzin, F.; Ducruet, V.; Plessis, C.; Dhakal, H.; Richaud, E.; Beaugrand, J. Extrusion and injection moulding induced degradation of date palm fibre—Polypropylene composites. Polym. Degrad. Stab. 2021, 190, 109641. [Google Scholar] [CrossRef]
  28. Chinga-Carrasco, G.; Solheim, O.; Lenes, M.; Larsen, Å. A method for estimating the fibre length in fibre-PLA composites. J. Microsc. 2013, 250, 15–20. [Google Scholar] [CrossRef]
  29. Ferreira, P.J.; Matos, S.; Figueiredo, M.M. Size characterization of fibres and fines in hardwood kraft pulps. Part. Part. Syst. Charact. 1999, 16, 20–24. [Google Scholar] [CrossRef]
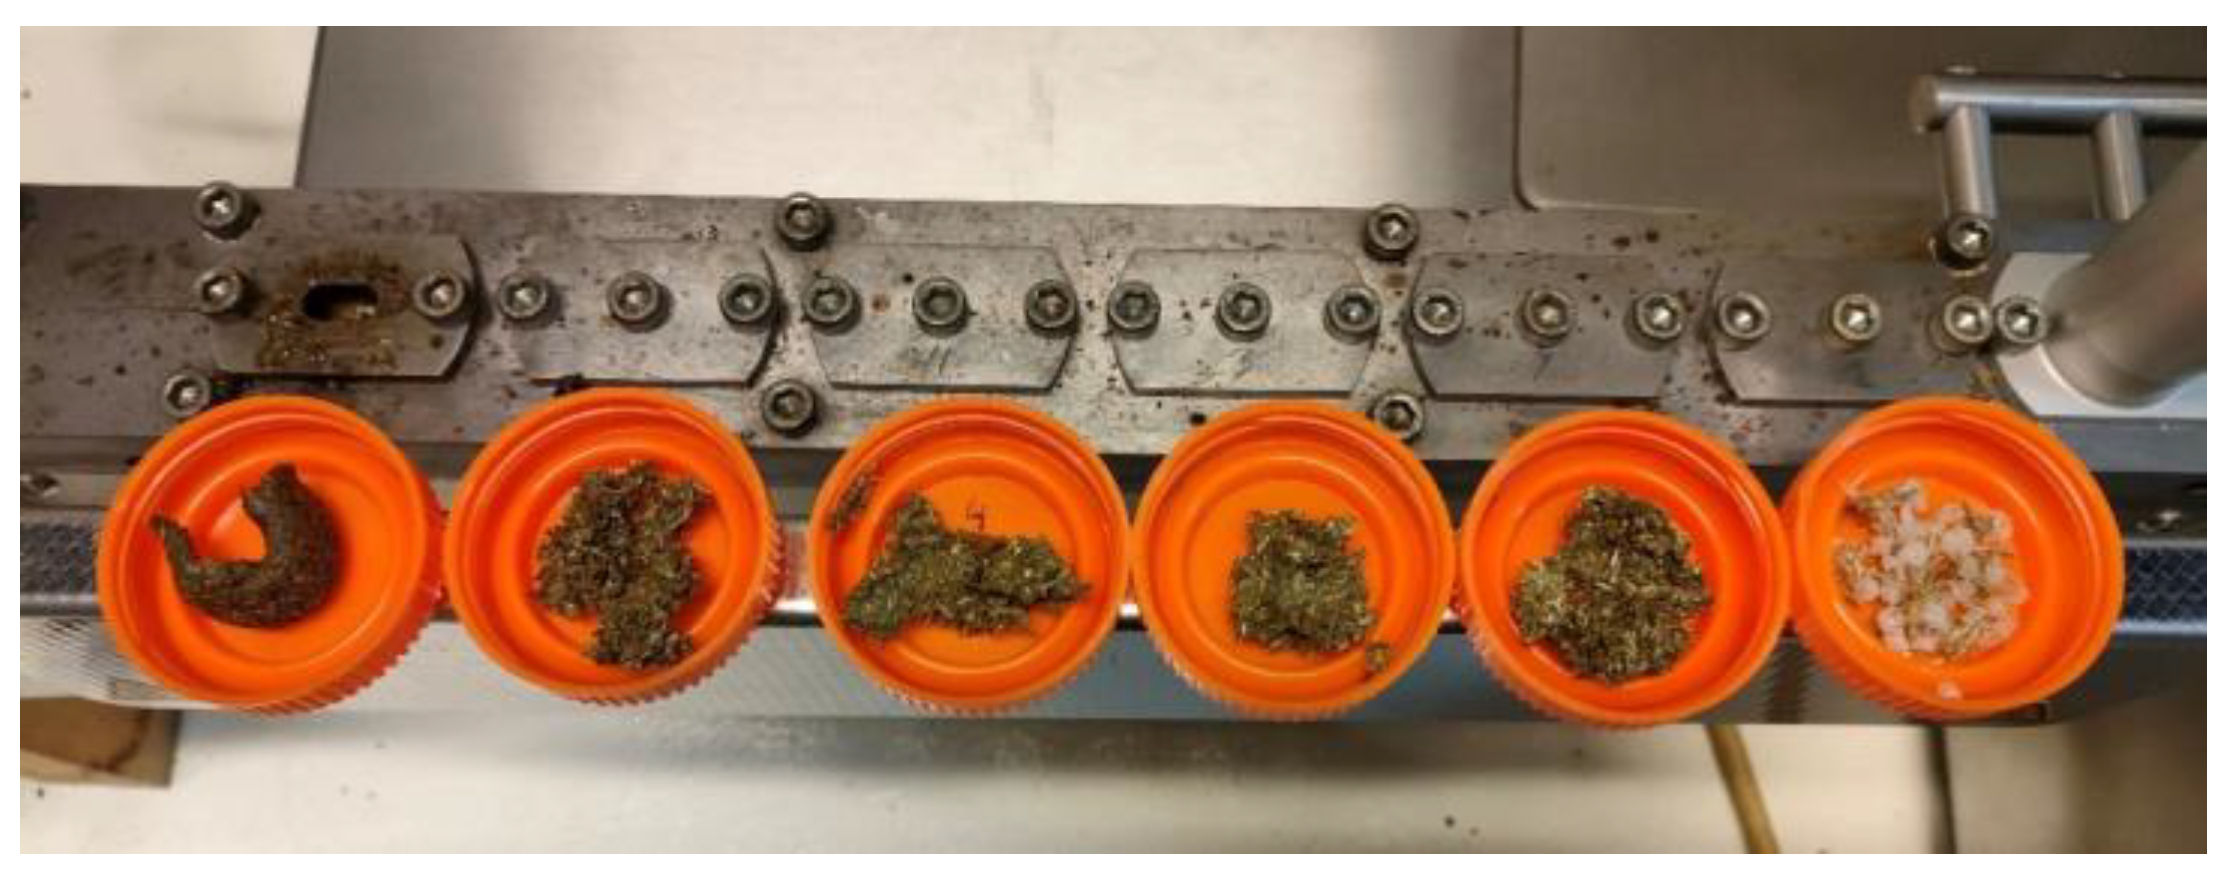
Figure 1. Samples taken along the Process11 extruder.
Jcs 07 00326 g001
Figure 2. Sample preparation: from (a) extruded filament, (b) pellets or (c) molded part. (d,e) Sample film folded together with polymer film to enhance fiber dispersion. (f) Specimens ready for image analysis.
Jcs 07 00326 g002
Figure 3. Image processing for fiber measurement: (a) scanned image; (b) image after binary segmentation; (c) image after shape filtering.
Jcs 07 00326 g003
Figure 4. Photoshop action script for image segmentation.
Jcs 07 00326 g004
Figure 5. Shape filtering criteria.
Jcs 07 00326 g005
Figure 6. Fiber length and diameter evolution in HDPE-based composites produced in Process 11 twin-screw extruder (20% and 40% filler ratio).
Jcs 07 00326 g006
Figure 7. Variation in length, diameter and aspect ratio of fibers for the same composite formulation (PLA + 20% fibers), produced on Process 11 and ZK25 extruders.
Jcs 07 00326 g007
Figure 8. Variation of fiber dimensions for the same composite formulation (HDPE + 20% fibers), produced by ZK25 extruder, when fed fibers of different initial nominal sizes.
Jcs 07 00326 g008
Figure 9. Fiber size changes for HDPE and PLA composites reinforced with 20% fiber. Compounding produced by ZK25 extruder.
Jcs 07 00326 g009
Figure 10. Fiber size changes in the HDPE composites reinforced with 5 and 20% fiber. Compounding produced by ZK25 extruder.
Jcs 07 00326 g010
Figure 11. Frequency distribution plots for length, diameter and aspect ratio of fibers by manual vs. semi-automatic method.
Jcs 07 00326 g011
Table 1. Configuration of the twin-screw extruders used in the research.
ApparatusDiameter (mm)L/D RatioScrew Speed (rpm)Screw Configuration
ThermoScientific Process111140/1100Jcs 07 00326 i001
Collin ZK252530/1250Jcs 07 00326 i002
Table 2. Comparative results between semi-automatic and manual measuring methods.
95% Confidence Interval
Measurement MethodNMeanLowerUpperMedianSDVarianceMinimumMaximum
Lengthmanual1050.7810.7250.8370.6720.2880.0830.3531.858
semi-automatic2390.6210.5890.6520.5470.2450.060.351.878
Diametermanual1050.1610.150.1710.150.0530.0030.0680.373
semi-automatic2390.1740.1610.1880.1370.1070.0110.0350.634
Aspect ratiomanual1055.0224.7265.3184.8641.5292.3382.41410.12
semi-automatic2394.1613.9454.3773.8451.6922.8632.0112.491
Note: The CI of the mean assumes sample means follow a t-distribution with N − 1 degrees of freedom.
Disclaimer/Publisher’s Note: The statements, opinions and data contained in all publications are solely those of the individual author(s) and contributor(s) and not of MDPI and/or the editor(s). MDPI and/or the editor(s) disclaim responsibility for any injury to people or property resulting from any ideas, methods, instructions or products referred to in the content.