Article

Effect of PVDF, HA, and AgNO3 Annealing on β-Phase, Optical, and Mechanical Properties

1
Faculty of Mechanical Engineering and Design, Kaunas University of Technology, Studentu St. 56, LT 51373 Kaunas, Lithuania
2
Faculty of Mechanical Engineering, Bialystok University of Technology, Wiejska 45 C Street, 15-351 Białystok, Poland
*
Authors to whom correspondence should be addressed.
J. Compos. Sci. 2024, 8(7), 240; https://doi.org/10.3390/jcs8070240
Submission received: 23 April 2024 / Revised: 10 June 2024 / Accepted: 20 June 2024 / Published: 25 June 2024
(This article belongs to the Special Issue Progress in Polymer Composites, Volume III)

Abstract

:
Typically, polymer composites and ceramics are used to create biosensors. Materials with properties that are ideal for biosensors and chemical sensors include AgNO3 (silver nitrate), PVDF (polyvinylidene fluoride), and HA (hydroxyapatite). Polyvinylidene fluoride (PVDF) polymer has been widely used in several applications because of its well-known superior ferroelectric characteristics and biocompatibility. The brittleness and low bending strength of hydroxyapatite limit its applicability. Several HA and polymer composite formulations have been developed to compensate for HA’s mechanical weakness. The final product contains a significant amount of HA, making HA/polymer composites highly biocompatible. When the right amount of silver is deposited, the maximum piezoelectric activity is generated, and silver nitrate has antimicrobial properties. The non-toxic solvent DMSO (dimethyl sulfoxide) and the solvent casting method were chosen for the preparation of the film. Surface roughness was chosen to measure the Str and Sdr properties of the thin film. For liquid preparation, the multifractal spectra analysis was chosen for each sample. SEM was used to examine the samples morphologically. EDX and mapping analyses were presented for chemistry distribution in the samples.

1. Introduction

Dielectric films are solid layers which are widely used in the food, medicine, packaging, organic transistors, capacitors, sensor devices, microelectronics, and power electronics industries. They can be polymeric or ceramic [1]. There is an increasing need to use polymeric materials or composites because polymer composites are readily available and more cost-effective than other materials. They can be used in a variety of ways, depending on the product quality, initial raw material alternatives, design, and progressively improving synthesis processes [2].
Piezoceramic materials are the basis of key engineering components in the fields of biomedical devices, acoustics, microelectronics, and various types of sensors. The engineering requirements of piezoceramics with complex geometries have increased significantly, so a higher efficiency is needed [3].
The PVDF (polyvinylidene fluoride) polymer has been widely used in some applications due to its excellent ferroelectric properties [4]. The polar crystalline phases, namely the β- and γ-phases, are responsible for the piezoelectric property of PVDF. Among all of the crystalline phases, the β-phase exhibits the highest electric dipole moment. Thus, one efficient method of enhancing the piezoelectric characteristics of PVDF-based piezoelectric sensors, actuators, and energy harvesters is to add more β-phase content to the PVDF. Dipole alignment can be induced using a variety of techniques, including stretching, polarization in a high electric field, thermal annealing, and filler insertion, to raise the β-phase fraction in PVDF. PVDF and its copolymers are promising piezoelectric candidates for autonomous sensors and energy harvesters due to their good flexibility, strength, chemical resistance, and biocompatibility, even though their piezoelectric coefficient is not as high as that of inorganic piezoelectric materials [5].
The silver ions (Ag+) released from silver nanoparticles (Ag0) interact with phosphorous moieties in DNA. In fact, silver nanoparticles are highly germicidal, quite harmless to humans, and nontoxic. Even the highest concentration of nanosilver does not cause side effects.
The addition of a conductive phase such as silver can be beneficial because of the following reasons: first, the conductive phase improves the charge transfer by increasing the sensitivity of the piezoelectric response, and a suitable amount of Ag deposition induces the piezoelectric activity, while a higher Ag loading decreases the piezoelectric activity (concentration properties studied: 0.12, 0.21, 0.52%, 1 mL) [6].
Concentrations of Ag nanoparticles (0.25 and 2.5 μg/mL) had no effect on toxicity when applied directly to the wound. AgNPs (silver nanoparticles) are suitable for their intended use as a topical wound-healing agent at concentrations of 0.25 and 2.5 μg/mL [7].
Although significant progress has been made in elucidating the mechanisms of the toxicity of silver nanomaterials, further research is needed to fully understand the processes involved and to safely exploit silver’s vast antimicrobial properties without endangering human health. Silver NPs show signs of some toxicity due to their physicochemical properties. The toxicity of silver is low, but its consequence was observed at a higher concentration [8].
The main mineral in bone is hydroxyapatite, a crystallization of calcium phosphate that occurs naturally. Natural hydroxyapatite and bone share physical, chemical, and biological properties that make them compatible [9].
A naturally occurring mineral form of calcium apatite, hydroxyapatites make up between fifty percent of the volume of bone. Because of its osteoconductive qualities and bioactivity, hydroxyapatite (HA) is an apatite that is most frequently used as bioceramic in the dental and medical industries. Hydroxyapatite’s chemical formula is Ca5(PO4)3OH; however, it is more commonly written as Ca10(PO4)6(OH)2. You can make natural hydroxyapatite (HA) out of eggshells, fish bones, coral, chicken bones, and so on [4].
The hydroxyapatite (HA) when synthesized showed low crystallinity and high porosity. However, the highest crystallinity is found in HA that is calcined at 800 °C from animal bone. By creating an HA interfacial ply, hydroxyapatite (HA) can chemically bond with surrounding hard materials. Biocompatible is the term used to describe natural hydroxyapatite (HA) due to its similar chemical and physical properties to bone [4].
PVDF polymer and α-PVDF/HA composites’ mechanical properties and biocompatibility can be used for medical and dental applications or in other industries [4]. Their thickness, structure, surface topography from the atomic to micrometer level, and functional groups on the film surfaces determine their dielectric, mechanical, thermal, and physical properties [4]. The films mechanical characteristics are influenced by their surface roughness [10]. Surface texture is a crucial attribute of an object that has a great impact on the wear resistance, fatigue life, and friction properties of components. Among the inorganic antibacterial agents that have been thoroughly researched recently is silver. Because silver ions are formed, silver is thought to have antibacterial properties. By binding to thiol groups in proteins, heavy metals react with them to produce protein inactivation, which is how silver ions attain their antibacterial effect. The aim of this research is to create antibacterial functional elements and use these potential materials.
Author Biranche Tandon also examines the advantages of PVDF beta phase and hydroxyapatite composites. He presents a comparison of the stimuli-responsive characteristics of PVDF fibers, arguing that solution blowing spinning enabled a higher fiber production rate than electrospinning, as well as a higher amount of β-phase in the produced fibers. The successful incorporation of a known piezoelectric ceramic and bioactive phase, hydroxyapatite, at 5 wt% and 10 wt% into the fibers to improve the composite properties was achieved [11].
Another composite example is author Liang Zhang, who presented a PVDF/Ag/BaTiO3 composite prepared via casting. The composite with silver particles has better dielectric properties than traditional PVDF/BaTiO3 composites. The dielectric constant of PVDF/Ag/BaTiO3 composites improved significantly with increasing Ag [12].
The results obtained by author Milena S. Malherbi show that the growth kinetics of apatite are changed by electrodynamics. The developed HAβ-PVDF composite can be used in bone implants to obtain a reverse piezoelectric effect [13].
In this study, the combination of PVDF provides great potential for composite development due to the stability of HA, as silver ions can improve durability, bioactivity, and electrical properties. Therefore, samples composed of a mixture of PVDF and HA at two different percentages of HA and PVDF, HA, and AgNO3 were prepared, and the characterization, hydrophilic, and electrical properties were discussed in detail. Thus, the innovative composites developed with exceptional properties can be used in areas such as energy harvesting, self-propelled sensors, wearable electronics, etc.

2. Characterization of PVDF-Based Piezoelectric Materials

2.1. PVDF β-Phase Effects for Sensors Application

PVDF films with a 98.8% β-phase content are produced at an ideal crystallizing temperature of 60 °C by employing dimethyl sulfoxide (DMSO) as a solvent. The corresponding PVDF film exhibits excellent ferroelectric and piezoelectric properties due to its high β-phase content. Lastly, solvent casting can be used to create PVDF films. Using the ideal DMSO (dimethyl sulfoxide) solvent, PVDF films can be prepared at various crystallization temperatures (50–160 °C) to assess the impact of crystallization temperature on the amount of β-phase. DMSO (dimethyl sulfoxide) is an aprotic solvent that is also miscible with polar solvents because it has a dipole moment [14]. All three phases of PVDF can be formed with the same polar solvent. By adjusting the solution temperature with the polar DMSO (dimethyl sulfoxide) solvent, different phases of PVDF can be obtained. Different phases are produced by the annealing conditions, and one phase can change into another PVDF phase. The β-phase, crucial for ferroelectric uses, is achieved via the use of a polar solvent and suitable annealing. After five hours of annealing at 90 °C, the PVDF films reach their maximum β-phase [15,16]. PVDF is a polymer material that is semi-crystalline. PVDF can be a helpful material for wearable, flexible, and implantable electronic sensors, nanogenerators, energy harvesters, artificial skin, and biomedical applications because of its flexibility, mechanical and chemical stability, non-toxicity, thermal stability, and biocompatibility. Dielectric, pyroelectric, ferroelectric, and piezoelectric qualities are all present in PVDF. Figure 1 shows PVDF phases; just β and γ are polar phases out of the three polymorphic crystalline modifications of PVDF (α, β, and γ). The β-phase is the most preferred PVDF polymer phase because it has the highest electric dipole mobility. The α-phase of PVDF is its unique form, which requires processing to transform into the polar β-phase. The methods for PVDF β-phase strengthening that are most frequently used are heat treatment, mechanical stretching, electropolishing, and filler addition [16,17,18].
Optimal crystallization using dimethyl sulfoxide (DMSO) as a solvent yields PVDF films with a high β-phase content of up to 98.8% [15]. The XRD curve indicates that the PVDF film was annealed for five hours at 90 °C, during which time the β-phase peak was the largest. All three phases of PVDF can be formed using the same polar solvent. Different phases of PVDF can be obtained through using a polar DMSO solvent to change the solution temperature. Different phases emerge because of the annealing conditions, and one phase changes in another PVDF phase. The β-phase, crucial for ferroelectric uses, is achieved through annealing the material appropriately and using a polar solvent. The film’s maximum β-phase occurs when the PVDF films. The maximum β-phase in the films exists when the PVDF films are annealed at 90 °C for 5 h [10].
The highest piezoelectric properties are found in the β-phase with all trans conformations (TTTT). A polymer solution is used to prepare polymeric fibers via the rearrangement of the molecules into the trans conformation. Various enhancement parameters of the β-phase and the piezoelectric properties of PVDF fibers have been studied in many studies. For instance, increasing the amount of β-phase is achieved through decreasing the evaporation rate [6].
It is observed that the PVDF film cast from the DMSO solvent exhibits an obvious β peak, indicating that the β-phase becomes the main phase. The β-phase trends in PVDF films when cast from a solvent with a higher dipole moment are revealed by the diffraction data. The molecular chain in the PVDF film changes from its initial α-phase conformation (TGTG) to the TTTT conformation during the β-phase transition [14].
S. Satapathy presented the effect of annealing on the transformation of γ-phase PVDF to β- and α-phase PVDF. PVDF films were annealed for five hours at 90 °C in DMSO. The PVDF film has β-phase conditions because of this annealing process. The results submitted by the author, S. Satapathy, clearly show that the β- and α-phases of the PVDF film correspond to annealing conditions of 70 °C for 5 h, respectively. Consequently, both the β- and α-phases are contained in a PVDF film under these annealing conditions. PVDF films exhibit both the β- and α-phases upon annealing. It is also confirmed that annealing for five hours at 110 °C is necessary. PVDF films exhibit both an increase and a decrease in the values of the β-phases in the α-phase content after five hours of annealing at 130 °C.
PVDF can generate a great deal of power when it encounters mechanical force from the outside. Because of its exceptional flexibility and durability, PVDF material is more functional than ceramics. When force feedback or tactile perception is needed, PVDF can be used as a functional material. Despite its many advantages, the main barrier to the limited use of PVDF polymers is the main difficulty in achieving the β-phase. This could become a big problem if the polymer film is used as a functional part of a device [17].

2.2. Composites Based on PVDF

Author Xiwen Kuang homogeneously dispersed Ag/C particles in the PVDF matrix, and it affected the crystallization behavior and dielectric properties of Ag/C/PVDF composites. As the number of Ag/C particles increased, the crystallinity of the composites decreased. The transmittance of Ag/PVDF composites increased with an increasing Ag/C particle content due to the enhanced interfacial polarization. This means that composites with Ag not only improve electrical properties, but also the behavior of PVDF beta phases [19].
The advantages of adding silver phase were also found by Yanli Su; an Ag-NBCTO-PVDF composite was produced, and the obtained results showed that Ag nanoparticles played an important role in increasing the dielectric permittivity of the Ag-NBCTO-PVDF composite [20].
The PVDF films by author Jinwoo Choi were made using a traditional rod-coating method [21]. As a result, DMF was combined with BOD and water concentrations, and the mixture was heated to 100 °C for nine hours. After the solution’s cooling to room temperature, PVDF was added at a weight percentage of 10% and heated for an additional two hours at 60 °C. Lastly, rod coating was used to prepare PVDF films at a temperature of about 100 °C. Without affecting the morphology or quality of the resulting films, the prepared PVDF/BDS solution was stable and could be kept in storage for an extended period [21].
β-phase PVDF films were made by casting from a PVDF solution that contained water and a small amount of BOD. During the thermal decomposition process, H2SO3 is produced in situ, and, during the coating process, it is spontaneously removed. In PVDF, H2SO3 successfully produced a sizable β-phase (β = 95%). Therefore, without the need for a lengthy thermal annealing process or mechanical stretching, PVDFBDS films demonstrated excellent ferroelectric and piezoelectric properties. The author’s straightforward and effective technique for β PVDF preparation shows promise for a variety of uses, such as transducers, energy harvesters, electrochemical sensors, and different electronic devices [21].

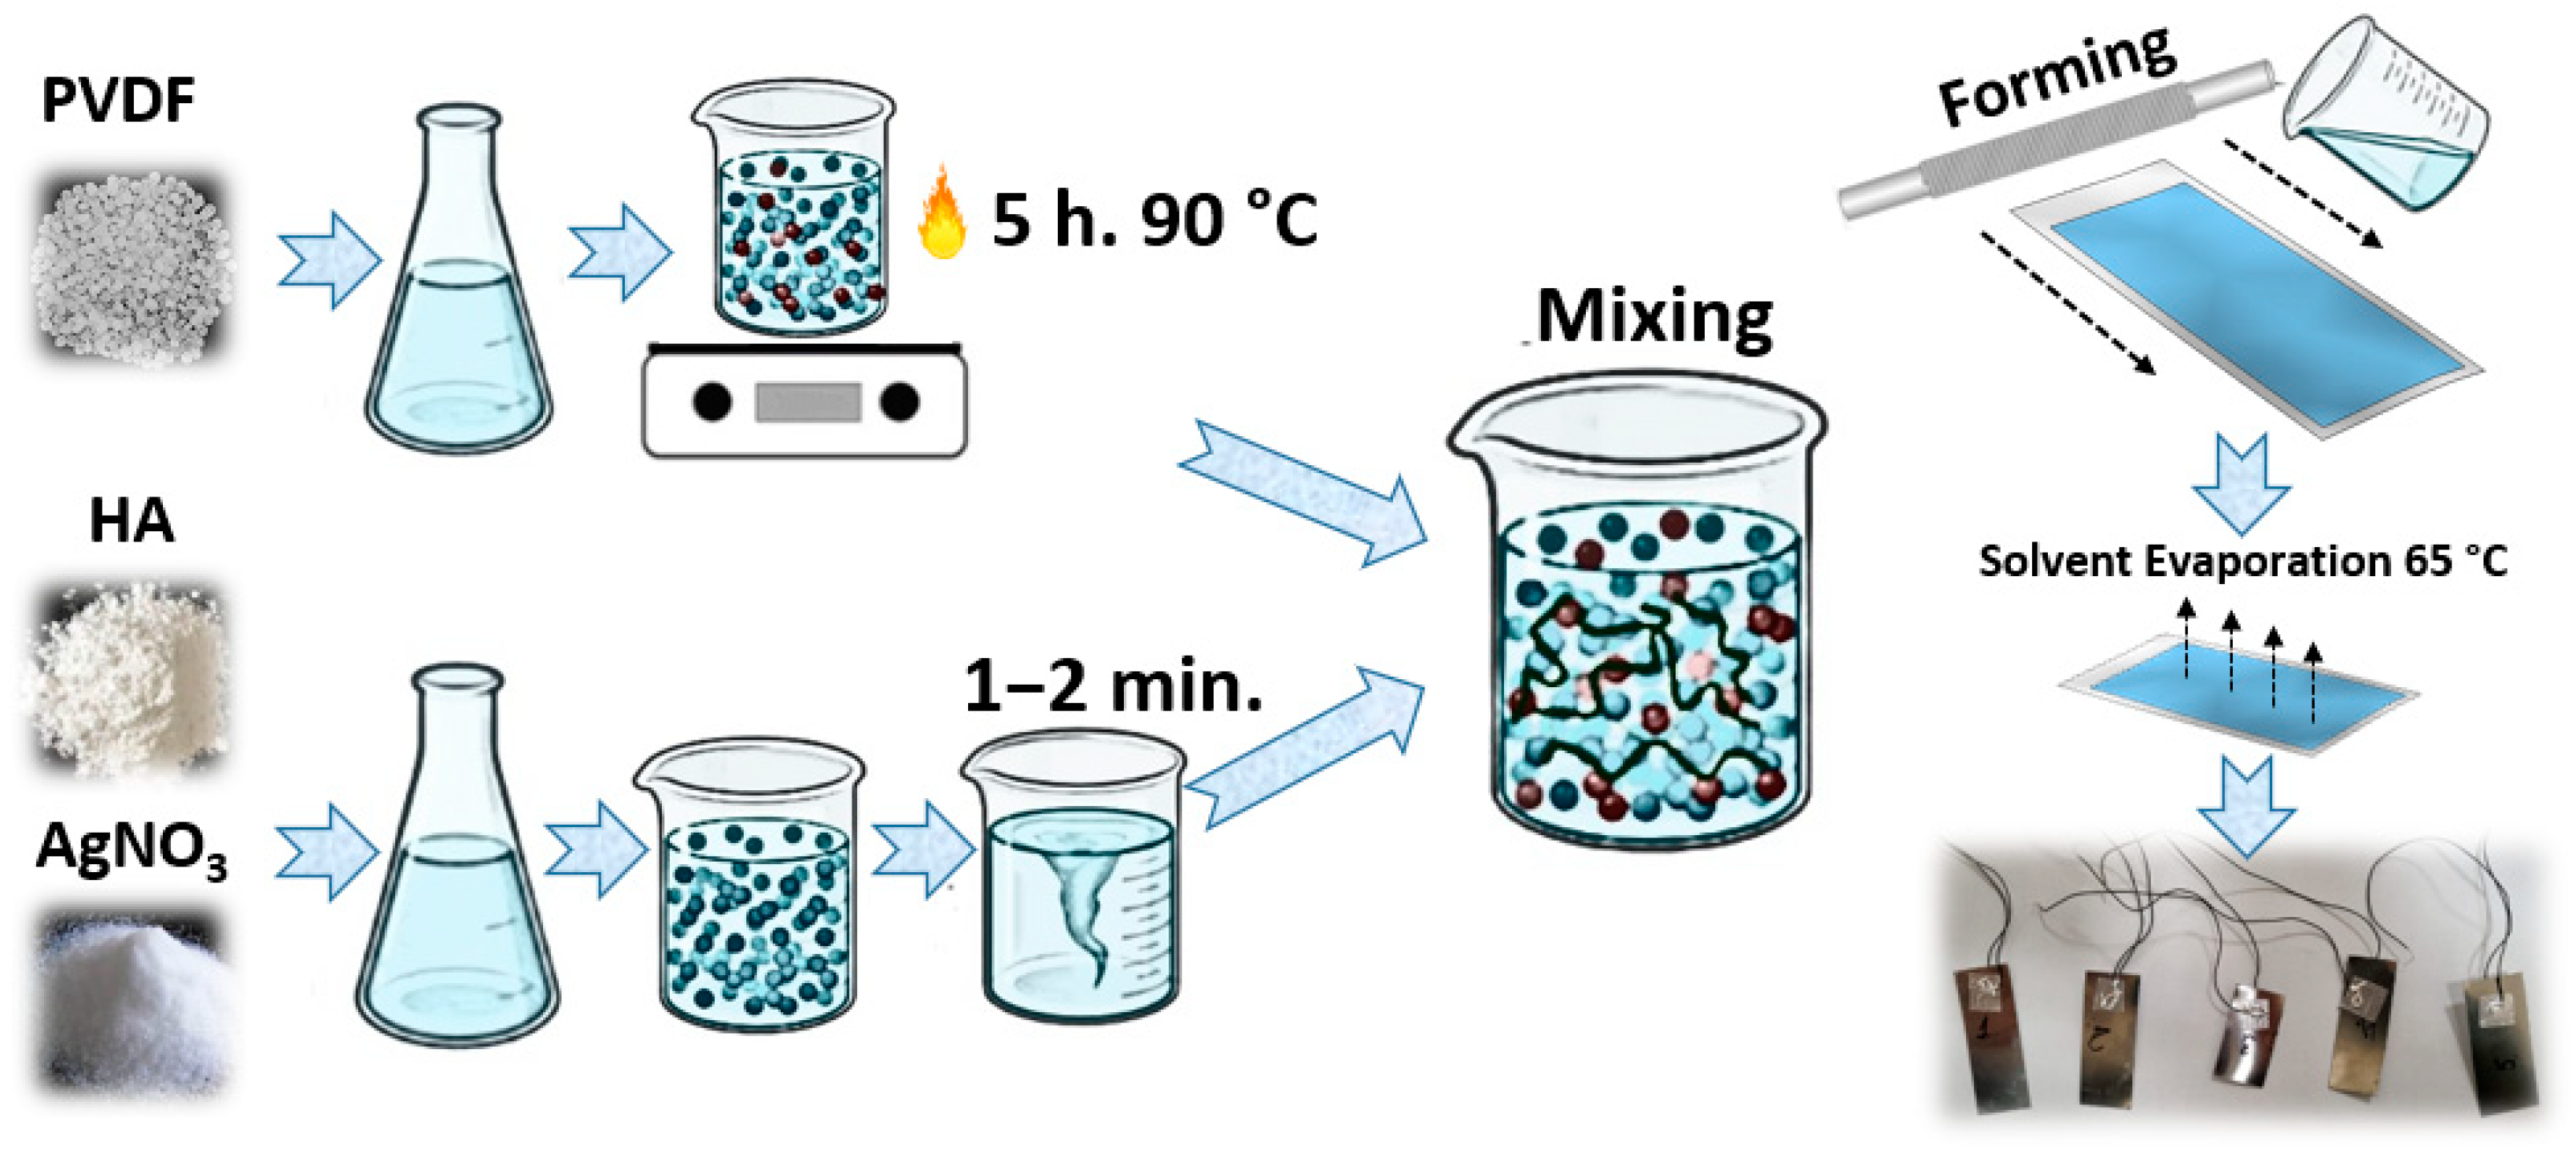
3. Methods and Preparation

3.1. Preparation Process

For a smoother surface finish, liquid phase chemicals more readily enter holes. Thin film dielectrics with smoother surfaces have lower carrier transport resistance within the film [1,22]. For this reason, the solvent casting method is used for sample preparation.
Films are obtained using dimethyl sulfoxide (DMSO) as a solvent at an optimized temperature of 90 °C. PVDF beads and DMSO solvent were first mixed and dissolved at 90 °C for 5 h until a homogeneous solution was formed. Silver nitrate and hydroxyapatite were also dispersed in a DMSO solvent, but at room temperature and being stirred for 1–2 min until evenly distributed or dissolved. Finally, all components are mixed and poured onto the base, and the film is formed with forming rods and dried in an oven at 65 °C for 3 h. Figure 2 shows the whole preparation process.
Five different films were prepared for the study. Concentrations and compositions are presented in Table 1.

3.2. Surface Roughness

The primary surface parameters, such as waviness and surface roughness, are crucial aspects of the object that have a great impact on the wear resistance, fatigue life, and friction characteristics of the components [23].
Although tactile surface texture has garnered far more attention, surface roughness has been thoroughly studied as a significant component of surface texture. Surface roughness can be measured using two different methods, namely contact and non-contact. Contact methods are largely resistant to external interference because they rely on repulsive mechanical contact with the test surfaces. In contrast to contact methods, non-contact methods measure the surface in a non-destructive way and are characterized by their high sensitivity to the surface slope and height [24].
The roughness of the physical parameters can be measured using the amplitude, frequency, and amplitude-to-wavelength ratio (a/λ) of deviations from the normal surface shape in the vertical direction. Average roughness values often represent the surface roughness of the thin film. The interfacial area ratio (Sdr) and the size/wavelength-to-material ratio (Str) were developed for ultra-thin films [1,25].
The Str parameter is a measure of surface texture uniformity. The value is obtained via dividing the horizontal distance in the direction in which the autocorrelation function decreases to the value [s] by the horizontal distance in the direction of the slowest decrease. In image processing, the autocorrelation function is a measure of the correspondence between an image presented at different coordinates and the original image. The autocorrelation function [25] is calculated as follows:
f A C F ( t x , t x ) = A z x , y z ( x t x , y t y ) d x d y A z x , y z x , y d x d y
Sdr (developed interfacial area ratio). This parameter is expressed as a percentage of the additional surface area of the definition area, which is the texture, compared to the plane definition area. When the surface has any slope, its Sdr value becomes higher. The Sdr of a completely level surface is 0. When a surface has any slope, its Sdr value becomes larger [25,26].
S d r = 1 A A 1 + z x , y x 2 + z x , y x 2 1 d x d y
For experiments, the VR series ONE-SHOT 3D was used.

3.3. Multifractal Spectra’s Method

Multifractal analysis is crucial in the context of materials as it allows the detailed characterization and comparison of the complexity of different material structures and processes in nature. The application of this method enables the identification of features that may not be visible using conventional approaches. For materials, multifractal analysis is used to investigate the heterogeneity, pore distribution, grain structures, and other aspects of the material structure that influence the physical and chemical properties [27,28]. Multifractal analysis also makes it possible to identify and quantify the variability of materials, opening new perspectives for assessing material quality and processing. In the context of material testing, this method can be particularly relevant to identifying and analyzing the structural diversity that directly affects material properties such as strength, elasticity, or conductivity.

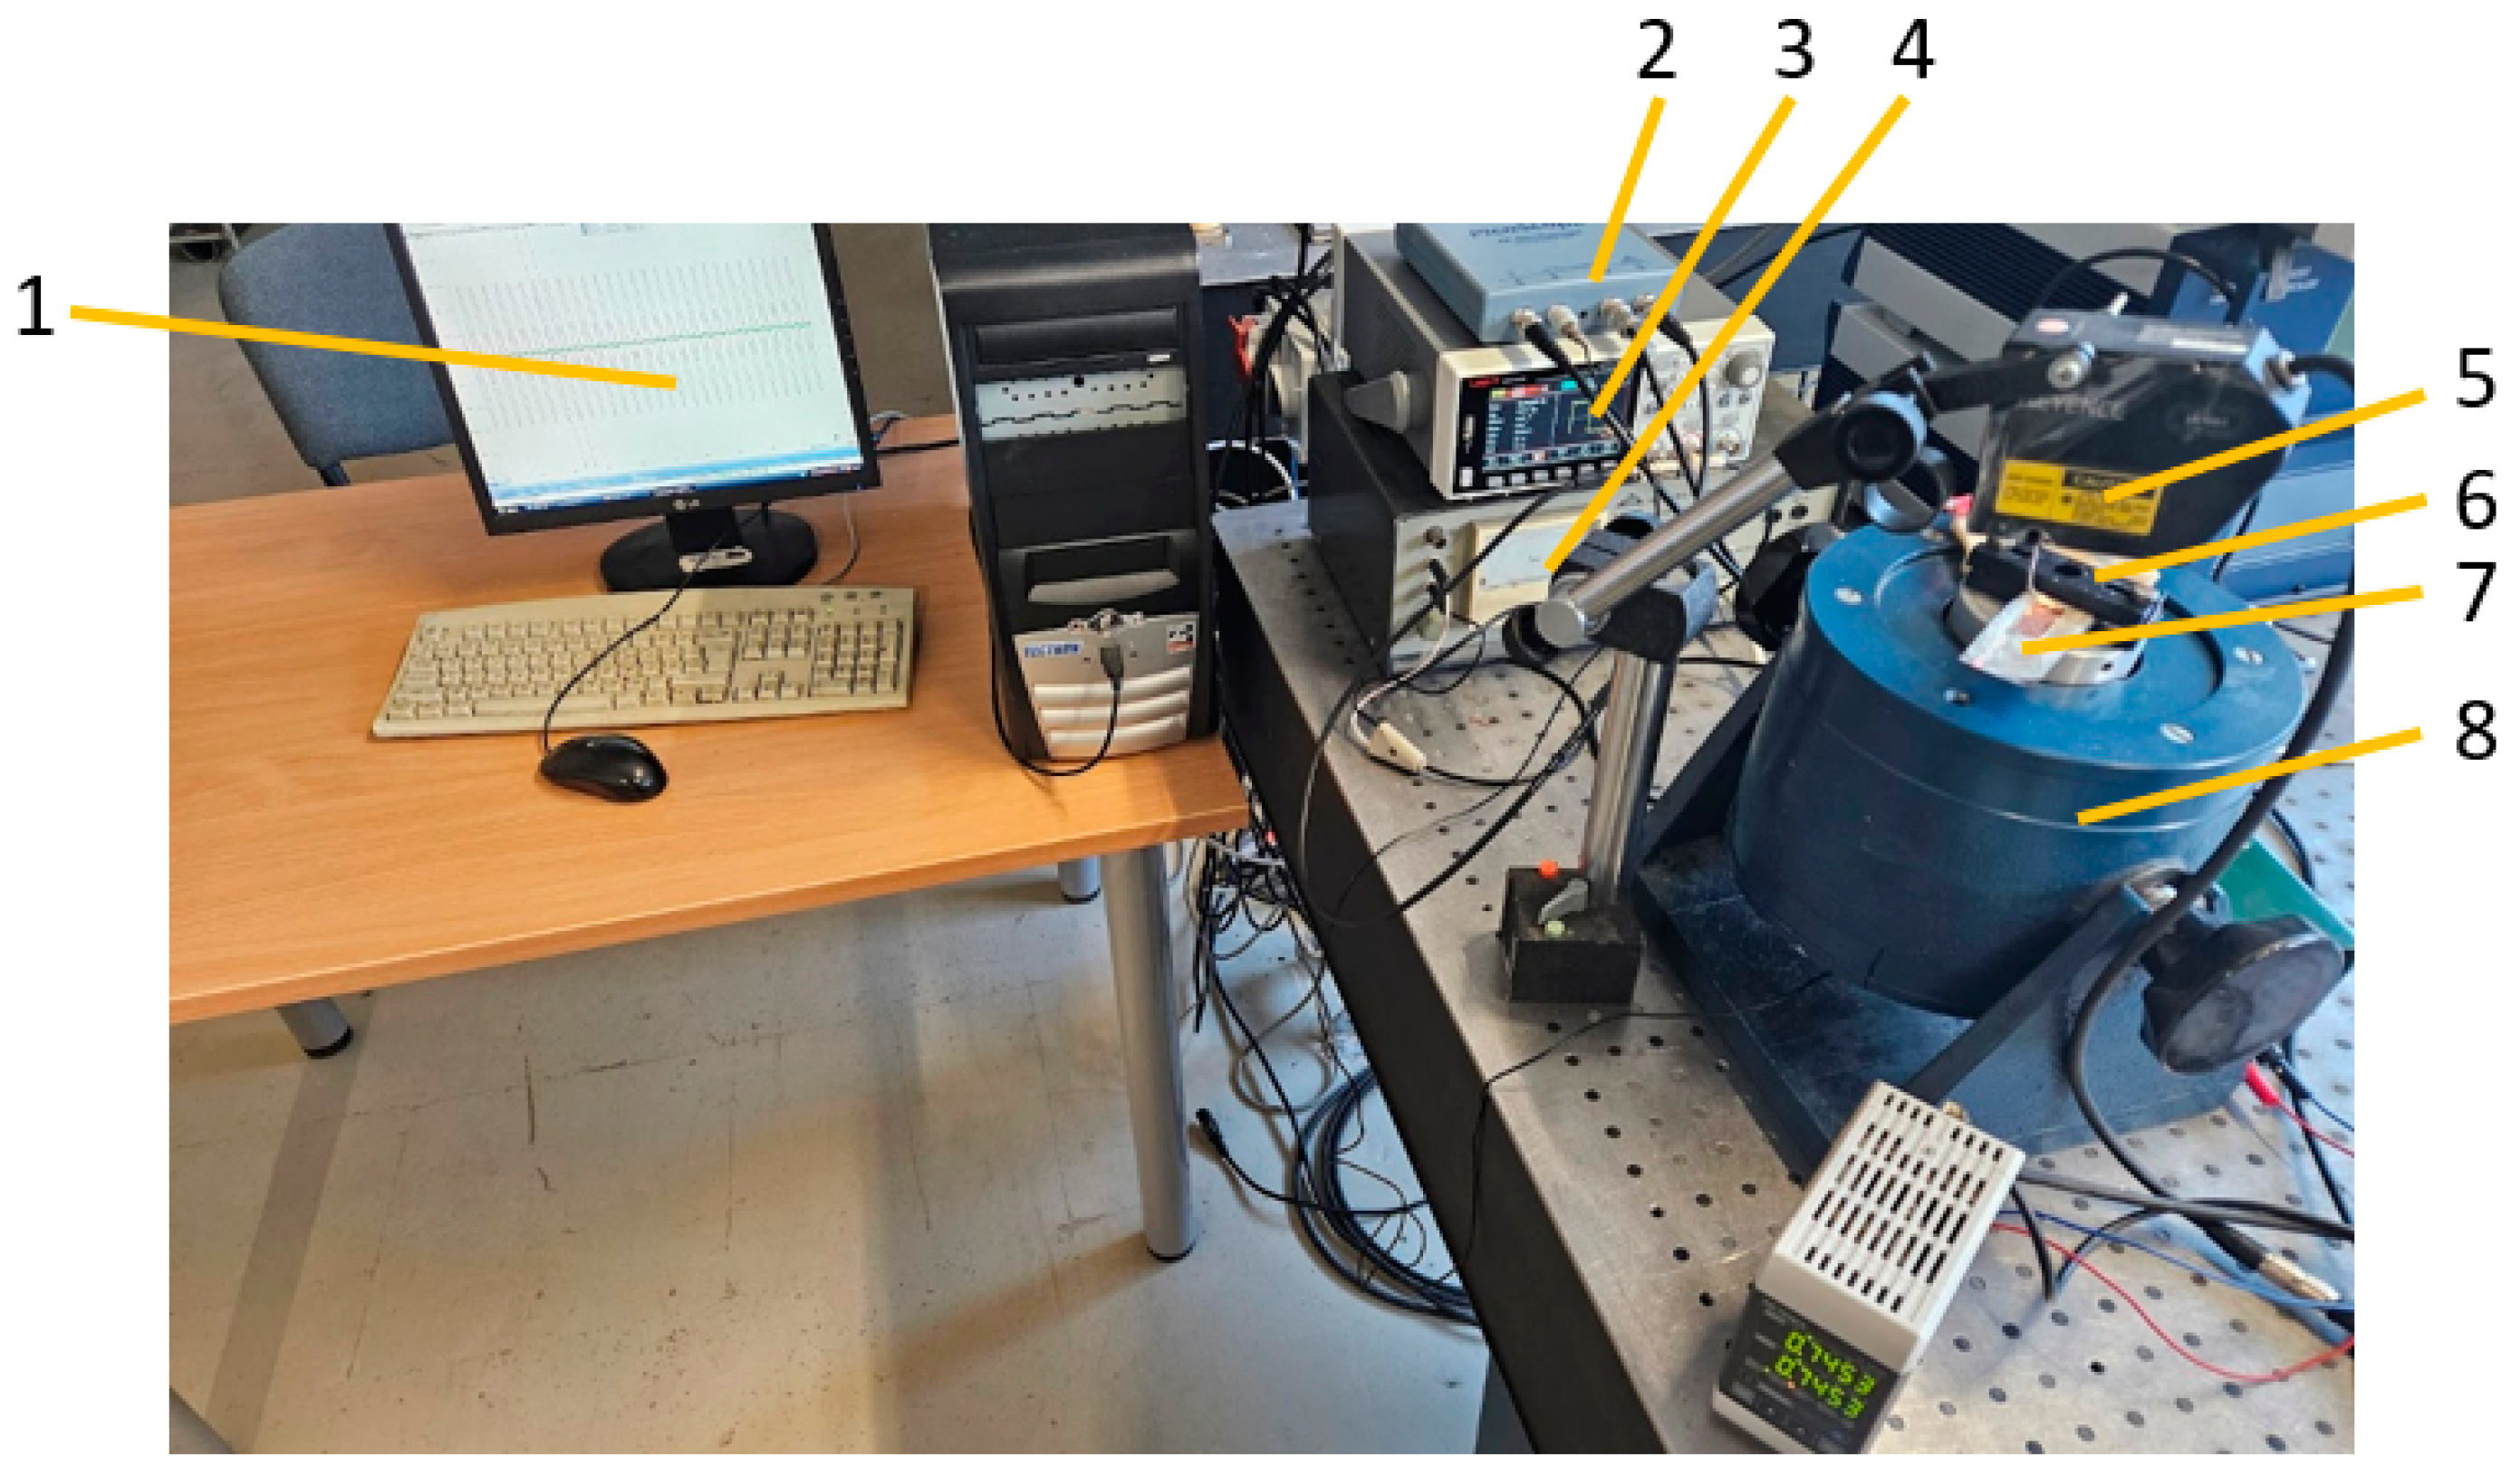
3.4. Vibration Parameters

Five metal plates were covered with different PVDF materials. Then, a thin copper film was added, and two wires were soldered, having contacts on both sides—on a metal plate and a copper plate. Insulation was checked with a multimeter; no short circuits were detected. The examples of the samples used in this research are shown in Figure 3.
The experimental setup is shown in Figure 4. The metal plate covered with PVDF materials and copper film (7) was fixed to vibrator 8 using clamps 6. Signal generator 3 and signal amplifier 4 were used to create a sinusoidal signal for the vibrator. The vibration accelerometer KD35 (RFT GmbH, Schwabmünchen, Germany) (not shown in the figure) was used to detect the vibration parameters. The laser distance meter (Keyence) 5 was used to obtain the amplitude of the vibration of the metal plate and its end. PicoScope 3424 oscilloscope 2 was used to obtain the information from three sensors. It was connected to personal computer 1, and the data were analyzed using the software package PicoScope 6.14.69.

3.5. Hydrophilicity Parameters

Measurements of the contact angle were used to assess the samples’ wettability and surface free energy. To enhance the electrical properties of the prepared samples and investigate the intermolecular communication between the liquid analyte and the piezoelectric solid surface, it is crucial to understand the wetting behavior of solvents on solid surfaces. The balance between adhesion and cohesion is determined via the wetting intensity [29].
The effect of increasing the electrical conductivity and hydrophilicity of the material composite through inserting silver-impregnated activated carbon powder and functionalized carbon nanotubes on the electrosorption capacity of the electrodes was investigated.
The contact angles of the PAC electrode and the silver-impregnated electrode are nearly 90°, indicating their hydrophobic nature and the absence of the role of silver impregnation in its modification. However, the contact angle of the functionalized MWCNT-incorporated electrode decreased to 82°, indicating that the incorporation of functionalized MWCNT helps to increase the hydrophilicity of the electrode. Results show that the contact angle becomes slower than the increasing electrical conductivity [30].
The broadband behavior of the complex electrical properties of glycerin–water mixtures in the frequency range 0.1–25.0 GHz was investigated. Glycerin is very versatile as a binding fluid because it is completely miscible with water, allowing the penetration to be tailored to a variety of fabric properties. Glycerin is ideal for human safety as it is non-toxic and antibacterial, and is used in many soaps, hand creams, and food products. It also becomes lossy in the 1–2.5 GHz frequency range, making it suitable for suppressing unwanted multipath signals. The true conductivity decreases monotonically with the increasing glycerin concentration at all frequencies. Also, with an increasing glycerin–water ratio, a steepening of the dispersion is observed. For frequencies above 10 GHz, the conductivity increases monotonically with the increasing frequency and water concentration. Furthermore, the slope of the variation of conductivity with frequency decreases significantly with the increasing glycerin–water ratio. The results showed that for 0.5, 2.0, and 5.0 GHz glycerin mixed with water and 0.9%, the conductivity of the water mixtures increases from low values to a maximum, and then decreases to lower values as the water content increases. Deviations between the water and saline cases begin to appear when the concentration exceeds 30% and increase when the concentration exceeds 60%. The reaction was attributed to the fact that water is almost completely bound to proteins and long-chain molecules at lower water contents, limiting the mobility of ions required for electrical conduction. Only with a higher water content are there enough free water molecules to allow ions to move [31].

4. Results

4.1. Surface Roughness Results

Figure 5 shows that Str is the correlation measurement for the surface roughness level. The surface Str roughness for sample 4 was 0.605; the Str roughness of sample 2 was the highest at 0.814. Samples 3 and 5 show the lowest results of surface roughness. It was observed that the addition of silver nitrate to the sample reduced the level of roughness of Str and Sdr.
The Sdr results showed the same trend.
The interaction between the layers of various materials, or the surface roughness, frequently has a significant impact on the characteristics of thin films. Surface roughness has an impact on a variety of material properties. Dielectric characteristics are influenced by roughness. The presence of surface roughness can complicate the electrical phenomenon. In general, less roughness is required to minimize the loss of both acoustic and optical signals.

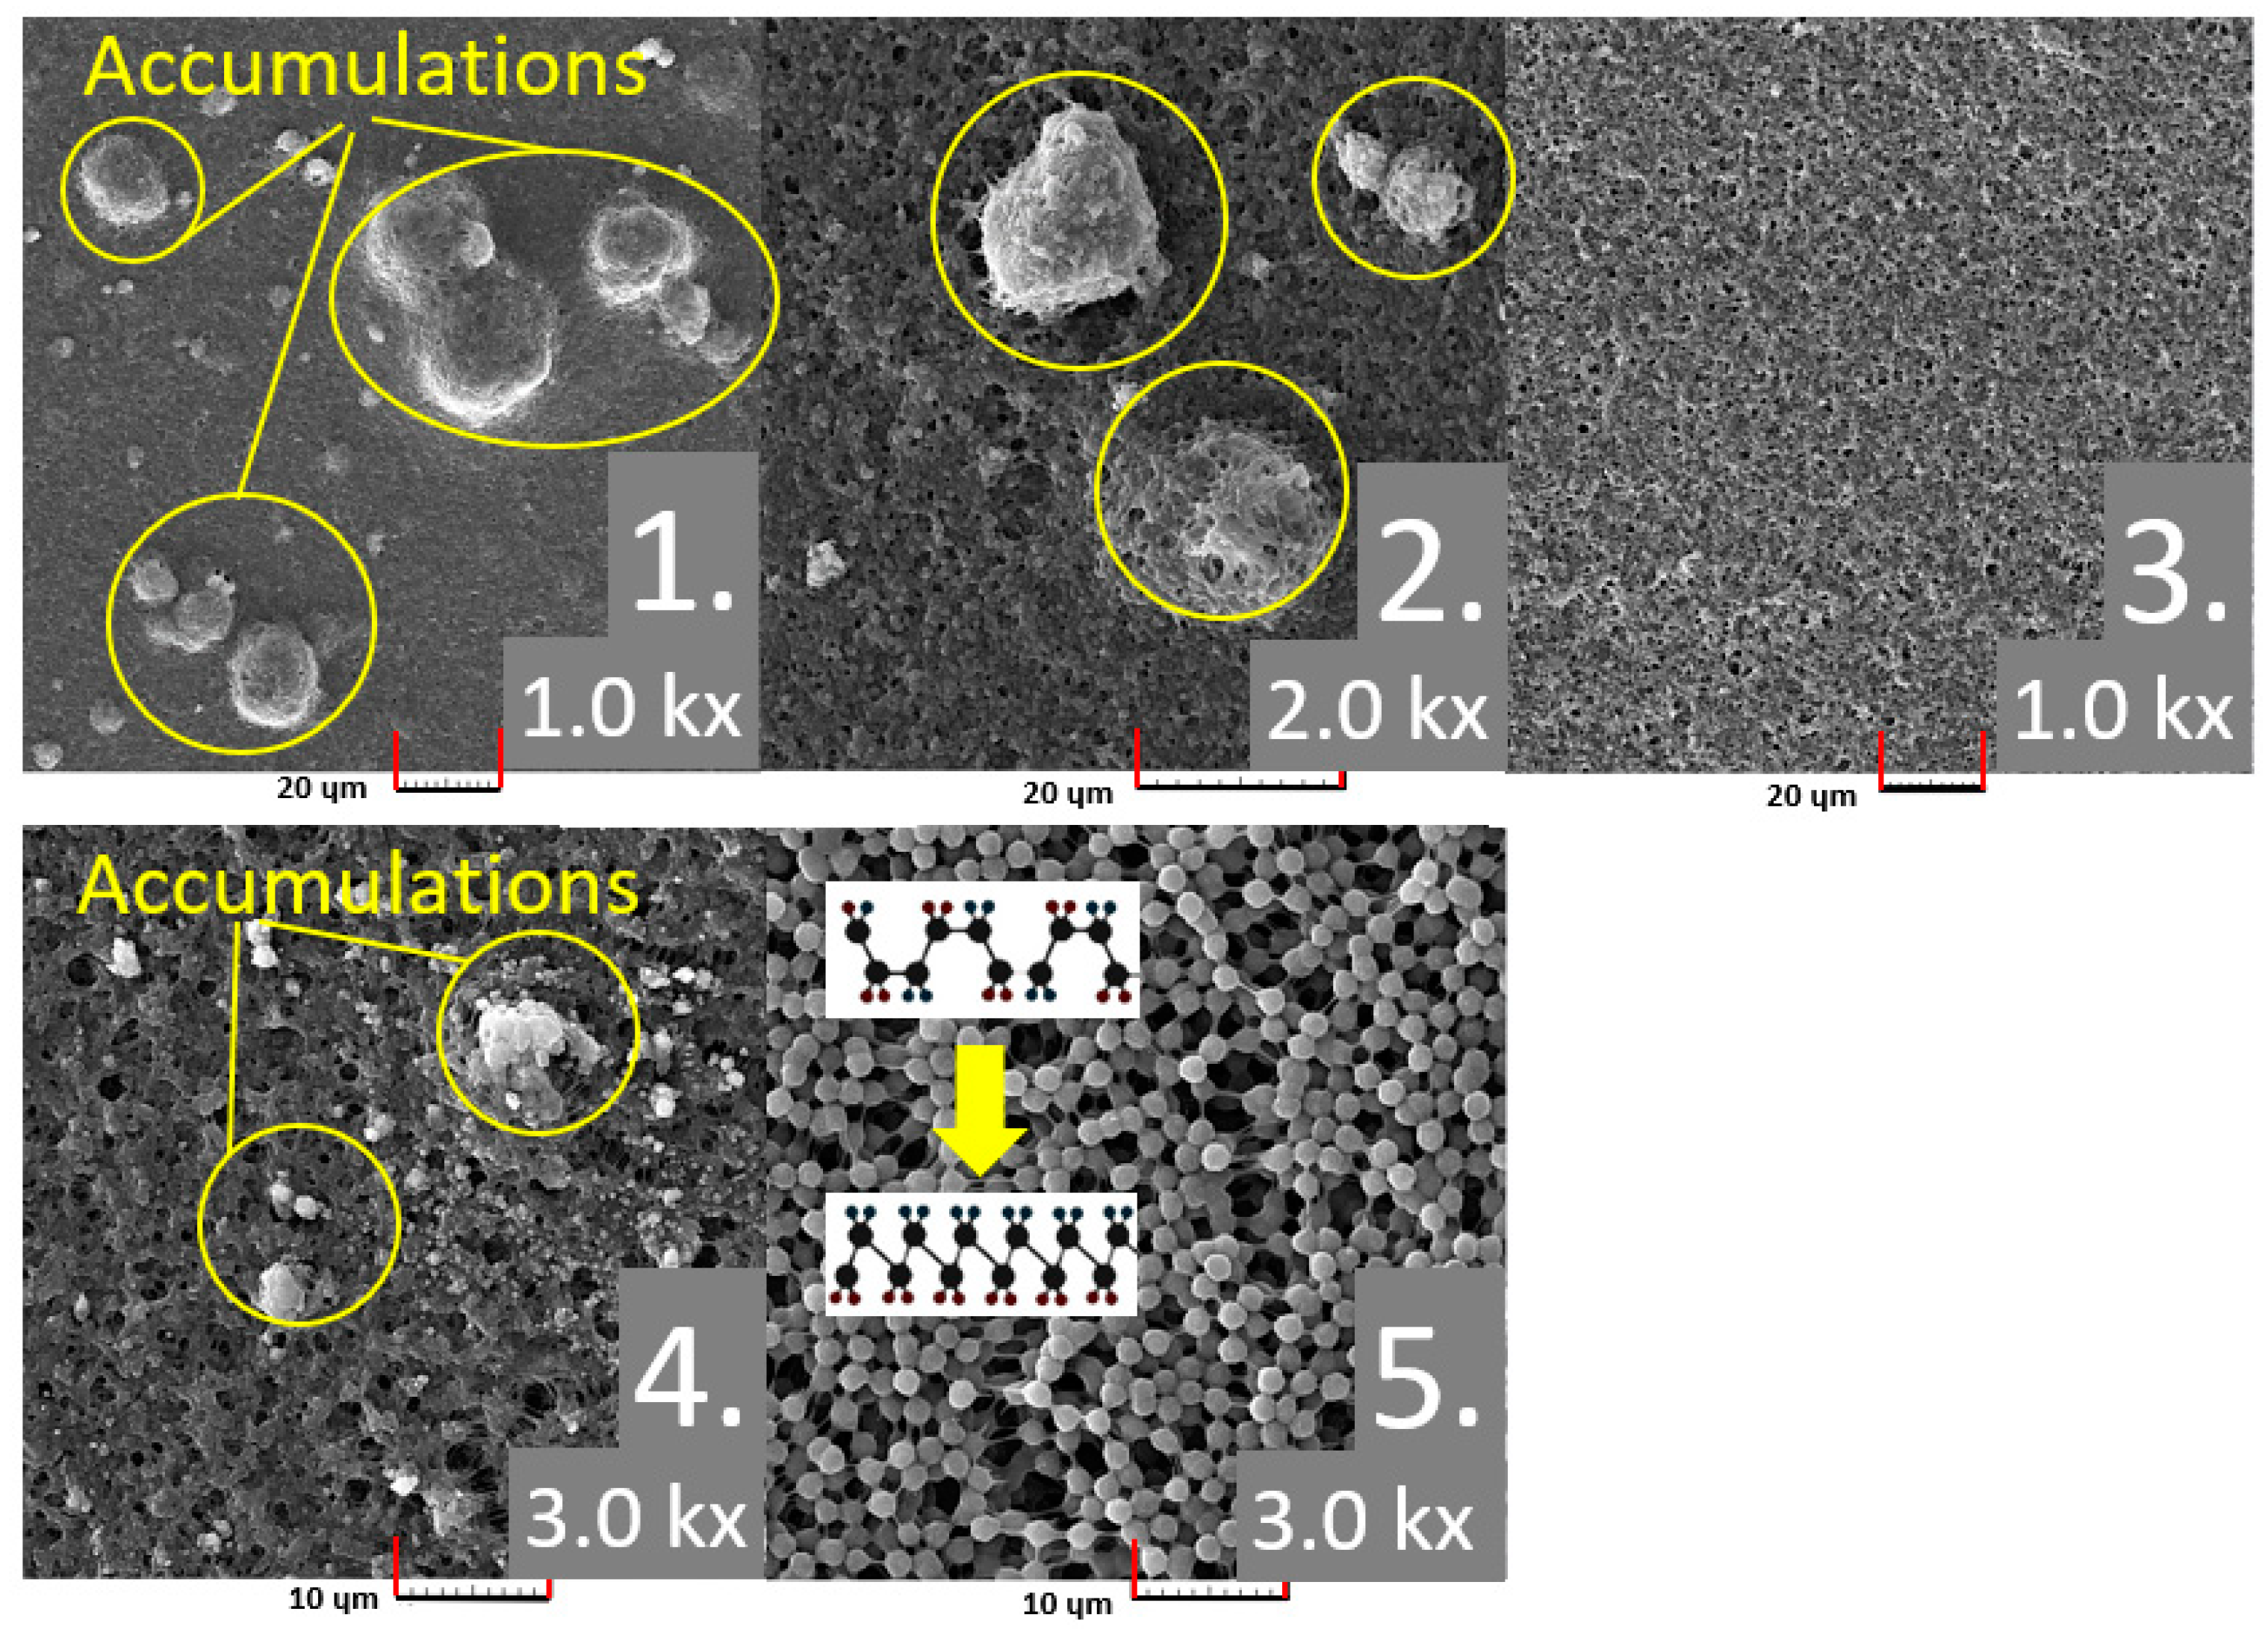
4.2. SEM Analysis and Multifractal Spectra

SEM was used to examine the samples morphologically; the resulting 3D images are shown in Figure 6. Consequently, sample 1 in Figure 6 fully illustrates HA growing on PVDF. The similar composition of samples 1 and 2 accounts for the similarity between their images. SEM images for samples 1 and 2, spherical HA with diameters of ~25 and 5 µm, respectively, can be predicted when compared to pure PVDF. Because sample 3 was prepared with a small amount of AgNO3, it should be noted that the penetration of AgNO3 in this instance was satisfactory because the particles were evenly distributed throughout the skeleton. The nuclei in sample 4 had smaller particle sizes due to the composites PVDF, HA, and AgNO3.
The use of DMSO as a solvent and the rate of evaporation may be connected to these minor variations amongst the samples, which could result in an increase in viscosity and a change in conductivity. The SEM image of Example 5 displays a uniform structure (PVDF only). In Figure 6, in sample 5, irregular porosity was added to the composites, and PVDF fiber morphology was seen. This could have something to do with the polarity characteristics and low drying temperature of the DMSO solvent that was used. This is so because DMSO is a polar solvent that mixes well with a wide range of organic solvents and dissolves both polar and non-polar substances.
The amorphous phases and the strong C–F bond dipoles of the PVDF molecular chain are rotated in this instance due to the polarity of the DMSO, which lowered the energy barrier for the formation of the extended trans conformation.
Because PVDF is in a crystalline form and the molecular chains are free to move around without a fixed structure, which adversely affects the electrical properties, an amorphous phase was created for this study. Based on the SEM images, it is known that, at low temperatures (approximately 90 °C), the reaction energy between the chains of PVDF is greater than the interaction reaction energy of PVDF DMSO. As a result, swelling occurs as the solvent permeates the amorphous region of PVDF, leaving the crystalline region essentially passive. Therefore, SEM images of samples 1, 2, 3, and 4 show evidence of vaporized DMSO in the pores. The low temperature (not too high) encourages PVDF to form the β-phase. Morphology analysis indicated that neither a high temperature nor a long-enough time were allowed for the constituent elements to crystallize.
Figure 7 represents the spectra of singularities for successively taken SEM images for samples. Several characteristic features can be observed.
Figure 7 shows multifractal spectra for different samples to illustrate the structural complexity and distribution of the material at the microscopic level. These spectra show how the local particle density moments are distributed, which has a direct influence on the heterogeneity of the material [32,33,34] in the context of the β-phase of PVDF.
The homogeneity of the particle distribution curves, being closely spaced or overlapping, indicate a homogeneous distribution of AgNO3 and HA particles in the PVDF matrix, which is desirable for uniform piezoelectric and ferroelectric properties throughout the sample.
In terms of the effects on the β-phase, this homogeneity suggests that the annealing process may have promoted the formation of an ordered β-phase, which is crucial for achieving high piezoelectric and ferroelectric activity. The stability of this phase is essential for biosensing and chemical sensing applications where a precise response to mechanical or electrical stimuli is required.
Figure 7a (100×) displays how the spectrum shows stable distributions, indicating a homogeneous structure in the sample at 100× magnification. The lack of significant fluctuations indicates that the sample preparation process resulted in a uniform distribution of nanoparticles in the matrix. Figure 7b (500×) shows a slight increase in the spectral value spectrum, which could indicate an increase in the heterogeneity of the structure at a higher magnification. This could mean that local changes in the distribution of the molecules become visible on closer inspection. In Figure 7c (500 × 2), we observe a decrease in the spectrum, indicating that the structure of the test sample has changed compared to previous samples. The decrease may indicate the agglomeration of nanoparticles or their uneven distribution, which affects the homogeneity and potential properties of the material. In Figure 7d (1000×), the spectrum returns to more stable distributions, similar to those observed in the 100× sample. This could indicate that the structure of the material is stabilizing, which could be the result of a better distribution of nanoparticles at this magnification scale. Looking at Figure 7e (2000×, 3000×, 10,000×), the further analysis of the spectrum can reveal gradual changes in the material structure due to both the sample preparation process and the effects of the added components (e.g., AgNO3, HA) on the PVDF structure. The observed differences in the multifractal spectra at these scales can provide insight into the influence of the individual components on the heterogeneity and properties of the material.
If curves are arranged close to each other, even in an overlapping direction up to down and left to right, that shows correctly distributed nano powder particles in the liquid of the sample. If changes are noticed between the shape and position of individual curves, it can be noticed that the fluid was not prepared properly. Multifractal spectra analysis is made from the SEM results. If the curves overlap each other in two directions—up and down and from left to right—this shows correctly distributed nano powder particles in the sample liquid [35]. If we can see changes in the shape and position of the individual curves, we can tell that the liquid has not been properly prepared. Now the results are not bad; the liquid was almost homogeneous. A few curves may not be in another position because we have some accumulation areas.
The results of the multifractal analysis, which are consistent singularity spectra in one diagram for each sample, are presented in Figure 7.
In Figure 6, which shows the singularity spectra of the SEM images of each sample, several characteristic features can be observed. In sample 1, where the spectra are presented, significant changes in the shape and position of individual curves can be observed. This indicates that the fluid has not been prepared well, has accumulations, or has transparent and damaged areas. The multifractal spectra of sample 2 are located close to each other, even overlapping. Figure 7 and Figure 8 show that their hmin, hmax, and h0 values are not significantly different from each other in the up–down and left-to-right directions, indicating that the nano powder particles are correctly distributed in the liquid throughout the sample. The same results are obtained in samples 3, 4, and 5 and the values are not significantly different from each other in the up–down and left-to-right directions, indicating that the nano powder particles are correctly distributed in the liquid. Some curves have different directions because the samples have some damage or transparent areas.
Figure 8 shows the numerical values presented; the smaller the hmin value, the better mixed and distributed the nano powder particles are.
Figure 8 shows the characteristic values of the multifractal spectrum (hmin, h0, hmax) and entropy changes, which provide information about the structure and complexity of the samples. The values of hmin, h0, and hmax are as follows: Low values of hmin and high values of hmax may indicate the presence of areas of high and low particle density, which influences the local heterogeneity of the sample. High values of h0 compared to hmin and hmax indicate that most of the sample area is characterized by a moderate homogeneity of particle distribution. Entropy as a measure of the disorder or complexity of a system indicates how annealing affects the structure of the β-phase. A decrease in entropy indicates a more ordered structure, which is beneficial for piezo-electric and ferroelectric properties. A high entropy may indicate an increased disordered structure, which may have a negative effect on the uniformity of the sensor properties. A stable and homogeneous β-phase is crucial for achieving optimal piezoelectric and ferroelectric properties. As the observations suggest, the annealing process is essential for promoting this phase through an appropriate distribution of AgNO3 and HA particles in the PVDF matrix. The homogeneity of the β-phase affects the consistency and reliability of the sensor’s response to stimuli. In chemical sensors, the precise detection of environmental changes is required; thus, the structural stability and homogeneity are important properties. A decrease in the hmin value in the 500 × 2 sample indicates a decrease in local homogeneity, which is consistent with the observations in Figure 8c and indicates changes in the structure of the sample. An increase in the hmax value may indicate the occurrence of regions with higher heterogeneity, which is crucial for understanding the effects of processes such as annealing on the material. Changes in entropy for individual samples reflect the degree of disorder and structural complexity. In the case of sample 500 × 2, the observed decrease in entropy with a simultaneous decrease in the hmin values may indicate that the structure becomes more ordered, but with the greater local agglomeration of particles.

4.3. Vibration Results

The data were gathered from sensors, including an accelerometer, a laser distance meter, and both contacts from our newly created sensor. Five plates with different PVDFs were experimentally analyzed. All of them were tested using the same conditions as follows: using an 11 Hz (first resonance frequency of the plate) sinusoidal signal and measuring the output signal for each of them. The results are shown in Figure 9.
As we can see from the results, our newly created functional elements are working and can detect vibrations. The functional element from PVDF can generate the smallest signal, only 17.18 mV. Sample 2 (PVDF/0.1HA) can generate a slightly higher signal at 19.46 mV. The functional element PVDF/AgNO3 can generate a 20.83 mV amplitude signal, and the functional element PVDF/HA/AgNO3 could generate the highest signal at 21.56 mV. From this, we could conclude that the functional element PVDF/HA/AgNO3 generated the highest signal. Additional components, such as AgNO3 and HA, gradually increase the signal. All of them were tested under the same conditions.

4.4. EDX, XDS and Mapping Analysis

The chemical elements and their concentrations in the precursors were determined using EDX analysis, PVDF/HA/AgNO3 EDX spectra (sample 4, Figure 10), and the chemical element semi-quantitative ratio. Furthermore, it was verified that the composite structure is free of impurities. The extracted values of the EDX and mapping analyses show the elements’ homogeneous distribution. Additionally, the EDX analysis shows the presence of chemical elements such as C, O, F, Ca, and Ag, which amply demonstrates the effectiveness of the sample preparation. Slight variations in the values verify that the components were taken into consideration when creating the composites. As expected, there is an especially strong fluorine peak coming from PVDF (sample 4).
The presence of chemical elements such as Ca and Ag is detected in the EDX analysis, which clearly indicates the successful preparation of the samples and their presence in the sample. Figure 11 shows the Ag (a) component and the CA (b) component distribution on the surface of the sample.
Figure 12 shows the results of the XRD of sample 4 (PVDF/HA/AgNO3). Sample 4 PVDF, HA, and AgNO3 showed a mixed amorphous and crystalline phase, which can be attributed to the use of HA as reinforcement. This may be due to the weak C=O…H-C hydrogen bonds, both of which interfere with PVDF/HA interchain forces when the phases are mixed. A sharp peak at 2θ = 31.50° is attributed to HA, thus supporting the evidence for HA. Due to the existence of an amorphous phase throughout, the AgNO3 peak positions between 15° and 28°. The AgNO3 peaks exist due to the overlap of this amorphous region. Nevertheless, the existence of AgNO3 can be investigated using X-ray EDX analysis, which is presented in Figure 10.

4.5. Hydrophilicity Analysis

The average angles between spin-coated samples on the solid film and a drop of water and glycerin are displayed in Figure 13. The water measurement’s average angle values (θ Young) varied from 51.73° to 61.78°, with sample 2, which was spin-coated on the film, having the lowest angle. The glycerin measurement’s average angle values (θ Young) varied from 52.68° to 60.22°, with samples 3 and 2, that which were spin-coated on the film, having the lowest angle. For every sample, good wetting can be reported if θ is less than 90°. It has been demonstrated that sample 2 has the highest surface energy and agrees with the liquid more closely than the other samples.

5. Conclusions

The characteristics of PVDF, HA, and silver nitrate make them ideal materials for biosensor and chemical sensor applications. Polyvinylidene fluoride (PVDF) polymer was selected to create the functional element because of its well-known exceptional mechanical, ferroelectric, and biocompatibility qualities. Furthermore, hydroxyapatite and silver nitrate were chosen for their innovative and sensor-friendly qualities. For the thin film preparation, the non-toxic solvent DMSO and the solvent casting technique were selected.
The surface quality of the thin film was examined, and it was observed that the addition of silver nitrate to the sample reduced the level of roughness of the Str and Sdr. The Str results showed the same trend.
Based on the SEM images, it is known that, at low temperatures (approximately 90 °C), the reaction energy between the chains of PVDF is greater than the interaction reaction energy of PVDF DMSO. Morphology analysis indicated that neither a high temperature nor a long-enough time were allowed for the constituent elements to crystallize.
The mapping and EDX presence of chemical elements such as Ca and Ag are detected in the EDX analysis, which clearly indicates the successful preparation of the samples and their presence in the sample. XRD analysis confirmed the amorphous phase in the film.
For vibration measurements, an accelerometer was used to detect the vibration parameters. Components such as AgNO3 and HA gradually increase the signal.
The hydrophilicity shows that sample 2 has the highest surface energy and agrees with the liquid more closely than the other samples. Hydrophilicity can have an effect on electrical conductivity. Water can increase the charge transfer with a higher hydrophilicity, which means that sample 5 (PVDF), when in contact with water, has the lowest potential for electrical charge transfer. Samples with added silver and hydroxyapatite have a greater effect when the functional element is in contact with water. Glycerin, on the other hand, inhibits the conduction of electrical blood, but the results remain similar, and the addition of additional phases such as silver and hydroxyapatite may have a dampening effect on hydrophobicity.
Multifractal analysis provides unique information about the structural complexity of samples at the microscopic level. The variations in the multifractal spectra indicate that the annealing process and the addition of AgNO3 and HA affect the PVDF microstructure in a way that can increase or decrease its complexity. High structural complexity may be advantageous in chemical or biosensing applications where a high sensor sensitivity to different stimuli is required.
The numerical values of hmin, hmax, and h0 show and confirm the liquid preparation quality, which may be influenced by the fact that the nanoparticles of HA affect liquid preparation and that hard particles are not distributed so well. Incorporating AgNO3 into the sample can help prepare better liquid solutions.
The vibration test also showed that adding an additional phase, such as silver or hydroxyapatite, increases the electrical response. Therefore, the functional element has potential for sensory applications.

Author Contributions

Conceptualization, I.M. and G.J.; methodology, I.M. and D.P.; software, D.P. and J.A.; validation, A.P., D.P. and G.J.; formal analysis, I.M. and S.U.; investigation, I.M., J.A., A.P. and J.V.; resources, I.M.; writing—original draft preparation, I.M.; writing—review and editing, I.M., S.U., G.J., J.V., D.P., J.A. and A.P.; visualization, I.M., D.P., J.V. and J.A.; supervision, G.J. All authors have read and agreed to the published version of the manuscript.

Funding

This research was funded by the Research Council of Lithuania (LMTLT), agreement No S-PD-24-32.

Institutional Review Board Statement

Not applicable.

Informed Consent Statement

Not applicable.

Data Availability Statement

Data are contained within the article.

Conflicts of Interest

The authors declare no conflicts of interest.

References

  1. Song, G.; Wang, Y.; Tan, D.Q. A review of surface roughness impact on dielectric film properties. IET Nanodielectr. 2021, 5, 1–23. [Google Scholar] [CrossRef]
  2. Al Rashid, A.; Khan, S.A.; Al-Ghamdi, S.G.; Koç, M. Additive manufacturing of polymer nanocomposites: Needs and challenges in materials, processes, and applications. J. Mater. Res. Technol. 2021, 14, 910–941. [Google Scholar] [CrossRef]
  3. Smirnov, A.; Chugunov, S.; Kholodkova, A.; Isachenkov, M.; Vasin, A.; Shishkovsky, I. Progress and challenges of 3D-printing technologies in the manufacturing of piezoceramics. Ceram. Int. 2021, 47, 10478–10511. [Google Scholar] [CrossRef]
  4. Ribeiro, A.; Vaz, L.; Guastaldi, A.; Campos, J. Adhesion strength characterization of PVDF/HA coating on cp Ti surface modified by laser beam irradiation. Appl. Surf. Sci. 2012, 258, 10110–10114. [Google Scholar] [CrossRef]
  5. Lu, L.; Ding, W.; Liu, J.; Yang, B. Flexible PVDF based piezoelectric nanogenerators. Nano Energy 2020, 78, 105251. [Google Scholar] [CrossRef]
  6. Dashtizad, S.; Alizadeh, P.; Yourdkhani, A. Improving piezoelectric properties of PVDF fibers by compositing with BaTiO3-Ag particles prepared by sol-gel method and photochemical reaction. J. Alloy. Compd. 2021, 883, 160810. [Google Scholar] [CrossRef]
  7. Ambrožová, N.; Zálešák, B.; Ulrichová, J.; Čížková, K.; Galandáková, A. Low concentrations of silver nanoparticles have a beneficial effect on wound healing in vitro. J. Nanopart. Res. 2017, 19, 108. [Google Scholar] [CrossRef]
  8. Deshmukh, S.P.; Patil, S.M.; Mullani, S.B.; Delekar, S.D. Silver nanoparticles as an effective disinfectant: A review. Mater. Sci. Eng. C 2019, 97, 954–965. [Google Scholar] [CrossRef]
  9. Pokhel, S. Hydroxyapatite: Preparation, Properties and Its Biomedical Applications. Adv. Chem. Eng. Sci. 2018, 8, 87542. [Google Scholar] [CrossRef]
  10. Roopaa, T.; Murthy, H.N.; Kumar, V.P.; Krishna, M. Development and Characterization of PVDF Thin Films for pressure sensors. Mater. Today Proc. 2018, 5, 21082–21090. [Google Scholar] [CrossRef]
  11. Tandon, B.; Kamble, P.; Olsson, R.T.; Blaker, J.J.; Cartmell, S.H. Fabrication and Characterisation of Stimuli Responsive Piezoelectric PVDF and Hydroxyapatite-Filled PVDF Fibrous Membranes. Molecules 2019, 24, 1903. [Google Scholar] [CrossRef] [PubMed]
  12. Zhang, L.; Xiao, D.; Ma, J. Dielectric Properties of PVDF/Ag/BaTiO3Composites. Ferroelectrics 2013, 455, 77–82. [Google Scholar] [CrossRef]
  13. Malherbi, M.S.; Dias, L.C.; Lima, M.S.; Ribeiro, L.G.; Freitas, V.F.; Bonadio, T.G.; Silva, L.M.; Souza, G.B.; Volnistem, E.A.; Rosso, J.M.; et al. Electrically stimulated bioactivity in hydroxyapatite/β-tricalcium phosphate/polyvinylidene fluoride biocomposites. J. Mater. Res. Technol. 2022, 20, 169–179. [Google Scholar] [CrossRef]
  14. Li, X.; Wang, Y.; He, T.; Hu, Q.; Yang, Y. Preparation of PVDF flexible piezoelectric film with high β-phase content by matching solvent dipole moment and crystallization temperature. J. Mater. Sci. Mater. Electron. 2019, 30, 20174–20180. [Google Scholar] [CrossRef]
  15. Satapathy, S.; Pawar, S.; Gupta, P.K.; Varma, K.B.R. Effect of annealing on phase transition in poly(vinylidene fluoride) films prepared using polar solvent. J. Indian Acad. Sci. 2011, 34, 727–733. [Google Scholar] [CrossRef]
  16. Parida, A.; Swain, S.; Sahu, R.; Negi, R.R. Phase formation and electrical properties study of PVDF thick films synthesized by solution casting method. Int. J. Mater. Res. 2023, 114, 344–350. [Google Scholar] [CrossRef]
  17. Hari, M.A.; Rajan, L.; Subash, C.; Varghese, S. Effect of nanoparticle size on the piezoelectric properties of PVDF based nanocomposite thin films. Mater. Today Proc. 2021, 46, 5781–5784. [Google Scholar] [CrossRef]
  18. Xie, L.; Wang, G.; Jiang, C.; Yu, F. Properties and Applications of Flexible Poly(Vinylidene Fluoride)-Based Piezoelectric Materials. Crystals 2021, 11, 644. [Google Scholar] [CrossRef]
  19. Kuang, X.; Liu, Z.; Zhu, H. Dielectric properties of Ag@C/PVDF composites. J. Appl. Polym. Sci. 2013, 129, 3411–3416. [Google Scholar] [CrossRef]
  20. Su, Y.; Gu, Y.; Li, H.; Geng, F. Ag-NBCTO-PVDF composites with enhanced dielectric properties. Mater. Lett. 2016, 185, 208–210. [Google Scholar] [CrossRef]
  21. Choi, J.; Lee, M.; Kim, T.; Sim, J.H.; Lee, W.B.; Kim, Y.; Kang, C.P.Y. High β-phase Poly(vinylidene fluoride) Using a Thermally Decomposable Molecular Splint. Adv. Electron. Mater. 2022, 9, 2200279. [Google Scholar] [CrossRef]
  22. Fritz, S.E.; Kelley, T.W.; Frisbie, C.D. Effect of Dielectric Roughness on Performance of Pentacene TFTs and Restoration of Performance with a Polymeric Smoothing Layer. J. Phys. Chem. B 2005, 109, 10574–10577. [Google Scholar] [CrossRef]
  23. Zhengkun, Y.; Yilei, Z. Recognizing tactile surface roughness with a biomimetic fingertip: A soft neuromorphic approach. Neurocomputing 2017, 244, 102–111. [Google Scholar] [CrossRef]
  24. Yi, Z.; Zhang, Y.; Peters, J. Bioinspired tactile sensor for surface roughness discrimination. Sens. Actuators A Phys. 2017, 255, 46–53. [Google Scholar] [CrossRef]
  25. Suh, A.Y.; Polycarpou, A. Effect of Molecularly Thin Lubricant on Roughness and Adhesion of Magnetic Disks Intended for Extremely High-Density Recording. Tribol. Lett. 2003, 15, 365–376. [Google Scholar] [CrossRef]
  26. Xie, J.; Qiao, Y.; Wang, Z.; Qi, Y.; Xu, Q.; Shemtov-Yona, K.; Chen, P.; Rittel, D. Application of the Taguchi method to areal roughness-based surface topography control by waterjet treatments. Appl. Surf. Sci. Adv. 2024, 19, 100548. [Google Scholar] [CrossRef]
  27. Krupiński, M.; Wawrzaszek, A.; Drzewiecki, W.; Jenerowicz, M.; Aleksandrowicz, S. What Can Multifractal Analysis Tell Us about Hyperspectral Imagery. Remote Sens. 2020, 12, 4077. [Google Scholar] [CrossRef]
  28. Krzyszczak, J.; Baranowski, P.; Zubik, M.; Kazandjiev, V.; Georgieva, V.; Sławiński, C.; Siwek, K.; Kozyra, J.; Nieróbca, A. Multifractal characterization and comparison of meteorological time series from two climatic zones. Theor. Appl. Clim. 2019, 137, 1811–1824. [Google Scholar] [CrossRef]
  29. Xiao, B.; Rutherford, G.N.; Sharma, A.P.; Pradhan, S.K.; Bonner, C.E.; Bahoura, M.J. Surface Modification and Charge Injection in a Nanocomposite of Metal Nanoparticles and Semiconductor Oxide Nanostructures. Sci. Rep. 2020, 10, 4743. [Google Scholar] [CrossRef] [PubMed]
  30. Alencherry, T.; Naveen, A.R.; Ghosh, S.; Daniel, J.; Venkataraghavan, R. Effect of increasing electrical conductivity and hydrophilicity on the electrosorption capacity of activated carbon electrodes for capacitive deionization. Desalination 2017, 415, 14–19. [Google Scholar] [CrossRef]
  31. Meaney, P.M.; Fox, C.J.; Geimer, S.D.; Paulsen, K.D. Electrical Characterization of Glycerin: Water Mixtures: Implications for Use as a Coupling Medium in Microwave Tomography. IEEE Trans. Microw. Theory Tech. 2017, 65, 1471–1478. [Google Scholar] [CrossRef] [PubMed]
  32. Yao, B.; Imani, F.; Sakpal, A.; Reutzel, E.W.; Yang, H. Multifractal analysis of image profiles for the characterization and detection of defects in additive manufacturing. J. Manuf. Sci. Eng. 2017, 140, 031014. [Google Scholar] [CrossRef]
  33. Imani, F.; Yao, B.; Chen, R.; Rao, P.; Yang, H. Joint Multifractal and Lacunarity Analysis of Image Profiles for Manufacturing Quality Control. J. Manuf. Sci. Eng. 2019, 141, 044501. [Google Scholar] [CrossRef]
  34. Chen, Y.; Yang, H. Numerical simulation and pattern characterization of nonlinear spatiotemporal dynamics on fractal surfaces for the whole-heart modeling applications. Eur. Phys. J. B 2016, 89, 181. [Google Scholar] [CrossRef]
  35. Augustyniak, J.; Zgłobicka, I.; Kurzydłowski, K.; Misiak, P.; Wilczewska, A.Z.; Gluch, J.; Liao, Z.; Perkowski, D.M. Characterization of nanofluids using multifractal analysis of a liquid droplet trace. Sci. Rep. 2022, 12, 11111. [Google Scholar] [CrossRef]
Figure 1. Molecular structure of the α-, β-, and γ-phases of PVDF.
Jcs 08 00240 g001
Figure 2. Solvent casting and preparation process.
Jcs 08 00240 g002
Figure 3. Four metal plates covered with different PVDF materials with copper film and contacts.
Jcs 08 00240 g003
Figure 4. Experimental setup: 1—personal computer, 2—PicoScope 3424 oscilloscope (Pico Technology, Cambridgeshire, UK), 3—signal generator UNI-T UTG1022X (Uni-Trend Technology Ltd., China), 4—signal amplifier VEB Metro LV103, 5—LK-G82 laser distance meter (Keyence, Elmwood Park, NJ, USA), 6—clamps, 7—metal plate covered with PVDF materials and copper film, 8—vibrator.
Jcs 08 00240 g004
Figure 5. Str—texture aspect ratio (yellow) and Sdr—developed interfacial area ratio (green).
Jcs 08 00240 g005
Figure 6. SEM analysis of samples (yellow, marked accumulations areas).
Jcs 08 00240 g006
Figure 7. Graphs showing multifractal spectra for individual images (left column pure spectra, right column spectra with approximated polynomial curve to determine hmin, h0, and hmax values): (a) sample a; (b) sample b; (c) sample c; (d) sample d; (e) sample e.
Jcs 08 00240 g007aJcs 08 00240 g007b
Figure 8. Graphs showing the juxtaposition of three important points on the multifractal spectrum: hmin, h0, and hmax and a graph showing the change in entropy with each magnification: (a) sample a; (b) sample b; (c) sample c; (d) sample d; (e) sample e.
Jcs 08 00240 g008aJcs 08 00240 g008b
Figure 9. Data were gathered from three sensors: accelerometer (1), laser distance meter (2), and both contacts from our created sensor (3). (a)—signals using 1st newly created sensor, (b)—signals using 2nd newly created sensor, (c)—signals using 3rd newly created sensor, (d)—signals using 4th newly created sensor, (e)—signals using 5th newly created sensor.
Jcs 08 00240 g009aJcs 08 00240 g009bJcs 08 00240 g009c
Figure 10. The EDX curve of sample 4 (PVDF/HA/AgNO3—sample 4).
Jcs 08 00240 g010
Figure 11. Mapping results of sample 4 (PVDF/HA/AgNO3). (a) Ag and (b) Ca.
Jcs 08 00240 g011
Figure 12. X-ray diffraction of PVDF/HA/AgNO3 thin films.
Jcs 08 00240 g012
Figure 13. Droplet images and angles of the wettability of coated samples on the solid film mode (1—PVDF/0,05HA, 2—PVDF/0,1HA, 3—PVDF/AgNO3, 4—PVDF/HA/AgNO3, 5—PVDF).
Jcs 08 00240 g013
Table 1. Specimens and concentrations.
Specimen NumberPVDF in DMSOHA in DMSOAgNO3 in DMSO
(1)0.5 g/2 mL0.05 g/1 mL-
(2)0.5 g/2 mL0.1 g/1 mL-
(3)0.5 g/2 mL-0.2 g/1 mL
(4)0.5 g/2 mL0.05 g/1 mL0.2 g/1 mL
(5)0.5 g/2 mL--
Disclaimer/Publisher’s Note: The statements, opinions and data contained in all publications are solely those of the individual author(s) and contributor(s) and not of MDPI and/or the editor(s). MDPI and/or the editor(s) disclaim responsibility for any injury to people or property resulting from any ideas, methods, instructions or products referred to in the content.

