Abstract
Short carbon fiber-reinforced polymer composites are widely used in polymer extrusion additive manufacturing (AM), including large-area additive manufacturing (LAAM), due to their enhanced mechanical properties as compared to neat polymers. However, the mechanical properties of these composites depend on microstructural characteristics, including fibers and micro-voids, which are determined during processing. In this work, the correlation between fibers and micro-voids within the microstructure of LAAM polymer composites throughout various processing stages of short carbon fiber-reinforced acrylonitrile butadiene styrene (SCF/ABS) is investigated. The processing stages considered here include the incoming pellets, a single freely extruded strand, a single regularly deposited bead, and a single regularly deposited bead pressed by a mechanical roller. A high-resolution X-ray micro-computed tomography (µCT) system is employed to characterize the microstructural features in terms of the fibers (volume fraction, fiber orientation tensor) and micro-voids (volume fraction, sphericity) in the SCF/ABS samples. The results indicate that micro-voids exist within the microstructure of the SCF/ABS composite in all four stages considered here and that the micro-void volume fraction and micro-void sphericity vary among the test samples. Moreover, the results show a considerable variation in fiber orientation and fiber volume fraction within the microstructure throughout all the stages considered; however, all the samples show the highest alignment in the extrusion/print direction. Furthermore, a correlation is identified between the fiber orientation and the micro-void volume fraction within samples from all four stages considered here. This finding suggests that fibers tend to align more in the extrusion/print direction in regions with less micro-void content.
1. Introduction
Additive manufacturing in the form of polymer material extrusion (MatEx) is a commonly used AM method due to the availability of a wide variety of neat polymers, including acrylonitrile butadiene styrene (ABS), polycarbonate (PC), and polylactide (PLA), as well as carbon fiber-reinforced polymer composites [1,2,3,4]. MatEx is performed on a small scale as fused filament fabrication (FFF) and on a large scale as large-area additive manufacturing (LAAM). Unlike FFF, which uses a filament as the feed stock, LAAM employs a single screw extruder to melt polymeric pellets and deliver the molten polymer to the nozzle for 3D-printed part manufacturing [5,6]. Short carbon fibers are added to the thermoplastic polymer as reinforcement to enhance the strength and stiffness of 3D-printed parts [7]. Adding short carbon fiber to the polymer matrix increases the elastic moduli and thermal conductivity while reducing the thermal expansion, resulting in stronger and stiffer parts with less warpage and more dimensional accuracy [8]. However, adding short carbon fibers to the polymer has been shown to result in anisotropic behavior, effecting the thermal conductivity, thermal expansion coefficient, and elastic modulus within the MatEx-manufactured polymer composite, which must be addressed when defining the print path [5]. Moreover, Goh, et al. [9] reported that crack formation and propagation in polymer composites result from fiber crushing under high compressive stress, which is attributed to carbon fibers’ poor compressive strength.
The orientation of carbon fibers within the microstructure is a critical factor influencing their effectiveness as polymer matrix reinforcement [10]. The fiber orientation tensor first introduced by Advani and Tucker is commonly used to evaluate the orientation of fibers within the polymer composite microstructure [11]. Prior experimental investigations have shown that the orientation of fibers within the 3D-printed part’s microstructure is highly dependent on the manufacturing process parameters [12,13,14,15,16]. Studies have also indicated there is a difference between the fiber orientation within the polymer composites manufactured via large-scale and small-scale AM. Due to the fully developed laminar shear-dominated flow field, fibers become highly aligned along the flow direction within the composite manufactured via small-scale AM [17]. However, in large-scale AM, the extrusion screw introduces a rotational component to the flow, which results in increased variation in the fiber orientation within the 3D LAAM-printed beads [18,19]. The fiber volume fraction within short fiber polymer composites is also an essential factor affecting the microstructure and performance of the 3D-printed parts [20].
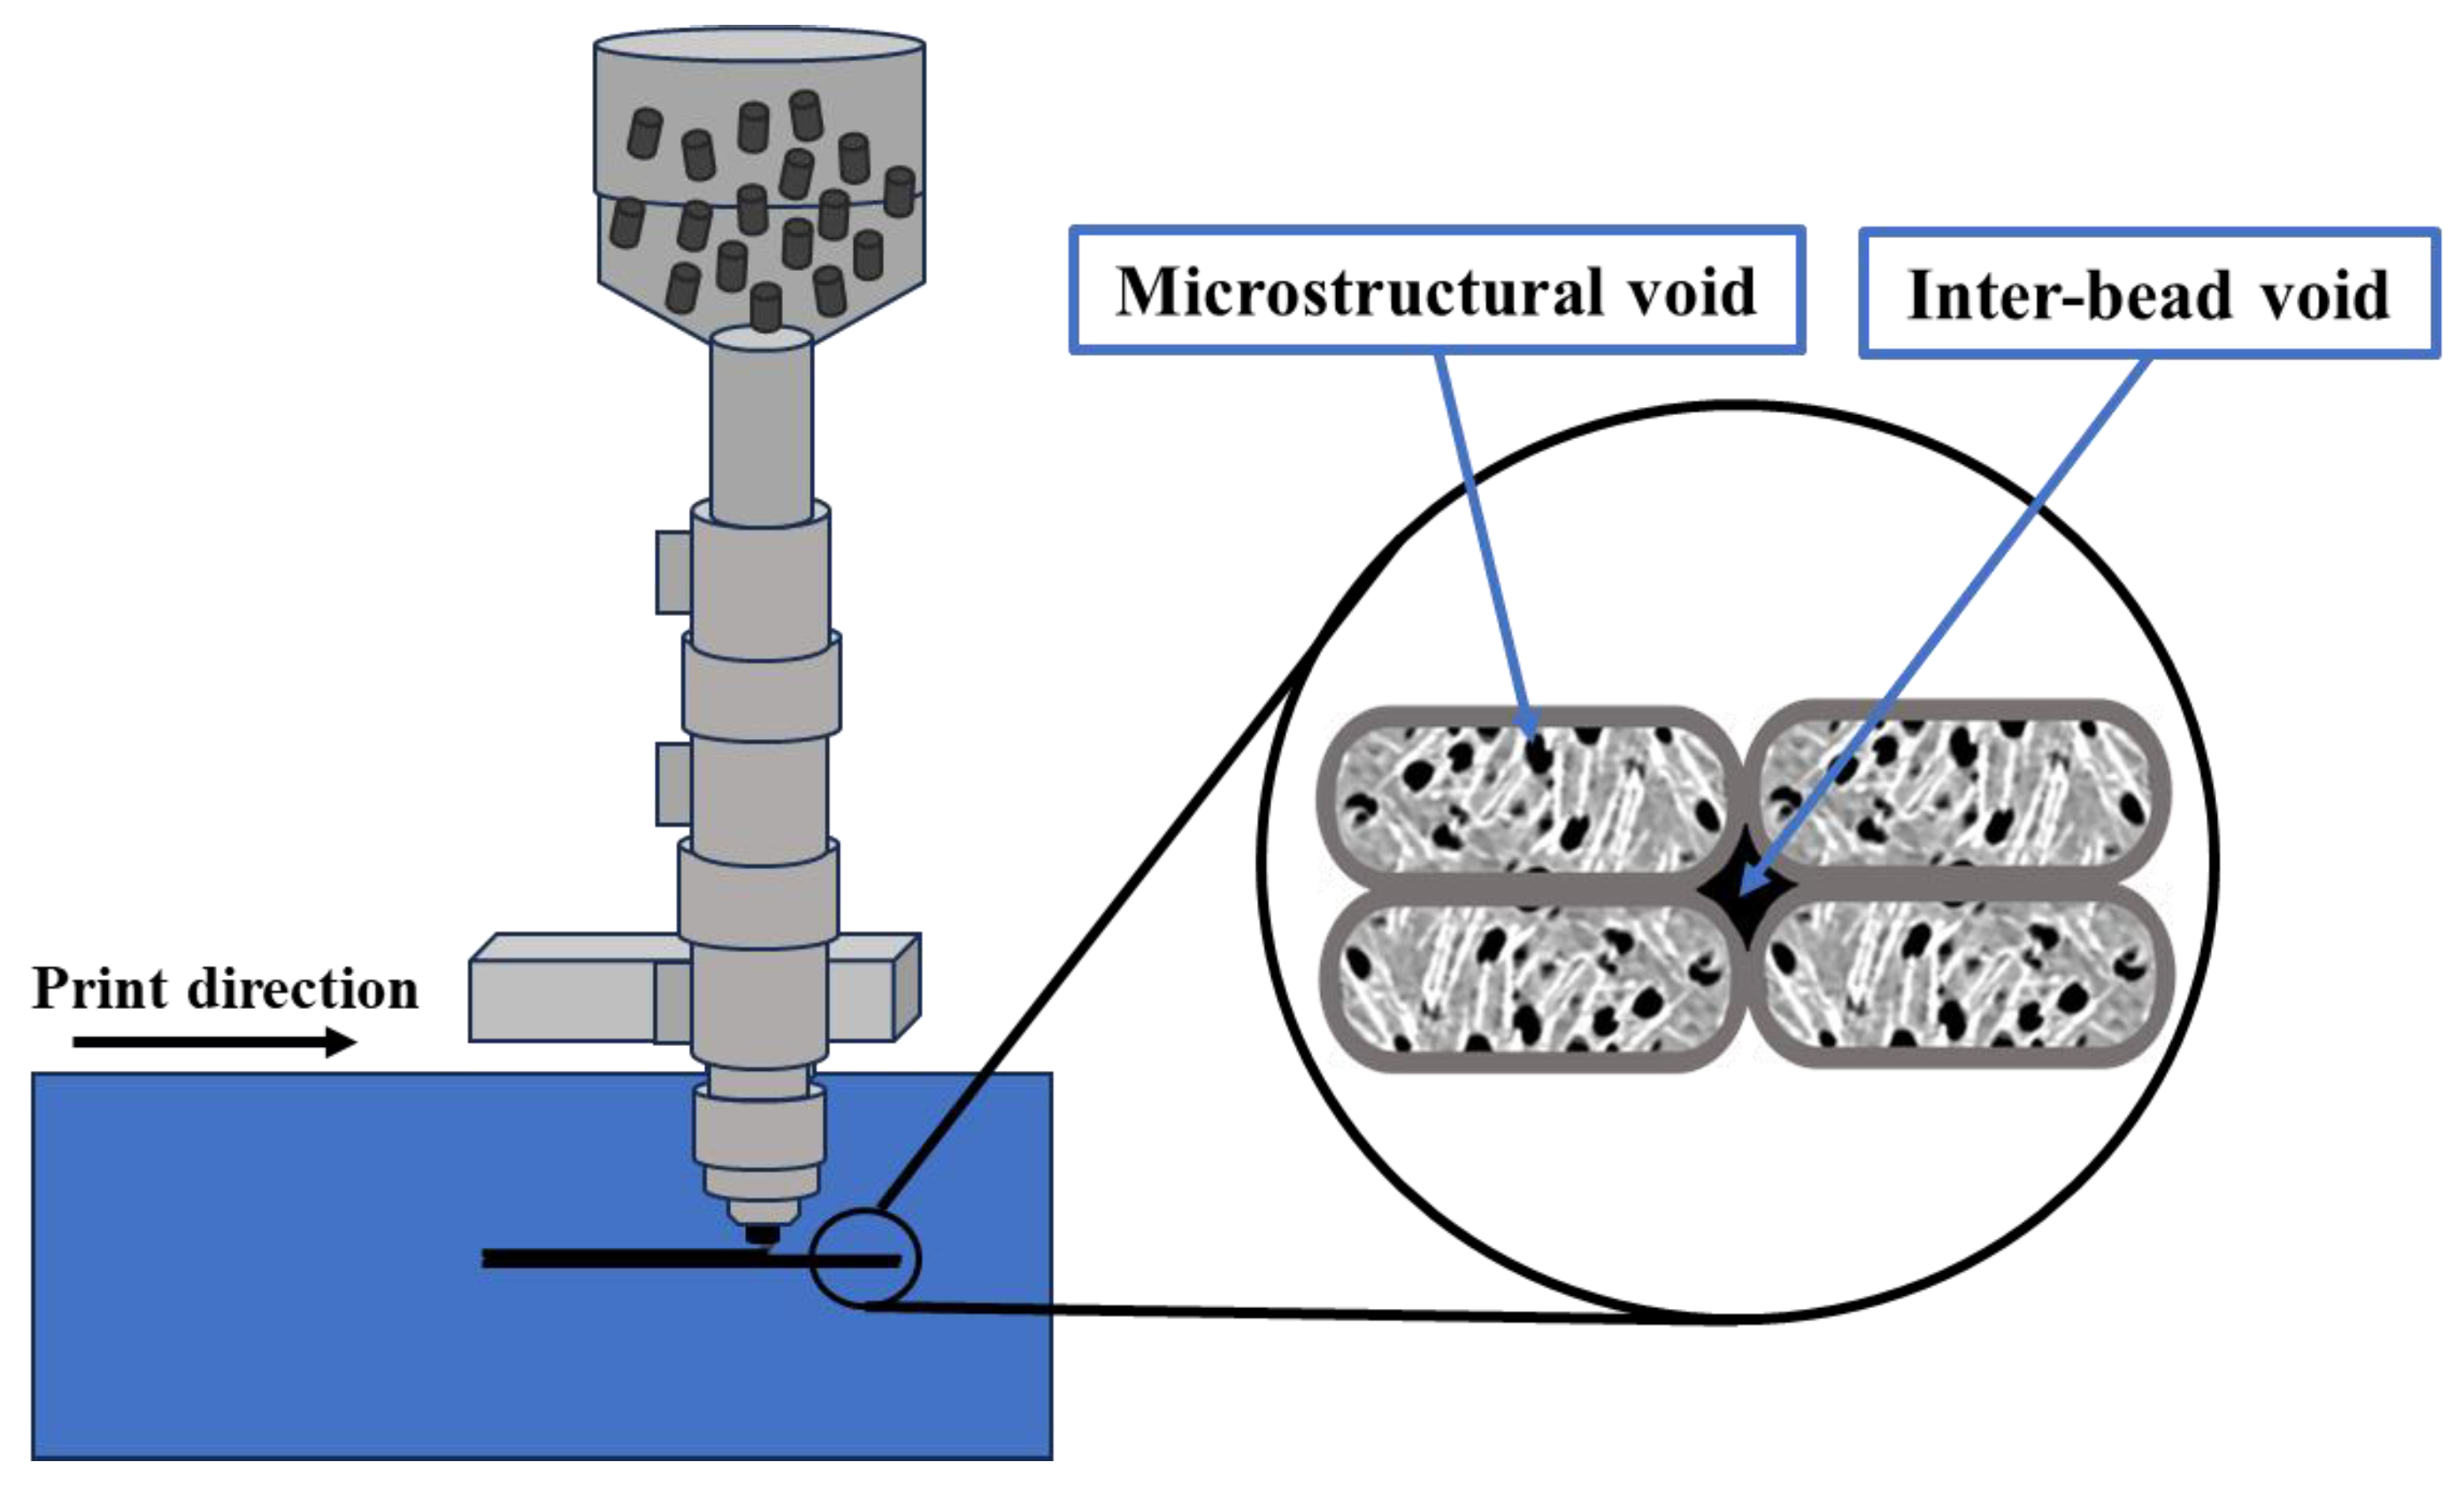
One disadvantage of using short fiber composites in MatEx is that micro-voids tend to form near the fibers within the bead microstructure. Micro-voids within MatEx beads have a significant effect on the microstructure composition and bead mechanical performance [17,21]. MatEx-produced structures have been shown to contain voids that can be categorized into two distinct types within the short carbon fiber-reinforced AM parts as shown in Figure 1: (i) inter-bead voids and (ii) microstructural voids or micro-voids (often called porosity), where the latter is the focus of this study.

Figure 1.
Voids within the short carbon fiber-reinforced polymer composite AM beads.
Inter-bead voids form due to insufficient interlayer bonding during the FFF or LAAM fabrication process. They usually appear in prismatic shapes and typically have a negative effect on the AM parts’ mechanical properties. Researchers have attempted to eliminate the inter-bead voids to enhance the properties of the 3D-printed parts [22,23]. Inter-bead voids appear in both carbon fiber-reinforced polymer composite and neat polymer manufactured parts. Conversely, micro-voids are commonly found within carbon fiber-reinforced polymer composite beads, but typically do not occur in the neat polymer microstructure under the same manufacturing conditions [17,24]. Voids are closed volumes of air within carbon fiber-reinforced polymer composites that are not filled with matrix or fiber [23]. They occur due to air entrapment during the manufacturing process and are known to be caused by the difference between the coefficient of thermal expansion between the carbon fiber and the polymer matrix [25], and uneven shrinkage related to the temperature gradient within the deposited part during the solidification step [26]. Several factors have been found to contribute to the formation of micro-voids. For example, the melt pressure reduction near the fiber ends within a shear flow may lead to void formation [27]. Voids within filament and pellets prior to their use in the additive-manufacturing process has also been investigated [28,29]. The presence of voids within the pellet feedstock is expected to impact the void characteristics through the stages of LAAM processing. Studies have shown that micro-voids, even at minimal levels, reduce the composite’s toughness, strength, and stiffness [30,31,32,33].
Investigation of the polymer composite microstructure has been performed using two-dimensional imaging techniques such as scanning electron microscopy (SEM) [34]. However, projecting 2D information to 3D is known to introduce a potential bias, which can lead to errors in the analysis results [35,36]. More recently, X-ray µCT has attracted significant attention as a non-destructive inspection technique due to its ability to provide high-resolution three-dimensional (3D) structural information. Micro-CT has been employed to characterize and quantify the microstructural features and defects within the polymer composites [37,38,39,40,41].
Despite the extensive research in the field, an understanding of the relationship between micro-voids and fibers within the microstructure of the polymer composites through various stages of the AM process is lacking. This paper aims to present an experimental study that addresses the existing gap in the field by quantifying the key microstructural features, including the fiber volume fraction, fiber orientation, void volume fraction, and void sphericity. Our goal is also to establish the relationships between these microstructural features, where they exist, within 13 wt% SCF/ABS composite through various stages of the LAAM described above.
2. Materials and Methods
2.1. Sample Preparation
The custom-built LAAM system at Baylor University was used to 3D print all the samples in this study [42]. The Baylor LAAM system is comprised of a Strangpresse Model-19 single screw extruder (Strangpresse, Youngstown, OH, USA), which has three heating zones along the length of the barrel and one on the nozzle (nozzle diameter = 3.172 mm). Thirteen (13 wt%) SCF/ABS pellets with a carbon fiber diameter of seven microns were obtained from PolyOne (Avient Corporation, Avon Lake, OH, USA), which served as the LAAM feedstock for producing the samples in our study. The SCF/ABS pellets were dried in a convection oven at 80 °C for twelve hours before producing the samples though the extrusion/deposition process. The extruder was operated at 90 revolutions per minute, providing a nominal extrusion rate of 860 /s, and the material beads were deposited onto a painter’s tape-covered aluminum print bed. To study the variation in the microstructure of SCF/ABS through different processing stages, four sample types were prepared, including those at three different stages of LAAM (pre-process, in-process, and post-process), namely:
- (i)
- SCF/ABS pellet as received to assess our incoming feedstock
- (ii)
- Single freely extruded strand to assess the effect of the LAAM extrusion process
- (iii)
- Regularly extrusion/deposited single bead to assess the effect of the LAAM extrusion/deposition process
- (iv)
- Single bead with roller compression following extrusion/deposition to assess the effect of a post-extrusion/deposition forming process
The stage (i) sample was taken from the input feedstock as received from the vendor. To manufacture the single freely extruded strand in stage (ii), the nozzle height, defined as the distance between the nozzle tip and the aluminum print bed, was increased to 155 mm, where the strand was extracted during free extrusion in the air without any stretch or compression of the strand. Conversely, to manufacture the regular deposited single bead (stage (iii)) and the roller-printed single bead (stage (iv)), the extruder’s nozzle height was set 1.2 mm above the print surface with the nozzle translation speed of 240 cm/min. To produce the stage (iv) roller-printed beads, a plastic roller with a diameter of 3 cm was placed behind the nozzle tip at a height of 1.1 mm above the print surface to partially compress the printed bead onto the tape-covered print surface. Note that the roller was sufficiently wide to cover the entire width of the bead and the extrusion/deposition parameters were the same as those used to print the stage (iii) samples. The printing process parameters employed in this study appear in Table 1. Different stages of the LAAM 3D-printing process, along with typical 2D µCT cross-sections of all four samples in this study, appear in Figure 2. Note that in all samples, the extrusion/print direction is defined as the z-direction, and for the regular and roller-printed beads, the y-direction is normal to the print surface. The dimensions of the samples in each coordinate direction are presented in Table 2.

Table 1.
LAAM processing parameters.
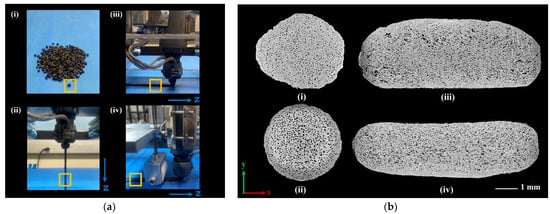
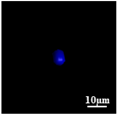
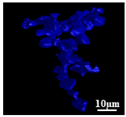
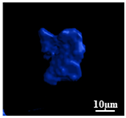
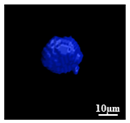
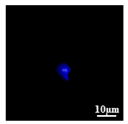
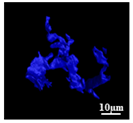
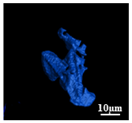
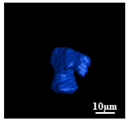
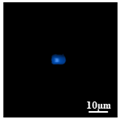
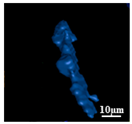
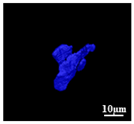
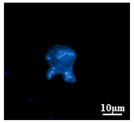
Figure 2.
(a) Different stages of the LAAM 3D-printing process; and (b) 2D µCT cross-section of four samples selected from different stages of the LAAM processing.
Table 2.
Dimensions of the samples in each coordinate direction.
2.2. µCT Image Acquisition Technique
The NSI X3000, X-ray µCT system (North Star Imaging, Rogers, MN, USA) was employed as a non-destructive inspection technique to obtain comprehensive 3D microstructural information on the SCF/ABS LAAM samples. A resolution (voxel size) of 1.7 microns was set to detect the seven-micron diameter carbon fibers within the microstructure. Scans were performed using an X-ray source at 60 kV and 900 µA to provide adequate contrast between the microstructural features in the final images. Each sample was rotated 360 degrees with 1-degree increments, and 2400 projections were used for all scans. The detector captured the transmitted X-ray signals, obtaining 2D attenuation distribution data.
2.3. µCT Image Processing
The acquired µCT scan data were then reconstructed using efX 2.4 software (North Star Imaging, Rogers, MN, USA). During reconstruction, a preprocessing technique that included an outlier median filter was used to reduce the noise and improve the boundary detection between microstructural features such as micro-voids and fibers within the ABS matrix. Subsequently, the reconstructed data were imported into VGStudio Max 3.4 software (Volume Graphics GmbH, Heidelberg, Germany) for analysis of the micro-void volume fraction, micro-void sphericity, fiber orientation, and fiber volume fraction within the microstructure of each SCF/ABS sample. The VGDefX algorithm, integrated within the VGStudio Max Porosity Analysis Module, was used for the void analysis [43,44,45]. The algorithm was used to evaluate each voxel’s gray value (intensity value) and compare it to the predetermined void gray threshold value of 5.13. If the intensity matched this threshold, the voxel was labeled as void and highlighted (segmented) in yellow, as shown in Figure 3. It is important to note that the gray value threshold must be chosen carefully, as the threshold value directly effects the measured void volume fraction. If the threshold is chosen too high, other features within the part might be mistakenly identified as voids, leading to overestimation of the void volume fraction. Conversely, setting the threshold to low will underestimate the void content.
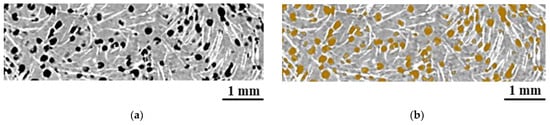
Figure 3.
Void detection within the microstructure of SCF/ABS using the VGStudio Max porosity analysis module: (a) µCT image before void segmentation; and (b) void segmented in yellow using VGStudio Max 3.4 software.
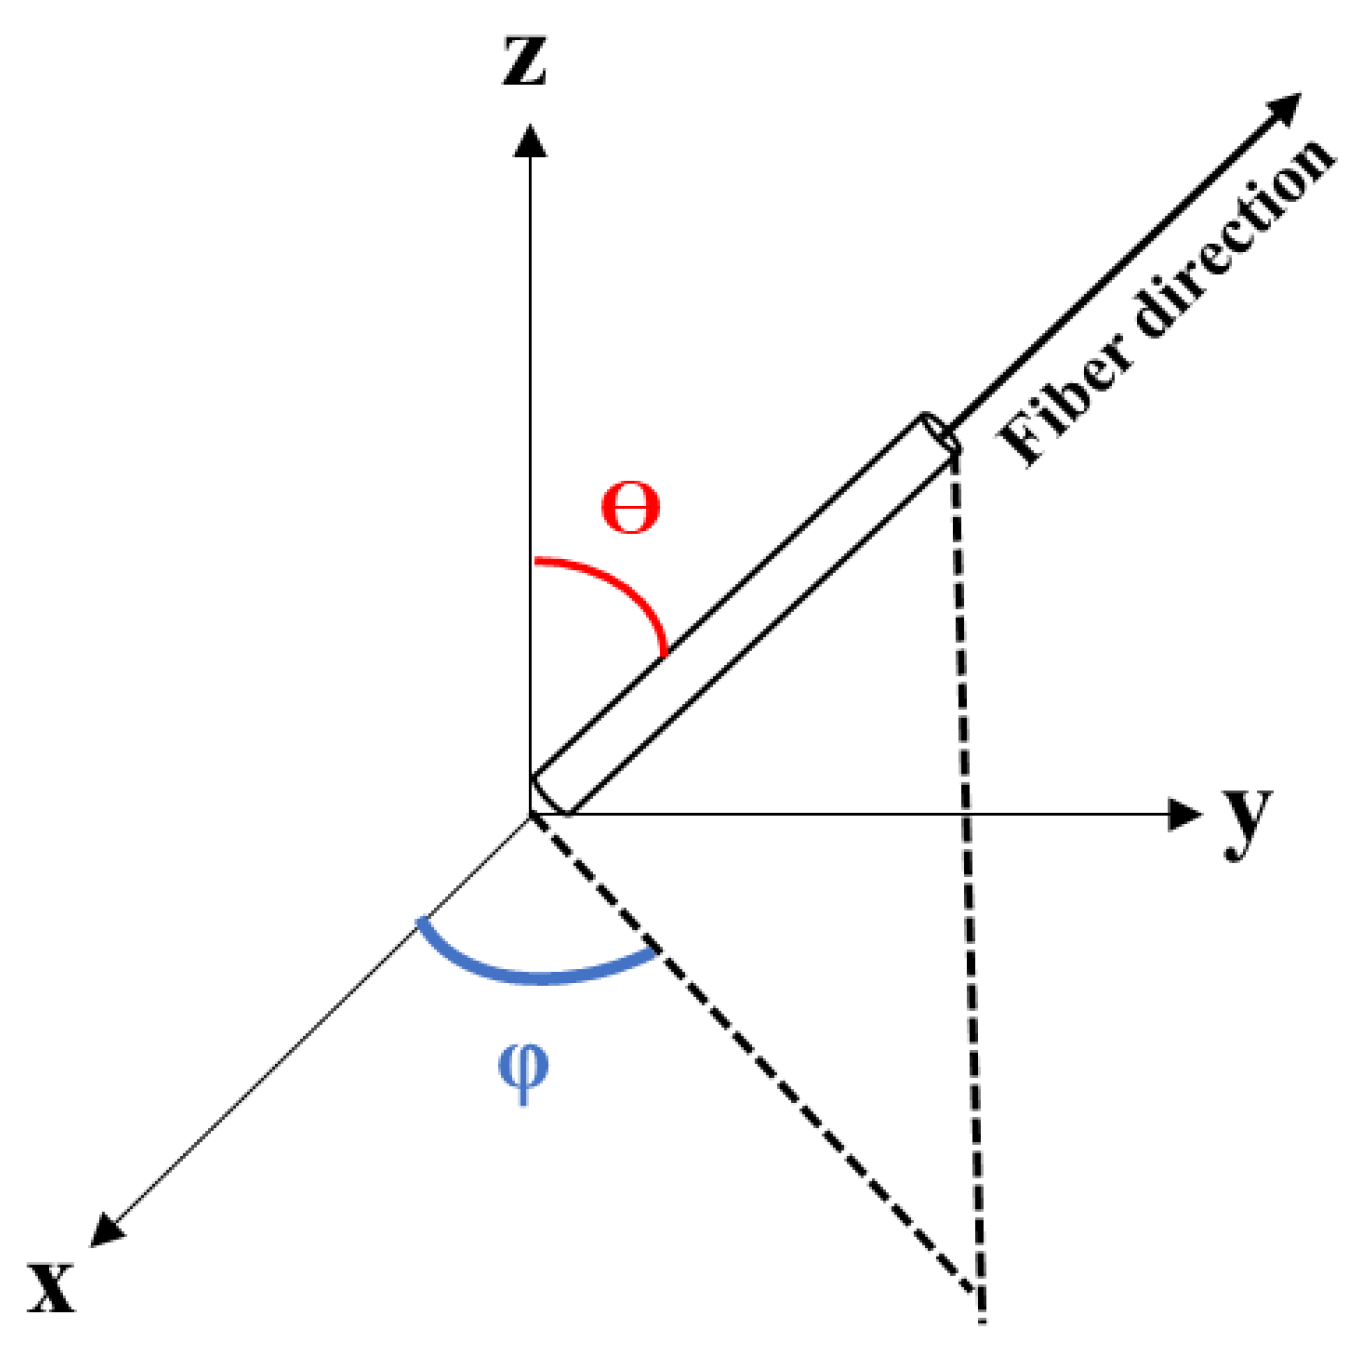
The VGStudio Max fiber Composite Material Analysis Module was used to evaluate the orientation tensor components and fiber volume fraction within the microstructure of each scanned part [46]. Similar to the VGStudio Max Porosity Analysis Module, the Fiber Composite Material Analysis Module evaluates each voxel’s gray value and compares these values to a specified carbon fiber gray threshold value of 28.77 to segment the carbon fibers within the SCF/ABS composite. Following segmentation, the fiber orientation tensor for each fiber is calculated using the fiber’s direction vector. In this calculation, each single fiber is assigned a vector in a spherical coordinate system using two angles (θ, φ) in which θ is the angle between the fiber and the z-coordinate direction and φ is the angle between the projection of fiber on the x-y plane and the x-coordinate direction [44,47], as shown in Figure 4.
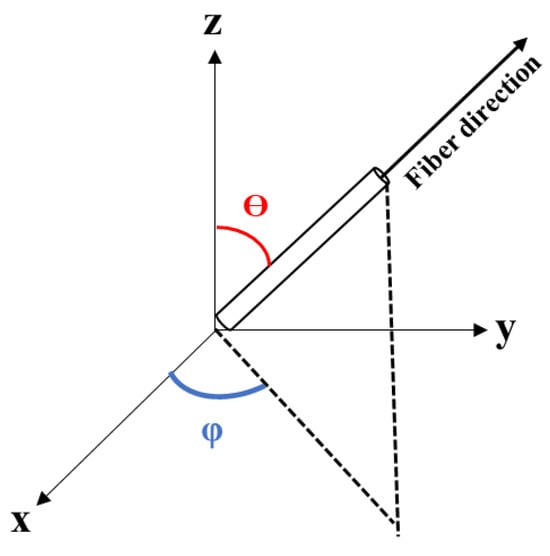
Figure 4.
Single-fiber coordinate system.
The components of the unit vector defined as (,), where = , = , and = , were used to calculate the dyadic products of vector , which results in a symmetric second-order orientation tensor for a single fiber as
It follows that the orientation tensor for a collection of fibers is defined as
This paper reports the fiber orientation along the coordinate directions of all the scanned parts using the diagonal component of orientation tensor (, ), where x defines the cross direction, y is normal to the print surface and z represents the extrusion/print direction (cf. Figure 2b). The values of the orientation tensor diagonal components are commonly used to assess the degree of alignment of suspended fibers in the composite, where the values lie between 0 and 1, all inclusive. For example, Azz = 1 indicates the perfect alignment of fibers in the z-direction and Azz = 0 indicates that all the fibers would lie in the x-y plane. The normalization condition of the fiber orientation probability density function requires that the trace of Aij = 1.
3. Results
This study aims to provide detailed information related to the microstructure of the SCF/ABS through different stages of the LAAM processing. The void volume fraction, void sphericity, fiber orientation, and fiber volume fraction are evaluated, and the average property is reported for each sample considered here. Moreover, the correlations between the microstructural features mentioned above are calculated within the sub-regions of each sample, and detailed information is provided in the following section.
3.1. Sample-Average Properties
3.1.1. Void Volume Fraction and Distribution
The sample-average void volume fraction was evaluated for each sample. The results for each appear in Table 3, where the micro-void volume fraction is defined as the ratio of the total volume of all the detected micro-voids to the sample’s total volume.
Table 3.
Void volume fraction within the samples.
The results indicate that the micro-void volume fraction varies among the stages of the LAAM process considered here. For example, the presence of micro-voids is 7.76% in the SCF/ABS pellet as received prior to LAAM printing. The presences of pellet micro-voids at this level clearly indicates that the LAAM-printing process is not the only factor that leads to micro-void formation within the 3D-printed samples. The same behavior (a large amount of void within the CF/ABS pellets) was also reported in a previous study [48]. Moreover, the results appearing in Table 2 also show that the micro-void volume fraction is 14.29% within the single strand freely extruded in the air, indicating that the extrusion process causes a notable increase in micro-voids within the SCF/ABS composite. The die swell just outside the exit of the LAAM nozzle is expected to be a region where micro-voids may grow and/or nucleate due to the stress reduction within the molten polymer as it exits into a region of low external pressure, leading to radial expansion [48,49,50,51].This sudden reduction in the applied external pressure on the molten polymer after exiting the nozzle is known to enlarge micro-voids, which is expected to be occurring in our strand sample [52]. Other studies have also reported increased micro-void volume fractions in extrudate polymer composites manufactured via FFF as compared to the filaments before the printing process [26,47,53].
The regularly deposited single bead had a micro-void volume fraction of 11.68%, which is lower when compared with the single strand reported above. The reduced micro-void volume fraction in the extrusion/deposition bead suggests that the deposition process reduces the micro-void volume fraction, which is likely caused by the increased pressure experienced by the bead at the nozzle exit as it is squeezed against the build plate. The results also show that using the roller during printing further reduces the micro-void volume fraction within the printed bead to 10.0%. Pressure from the roller is expected to cause a reduction in the bead micro-void volume fraction since the net effect is to place a compressive stress on the bead near the extrusion nozzle where the polymer melt is still in a molten phase.
Identifying specific mechanisms that nucleate and/or grow micro-voids during LAAM processing is beyond the scope of this work. However, our strand (stage (ii)) is formed by an extrusion process with a circular die, which is similar to the extrusion process used in a typical cylindrical pellet forming process. As processing conditions differ, so would micro-void volume content as we see in our results. In addition, bead extrusion/deposition and roller printing (stages (iii) and (iv), respectively) provide additional mechanical forming of the extruded polymer, which, in these cases, reduces the micro-void volume fraction. These results suggest that the micro-void volume fraction responds to mechanical forming of the extrudate and that the final micro-void volume fraction that is measured is that which exists in the bead as it solidifies.
3.1.2. Void Sphericity
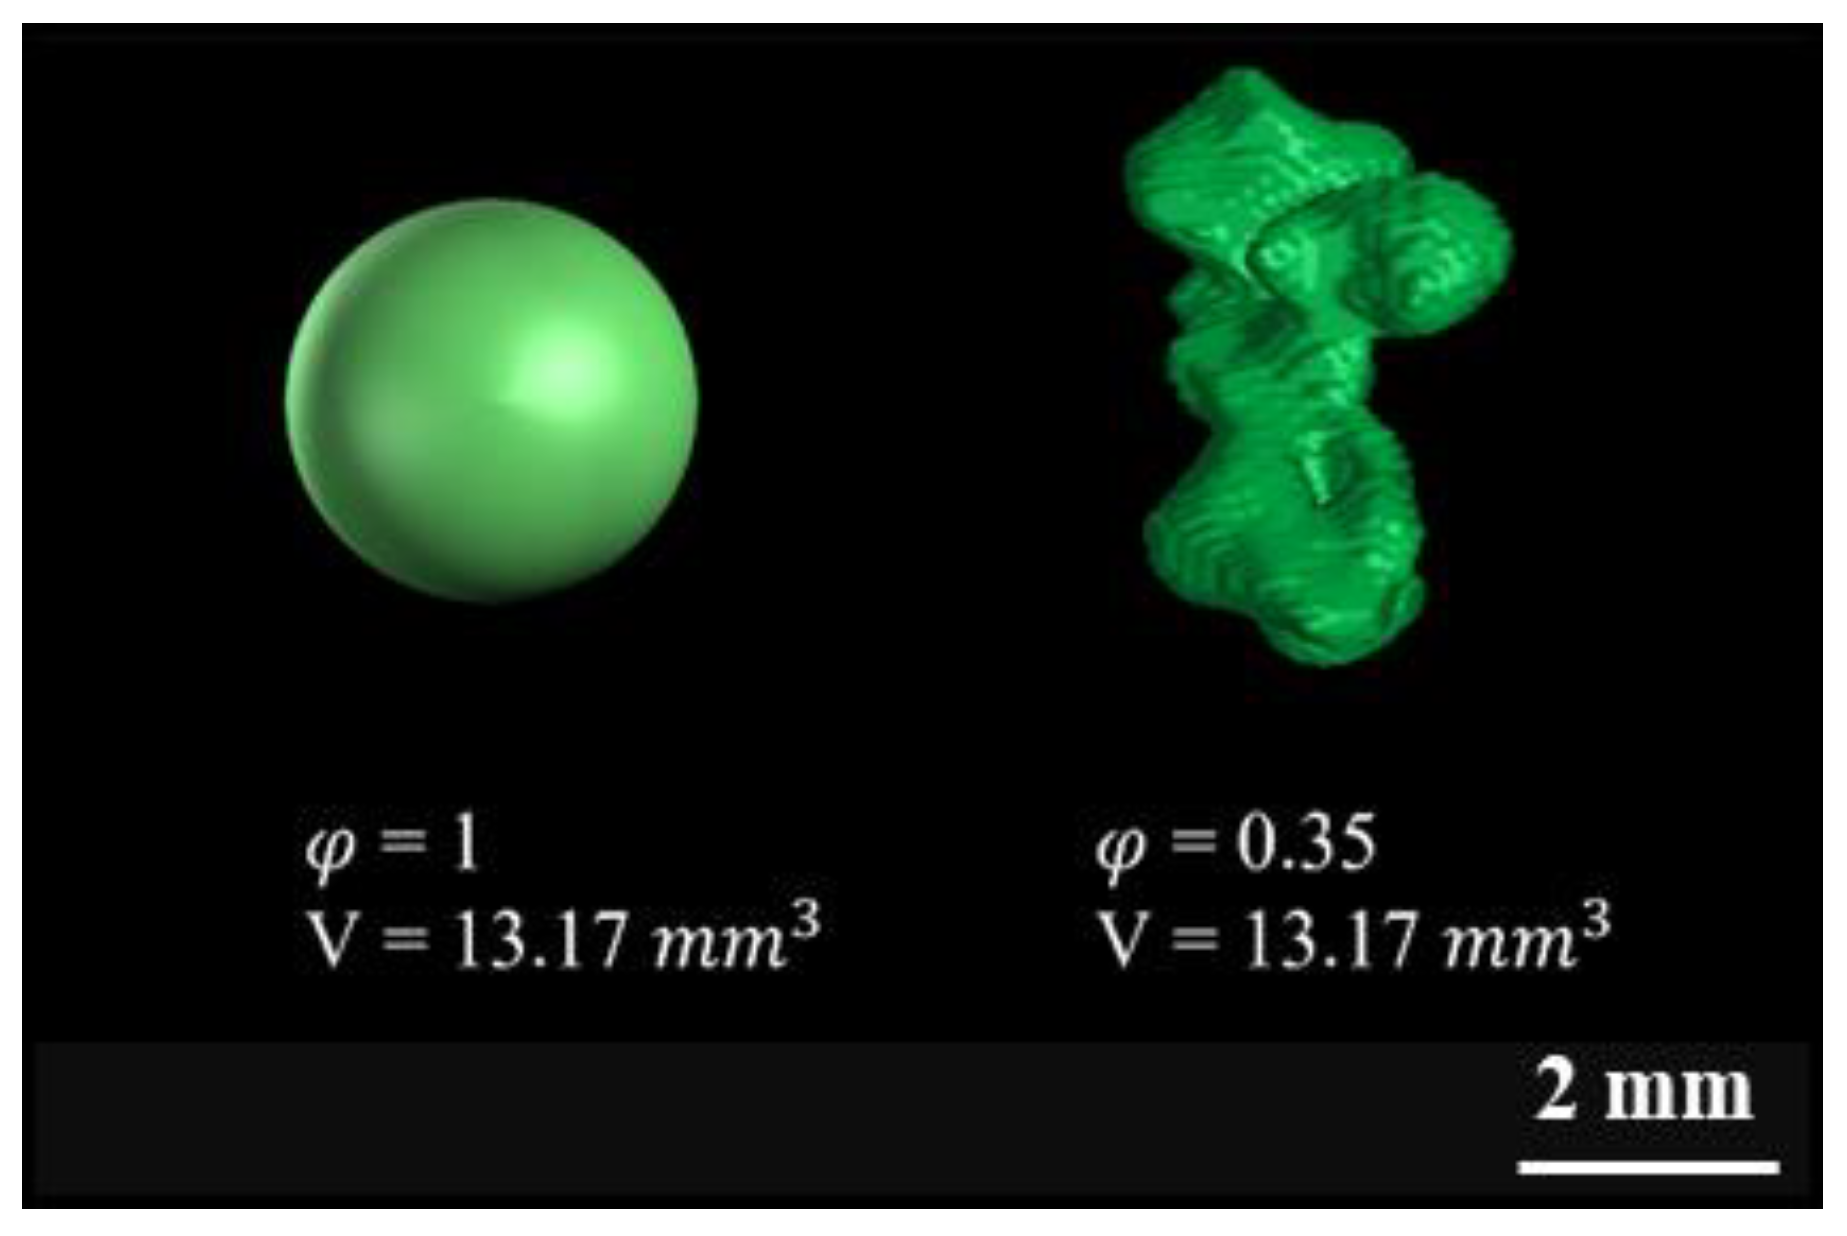
To better understand the effect of processing on the micro-void shape, the sphericity is evaluated for each sample. When computing sphericity, the surface area of a sphere having the same volume V as the micro-void is compared with the measured micro-void surface area as follows:
Note that a micro-void with the shape of a perfect sphere has a sphericity value of unity. Alternatively, micro-voids with a more irregular shape will have a sphericity value that ranges between zero and one. Figure 5 provides a comparison between a sphere with = 1 and a detected micro-void having the same volume as the ideal sphere with to better illustrate sphericity.

Figure 5.
Comparison between a sphere with =1 (left) and a detected micro-void with the same volume as the ideal sphere with .
Table 4 presents four typical micro-voids extracted from each of the four samples appearing in Figure 2b. Each micro-void in Table 4 appears along with its measured sphericity and volume. The four micro-voids from each sample are chosen to illustrate the minimum and maximum sphericity examples, in addition to the micro-voids with a sphericity of 0.35 and 0.55. The examples in Table 4 show that micro-voids with lower sphericity tend to have larger volumes than those with higher sphericity through all the samples. An inverse relation between void sphericity and void volume was observed for most of the detected micro-voids within our samples, as shown here. Previous studies also reported that the void sphericity is inversely proportional to the void volume [25,54,55]. Comparison of the void sphericity between the samples yields that voids with the same sphericity may exhibit variations in volume and shape.
Table 4.
Examples of the void sphericity and void volume of detected micro-voids within the samples (volume in mm3).
To better illustrate the variation in micro-void sphericity within the four samples shown in Figure 2, a two-parameter Weibull distribution was fitted to the measured sphericity data. The Weibull distribution along with the values of the fitted Weibull distribution parameters for the micro-void sphericity appear in Appendix A, Table A1, and the fitted Weibull distributions of the sphericity for all the samples in this study appear in Figure A2.
3.1.3. Fiber Orientation
The fiber orientation tensor components were evaluated using the Fiber Composite Material Analysis module of VG Studio Max for each of the samples in Figure 2b. Here, we only report the diagonal components of the orientation tensor (i.e., since values of Aij in the coordinate directions provide insight into the degree of alignment of fibers in the extrusion/print direction () direction normal to the print surface (), and the cross-bead direction (). In all cases, the off-diagonal components in our samples were small compared to the diagonal components reported here. The measured sample-averaged values of the orientation tensor components appear in Table 5.
Table 5.
Diagonal components of the orientation tensor.
The values in Table 5 show that the sample-average diagonal components of the measured fiber orientation tensors vary among the samples in this study and that the highest diagonal component is . The relatively large values of indicate that fibers tend to be aligned in the extrusion/print direction, which is expected given the high shear stresses in the extrusion nozzle (see, e.g., simulation studies by Heller et al. [56] and Wang et al. [57]).
Within the pellet microstructure, fibers are aligned along the longitudinal (extrusion) direction with a measured = 0.83, which indicates a very high degree of alignment. The measured values of Azz in the strand show that that fibers are also oriented in the extrusion direction (i.e., = 0.66); however, the LAAM extrusion process appears to reduce the fiber alignment when compared to that in the pellet, which is consistent with the results of Yang et al. [47], who showed a reduced fiber alignment in the FFF process. The results also indicate that is higher within the regular bead (i.e., 0.72) as compared to the single strand due to the material deposition onto the print surface. Moreover, applying the roller during printing reduces the fiber alignment along the print direction (i.e., = 0.58) as compared with the regular bead. The roller-printed bead experiences a squeeze-type flow, which flattens and widens the bead. As a result, a brief elongational flow is formed during rolling, which is directed outward from the center of the bead, causing fibers to change orientation from that which is more aligned along the print direction to that which has an increased alignment transverse to the bead axis.
In addition to the variation in the sample-average micro-void volume fraction, void sphericity, and fiber orientation seen among the four samples in this study, each individual sample showed considerable spatial variation over their cross-sections. For example, within the pellet cross-section, fibers appear more highly aligned along the extrusion direction (z-direction) near the outer edge and more randomly oriented near the center of the pellet. Similarly, within the single strand, the fibers appear more highly aligned along the extrusion direction (z-direction) at the edge of the cross-section due to the higher shear rate at the nozzle wall as compared to those in areas near the center of the single strand. Within regions near the center of the strand, the fibers showed a wavy-like orientation pattern (a low degree of alignment along the extrusion direction), likely due to the effect of the single screw during the extrusion process. The same behavior was also reported by Tagscherer et al. [58]. In addition, further investigation of the regular bead indicates that the fibers are more aligned along the print direction (z-direction) in the areas near the print bed, top surface, and outer edges, and they show a more random orientation in the central regions of the bead. Pibulchinda et al. [6] also reported similar behavior, which was identified as a “core-shell” effect within the extrudate. As in other samples, the roller-printed bead exhibited higher fiber alignment along the print direction (z-direction) near the print bed, top surface, and outer edges of the cross-section. Although the bead was compressed by the roller during the printing process, the core-shell pattern of the fiber orientation was retained within the roller-printed bead. However, in the central regions of the roller-printed bead, the fibers show a higher degree of orientation toward the x-direction and less orientation along the z-direction due to the brief elongational flow is formed during rolling, which is directed outward from the center of the bead, causing fibers to be more aligned along the x-direction.
It is helpful to consider the regular bead sample to illustrate the significant spatial variation in microstructure across a bead. Six distinct areas of interest within the microstructure of the single regular bead (stage (iii)) identified as slices 1 through 6 appear in Figure 6. Images taking in the x-z plane are shown for each slice, which illustrate the significant variability in microstructural features, including the fiber orientation and distribution, and micro-void distribution across the printed bead. Inside the nozzle, high shear rates are known to align the fibers in the flow direction near the nozzle wall. In contrast, within the central region of the nozzle, where the shear rate is lower, a more random distribution of fiber is expected. As shown in Figure 6, after deposition on the print surface, the fiber alignment within the regularly deposited bead reflects the same behavior, with a higher degree of alignment along the print direction in the bead’s surface regions (regions 1 and 6) and a more random distribution of fibers in the core or central regions of the bead (regions 2, 3, 4 and 5). As indicated in Figure 6, the void content also varies within different regions due to different cooling rates. The outer surface of the bead cools faster, resulting in a rapid solidification where voids are less likely to be enlarged (regions 1 and 6). The surface regions’ rapid solidification and subsequent shrinkage may result in void entrapment in the central area, resulting in a higher void content within these regions (2, 3, 4, and 5).
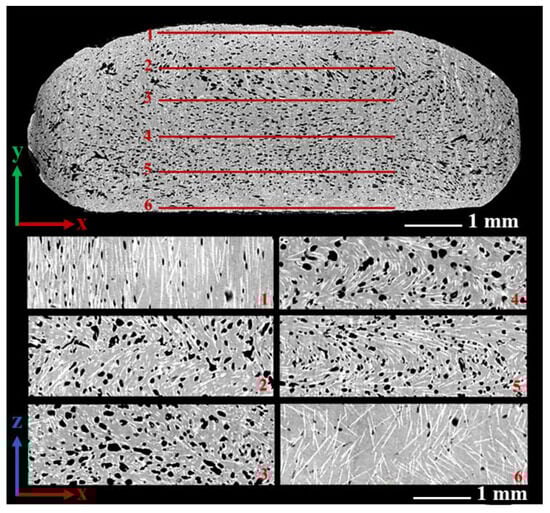
Figure 6.
Two-dimensional µCT images of six different regions within the regular bead microstructure.
3.2. Microstructural Characteristics Correlation
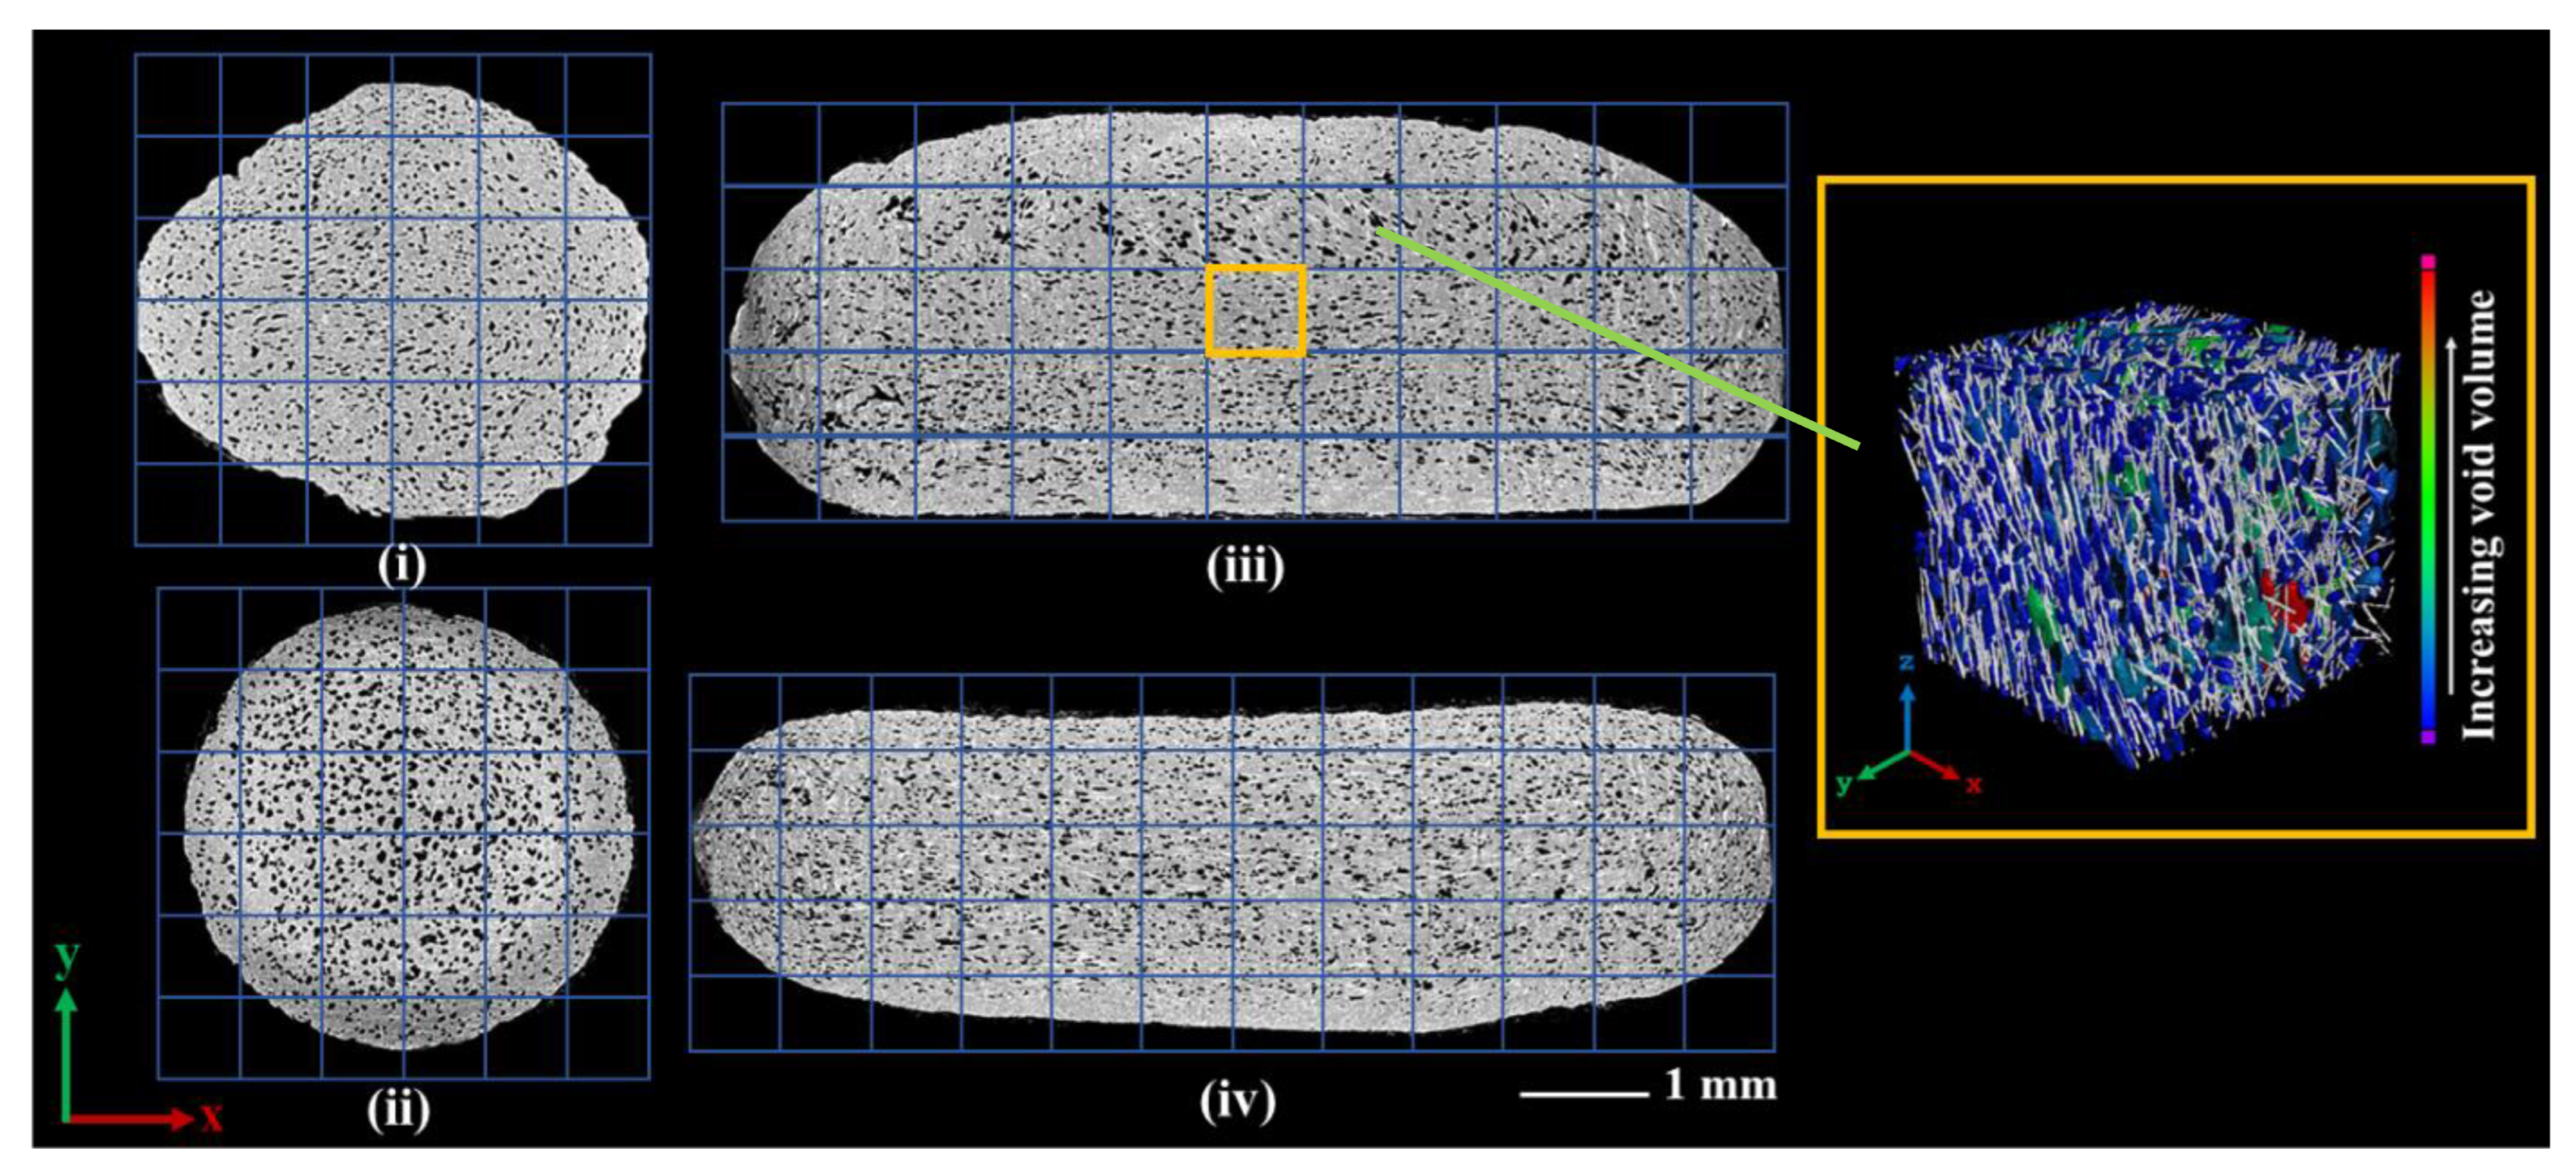
Each sample in Figure 2 was divided into equal 3D mesh cells by extending a rectangular grid formed in the xy-plane through each sample along the extrusion/print direction. These analysis cells appear in Figure 7, along with a 3D view of an individual mesh cell generated via a fiber and void analysis (fibers appear in white while voids are shown in different colors based on their volume, and the ABS matrix is made transparent). The mesh size for each sample appears in Table 6. Our goal here is to maintain a uniform mesh cell size for all the samples; however, slight variations occurred due to differences in the dimensions of the samples. The microstructural characteristics were analyzed for each cell to provide a comprehensive understanding of the variations across each sample and relationships between the microstructural characteristics. Each cell in all four samples appearing in Figure 7 was evaluated using VGStudio Max 3.4 software to obtain the values of the void volume fraction, fiber volume fraction, fiber orientation (here we only consider Azz), and void sphericity. Table 7 summarizes the calculated microstructural characteristics across all the cells within each sample. The fiber volume fraction, void volume fraction, void sphericity, and distributions within the samples at different stages of LAAM processing are also provided in Appendix B and appear in Figure A2.
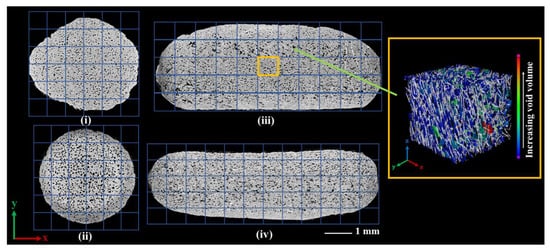
Figure 7.
A 2D view of the mesh cells for each individual sample, showing the analysis grid (left), along with the 3D view of a single mesh cell within the regular bead after void and fiber analysis (right).
Table 6.
The dimensions of the mesh cells for all the samples.
Table 7.
Microstructural characteristics across all the cells within each sample.
Once the microstructural characteristics were obtained for each analysis cell in Figure 7 for all four samples, a linear fit least square was performed to obtain a first-order relationship of each output Y to input X in the usual form of . The fitting process for each set of inputs and outputs was performed to obtain the slope m and the y-intercept b, and the quality of the linear fit was evaluated by computing a regression coefficient in the usual manner. Table 8 reports the fit parameters (m and b) and the values of the fit for all four samples. Given the spread of the data overall, we consider an ≥ 0.60 to indicate a potential correlation between microstructural characteristics. Within the four samples considered here, a negative correlation was determined between the void volume fraction and fiber orientation along the print direction ( = 0.77, 0.81, 0.63, and 0.81 for the pellet, strand, bead, and roller-printed bead, respectively). This result suggests that a higher number of voids within the microstructure correlates with a more random fiber orientation. In contrast, a higher degree of fiber alignment along the print direction occurs within areas with less voids. A positive correlation was detected between the void sphericity and Azz within the pellet ( = 0.60) and the regular bead ( = 0.61), which suggests that in the regions where fibers are more aligned along the print direction, voids are more spherical in their shapes. Further analysis of the results indicates that the remainder of the samples (single strand and roller-printed beads) did not show a correlation between any two pairs of microstructural characteristics. A negative correlation ( = 0.60) was also observed between the void volume fraction and the void sphericity within the regular bead; however, the other three samples did not exhibit a similar relationship.
Table 8.
Linear regression analysis for each individual sample: parameter and correlation coefficient.
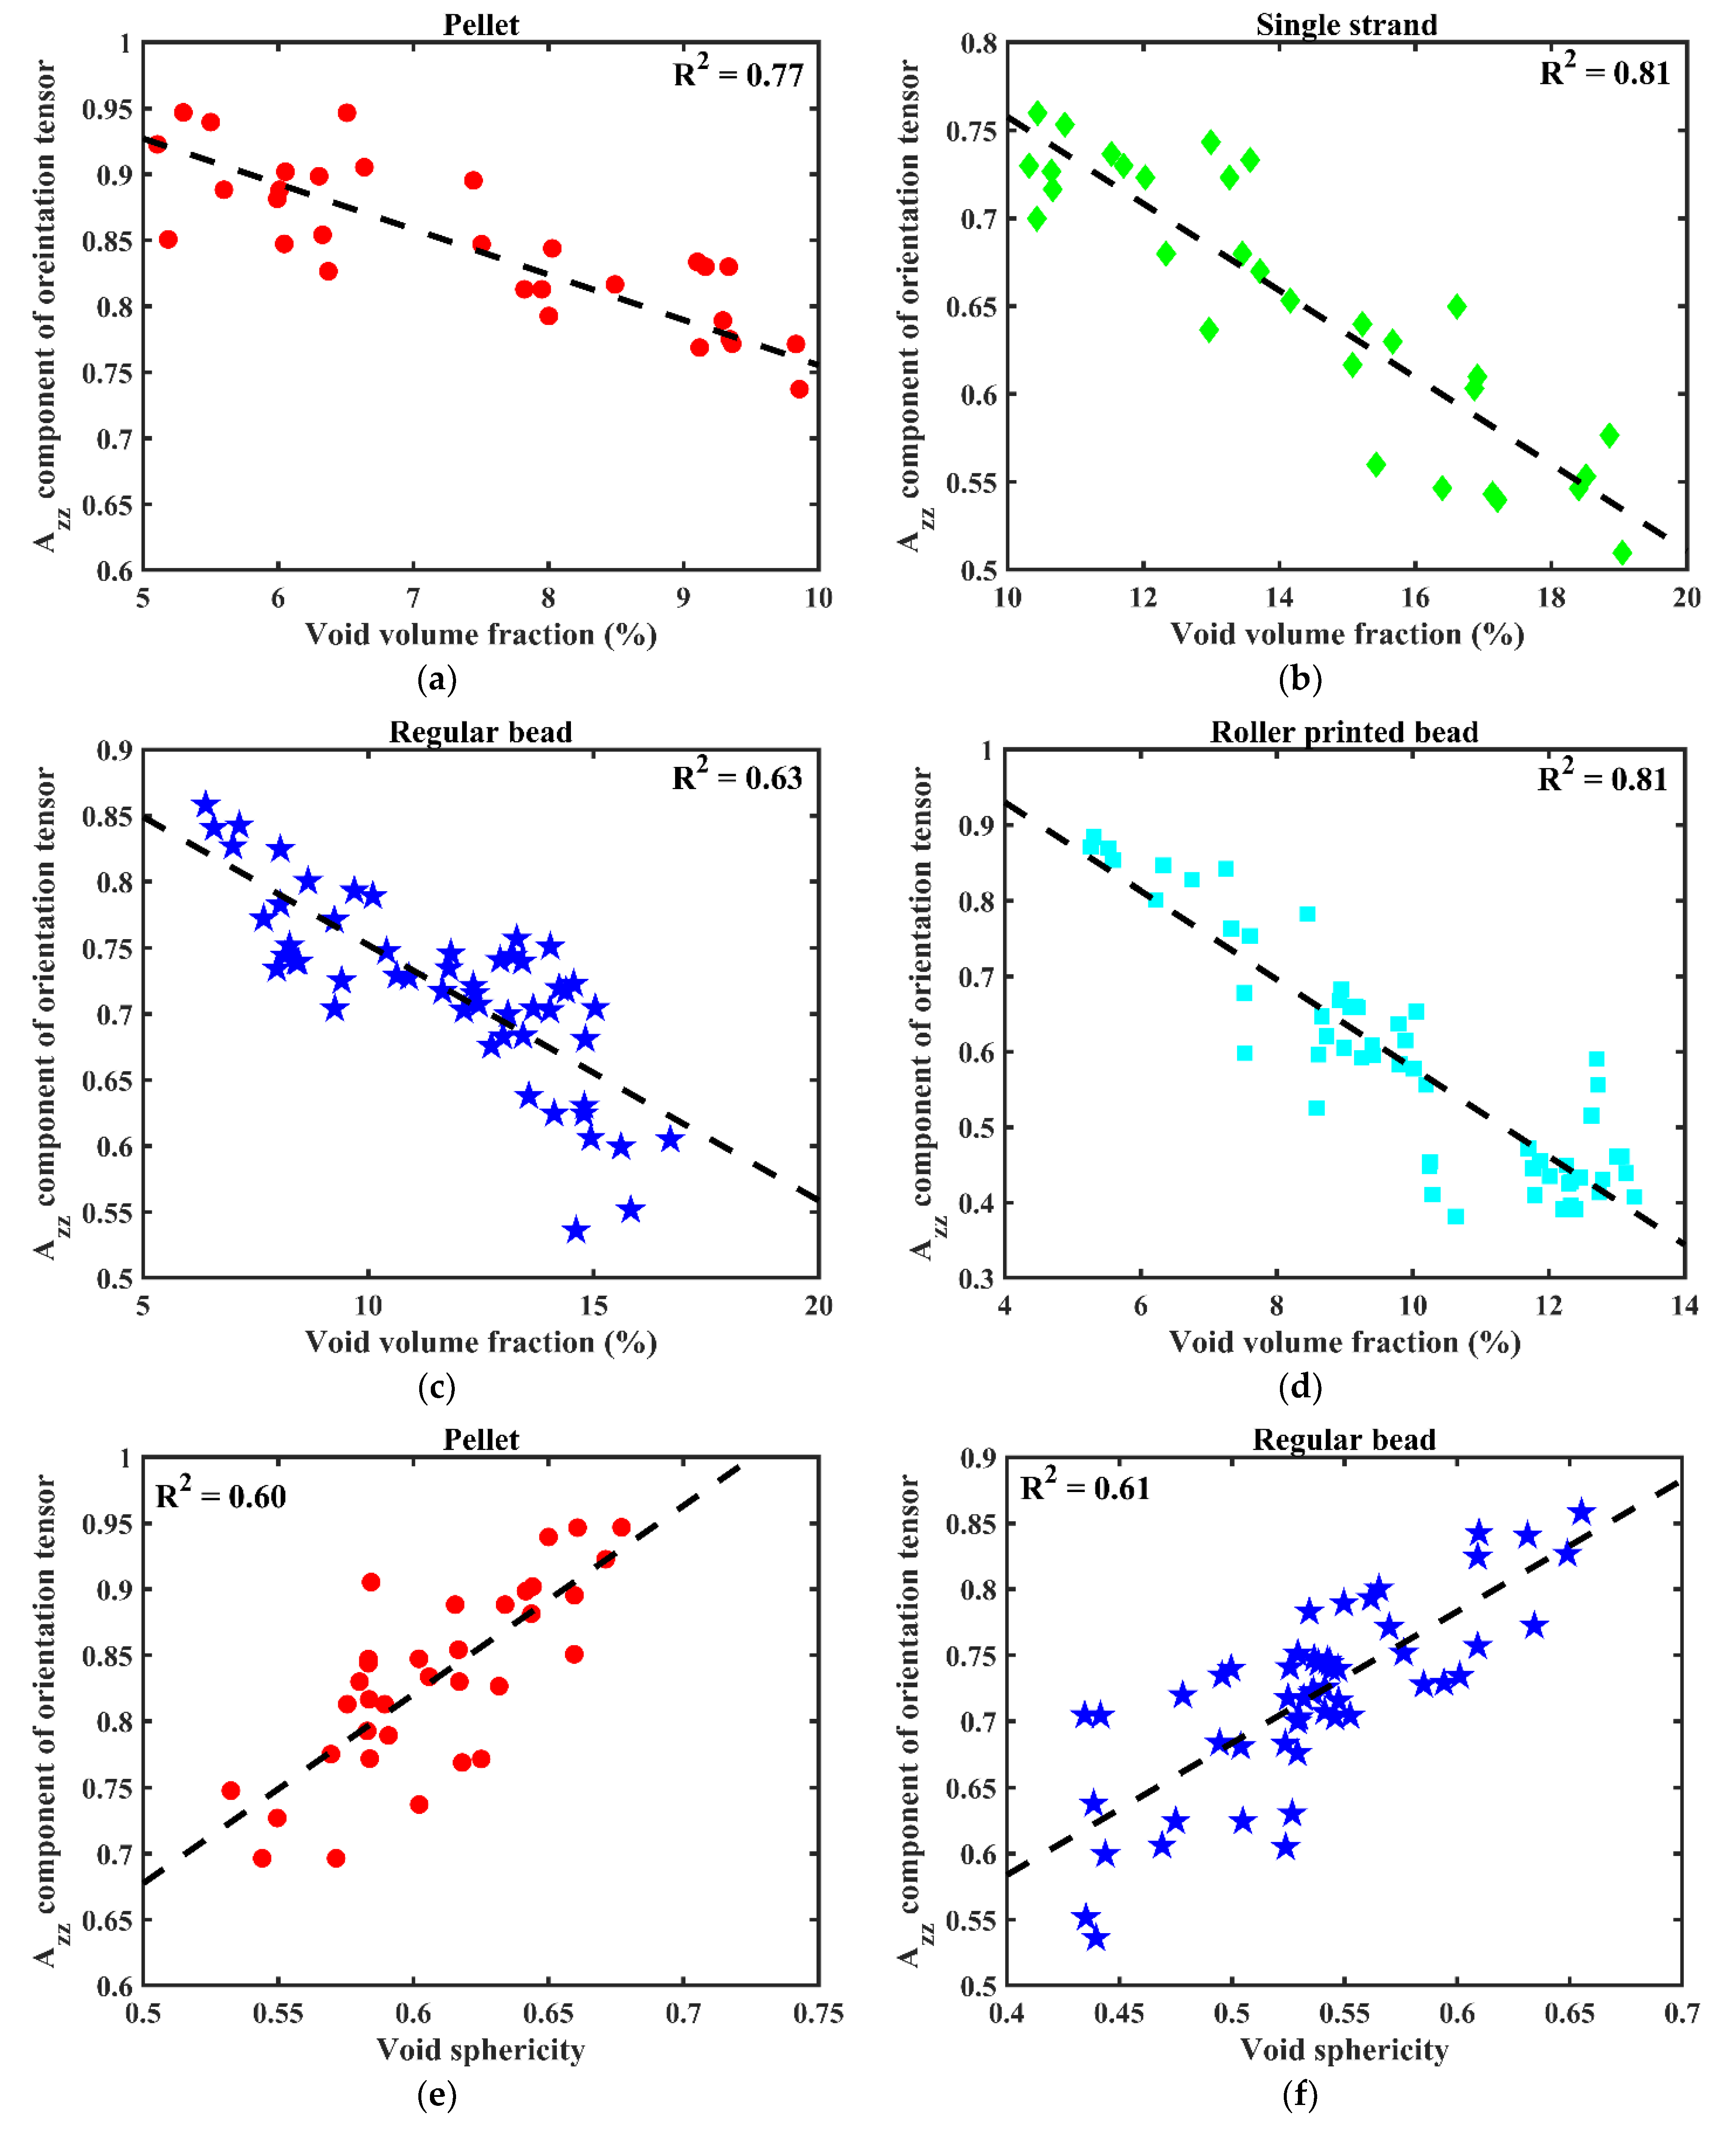
For completeness, Figure 8 provides plots of the measured microstructural characteristics that exhibit a correlation based on having an ≥ 0.60, as listed in Table 9. To maintain the integrity of the data interpretation, plots failing to meet this correlation threshold are excluded.
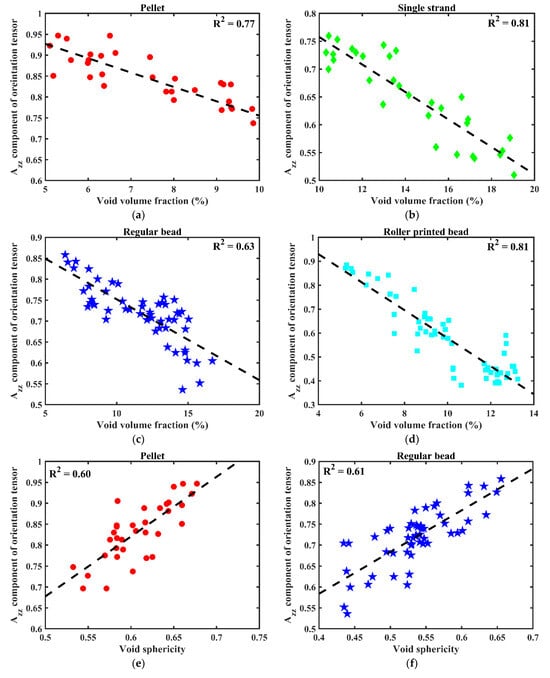
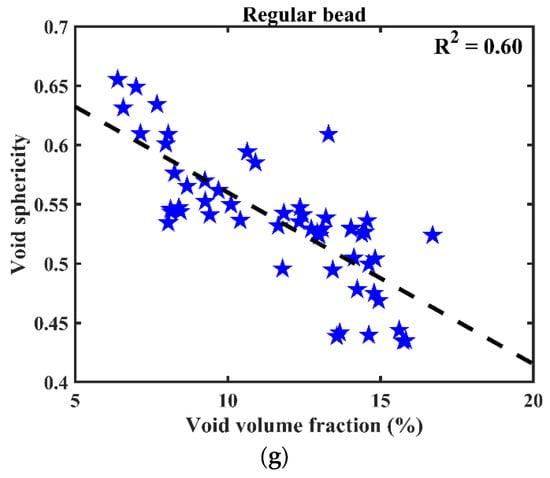
Figure 8.
Microstructural characteristics correlation with the threshold of ≥ 0.60: (a) a negative correlation between void volume fraction and Azz in pellet; (b) a negative correlation between void volume fraction and Azz in single strand; (c) a negative correlation between void volume fraction and Azz in regular bead; (d) a negative correlation between void volume fraction and Azz in roller printed bead; (e) a positive correlation between void sphericity and Azz in pellet; (f) a positive correlation between void sphericity and Azz in regular bead; and (g) a negative correlation between void volume fraction and void sphericity.
Table 9.
Linear regression analysis using data from all samples: parameter and correlation coefficient.
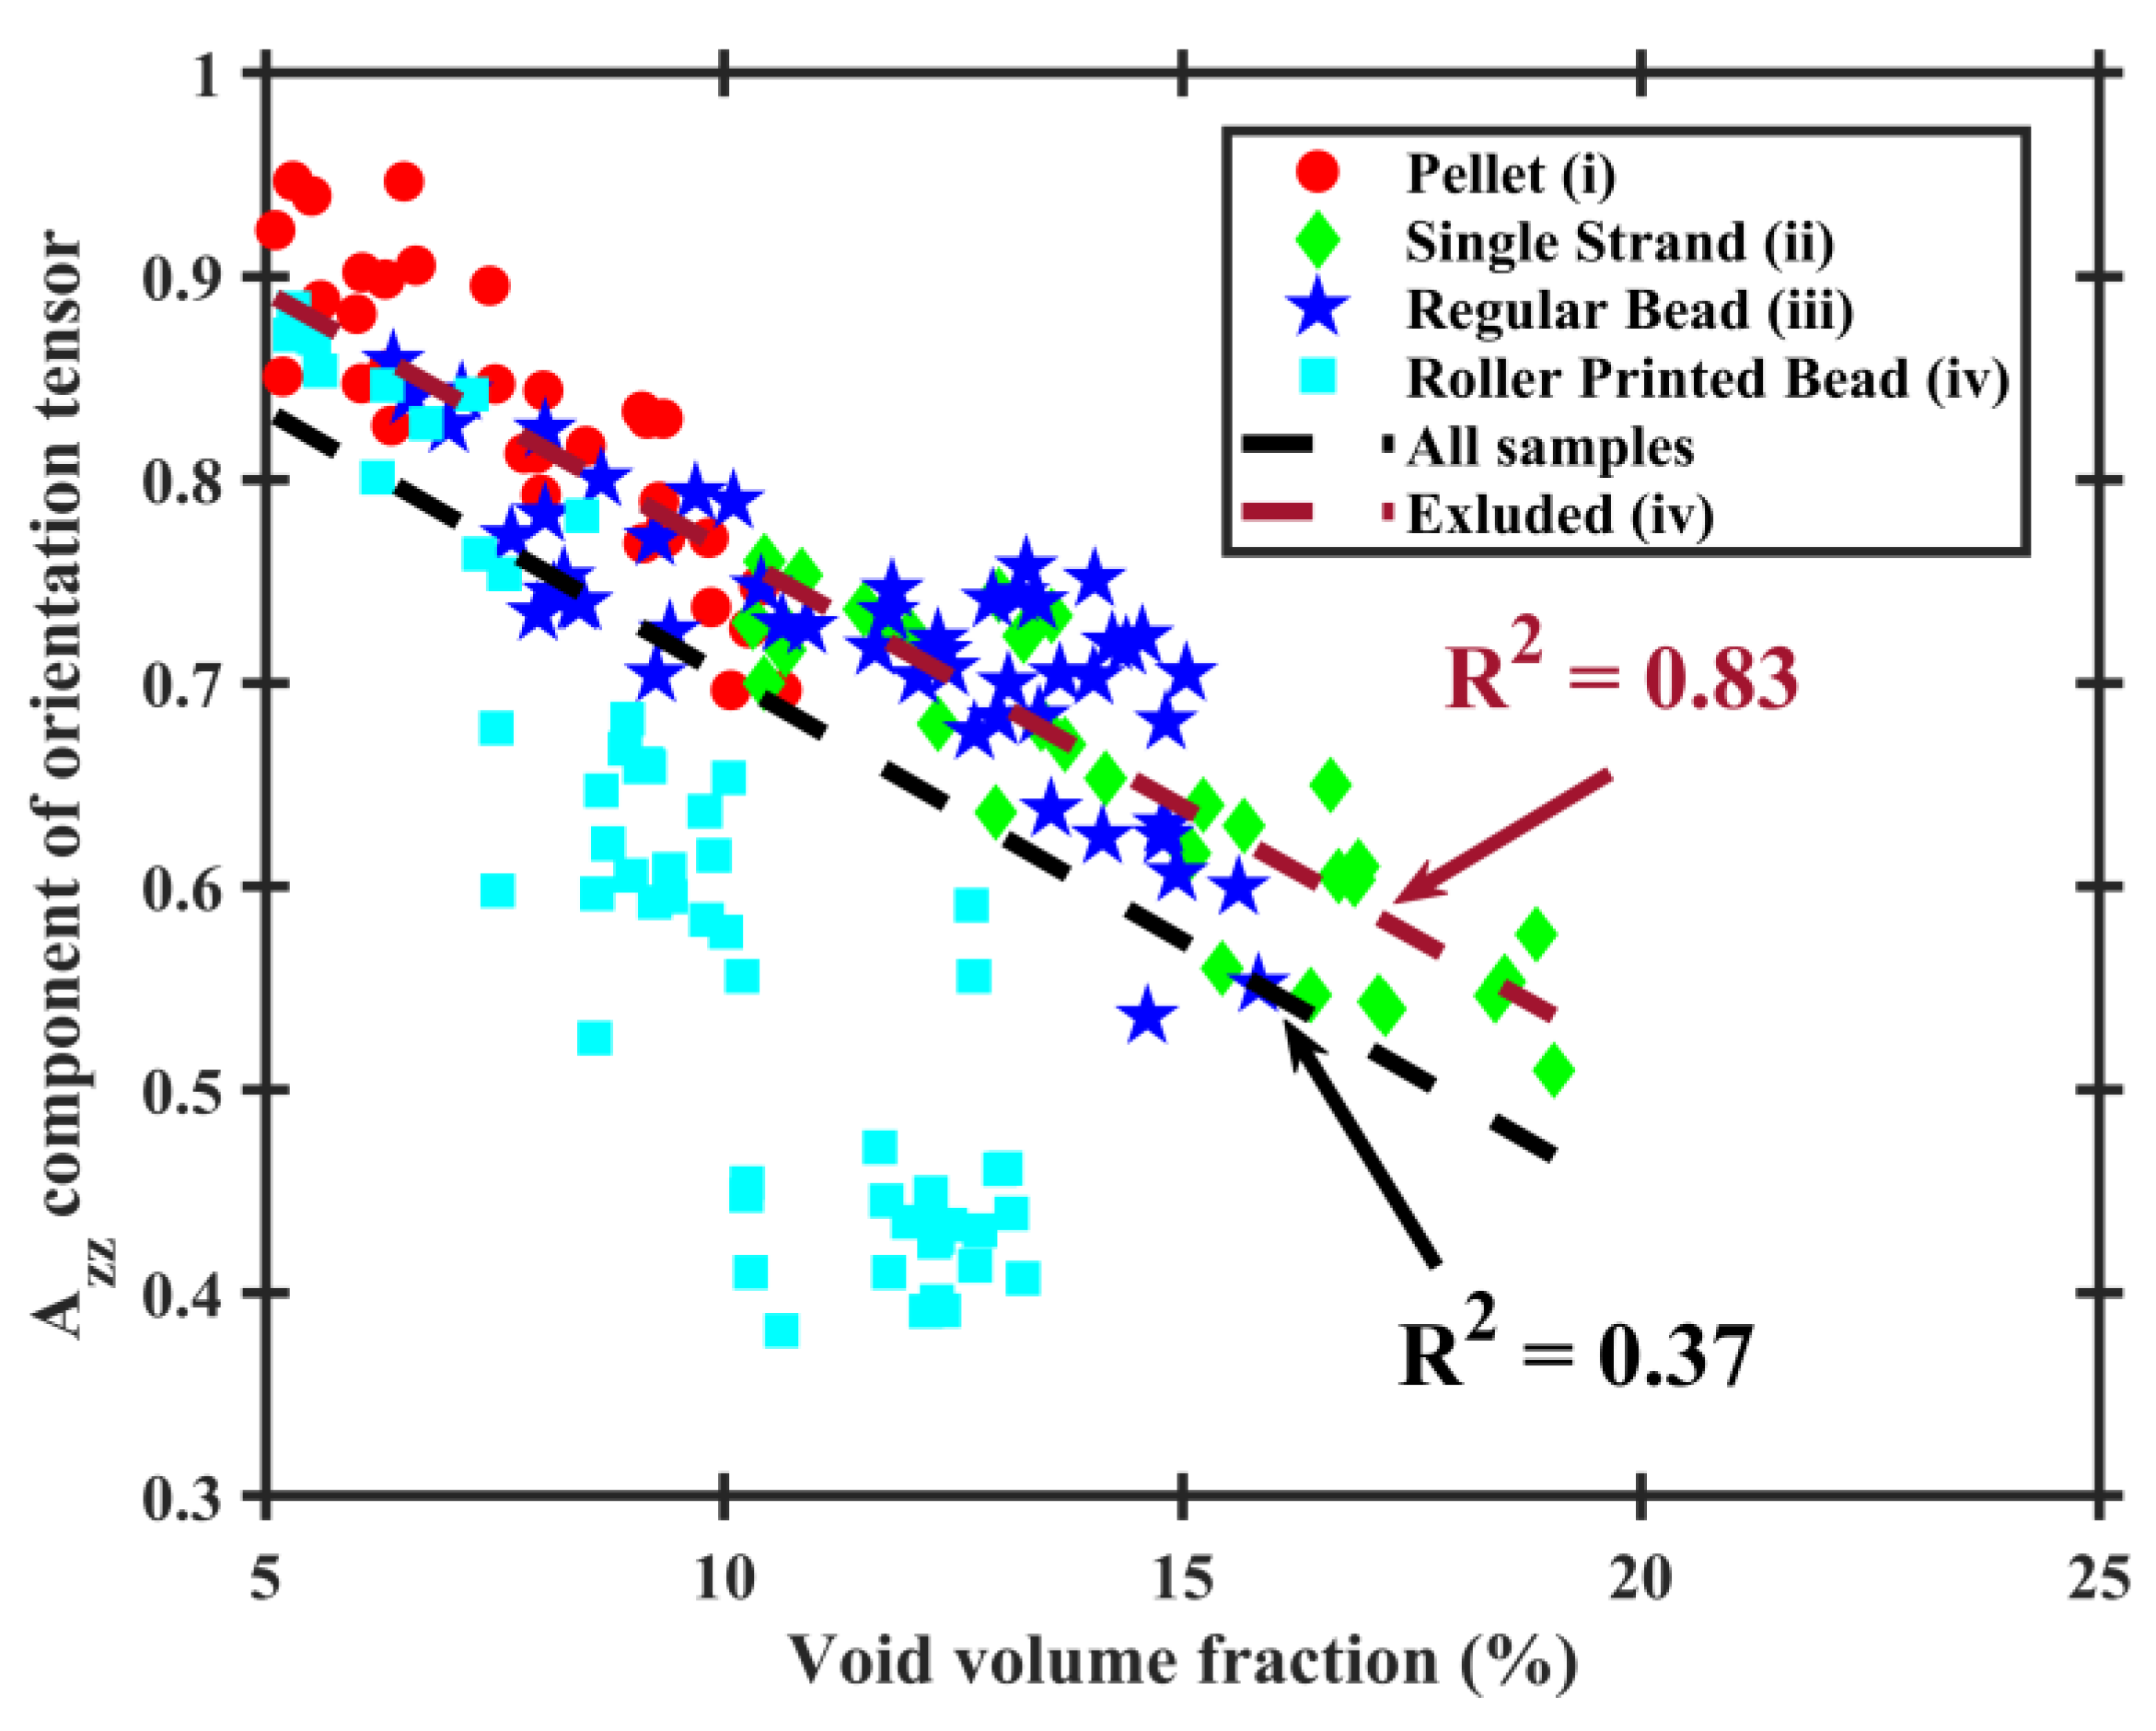
In addition to the correlation study above, which was performed for each stage individually, the measured microstructural characteristic data were combined across samples to identify trends that may occur across all the stages evaluated. Linear regression was applied to the microstructural characteristic data, including the fiber volume fraction, , void volume fraction, and void sphericity, for datasets from all the samples for all four stages of the LAAM processing to evaluate the occurrence of a correlation between pairs of these features. The fitted parameters and , and correlation coefficient obtained from the linear regression analysis including all the samples are reported in Table 8. Here, we again use a threshold of = 0.60 to establish correlation. Under these criteria, it is clear that there is no correlation between any pair of microstructural features, as shown in Table 8. However, upon excluding the roller-printed data (i.e., only considering pellet, strand, and as-printed bead data), a significant negative correlation (is seen to occur between the void volume fraction and the , as shown in Table 9 and Figure 9.
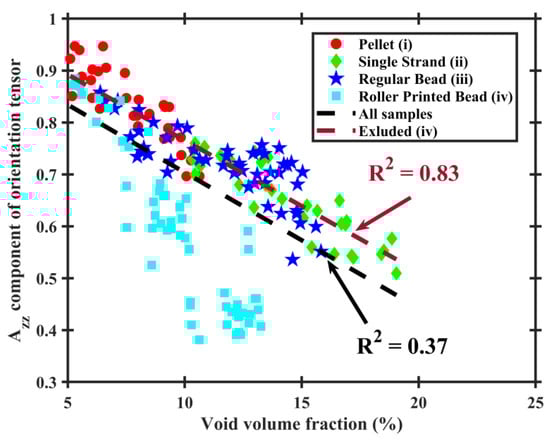
Figure 9.
Comparison of the void volume fraction— correlation with and without considering roller-printed bead data.
4. Conclusions
This paper evaluates the correlation between the microstructural features formed by fibers and micro-voids throughout four stages during LAAM processing of SCF/ABS. The stages included (i) pre-process (SCF/ABS pellet), (ii) in-process (single freely extruded strand falling out from the nozzle, (iii) in-process state (single, regularly deposited bead laying on the printing bed), and (iv) post-process (single, regularly deposited bead compressed by a mechanical roller. A high-resolution X-ray micro-computed tomography (µCT) system was used to obtain the microstructural features of the fibers (volume fraction, fiber orientation tensor) and micro-voids (volume fraction, sphericity) of the SCF/ABS samples. The results indicate that the void volume fraction and void sphericity vary within the microstructure of the samples across all the stages of LAAM processing. Among the samples considered here, the void volume fraction is lowest within the pellet and the highest within the single strand. Before LAAM processing, the existence of a relatively high void volume fraction is seen in the pellet, suggesting that the extrusion and deposition process alone are not the cause of void formation within the extrusion/deposition polymer composite microstructure. The results show that voids are more spherical in single strands, and deposition on the bed appears to cause the voids to be more irregular in shape, with a higher irregularity within the roller-printed bead. Within all the samples, the average diagonal components of the orientation tensor also showed a significant variation; however, in all the samples, Azz is the largest orientation tensor component, which indicates that fibers tend to be highly aligned in the extrusion/deposition direction.
To provide a better understanding of the microstructural features’ correlation, each sample was divided into a 3D mesh, and a quantitative evaluation was performed on each mesh cell. Within the four samples considered here, a negative correlation was determined between the void volume fraction and the fiber orientation along the print direction. This result suggests that a higher number of voids within the microstructure correlates with a more random fiber orientation. In contrast, a higher degree of fiber alignment along the print direction occurs within areas with less voids. A positive correlation was detected between void sphericity and Azz within the pellet and the regular bead, which suggests that in the regions where the fibers are more aligned along the print direction, the voids are more spherical in their shapes. Further analysis of the results indicates that the remainder of the samples (single strand and roller-printed beads) did not show a correlation between any pair of microstructural characteristics. In addition, the measured microstructural characteristic data were combined across samples to identify trends that may occur across all the stages evaluated. No correlation is detected between any pair of microstructural features when considering all the samples of this study. However, upon excluding the roller-printed data (i.e., only considering pellet, strand, and as-printed bead data), a significant negative correlation is seen to occur between the void volume fraction and the .
Author Contributions
Conceptualization, N.S. and D.E.S.; methodology, N.S. and D.E.S.; software, N.S.; validation, N.S. and D.E.S.; formal analysis, N.S.; investigation, N.S.; resources, D.E.S.; data curation, N.S.; writing—original draft preparation, N.S.; writing—review and editing, N.S. and D.E.S.; visualization, N.S.; supervision, D.E.S.; funding acquisition, D.E.S. All authors have read and agreed to the published version of the manuscript.
Funding
This research was funded by “National Science Foundation (NSF), grant number 2055628”.
Data Availability Statement
The raw data supporting the conclusions of this article will be made available by the authors upon request.
Acknowledgments
The authors would like to express their gratitude to the US National Science Foundationfor their financial support and to Strangpresse (Youngstown, OH, USA) for providing the Model 19 extruder used in this study.
Conflicts of Interest
The authors declare no conflicts of interest.
Appendix A
To better illustrate the variation in micro-void sphericity within the four samples shown in Figure 2, a two-parameter Weibull distribution written as
was fitted to the measured sphericity data, where a and b are the Weibull scale and shape parameters, respectively. The values of the fitted Weibull distribution parameters for micro-void sphericity appear in Table A1 and the fitted Weibull distributions of sphericity for all the samples in this study appear in Figure A1.
Table A1.
Weibull distribution parameters for micro-void sphericity within the samples.
Table A1.
Weibull distribution parameters for micro-void sphericity within the samples.
| Sample | ) | ) |
|---|---|---|
| Pellet (i) | 0.63 | 8.98 |
| Single strand (ii) | 0.65 | 10.20 |
| Regular bead (iii) | 0.57 | 6.75 |
| Roller-printed bead (iv) | 0.56 | 5.35 |

Figure A1.
Weibull distribution of void sphericity within the samples.
Figure A1.
Weibull distribution of void sphericity within the samples.
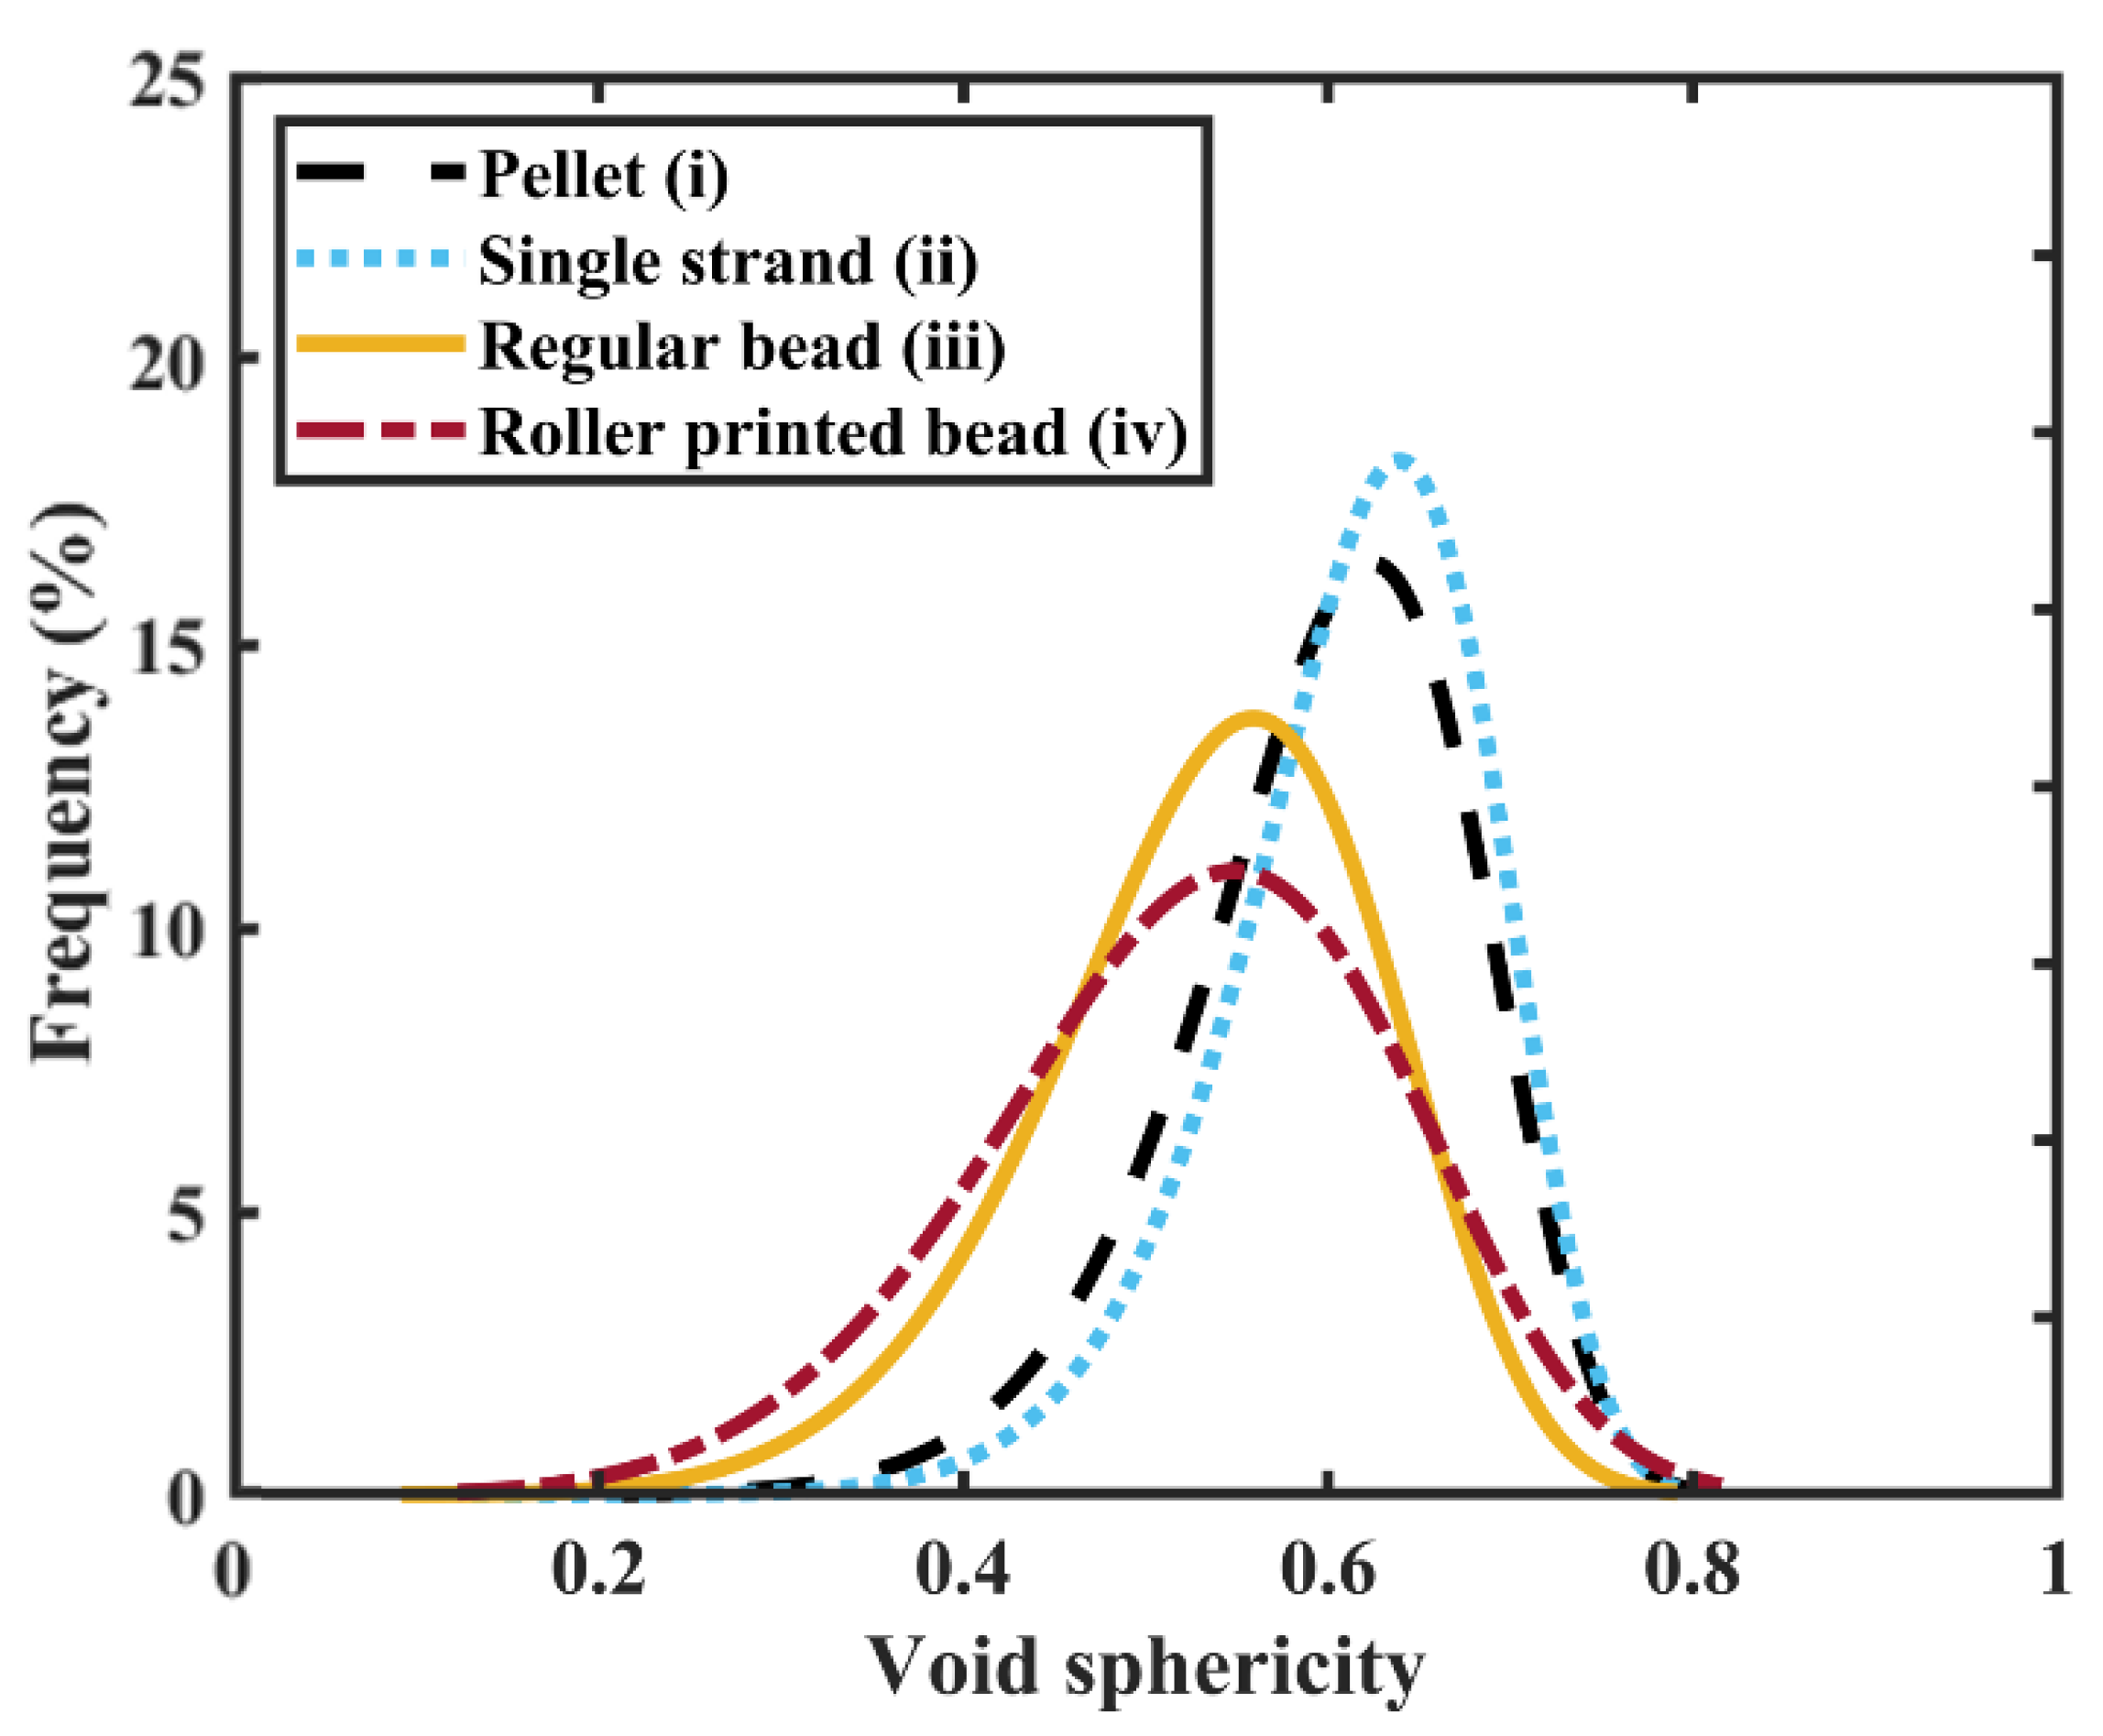
As reported in Table A1, the highest shape parameter (b = 10.20) and scale parameter ( = 0.65) belong to the single strand, indicating that micro-voids are more spherical within the single strand as compared with the other samples in this study. In contrast, the most irregularity in the void shape occurs within the roller-printed bead, resulting in this sample having the lowest shape parameter (b = 5.35) among the four. In addition, the roller-printed bead sample showed the broadest sphericity distribution (lowest scale parameter = 0.56) among all the samples of this study. The results suggest that the deposition onto the print bed reduces the micro-void sphericity, i.e., micro-voids become more irregular following deposition as compared to the micro-voids within the pellet and single strand.
Appendix B
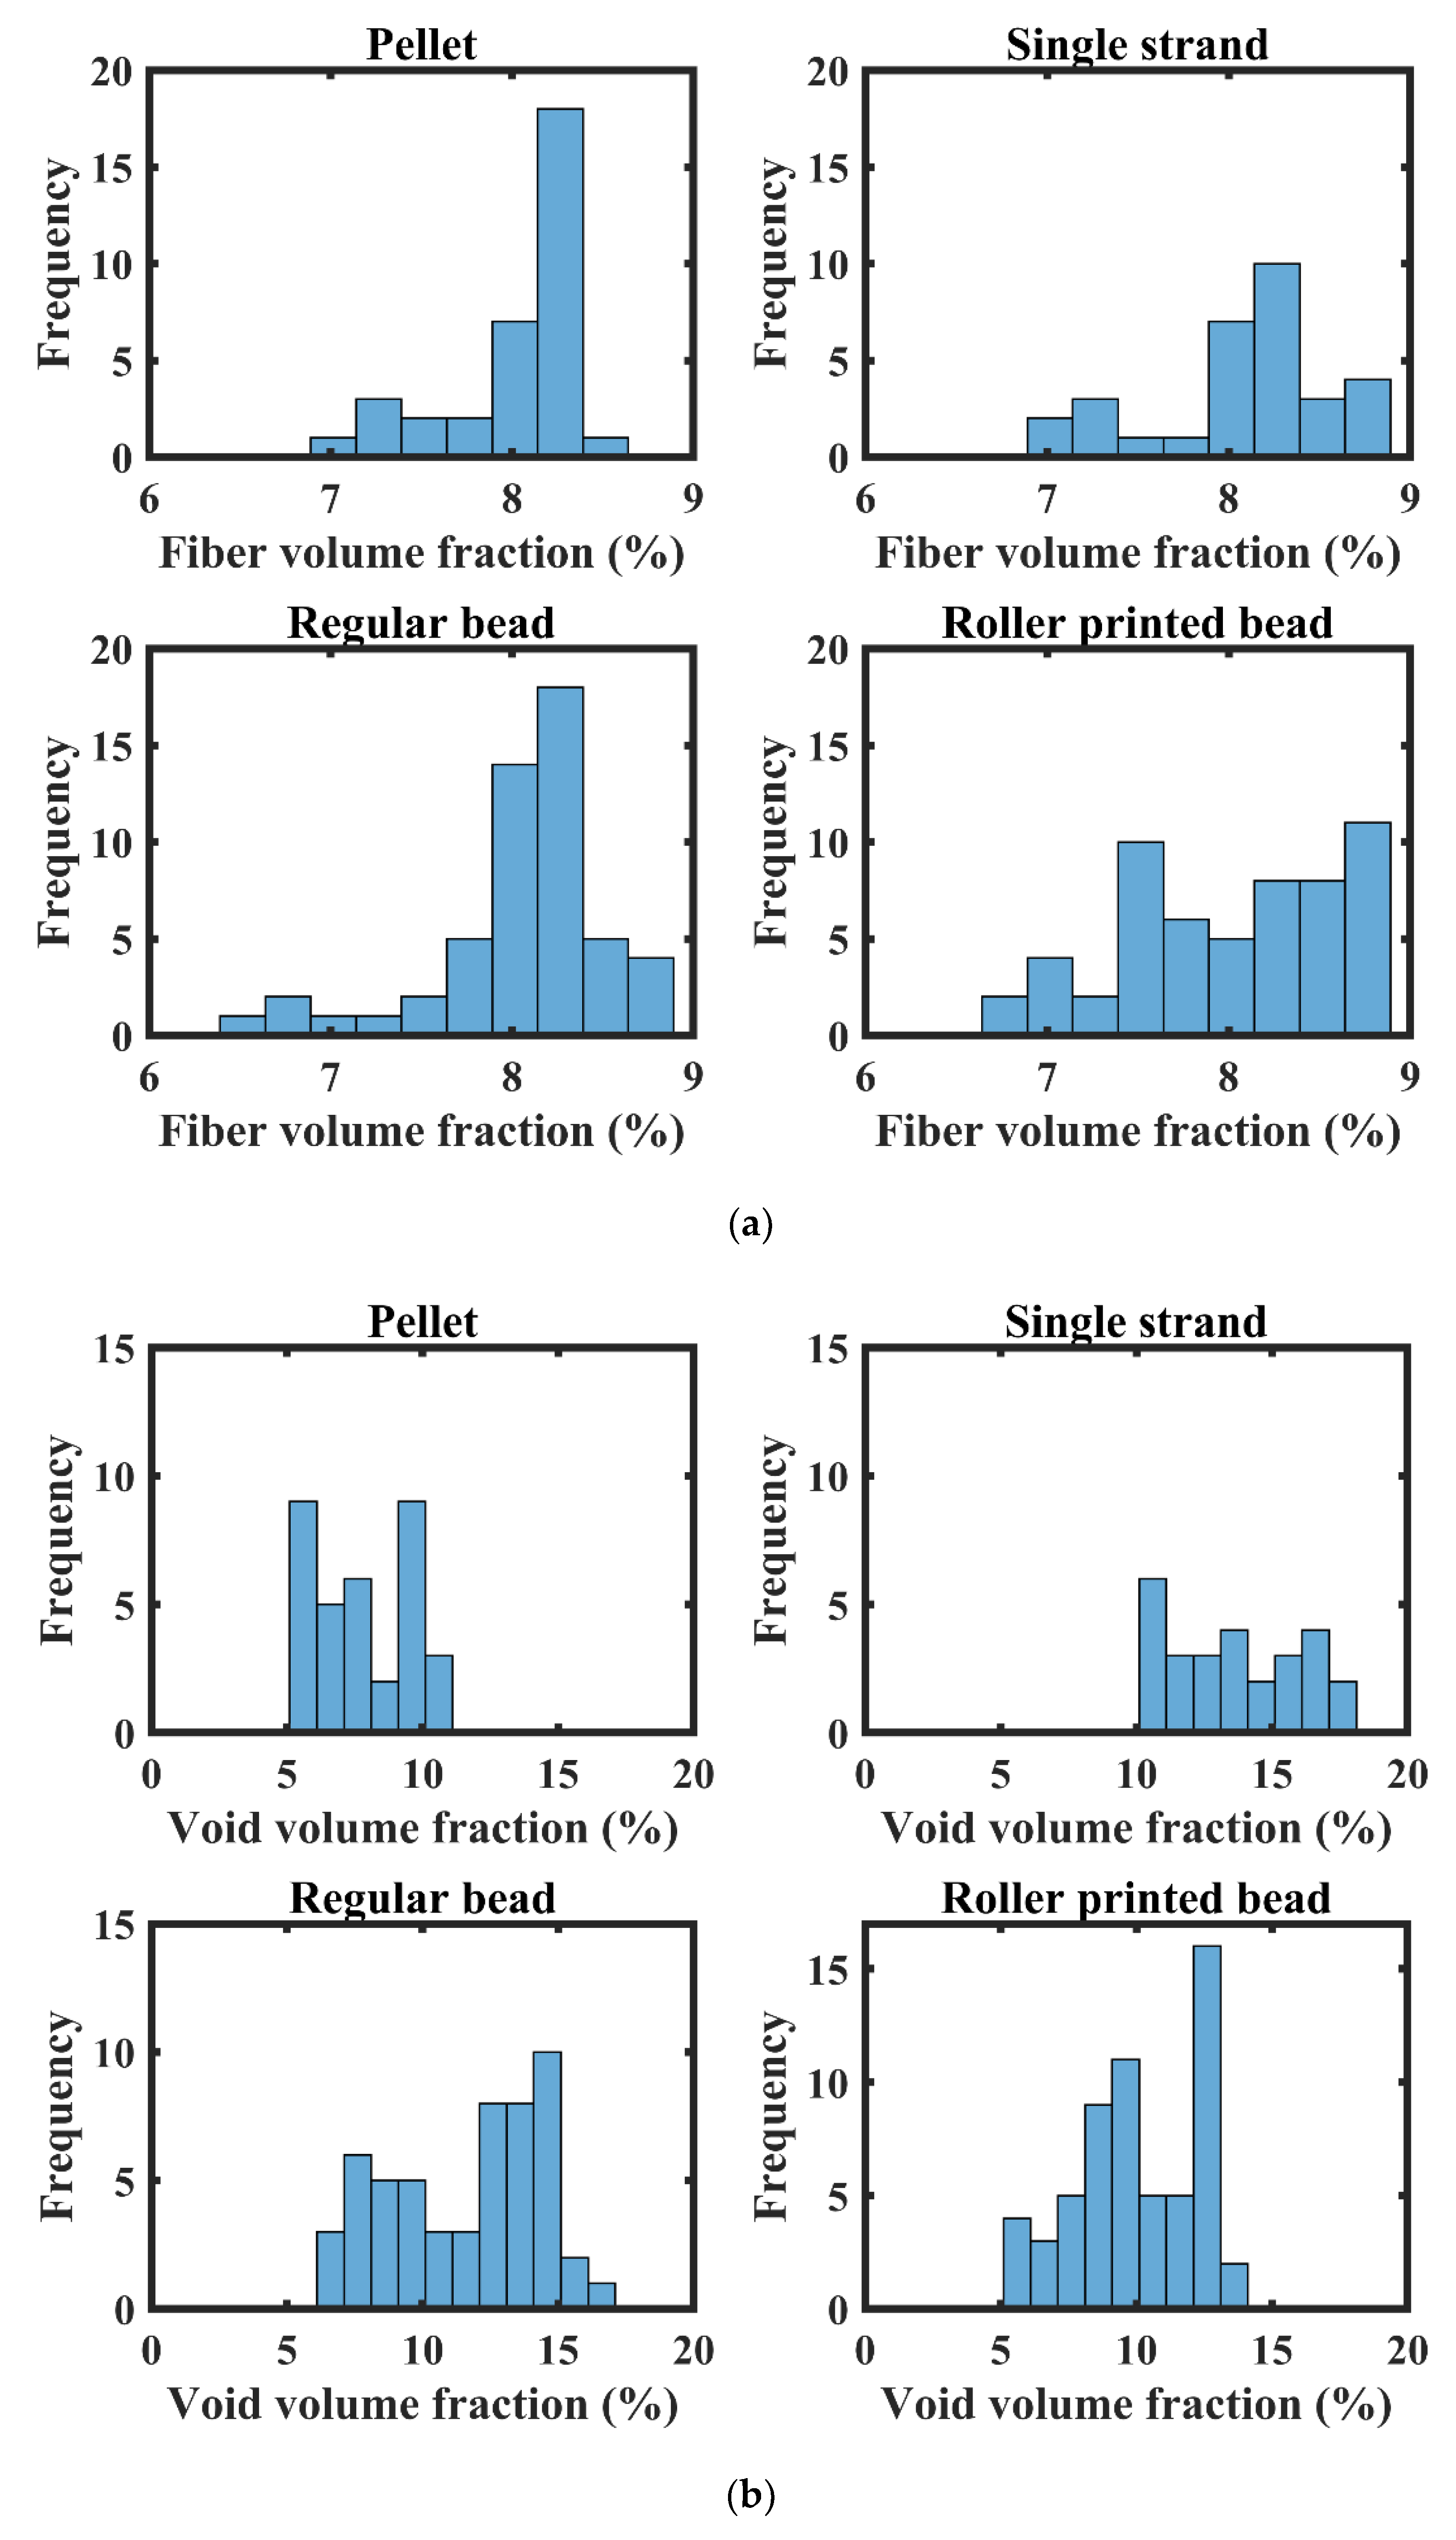
The fiber volume fraction, void volume fraction, void sphericity, and distribution within the samples through different stages of the LAAM processing appear in Figure A1. As shown in Figure A2a, a variation in the fiber volume fraction is seen within the pellet, which indicates that the fibers are not uniformly distributed within the pellet but instead exhibit a nonhomogeneous spatial distribution. Moreover, the measured values appearing in Figure A2a indicate that the range of the fiber volume fraction is lowest in the pellet. The fiber volume fraction variation is seen to increase after bead deposition on the print bed, which suggests that LAAM deposition processing causes more variation in the fiber concentration due to shear-induced fiber migration during extrusion/deposition, which introduces the resin and fiber rich regions within the beads. Fiber volume fraction variation also occurs in the post-process stage within the roller-printed bead due to the bead compression caused by the roller, which appears to change the distribution of the fibers within the polymer composite.
The measured results also indicate that the void volume fraction and void sphericity vary among the stages of the LAAM processing and across the various regions within all the samples, as shown in Figure A2b,c respectively. Among all the samples analyzed, the void volume fraction and void sphericity exhibit the most variation within the samples deposited on the printed bed (the regular and roller printed bead) as compared to the other samples. The lowest variation is seen within the pellet, similar to other microstructural characters, which suggests that the extrusion and deposition process also increases the non-homogeneity of the voids within the polymer composite microstructure. The variation in the fiber orientation along the extrusion/print direction () is also apparent within different regions of all the samples, as indicated in Figure A2d. Among all the samples, the highest variation in is seen within the roller-printed bead due to the polymer composite melt flow being influenced by the roller compression.

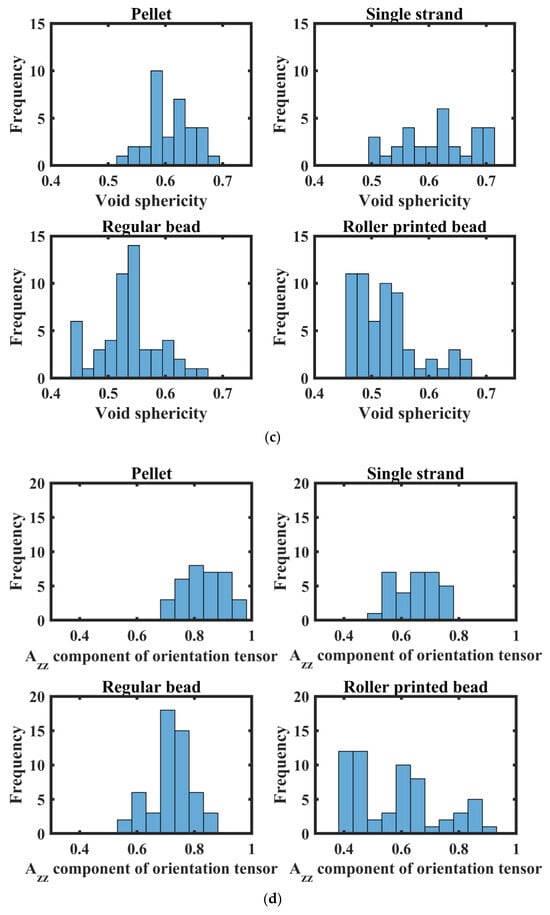
Figure A2.
Microstructural characteristics distribution within the samples through different stages of LAAM processing: (a) fiber volume fraction distribution; (b) void volume fraction distribution; (c) void sphericity distribution; and (d) fiber orientation along the print direction distribution.
Figure A2.
Microstructural characteristics distribution within the samples through different stages of LAAM processing: (a) fiber volume fraction distribution; (b) void volume fraction distribution; (c) void sphericity distribution; and (d) fiber orientation along the print direction distribution.

References
- Billah, K.M.M.; Lorenzana, F.A.R.; Martinez, N.L.; Wicker, R.B.; Espalin, D. Thermomechanical characterization of short carbon fiber and short glass fiber-reinforced ABS used in large format additive manufacturing. Addit. Manuf. 2020, 35, 101299. [Google Scholar] [CrossRef]
- Mulholland, T.; Goris, S.; Boxleitner, J.; Osswald, T.; Rudolph, N. Process-Induced Fiber Orientation in Fused Filament Fabrication. J. Compos. Sci. 2018, 2, 45. [Google Scholar] [CrossRef]
- Ning, F.; Cong, W.; Hu, Z.; Huang, K. Additive manufacturing of thermoplastic matrix composites using fused deposition modeling: A comparison of two reinforcements. J. Compos. Mater. 2017, 51, 3733–3742. [Google Scholar] [CrossRef]
- Pierce, J.B.; Smith, D.E. Modeling Carbon Fiber Suspension Dynamics for Additive Manufacturing Polymer Melt Flows; University of Texas at Austin: Austin, TX, USA, 2023. [Google Scholar] [CrossRef]
- Wang, Z.; Fang, Z.; Xie, Z.; Smith, D.E. A Review on Microstructural Formations of Discontinuous Fiber-Reinforced Polymer Composites Prepared via Material Extrusion Additive Manufacturing: Fiber Orientation, Fiber Attrition, and Micro-Voids Distribution. Polymers 2022, 14, 4941. [Google Scholar] [CrossRef]
- Pibulchinda, P.; Barocio, E.; Favaloro, A.J.; Pipes, R.B. Influence of printing conditions on the extrudate shape and fiber orientation in extrusion deposition additive manufacturing. Compos. Part B Eng. 2023, 261, 110793. [Google Scholar] [CrossRef]
- Blok, L.G.; Longana, M.L.; Yu, H.; Woods, B.K.S. An investigation into 3D printing of fibre reinforced thermoplastic composites. Addit. Manuf. 2018, 22, 176–186. [Google Scholar] [CrossRef]
- Van De Werken, N.; Tekinalp, H.; Khanbolouki, P.; Ozcan, S.; Williams, A.; Tehrani, M. Additively manufactured carbon fiber-reinforced composites: State of the art and perspective. Addit. Manuf. 2020, 31, 100962. [Google Scholar] [CrossRef]
- Goh, G.D.; Dikshit, V.; Nagalingam, A.P.; Goh, G.L.; Agarwala, S.; Sing, S.L.; Wei, J.; Yeong, W.Y. Characterization of mechanical properties and fracture mode of additively manufactured carbon fiber and glass fiber reinforced thermoplastics. Mater. Des. 2018, 137, 79–89. [Google Scholar] [CrossRef]
- Love, L.J.; Kunc, V.; Rios, O.; Duty, C.E.; Elliott, A.M.; Post, B.K.; Smith, R.J.; Blue, C.A. The importance of carbon fiber to polymer additive manufacturing. J. Mater. Res. 2014, 29, 1893–1898. [Google Scholar] [CrossRef]
- Advani, S.G.; Tucker, C.L., III. The use of tensors to describe and predict fiber orientation in short fiber composites. J. Rheol. 1987, 31, 751–784. [Google Scholar] [CrossRef]
- Lewicki, J.P.; Rodriques, J.N.; Zhu, C.; Worsley, M.A.; Wu, A.S.; Kanarska, Y.; Horn, J.D.; Duoss, E.B.; Ortega, J.M.; Elmer, W.; et al. 3D-Printing of Meso-structurally Ordered Carbon Fiber/Polymer Composites with Unprecedented Orthotropic Physical Properties. Sci. Rep. 2017, 7, 43401. [Google Scholar] [CrossRef]
- Hmeidat, N.S.; Elkins, D.S.; Peter, H.R.; Kumar, V.; Compton, B.G. Processing and mechanical characterization of short carbon fiber-reinforced epoxy composites for material extrusion additive manufacturing. Compos. Part B Eng. 2021, 223, 109122. [Google Scholar] [CrossRef]
- Yu, S.; Bale, H.; Park, S.; Hwang, J.Y.; Hong, S.H. Anisotropic microstructure dependent mechanical behavior of 3D-printed basalt fiber-reinforced thermoplastic composites. Compos. Part B Eng. 2021, 224, 109184. [Google Scholar] [CrossRef]
- Wright, W.J.; Koerner, H.; Rapking, D.; Abbott, A.; Celik, E. Rapid fiber alignment quantification in direct write printing of short fiber reinforced composites. Compos. Part B Eng. 2022, 236, 109814. [Google Scholar] [CrossRef]
- Yan, J.; Demirci, E.; Ganesan, A.; Gleadall, A. Extrusion width critically affects fibre orientation in short fibre reinforced material extrusion additive manufacturing. Addit. Manuf. 2022, 49, 102496. [Google Scholar] [CrossRef]
- Tekinalp, H.L.; Kunc, V.; Velez-Garcia, G.M.; Duty, C.E.; Love, L.J.; Naskar, A.K.; Blue, C.A.; Ozcan, S. Highly oriented carbon fiber–polymer composites via additive manufacturing. Compos. Sci. Technol. 2014, 105, 144–150. [Google Scholar] [CrossRef]
- Wang, Z.; Smith, D.E. Screw Swirling Effects on Fiber Orientation Distribution in Large-Scale Polymer Composite Additive Manufacturing; University of Texas at Austin: Austin, TX, USA, 2018. [Google Scholar] [CrossRef]
- Sayah, N.; Smith, D.E. Fiber and Void Property Correlation within Bead Microstructure of Large Area Additive Manufacturing Polymer Composites. Composites 2023, 13, 16. [Google Scholar]
- Wang, J.; Geng, C.; Luo, F.; Liu, Y.; Wang, K.; Fu, Q.; He, B. Shear induced fiber orientation, fiber breakage and matrix molecular orientation in long glass fiber reinforced polypropylene composites. Mater. Sci. Eng. A 2011, 528, 3169–3176. [Google Scholar] [CrossRef]
- Sosa-Rey, F.; Abderrafai, Y.; Lewis, A.D.; Therriault, D.; Piccirelli, N.; Lévesque, M. OpenFiberSeg: Open-source segmentation of individual fibers and porosity in tomographic scans of additively manufactured short fiber reinforced composites. Compos. Sci. Technol. 2022, 226, 109497. [Google Scholar] [CrossRef]
- Sun, X.; Mazur, M.; Cheng, C.-T. A review of void reduction strategies in material extrusion-based additive manufacturing. Addit. Manuf. 2023, 67, 103463. [Google Scholar] [CrossRef]
- Mehdikhani, M.; Gorbatikh, L.; Verpoest, I.; Lomov, S.V. Voids in fiber-reinforced polymer composites: A review on their formation, characteristics, and effects on mechanical performance. J. Compos. Mater. 2019, 53, 1579–1669. [Google Scholar] [CrossRef]
- Sayah, N.; Smith, D.E. Effect of the Print Bed Temperature on Void Distribution within the Microstructure of Short Carbon Fiber Reinforced/ABS Manufactured via Large Area Additive Manufacturing; University of Texas at Austin: Austin, TX, USA, 2023. [Google Scholar] [CrossRef]
- Sayah, N.; Smith, D.E. Effect of Process Parameters on Void Distribution, Volume Fraction, and Sphericity within the Bead Microstructure of Large-Area Additive Manufacturing Polymer Composites. Polymers 2022, 14, 5107. [Google Scholar] [CrossRef]
- Vaxman, A.; Narkis, M.; Siegmann, A.; Kenig, S. Void formation in short-fiber thermoplastic composites. Polym. Compos. 1989, 10, 449–453. [Google Scholar] [CrossRef]
- Awenlimobor, A.; Smith, D.E.; Wang, Z. Simulation of fiber-induced melt pressure fluctuations within large scale polymer composite deposition beads. Addit. Manuf. 2024, 80, 103980. [Google Scholar] [CrossRef]
- Sang, L.; Han, S.; Li, Z.; Yang, X.; Hou, W. Development of short basalt fiber reinforced polylactide composites and their feasible evaluation for 3D printing applications. Compos. Part B Eng. 2019, 164, 629–639. [Google Scholar] [CrossRef]
- Lin, L.; Ecke, N.; Huang, M.; Pei, X.-Q.; Schlarb, A.K. Impact of nanosilica on the friction and wear of a PEEK/CF composite coating manufactured by fused deposition modeling (FDM). Compos. Part B Eng. 2019, 177, 107428. [Google Scholar] [CrossRef]
- Kendall, K.; Howard, A.J.; Birchall, J.D.; Pratt, P.L.; Proctor, B.A.; Jefferis, S.A. The relation between porosity, microstructure and strength, and the approach to advanced cement-based materials. Philos. Trans. R. Soc. Lond. Ser. Math. Phys. Sci. 1997, 310, 139–153. [Google Scholar] [CrossRef]
- Hakim, I.A.; Donaldson, S.L.; Meyendorf, N.G.; Browning, C.E. Porosity Effects on Interlaminar Fracture Behavior in Carbon Fiber-Reinforced Polymer Composites. Mater. Sci. Appl. 2017, 8, 170–187. [Google Scholar] [CrossRef]
- Mattingly, F.L.; Franc, A.; Kunc, V.; Duty, C. Characterizing Internal Porosity of 3D-Printed Fiber Reinforced Materials; University of Texas at Austin: Austin, TX, USA, 2021. [Google Scholar] [CrossRef]
- Yudhanto, A.; Aldhirgham, A.; Feron, E.; Lubineau, G. Post-consolidation process for modifying microscale and mesoscale parameters of 3D printed composite materials. Front. Mater. 2023, 10, 1286840. [Google Scholar] [CrossRef]
- Nargis, R.A.; Jack, D.A. Fiber Orientation Quantification for Large Area Additively Manufactured Parts Using SEM Imaging. Polymers 2023, 15, 2871. [Google Scholar] [CrossRef]
- Sommacal, S.; Matschinski, A.; Drechsler, K.; Compston, P. Characterisation of void and fiber distribution in 3D printed carbon-fiber/PEEK using X-ray computed tomography. Compos. Part Appl. Sci. Manuf. 2021, 149, 106487. [Google Scholar] [CrossRef]
- Garcea, S.C.; Wang, Y.; Withers, P.J. X-ray computed tomography of polymer composites. Compos. Sci. Technol. 2018, 156, 305–319. [Google Scholar] [CrossRef]
- Dana, H.R.; Barbe, F.; Delbreilh, L.; Azzouna, M.B.; Guillet, A.; Breteau, T. Polymer additive manufacturing of ABS structure: Influence of printing direction on mechanical properties. J. Manuf. Process. 2019, 44, 288–298. [Google Scholar] [CrossRef]
- Mehdikhani, M.; Straumit, I.; Gorbatikh, L.; Lomov, S.V. Detailed characterization of voids in multidirectional carbon fiber/epoxy composite laminates using X-ray micro-computed tomography. Compos. Part Appl. Sci. Manuf. 2019, 125, 105532. [Google Scholar] [CrossRef]
- Diouf-Lewis, A.; Farahani, R.D.; Iervolino, F.; Pierre, J.; Abderrefaie, Y.; Lévesque, M.; Piccirelli, N.; Therriault, D. Design and characterization of carbon fiber-reinforced PEEK/PEI blends for Fused Filament Fabrication additive manufacturing. Mater. Today Commun. 2022, 31, 103445. [Google Scholar] [CrossRef]
- Yudhanto, A.; Lubineau, G.; Ventura, I.A.; Watanabe, N.; Iwahori, Y.; Hoshi, H. Damage characteristics in 3D stitched composites with various stitch parameters under in-plane tension. Compos. Part Appl. Sci. Manuf. 2015, 71, 17–31. [Google Scholar] [CrossRef]
- Stano, G.; Pavone, A.; Jafor, M.A.; Matalgah, K.; Percoco, G.; Fleck, T.J. Enhancing the sensitivity of 3D printed sensors via ironing and void reduction. Virtual Phys. Prototyp. 2024, 19, e2331153. [Google Scholar] [CrossRef]
- Russell, T.D. The Effects of Fiber Orientation on Stiffness and Thermal Expansion of Large Volume, Anisotropic, Short-Fiber, Composite Material Fabricated by Fused Filament Fabrication. Ph.D. Thesis, Baylor University, Waco, TX, USA, 2017. [Google Scholar]
- Available online: https://www.volumegraphics.com/_Resources/Persistent/9/5/2/f/952ffc933187f783dd8ba7beaac35c48191fcdbf/Brochure_VGSTUDIO_MAX_33_en.pdf (accessed on 26 June 2024).
- Shen, H.; Nutt, S.; Hull, D. Direct observation and measurement of fiber architecture in short fiber-polymer composite foam through micro-CT imaging. Compos. Sci. Technol. 2004, 64, 2113–2120. [Google Scholar] [CrossRef]
- Stano, G.; Sayah, N.; Smith, D.E.; Fleck, T.J. Effect of Process Parameters in Additively Manufactured Sensors prepared via Material Extrusion Processes: Correlation among Electrical, Mechanical and Microstructure Properties. Addit. Manuf. Lett. 2024, 9, 100194. [Google Scholar] [CrossRef]
- Available online: https://www.volumegraphics.com/en/products/vgsm/fiber-composite-material-analysis (accessed on 26 June 2024).
- Yang, D.; Zhang, H.; Wu, J.; McCarthy, E.D. Fibre flow and void formation in 3D printing of short-fibre reinforced thermoplastic composites: An experimental benchmark exercise. Addit. Manuf. 2021, 37, 101686. [Google Scholar] [CrossRef]
- Lopes, B.J.; d’Almeida, J.R.M. Initial development and characterization of carbon fiber reinforced ABS for future Additive Manufacturing applications. Mater. Today Proc. 2019, 8, 719–730. [Google Scholar] [CrossRef]
- Denos, B.R.; Sommer, D.E.; Favaloro, A.J.; Pipes, R.B.; Avery, W.B. Fiber orientation measurement from mesoscale CT scans of prepreg platelet molded composites. Compos. Part Appl. Sci. Manuf. 2018, 114, 241–249. [Google Scholar] [CrossRef]
- Wang, Z.; Smith, D.E. Numerical analysis of screw swirling effects on fiber orientation in large area additive manufacturing polymer composite deposition. Compos. Part B Eng. 2019, 177, 107284. [Google Scholar] [CrossRef]
- Heller, B.P.; Smith, D.E.; Jack, D.A. Planar deposition flow modeling of fiber filled composites in large area additive manufacturing. Addit. Manuf. 2019, 25, 227–238. [Google Scholar] [CrossRef]
- Cioica, N.; Coţa, C.; Nagy, M.; Ciutrilă, G. Thermoplastic Extrusion—A Method to Produce Starch-Based Loose Fill Packaging. Bull. Univ. Agric. Sci. Vet. Med. Cluj-Napoca Agric. 1970, 66, 2. [Google Scholar] [CrossRef]
- Wagner, A.; Yazici, R.; Kalyon, D.M. Extrudate swell behavior of glass fiber filled polyamide 6. Polym. Compos. 1996, 17, 840–849. [Google Scholar] [CrossRef]
- Lambert, J.; Chambers, A.R.; Sinclair, I.; Spearing, S.M. 3D damage characterisation and the role of voids in the fatigue of wind turbine blade materials. Compos. Sci. Technol. 2012, 72, 337–343. [Google Scholar] [CrossRef]
- Chambers, A.; Earl, J.; Squires, C.; Suhot, M. The effect of voids on the flexural fatigue performance of unidirectional carbon fibre composites developed for wind turbine applications. Int. J. Fatigue 2006, 28, 1389–1398. [Google Scholar] [CrossRef]
- Heller, B.P.; Smith, D.E.; Jack, D.A. Effects of extrudate swell and nozzle geometry on fiber orientation in Fused Filament Fabrication nozzle flow. Addit. Manuf. 2016, 12, 252–264. [Google Scholar] [CrossRef]
- Wang, Z.; Smith, D.E.; Jack, D.A. A statistical homogenization approach for incorporating fiber aspect ratio distribution in large area polymer composite deposition additive manufacturing property predictions. Addit. Manuf. 2021, 43, 102006. [Google Scholar] [CrossRef]
- Tagscherer, N.; Schromm, T.; Drechsler, K. Foundational Investigation on the Characterization of Porosity and Fiber Orientation Using XCT in Large-Scale Extrusion Additive Manufacturing. Materials 2022, 15, 2290. [Google Scholar] [CrossRef] [PubMed]


Disclaimer/Publisher’s Note: The statements, opinions and data contained in all publications are solely those of the individual author(s) and contributor(s) and not of MDPI and/or the editor(s). MDPI and/or the editor(s) disclaim responsibility for any injury to people or property resulting from any ideas, methods, instructions or products referred to in the content. |
© 2024 by the authors. Licensee MDPI, Basel, Switzerland. This article is an open access article distributed under the terms and conditions of the Creative Commons Attribution (CC BY) license (https://creativecommons.org/licenses/by/4.0/).