Abstract
This study investigates the mechanical properties of tiled laminates, frequently used in FRP bridges, and a completely new class of composites for which currently no experimental literature is available. In this paper, first a microscopic examination of laminates extracted from bridge deck flanges is performed, revealing complex multi-ply structures and tiled laminates in the transverse direction of the bridge deck. The subsequent fabrication of tiled laminates in the transverse (i.e., weak) and longitudinal (i.e., strong) span direction explores stiffness and strength characteristics depending on the stacking angle. It is observed that the stiffness in both directions is only slightly reduced with increasing stacking angles, reaching a maximum decrease of 10%, while the failure strength is significantly reduced, particularly with longitudinal tiling, dropping by approximately 70% for a 2° stacking angle. Transverse tiling demonstrates a more moderate 45% strength reduction due to the presence of some 90° plies. Given the small reduction in the stiffness and the fact that in many applications the design is mainly governed by serviceability (i.e., stiffness) requirements than strength, this strength reduction may be acceptable, considering other advantages of the concept. Additionally, this research sheds light on failure mechanisms, emphasizing the role of ply assembly in stress distribution and highlighting the importance of gradual ply ends in reducing strain concentrations. These findings provide valuable insights for optimizing tiled laminates in structural applications, ensuring their effective and reliable use.
1. Introduction
Bridges are typically constructed in reinforced concrete or steel and for small-span bridges perhaps in timber. In recent decades, a promising new material has slowly entered the civil engineering market: fiber-reinforced polymer (FRP) [1,2,3,4,5]. This material originates from the aerospace and aviation industry, where it has been in use for many years, mainly due to its remarkable strength-to-weight ratio. In addition to being relatively stronger and lighter than traditional building materials such as concrete and steel, it is more durable than timber, requiring less maintenance [6,7]. As a result, FRP has great potential for bridge construction, and especially when looking at pedestrian and bicycle bridges, international experience shows that this type of bridge offers added value. In combination with the greening of mobility, these types of bridges will become a much more important part of public infrastructure in the future [8]. The material also offers important assets for road bridges for light and moderate road traffic and bridge decks [9,10], and there are also many advantages associated with the use of composites in replacement and extension orders for existing bridges, such as the reuse of existing foundations and abutments, the limited installation time, cost and risks, the possible higher durability and lower total cost of ownership [11].
However, the lack of understanding about these new and promising materials by civil and structural engineers means that this option is either unknown or is still viewed with a certain degree of suspicion. Further, there are no standards at the European level for the calculation of FRP civil engineering structures, which poses several design difficulties, although a Technical Specification [12] is available, and several European countries have guidelines regarding the design of FRP constructions [13,14].
Another challenge in structural engineering is robustness, which is a basic requirement for all structural applications and includes that a structure shall be designed and executed in such a way that it will not be damaged by events such as explosion, impact and the consequences of human errors, to an extent disproportionate to the original cause [15]. Given the collapse of different bridges around the world, such as the Ponte Morandi in Italy [16], probably due to the collapse of a single structural member, this requirement speaks for itself. This robustness requirement poses a problem for traditional composite sandwich panels. There, the top and bottom skin have a plane parallel (PP, plies are parallel to the surfaces of the laminate) build-up separated by one monolithic core material (e.g., PUR foam). An apparent 3D crack between the top flange and the underlaying PUR foam core due to an impact on the bridge deck can quickly propagate under repeated loading, because there is no fiber reinforcement in the area perpendicular to the direction of propagation, possibly leading to catastrophic failure of the structure [17,18].
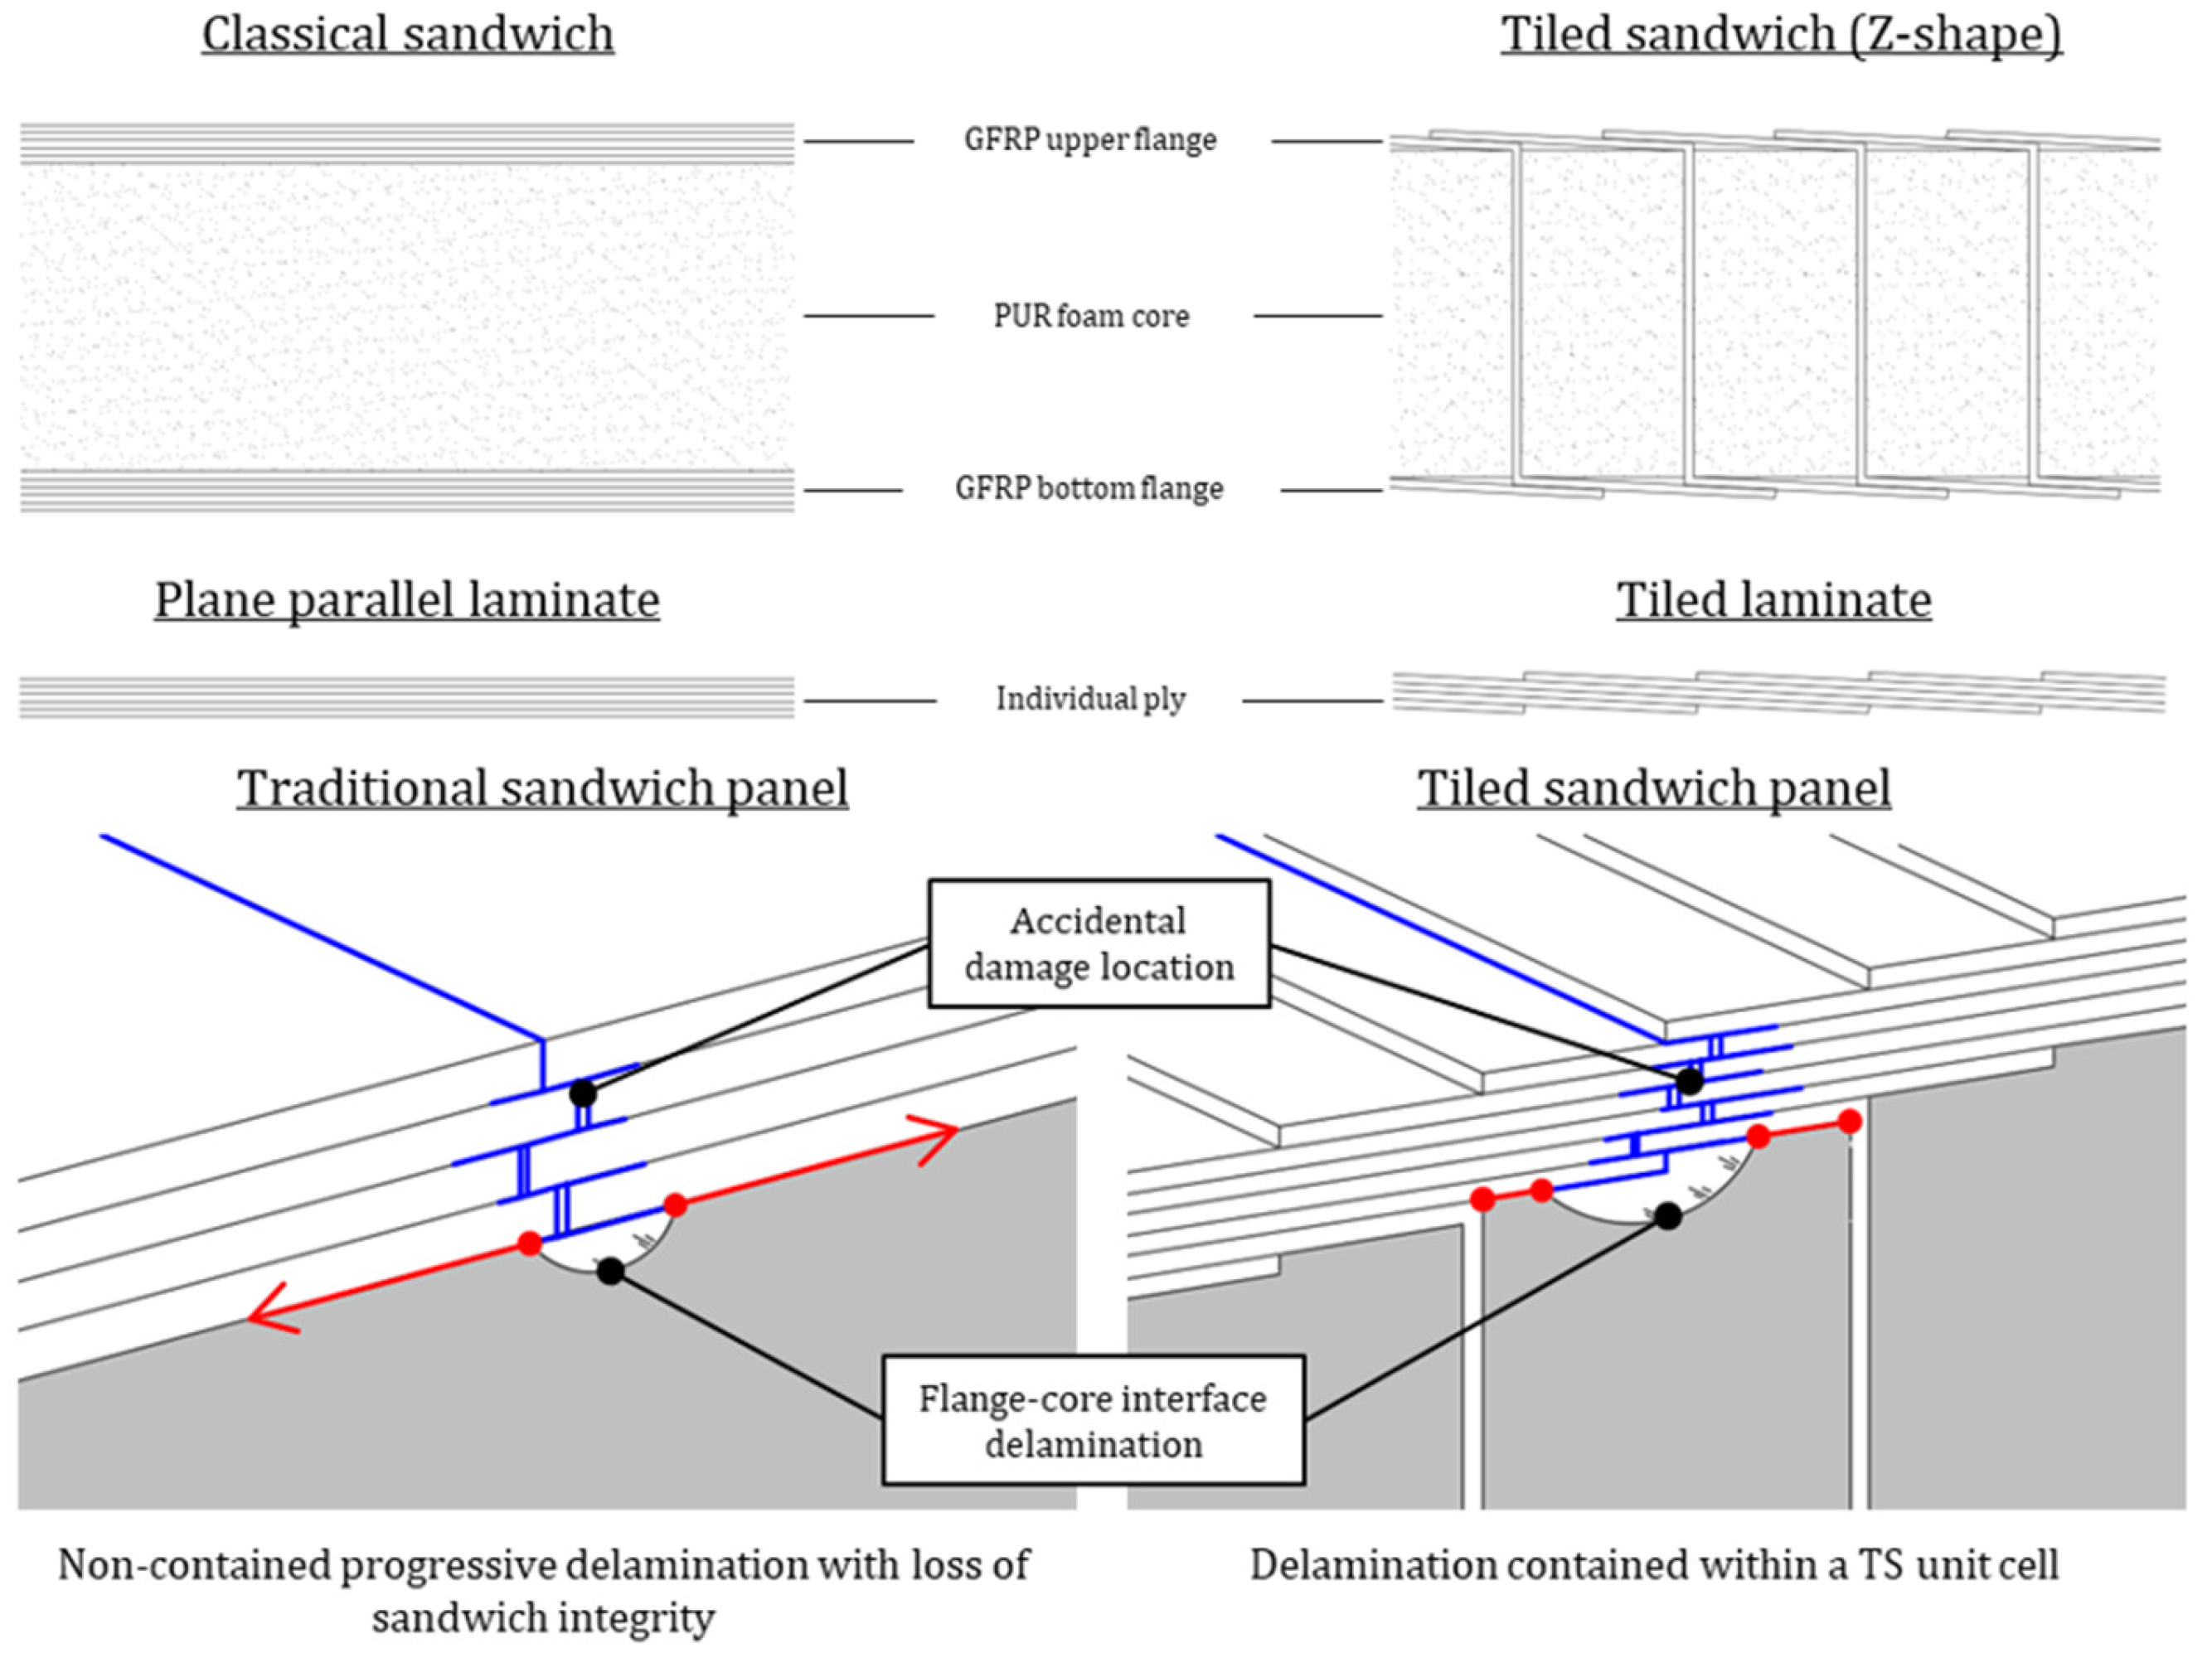
To limit the crack growth and ensure a damage-tolerant sandwich panel design, the monolithic PUR foam core from a traditional composite sandwich panel is divided into smaller individual foam blocks placed side by side. In between the foam blocks, the fabric layers of the skins are draped from the top skin, down to the bottom skin, leading to an innovative adaptation of the traditional composite sandwich panel. The draping can be performed in a Z or C shape as demonstrated in Figure 1. During the vacuum-assisted infusion (VARI) process used during manufacturing, the resin also fills the strips that connect the top skin and bottom skin, forming after curing solid longitudinal laminate stiffeners in the foam core. This concept is termed a tiled sandwich (TS) composite. Especially innovative is that skin–core delamination after accidental damage cannot propagate because of the fiber reinforcement perpendicular to the crack propagation rendering a robust sandwich panel design [8,19].
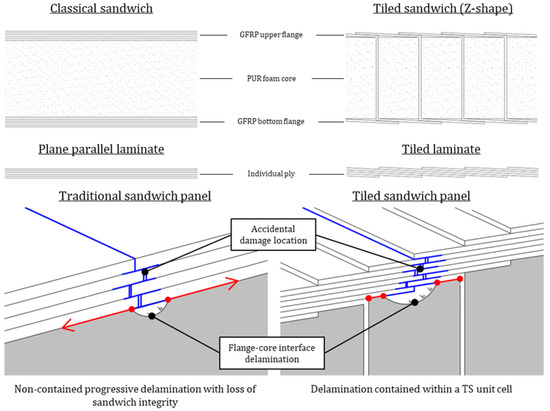
Figure 1.
Delamination propagation (red arrows) in a traditional composite sandwich panel with plane parallel laminate skin and a tiled sandwich panel with tiled laminate during and accidental damage (blue lines).
Because of the integration of core and skin reinforcement, a plate material in the skin of the TS panel is created in which the reinforcement is not parallel to the outer surfaces, but at a small angle. Such stacking is termed a tiled laminate (TL), as opposed to plane parallel (PP) in a traditional composite sandwich panel. In a cross-section, the various layers of reinforcement are limited in width, partially overlap and are interconnected by a suitable resin to form a rigid tiled structural material.
Essential material properties of TLs and TSs remain unknown, on the laminate level as well as on the sandwich level. The behavior of TLs for structural applications differs so considerably from the PP composites that the classical approaches to testing and modelling are insufficient or invalid. Therefore, an essential first step is to acquire a fundamental experimental understanding of the mechanics of this promising type of composite material. Therefore, an experimental framework is built up based on suitable experiments at the fundamental laminate (mesoscale) level of which the results are presented in this paper.
After this introduction, Section 2 describes the uniaxial tensile test method and its instrumentation. In Section 3, the axis orientations and denominations for the bridge deck, the laminates and the individual plies used in this paper are introduced. Further, in Section 4 coupons from the upper and lower flanges of a tiled web–core sandwich bridge deck panel are analyzed using microscopic examination. Here, the ply configurations in both the longitudinal (X-direction) and transverse (Y-direction) orientations are assessed, and the overall thickness and individual ply thicknesses are measured. Next, uniaxial tensile tests on these coupons are conducted to gain preliminary insights into the flange’s mechanical properties. Additional tensile tests on transverse coupons including webs explore the flange–web connection’s influence in more detail, monitoring damage initiation and propagation. In Section 5, TLs based on the microscopic findings of Section 4 are created in the lab and compared to PP laminates with identical ply configurations. Here, various lay-up techniques are examined, with differences between abrupt and gradual transitions in ply ends. Due to TLs’ tiled nature, inherent thickness and stiffness variations exist along the longitudinal centerline of the specimens, which are further explored in-depth. Global and local stiffness distinctions within a TL are studied, along with the influence of the stacking angle on global mechanical properties. Furthermore, TL failure behavior for the different lay-up techniques is studied using microscopic imaging along with a study of the longitudinal strains in TL coupons using DIC imaging. Finally, the mechanical properties of the tiling in the longitudinal and transverse directions are compared and discussed. Section 6 summarizes the general conclusions of this paper.
2. Uniaxial Tensile Test Method
In this study, experimental input was gathered from a uniaxial tensile test and was suitably instrumented using digital image correlation (DIC). For this, an Instron 5800R (Norwood, MA, USA) electro-mechanical tensile machine equipped with a 100 kN load cell is used and the measurement of the strains, following from the displacements, of the test specimen is achieved in the initial test series by an extensometer (Section 4.2) and, in all subsequent test series (Section 5.1 and Section 5.2) by a FLIR Point Grey (Wilsonville, OR, USA) DIC camera set as illustrated in Figure 2.
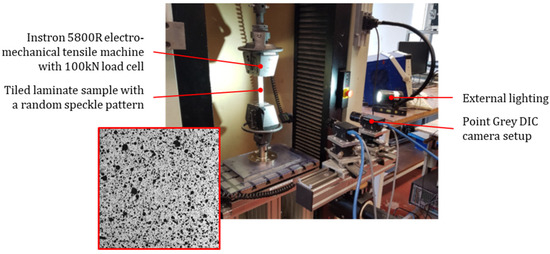
Figure 2.
Test setup uniaxial tensile test and DIC with inset of the sample speckle pattern.
The in-plane tensile properties (stiffness and strength) in two directions (longitudinal and transverse) of polymer matrix composite materials reinforced by high-modulus fibers are determined by a uniaxial tensile test. As guidance, ASTM D3039 is used to perform the tensile test even though the TL specimens are not symmetric nor balanced as prescribed by the standard. During this test, a thin flat strip of the laminate having a constant rectangular cross-section is mounted in the grips of the mechanical testing machine and monotonically loaded in tension with a constant crosshead displacement rate of 2 mm/min. The ultimate strength of the material can be determined from the maximum load carried at failure. Because the coupon strain is obtained from the displacement, monitored with DIC, the stress–strain response of the material can be determined, from which the ultimate tensile strain, tensile modulus of elasticity and Poisson’s ratio can be derived [20].
DIC is an innovative non-contact optical technique for measuring strain and displacement. The technique compares digital photographs of the surface of a test sample at different stages of deformation during the test [21]. By tracking blocks of pixels, called subsets [22], the system can measure surface displacement and construct full-field 2D and 3D deformation vector fields derived from these strain maps [23]. For DIC to work effectively, the subsets need to be random and unique with a range of contrast and intensity levels. For this reason, a random speckle pattern is applied to the surface of the samples, using low-viscosity spray paint to not bridge any newly created cracks in the specimen. To enlarge the contrast of the speckle pattern, first, a thinly applied white background is used before the random black speckle pattern is applied [24]. A high frame rate (5 Hz) is used for the cameras during the tests to obtain multiple photos each second which results in an underexposed image. Hence, an extra light source is added to the DIC set up to allow more light to enter the cameras, bringing up the exposure of the image gaining well-lit and useable images for the software to process. Further, the 3D DIC setup (Figure 2) includes two cameras. One is placed perpendicular to the speckle pattern, creating a 2D displacement image of the specimen, while the other is placed at an angle of 15° to retrieve the out of plane displacements. Both cameras are reciprocally synchronized to take pictures at the same time and to the test equipment to obtain a readout of the force at the exact moment a picture is taken.
In previous research, the authors have attempted to retrieve strain results from strain gauges or other sensors in the tiled direction. These attempts have been proven unsuccessful, due to the highly non-uniform nature of the strains along the gauge length in that direction. As such, no attempt is made to relate the DIC results to other strain measurement methods. Regarding the DIC, the quality of the surface pattern is checked each time by the software, and it is made sure that too large speckles (decorrelation) or too small speckles (anti-aliasing) are avoided. This, together with long-time experience by the authors with DIC (including many cross-verifications), and the fact that the results for the PP laminates are consistent, corroborate to this decision.
3. Axis orientations
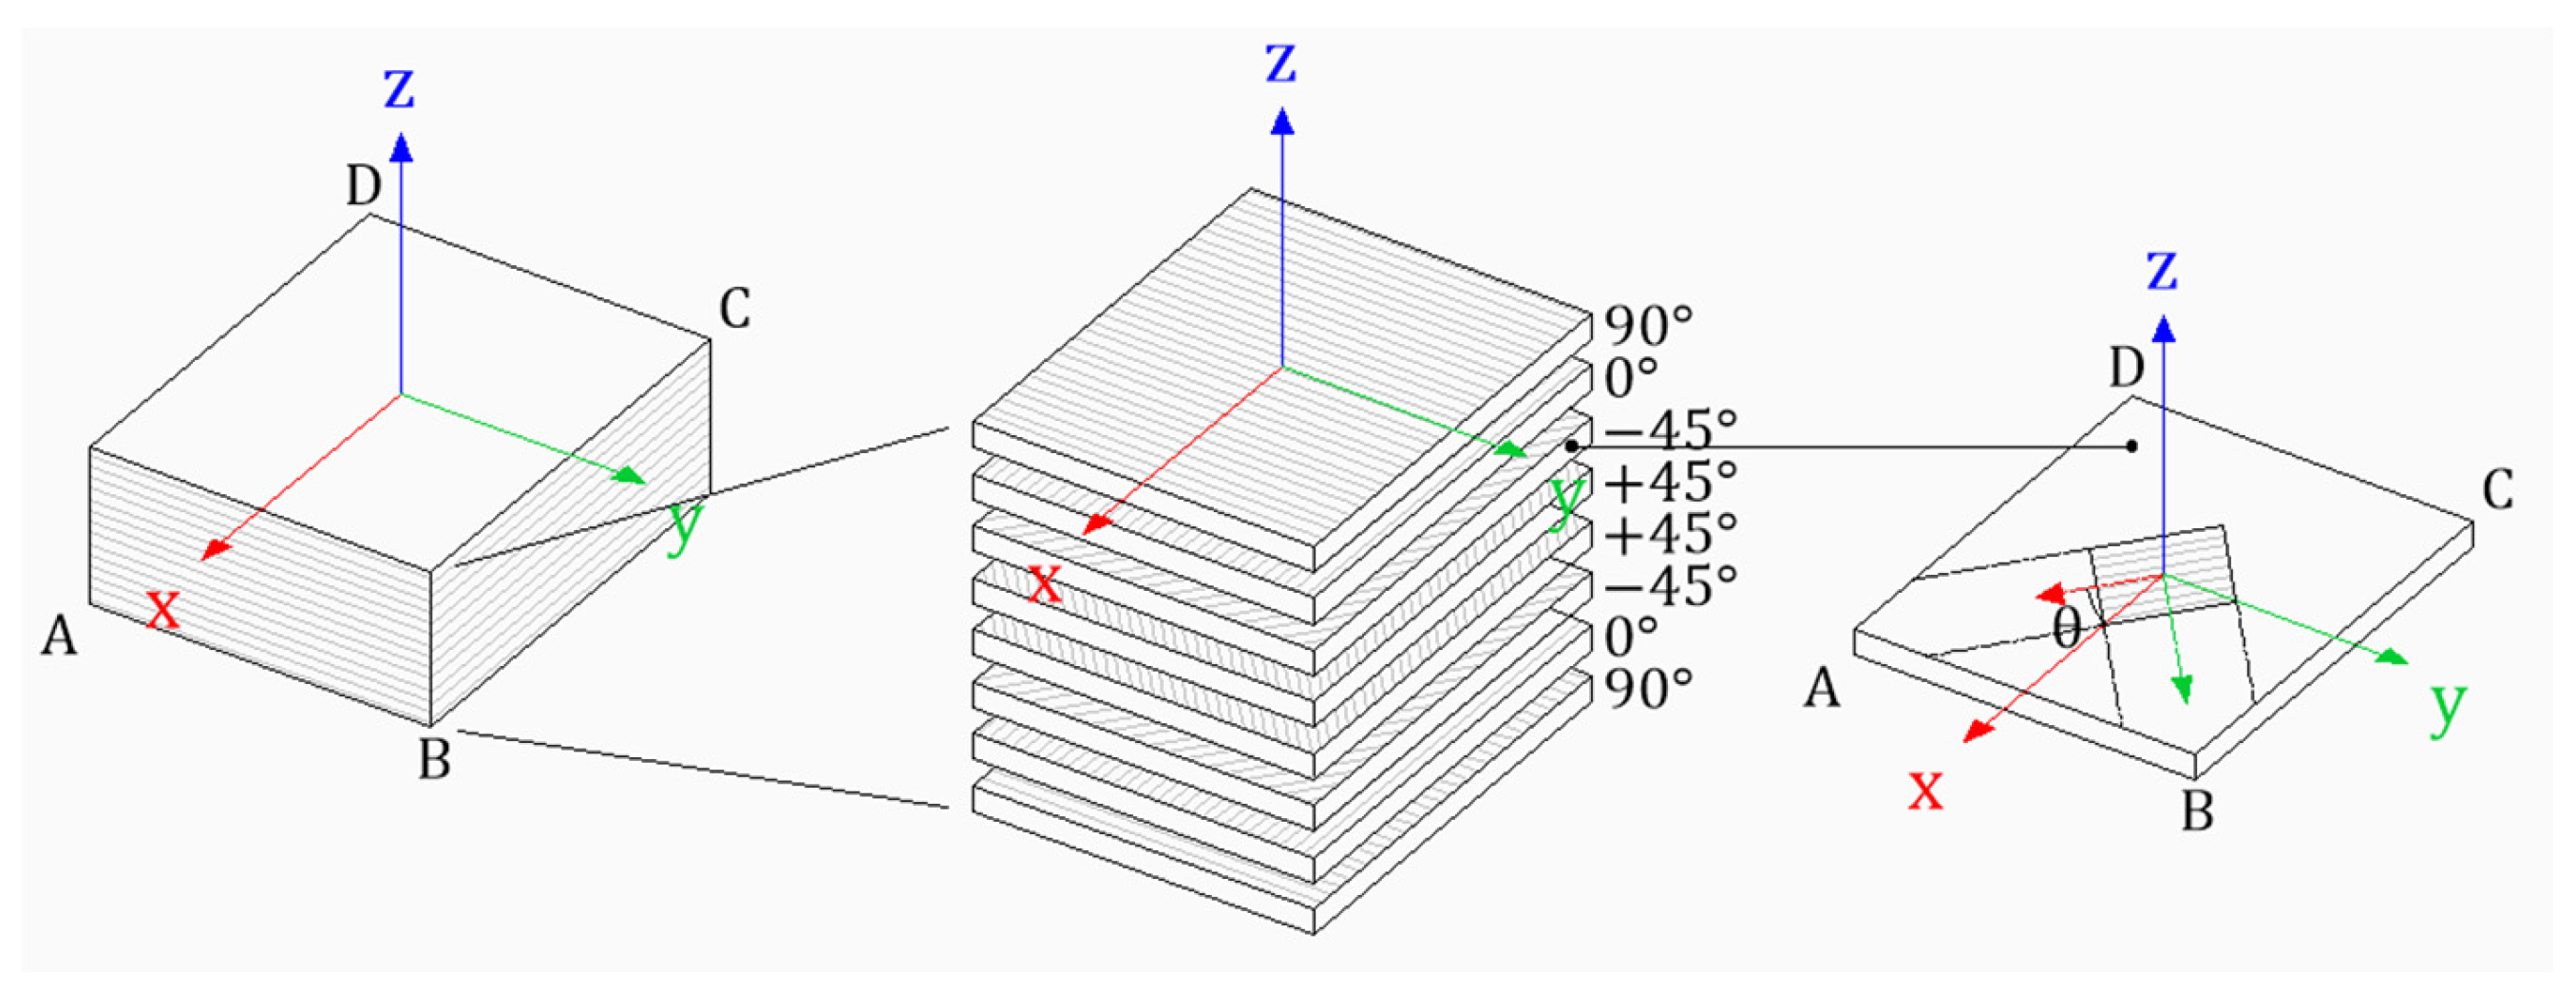
Before getting into more detail about the experimental results, it is important to understand the local and global axis orientations used in this paper to indicate the rotation of the individual plies in a laminate and the position of a laminate in the bridge deck. For fibers, plies and laminates, the axis orientations are as indicated in Figure 3.
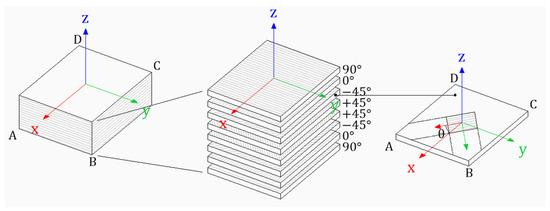
Figure 3.
Reference axes of an oriented ply abcd (1, 2) relative to global lamination axes (x, y) (plane ABCD) [13].
Here:
- The (1), (2), (3) local coordinate system is used for ply fiber direction, where (1) is in the direction of the fiber, (2) perpendicular to the fiber and (3) lies in the thickness direction of the ply.
- The x, y, z global coordinate system is used for indicating the directions of a laminate. Here, the x-direction always corresponds to the direction with the largest amount of fibers (i.e., the main loading direction in the structure) but not necessarily with the loading direction in the tensile test. Furthermore, the y-direction is perpendicular to it and the z-direction indicates the thickness of the laminate.
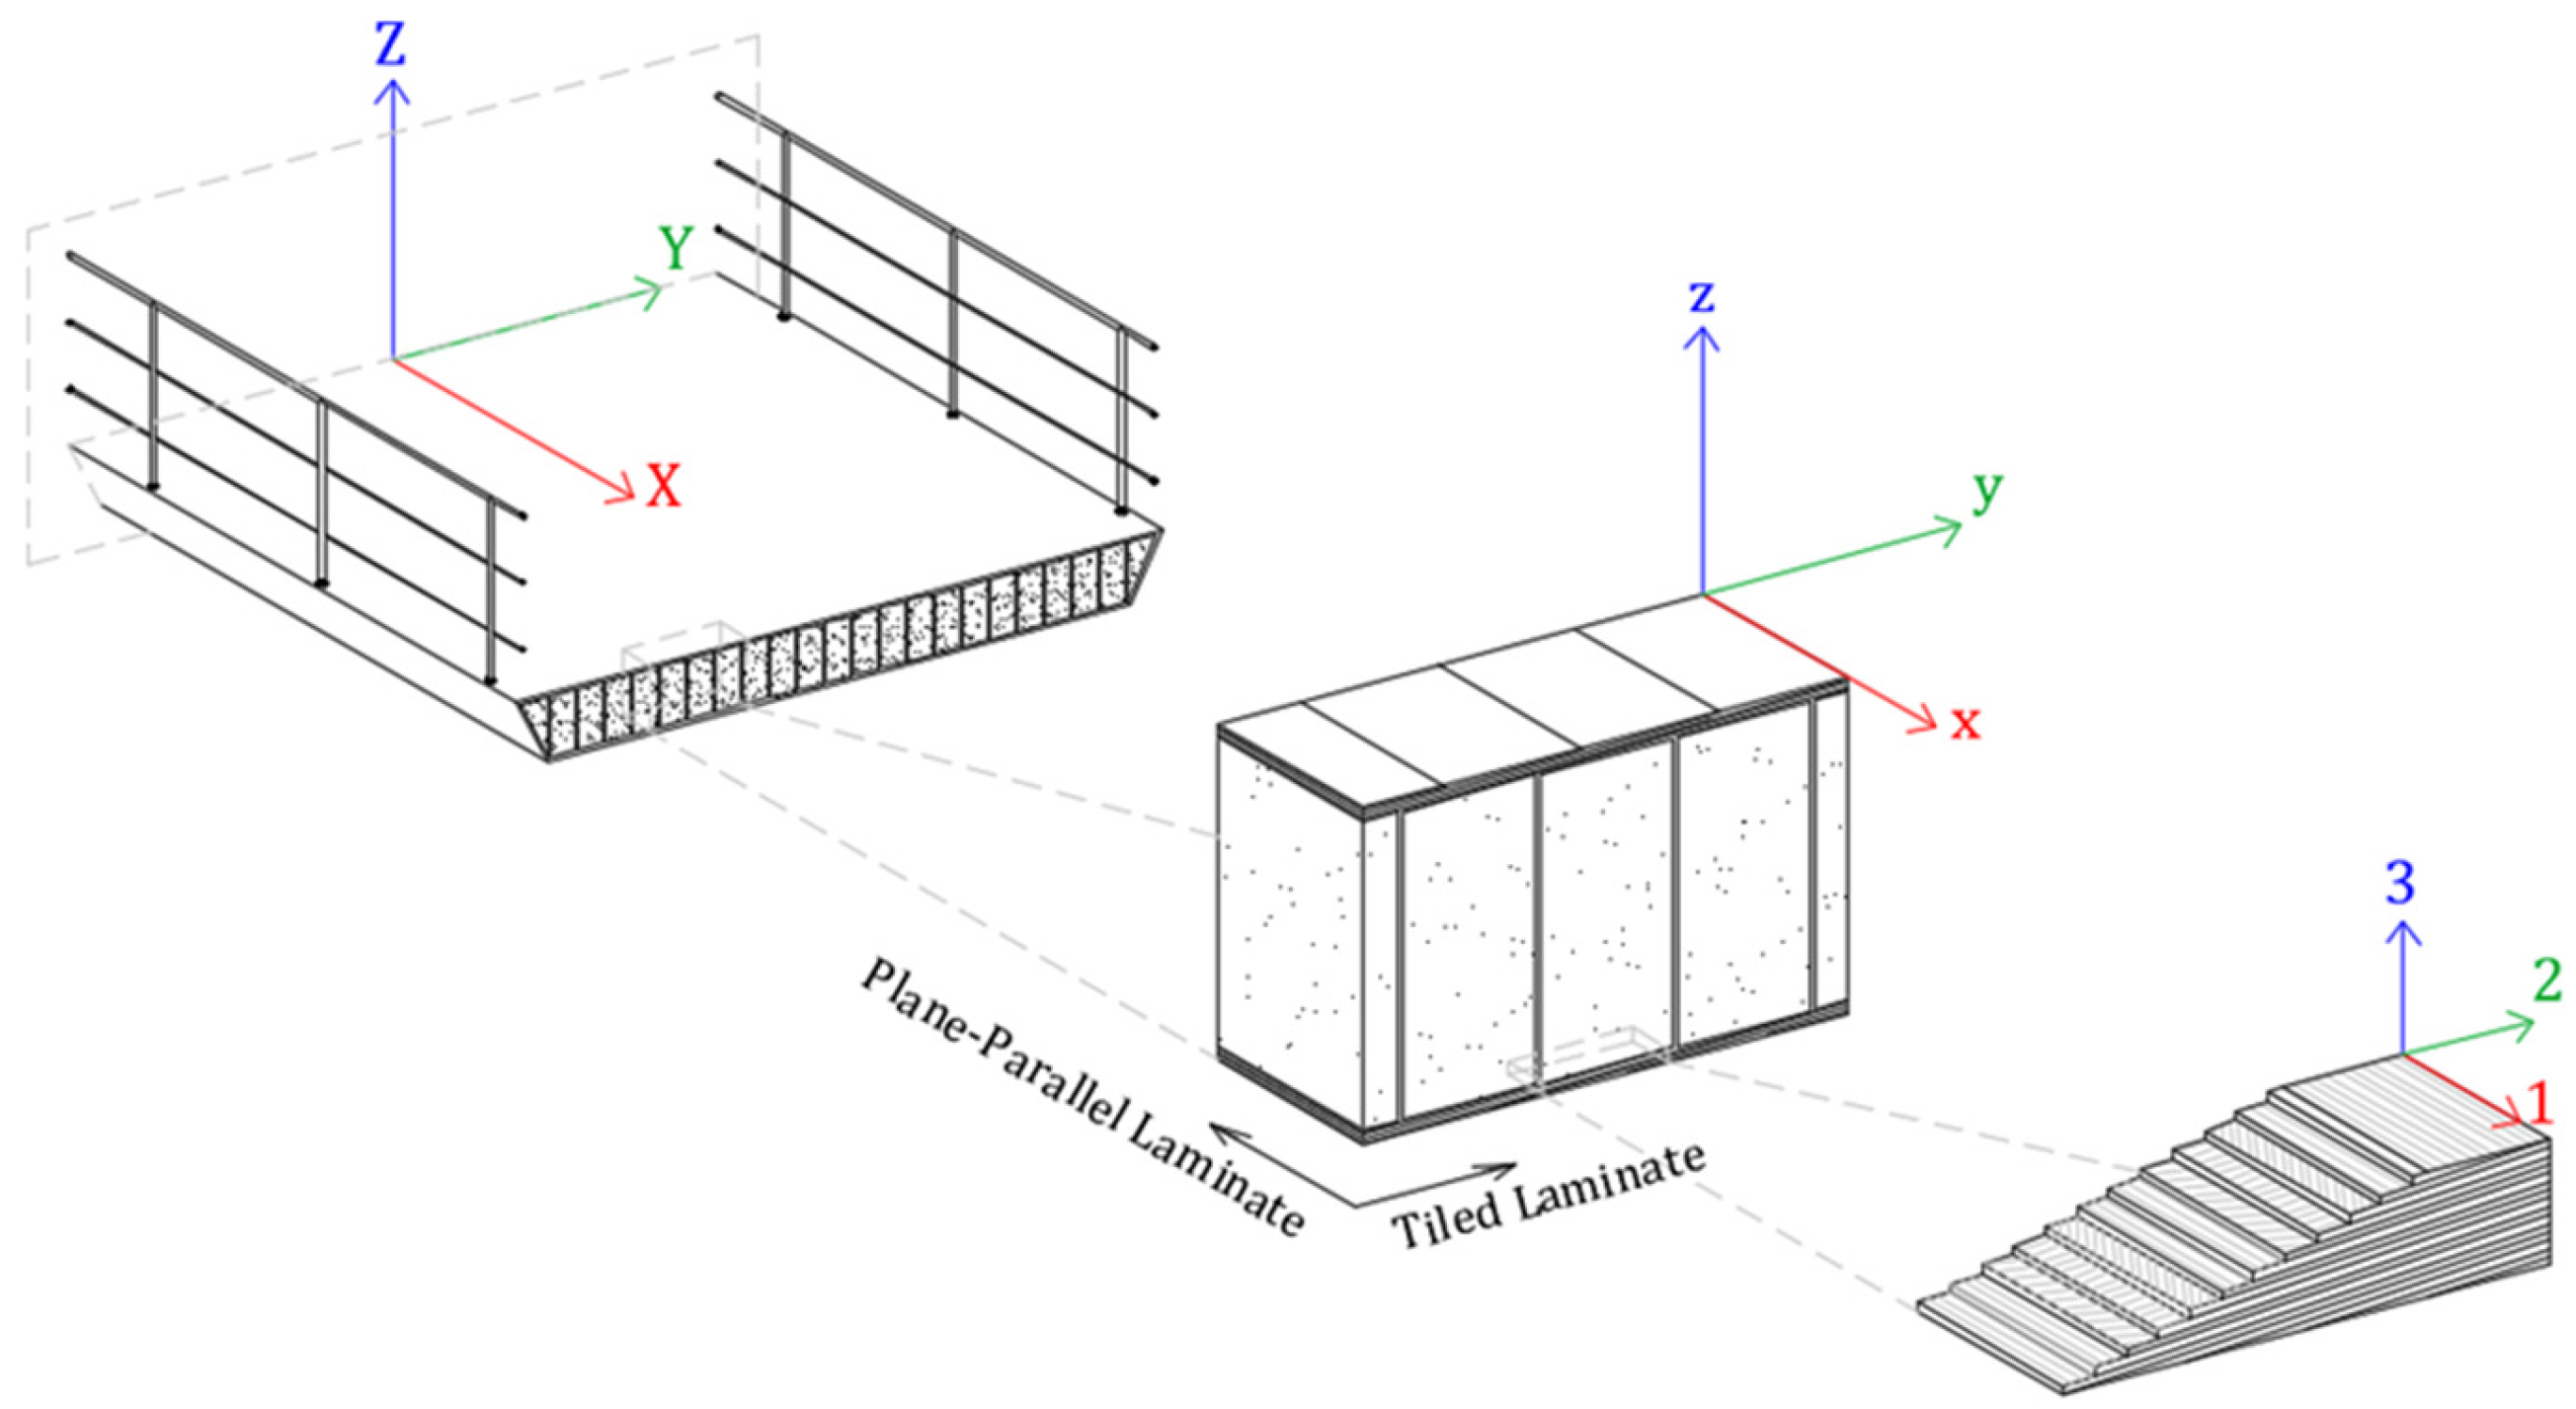
- For the global axes of a construction element (i.e., the bridge deck) the encoding X, Y, Z is used. In a bridge deck sandwich panel, the X-direction corresponds to the load bearing span direction of the bridge, while the Y- and Z-direction give the transverse unsupported and thickness direction of the bridge deck, respectively, as indicated in Figure 4.
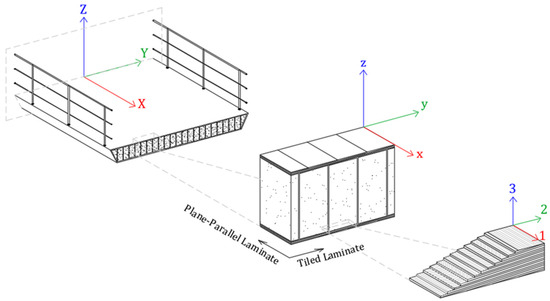 Figure 4. Internal orientation of the fiber plies in a tiled GFRP web–core sandwich footbridge.
For the top and bottom flange of the bridge deck, the local coordinate system of the laminates aligns with the global coordinate system of the bridge deck. This means that the x-direction of a laminate consequently matches the X-direction of the bridge deck. Transverse coupons of the top and bottom flange are thus tested in the global Y-direction of the bridge deck which corresponds to 90° directions and thus has the weakest stiffness.
4. GFRP Web–Core Sandwich Top and Bottom Flange
This section focuses on the mechanical properties of the top and bottom flanges of a GFRP tiled web–core sandwich bridge deck panel, through initial coupon tensile tests. In Section 4.1, Keyence microscopy imaging is employed to examine the ply structure, which includes the orientation of individual plies in both the longitudinal and transverse directions. Additionally, the total thickness of the top and bottom flanges is measured, as well as the thickness of the individual plies. Next, Section 4.2 delves into the tensile testing of coupons taken from the top and bottom flanges of a GFRP tiled web–core sandwich bridge deck panel in various directions (0°, 90°, and 45°, relative to both the x, y and X, Y coordinate systems). This section offers a more detailed analysis of their mechanical stiffness and strength, particularly in the transverse direction. Furthermore, the mechanical properties at the connection of the flanges and webs are investigated, as well as the initiation and propagation of cracks.
4.1. Microscopic Examination
The ply structure of the top and bottom flanges of a tiled web–core sandwich panel is studied based on Keyence microscopy imaging, including thickness measurements to precisely determine the thickness of the fiber plies and interlaminar resin layers. Theoretical ply orientation in the global longitudinal (x-axis) and transverse (y-axis) directions, relative to the bridge’s span direction, as shown in Figure 4, is validated using microscopic images of the top and bottom flanges of the TL web–core sandwich panel. After cutting, the cross-sections of the specimens are polished to obtain clear images of the ply structure under the microscope.
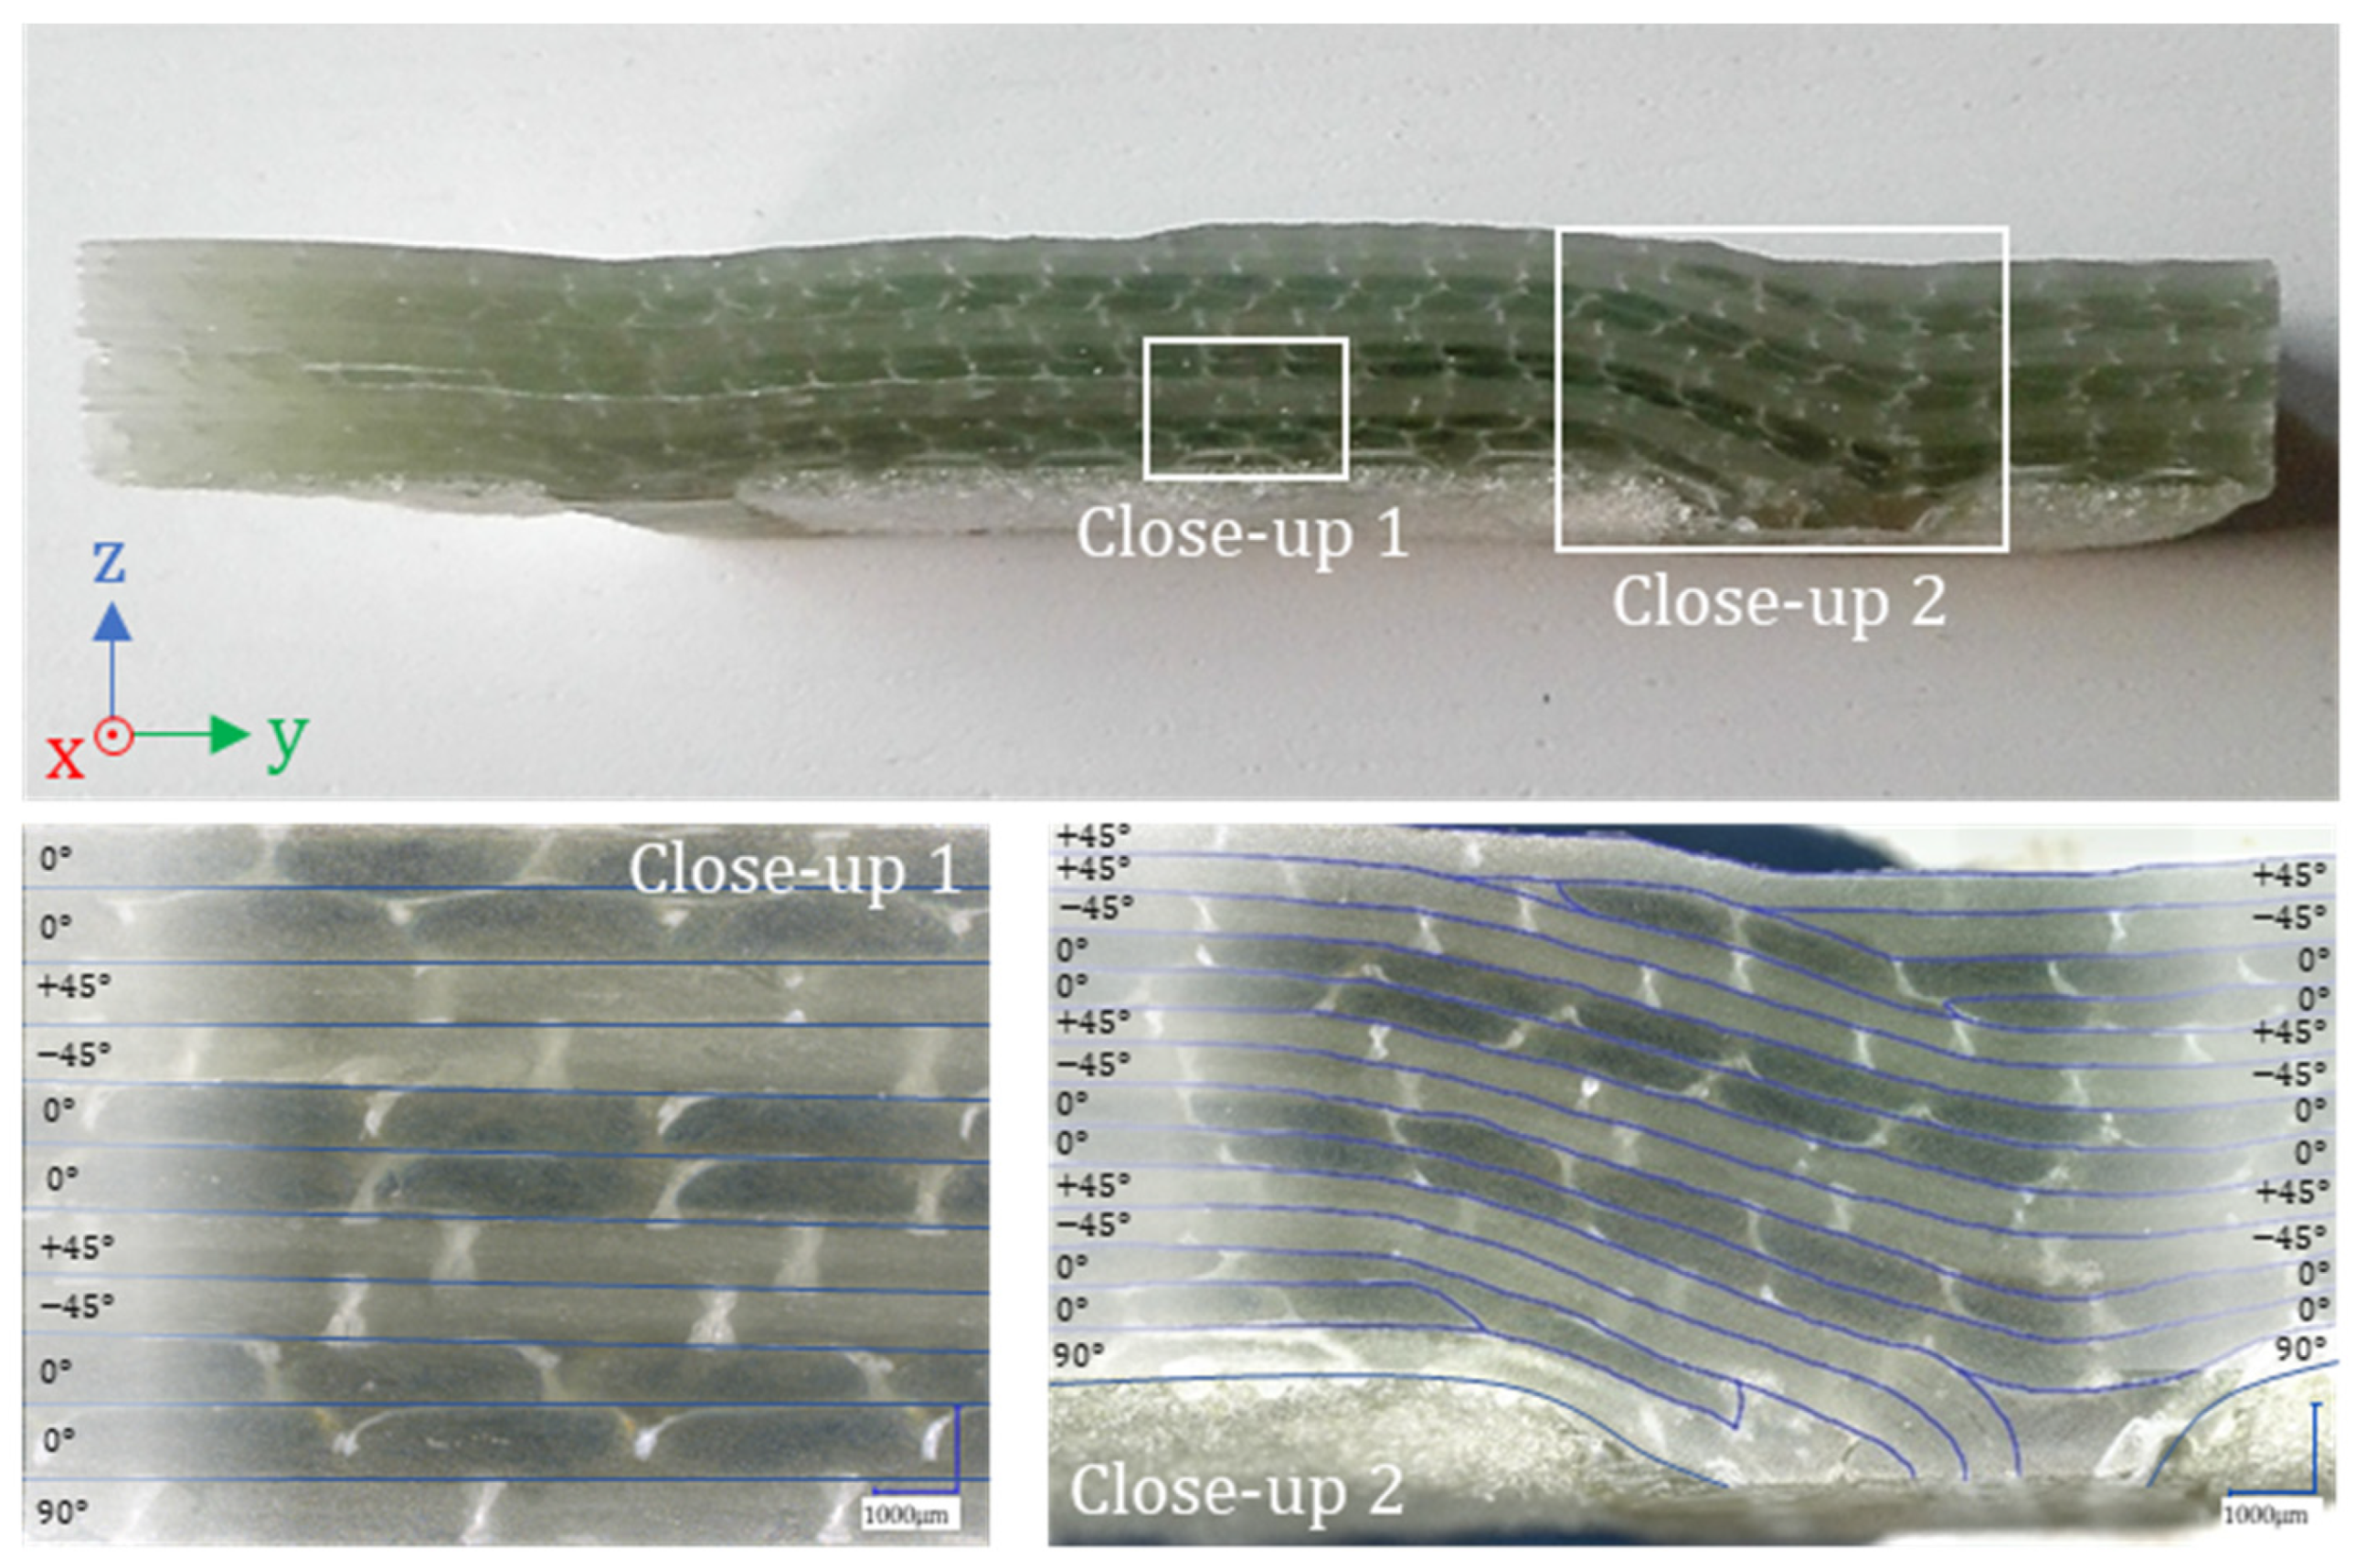
Figure 5 displays the polished transverse cross-section of the top flange, including a close-up microscopic image illustrating the ply configuration between two webs (Close-up 1 in Figure 5) and at a web location (Close-up 2 in Figure 5). In this figure, the UD 0° plies in the x-direction (span direction) appear as dark layers with elliptical fiber bundles, resulting from vacuum compression during production. The 0° plies are alternated with two lighter-colored layers representing the ±45° plies. These layers show slightly more elongated elliptical fiber bundles due to the angle at which the specimens were cut. Additionally, a single layer is noticeable on the bottom side of the transverse specimen, adjacent to the PUR foam core. This layer is noticeable around every PUR foam block and runs from the flange to the web plate exhibiting a concentric layer around the foam cores in Figure 5, indicating a 90° ply wound around the foam blocks. Finally, the resin-rich areas between the plies and fiber bundles are discernible as white regions.
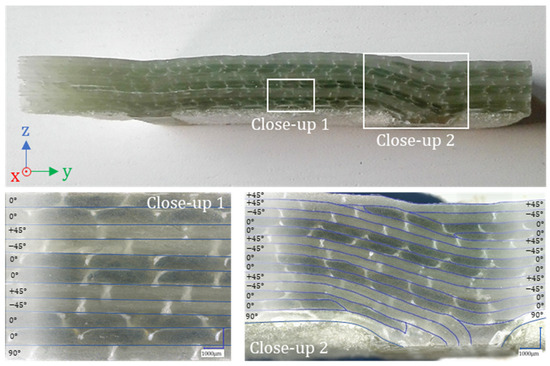
Figure 5.
Transverse cross-section (TL laminate) with Close-ups 1 and 2.
The top and bottom flanges consist of three fiber stacks at each random cross-section, each stack comprising two 0° plies and ±45° plies. Based on the second close-up image, the ±45° plies in the lower fiber stack deflect toward the web, while the 0° plies of the same stack terminate at the location of the web. In total, four layers are present in the webs, two 90° plies at the outside and the ±45° plies in the middle of the web. Here, the ±45° plies run from the top to the bottom flange along a Z shape connecting both flanges. Conversely, a new fiber stack with the same ply orientation starts at the same location at the top of the flange. However, the second close-up reveals that during the production process, the plies of the new fiber stack are shifted relative to each other, resulting in thickness differences along the transverse direction of the flange. Due to the interconnection of the top and bottom flanges by ±45° plies through the webs, a stacked structure is formed in the top and bottom flanges. However, this stacked or tiled structure is most pronounced at web locations, and the ply structure between these locations remains predominantly plane parallel.
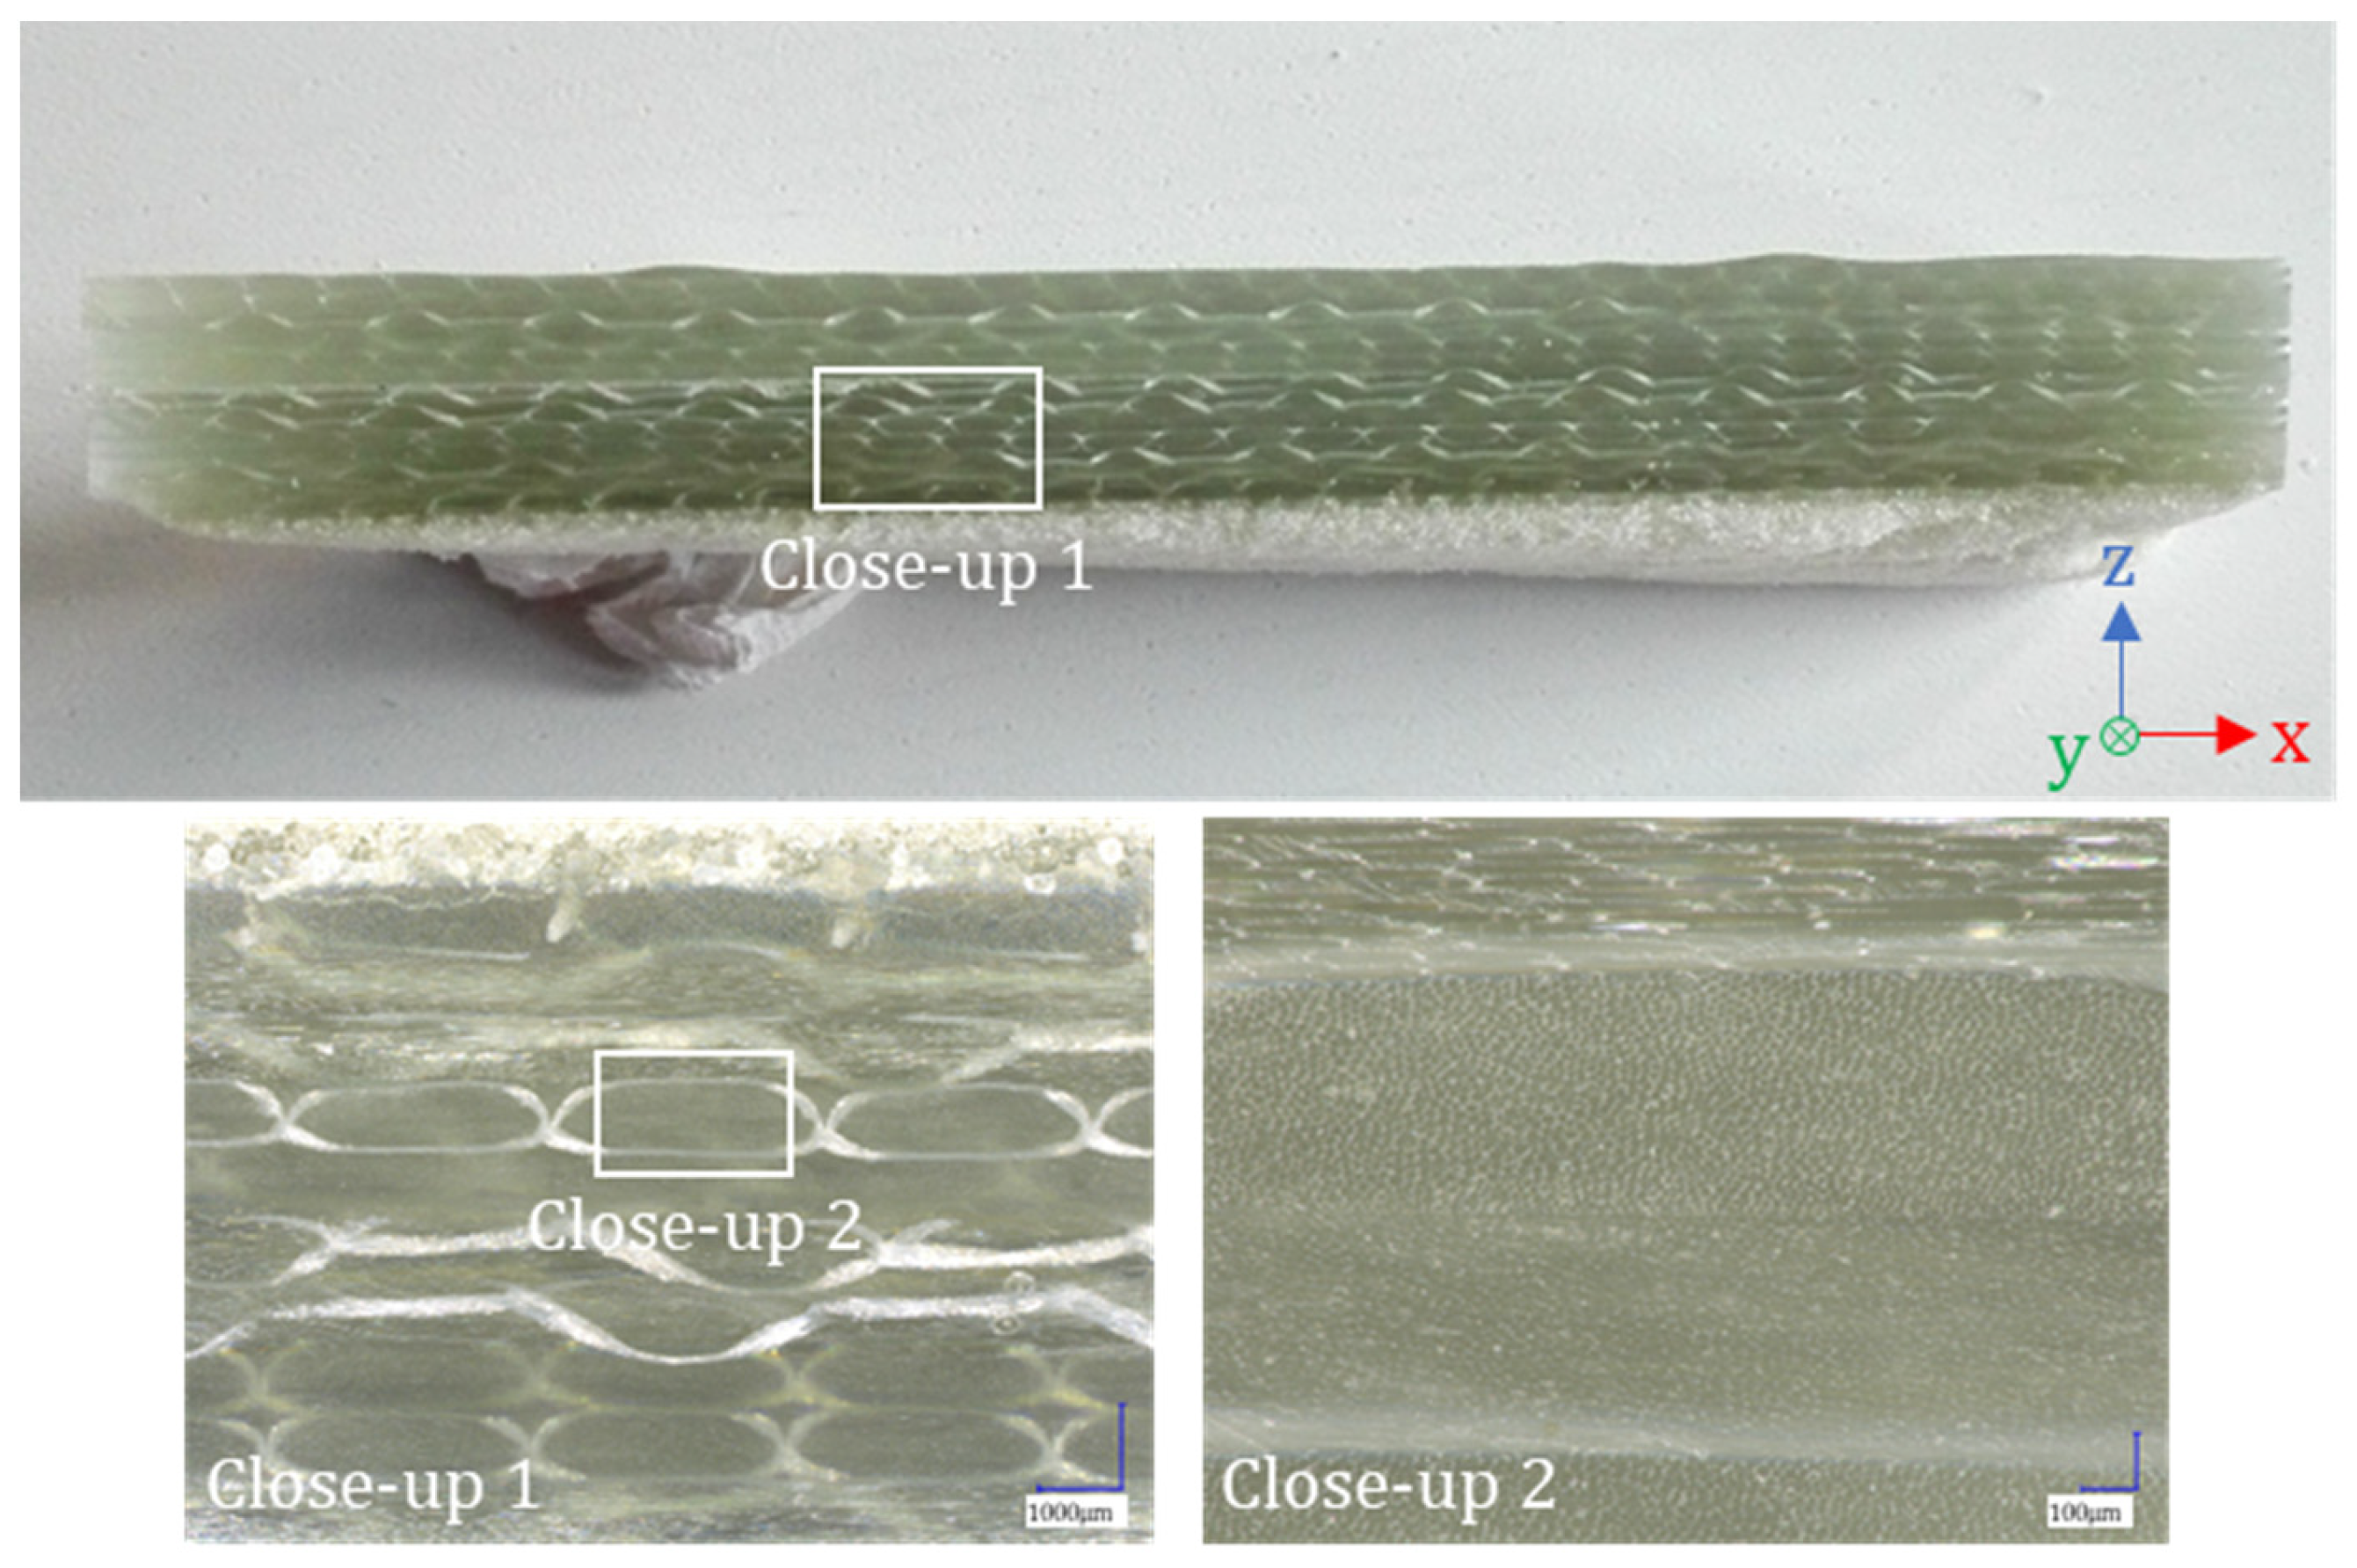
Figure 6 presents the polished longitudinal cross-section (in the bridge’s span direction (x-axis)) of the top flange, along with close-up microscopic images of the ply structure. The ±45° plies are distinguishable as elongated elliptical layers, similar to what can be observed in the first close-up. Detecting the 0° plies is more challenging as they are cut longitudinally according to the specimen’s cut. Close-up 2 in Figure 6 shows the stitching fibers binding the rovings of the ±45° plies together as thin white layers. In contrast to the transverse cross-section of the bridge, the ply structure in the span direction is entirely plane parallel.
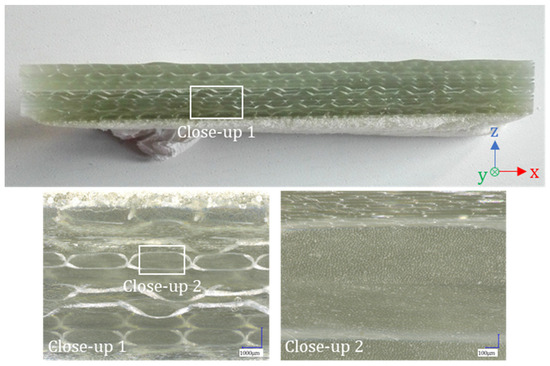
Figure 6.
Longitudinal cross-section (PP laminate) with Close-ups 1 and 2.
In addition to verifying the ply structure in the longitudinal and transverse directions of the top and bottom flanges of the TL web–core sandwich unit cell, the thicknesses of the different plies in the structure are analyzed. It is worth noting that there is some variation in the thickness measurements due to the manual measurement process on the microscope images. Additionally, in VARI production, there is uneven pressure distribution over the laminates of the bridge, resulting in non-uniform resin distribution within the element.
A Keyence microscope is employed, and as a preliminary step, the total thicknesses of the top and bottom flanges are determined. The average total thicknesses of the top and bottom flanges, measured at various points along the specimen’s length, fall within the range of 10,104 µm to 10,782 µm. Subsequently, the thickness of the fiber plies and the interlaminar resin layer are determined, which range from 668 to 823 µm and 55 to 87 µm, respectively. Moreover, resin-rich regions at various locations in the laminates are identified, such as at the connection points of the top and bottom flanges with the webs and at the start or end of a ply.
Based on the microscopic images, it can be generalized that in the transverse direction (90° direction) of the bridge, the laminates in the top and bottom flanges exhibit a stacked/tiled configuration with a specific stacking angle. This stacking angle is more pronounced at locations where the flanges intersect with the webs. At these locations, ply ends are also observed, running longitudinally. In contrast, the ply lay-up in the span or longitudinal direction (i.e., X-direction = x-direction = 0° direction) of the bridge’s laminates is consistently plane parallel.
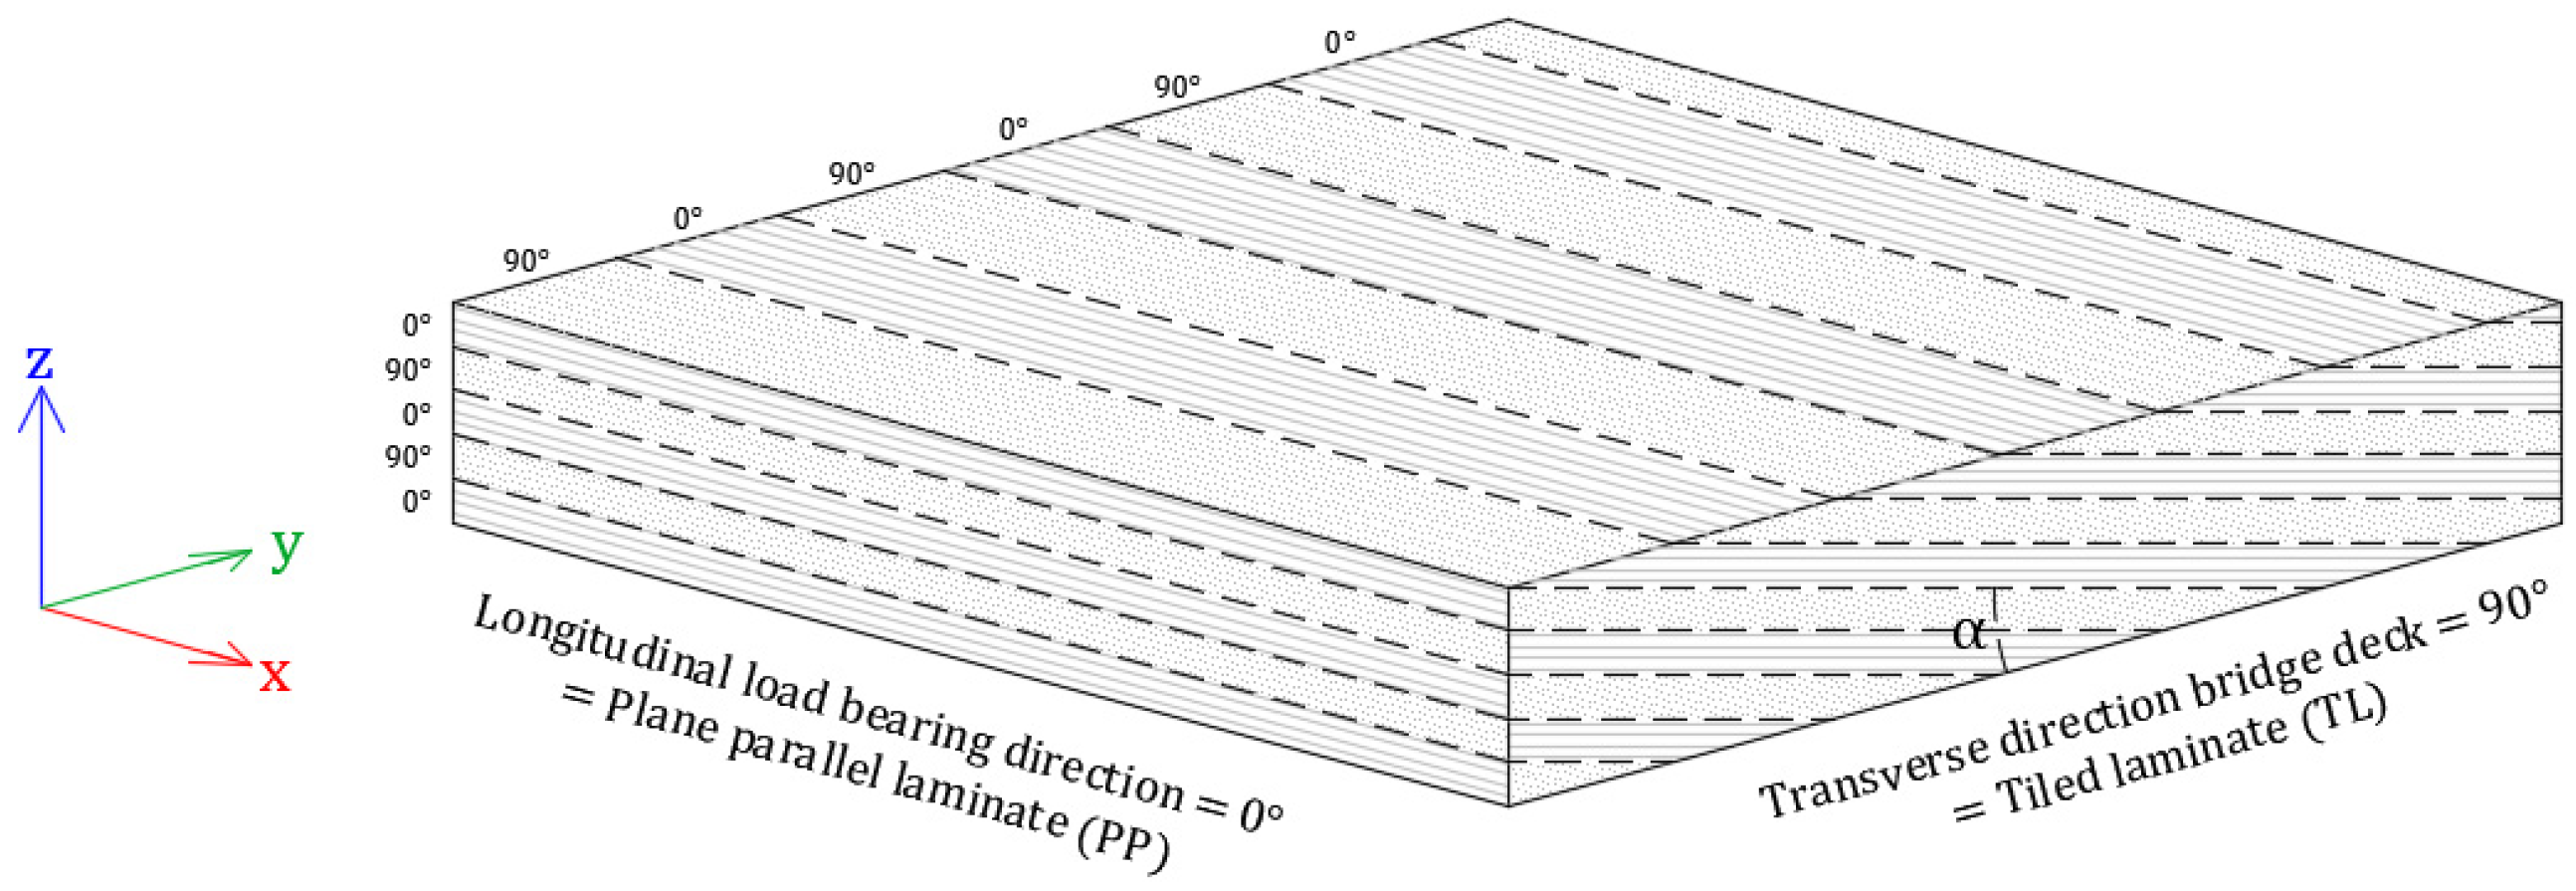
Figure 7 provides a graphical representation of the theoretical laminate lay-up in the top and bottom flanges at the flange–web connection in both the transverse and longitudinal directions of a web–core sandwich panel bridge deck. The stacking angle relative to the top surface is also illustrated here as α. However, as indicated in Figure 5, this tiled laminate lay-up is only applicable at the flange–web connection points. In the areas between these points, the laminate lay-up in the transverse direction is equivalent to a plane parallel configuration.
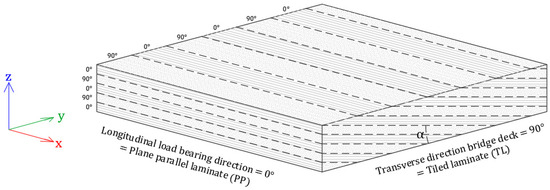
Figure 7.
Graphical illustration of the laminate lay-up at the flange–web connection in the transverse and longitudinal direction of the laminate in the top and bottom flange of a web–core sandwich panel bridge deck.
4.2. Tensile Testing
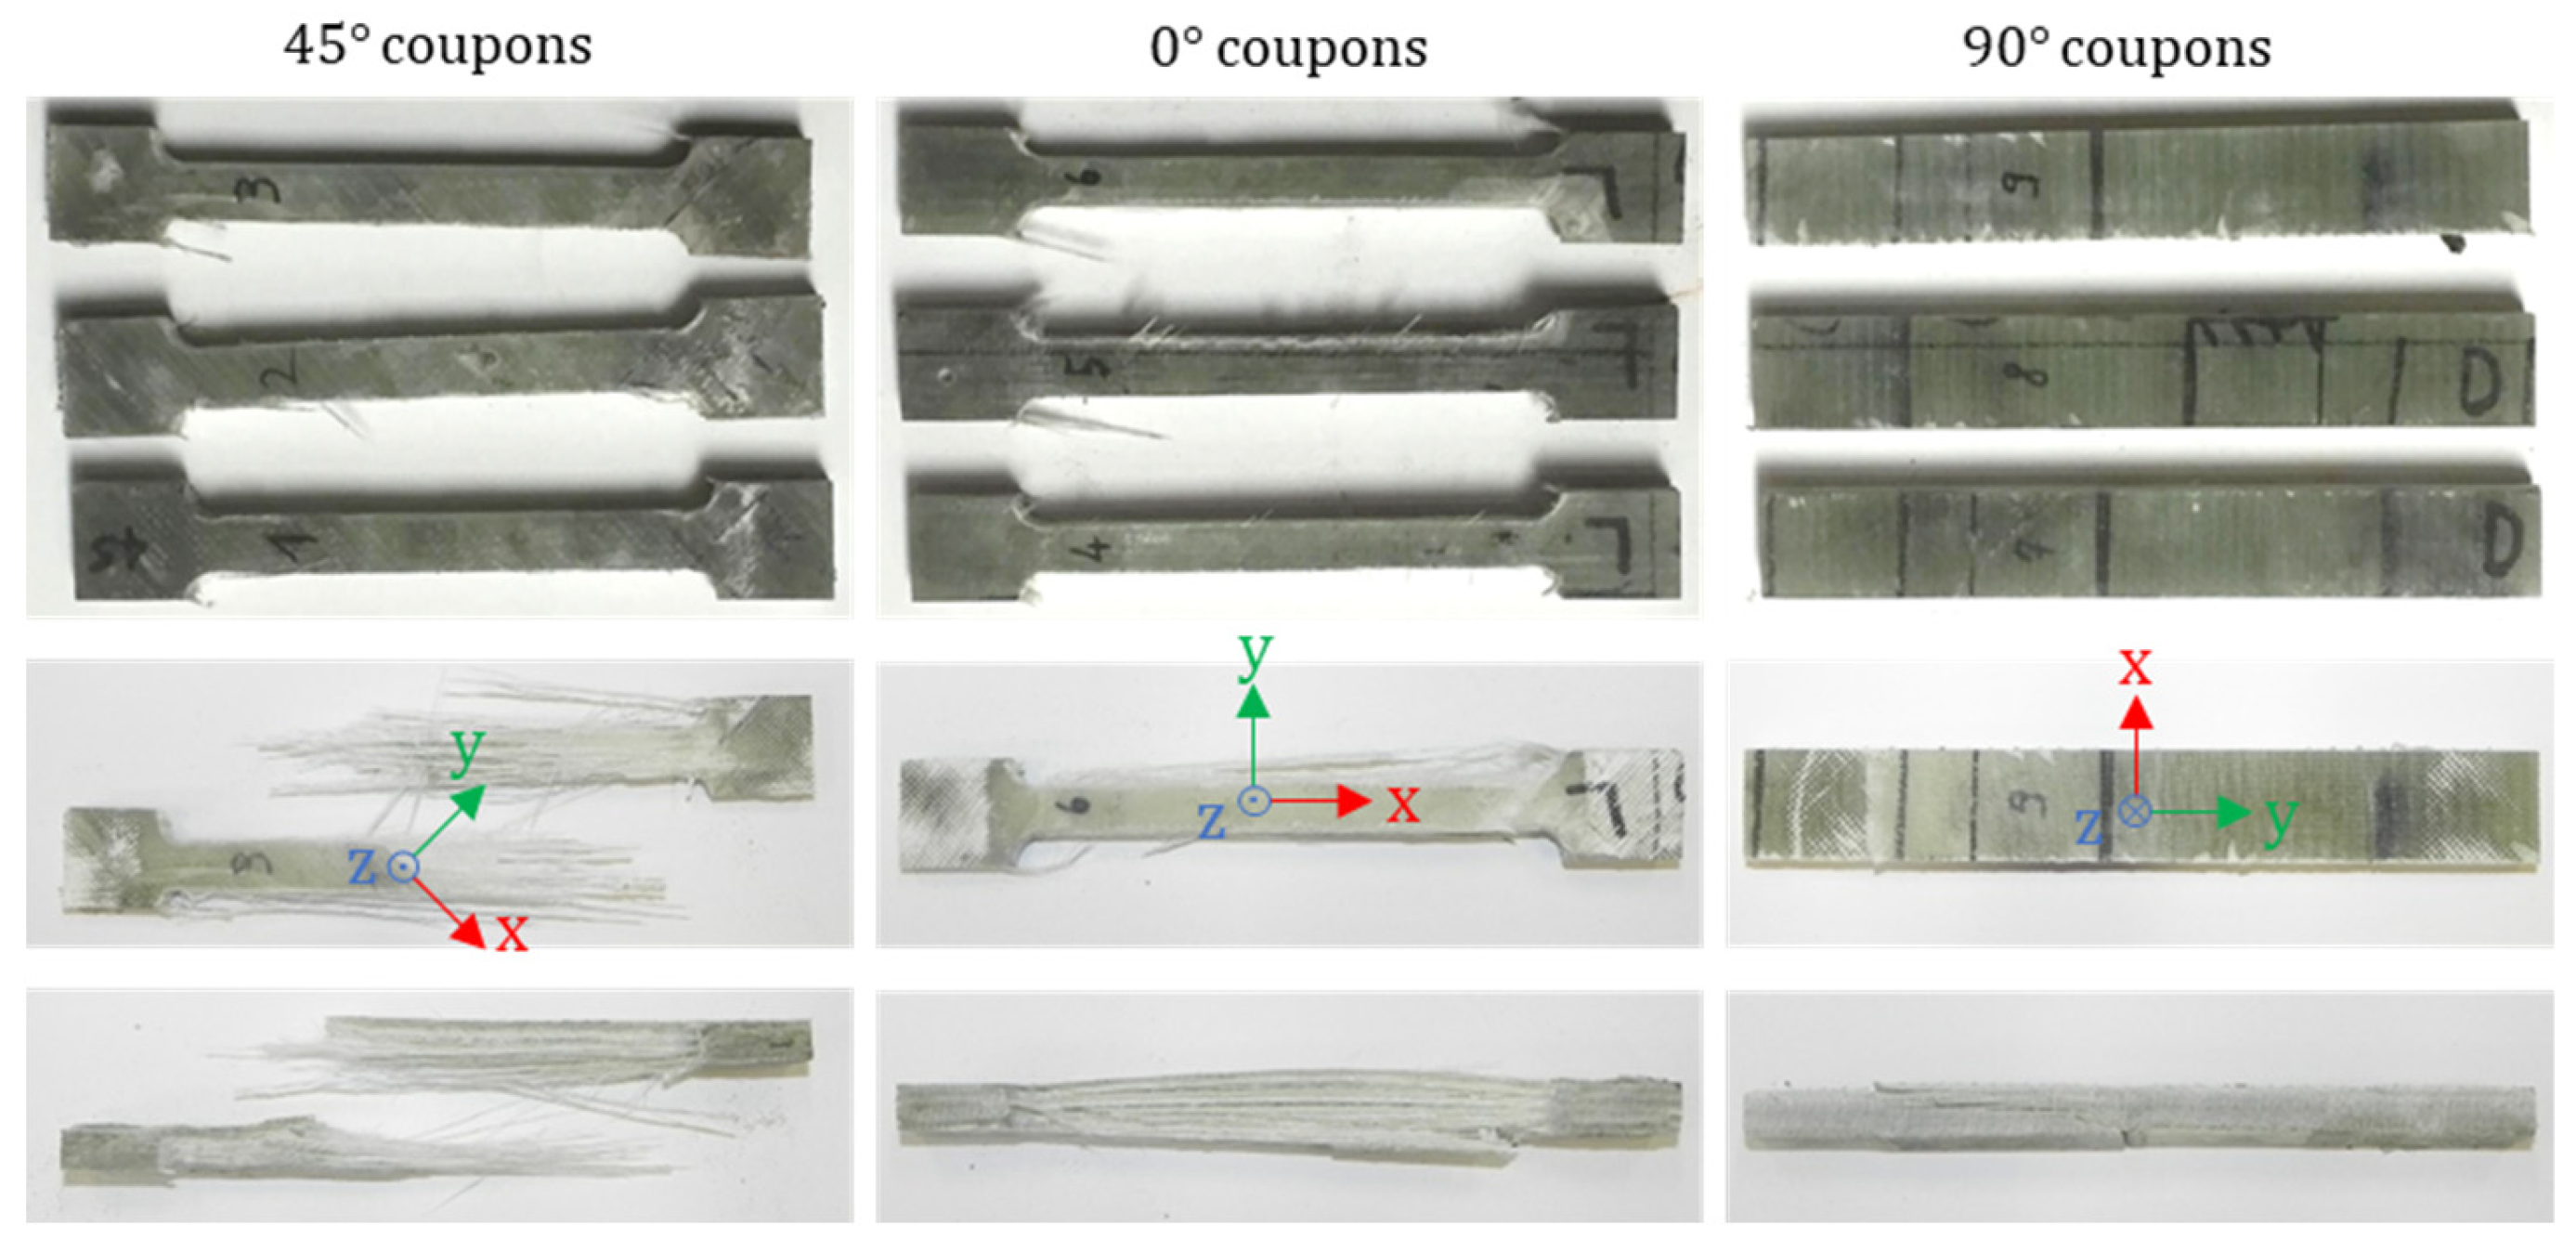
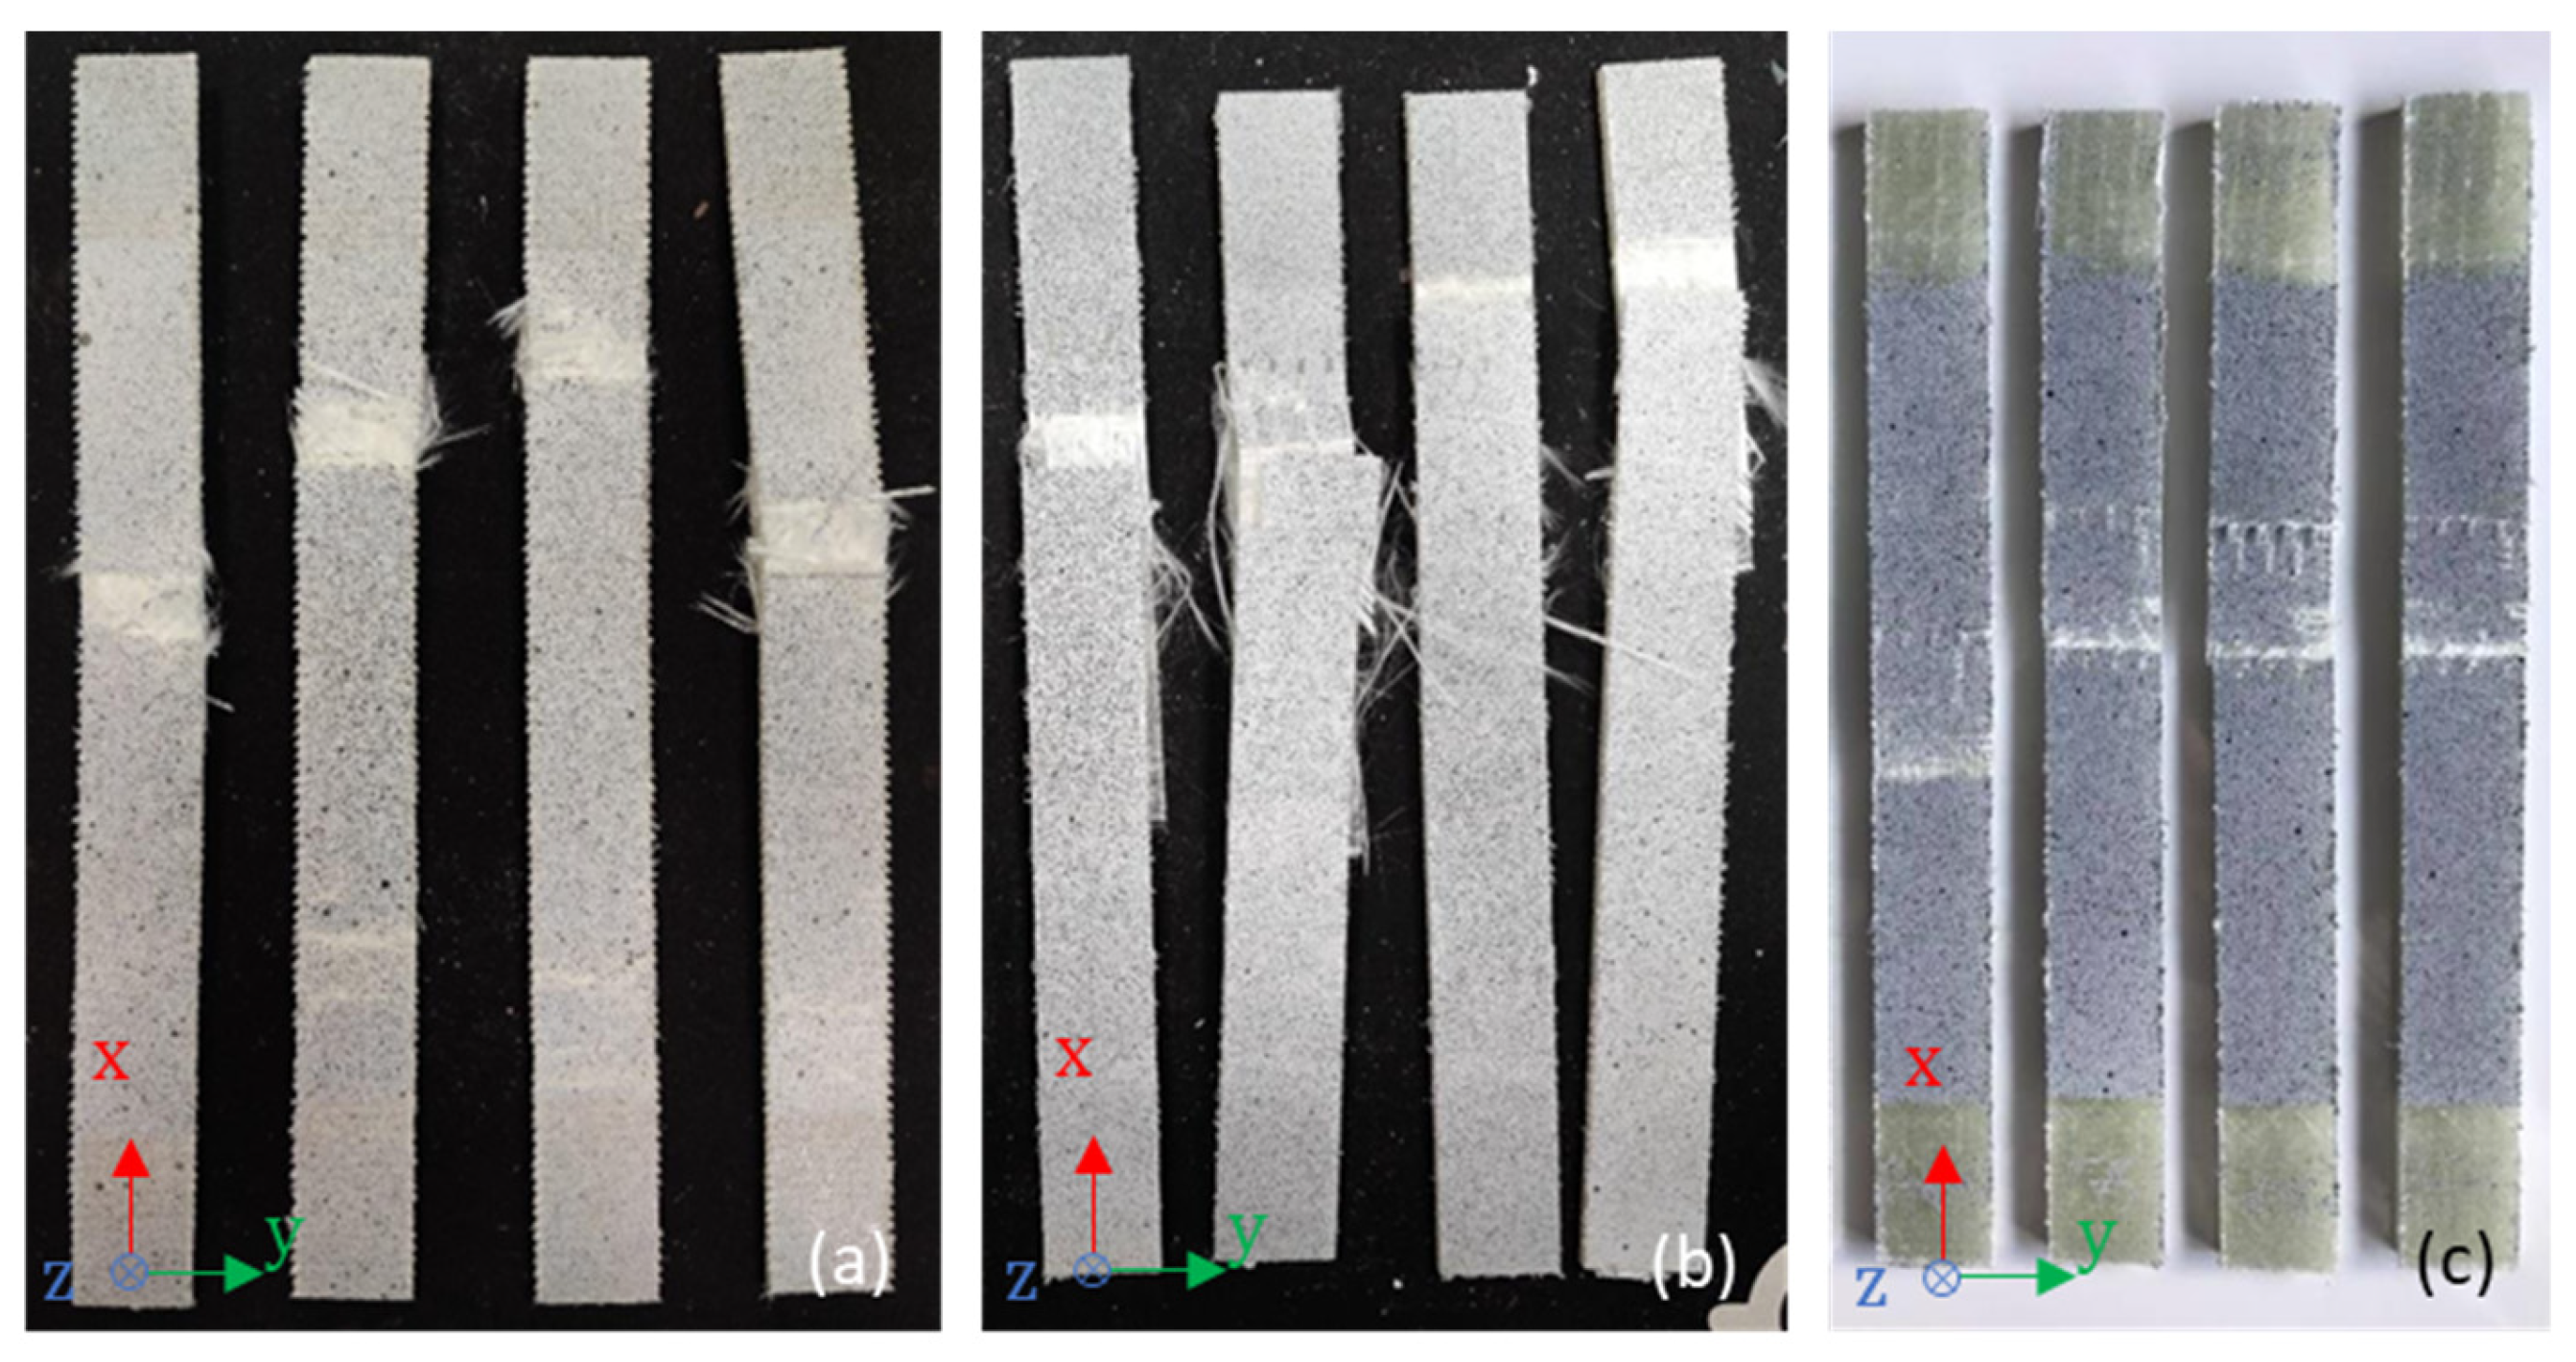
In this section, the tensile testing of coupons extracted from the top flange of the tiled sandwich panel at three different angles (0°, 90° and 45°) relative to the bridge’s span direction is discussed. The tensile coupons are extracted in between two web locations of the flange, to study the mechanical properties of the laminate without any webs. The 0° and 45° coupons have a total length of 200 mm and a gauge width of 15 mm. As found in the microscopic images from Section 4.1, the flange laminate construction between two consecutive webs is quasi-PP in the transverse span direction. Because of this a limited gauge width is acceptable and accurately represents the longitudinal properties of the flange laminates. Furthermore, to prevent unintentional failure near the clamps during tensile testing, the 0° and 45° coupons feature a dumbbell shape with a reduced gauge length. In contrast, the length of the 90° coupons is limited by the distance between the webs (i.e., approximately 100 mm) and the coupons maintain the full gauge width of 30 mm over the full length. The strain of the coupons is measured using an extensometer, while the applied force is measured by the load cell of the tensile machine, and the tensile test continues until the specimens experience ultimate failure. After testing, the stress, strain, and Young’s modulus are determined from the measured force and local displacement data provided by the load cell and extensometer, respectively. Figure 8 shows the 0°, 90° and 45° along with their typical in-plane failure behavior and longitudinal cross-sections.
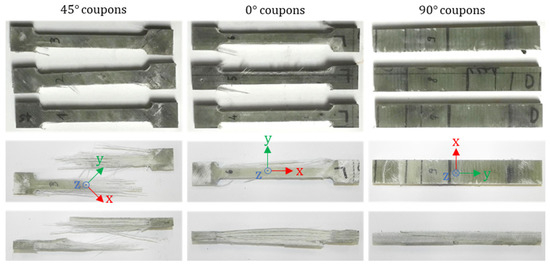
Figure 8.
45°, 0° and 90° coupons (top) and associated top (middle) and edge view (bottom) of the failure behavior.
The 0° coupons consist of 46% 0° plies, 8% 90° plies and 46% ±45° plies in the direction of tensile testing. First ply failure in these coupons occurs through shearing of the +45° plies followed by explosive fiber failure of the 0° plies, leading to the ultimate specimen failure. The ultimate failure occurs at a high maximum failure stress, compared to the 90° and 45° specimens, as a result of the explosive fiber failure of the 0° plies. The failure stress and Young’s modulus are 406 MPa and 29.5 GPa, respectively.
The 90° coupons comprise 46% 90° plies, 8% 0° plies and 46% ±45° plies in the direction of tensile testing. While these coupons also maintain a balanced laminate configuration, they lack 0° plies. Consequently, these coupons exhibit a significantly lower failure stress and Young’s modulus compared to the 0° coupons, with values of 53 MPa and 18.2 GPa, respectively. The failure behavior of the 90° coupons is characterized by interlaminar shearing of the plies in the longitudinal cross-section of the specimen. Failure initiates at a ply edge and propagates due to shear stress along the stacked/tiled direction of the laminate, leading to cracks that expand from both sides of the specimen inwards and weaken the interlaminar connection between individual plies, ultimately resulting in specimen failure. Compared to the 0° coupons, this failure behavior is associated with a gradual force decrease.
The 45° coupons consist of 23% 0° plies, 23% 90° plies, 46% +45° plies and 8% −45° plies in the direction of tensile testing, resulting in an unbalanced structure due to the absence of −45° plies. These coupons exhibit a similar fracture pattern as the 0° coupons, with first ply failure occurring through matrix failure in the 90° plies, followed by shearing of the +45° plies and explosive fiber failure of the 0° plies, ultimately leading to specimen failure. However, due to the balanced configuration of ±45° plies in the 0° coupons, the first ply failure in these plies occurs at a lower force. The 45° coupons exhibit an average failure stress of 113 MPa and an initial Young’s modulus of 18.0 GPa.
The results presented in this paragraph are based on VARI specimens, tested according to ASTM D3039. No additional guidelines to ensure consistency or repeatability were implemented, in line with the philosophy of CEN/TS 19101:2022 [15] which acknowledges the inherent production process related variability of the measured results.
Table 1 presents an overview of the average tensile mechanical properties, including tensile strength and Young’s modulus, for the 0°, 90° and 45° coupons, along with standard deviation (STD) and coefficient of variation (COV) values.

Table 1.
Mechanical tensile properties of the 0°, 90° and 45° coupons [AVG ± STD (COV)].
The data in Table 1 suggest that the top and bottom flanges of the bridge exhibit larger strength and stiffness in the span/length direction of the bridge, while their strength and stiffness in the transverse direction are approximately 7.6 and 1.6 times lower, respectively. The absence of 0° plies in the 90° specimens significantly influences these mechanical properties. Additionally, the stacked/tiled structure of the top and bottom flanges contributes to these reduced mechanical properties. Even though the bridge primarily transfers loads in the longitudinal direction to the supports, the mechanical properties in the transverse direction cannot be disregarded, especially in the context of localized vehicle loads. This importance is evident, even for pedestrian bridges in case of unintended vehicles on the bridge. Therefore, further research is conducted to investigate the mechanical properties and the impact of ply stacking/tiling in the transverse direction of the flanges.
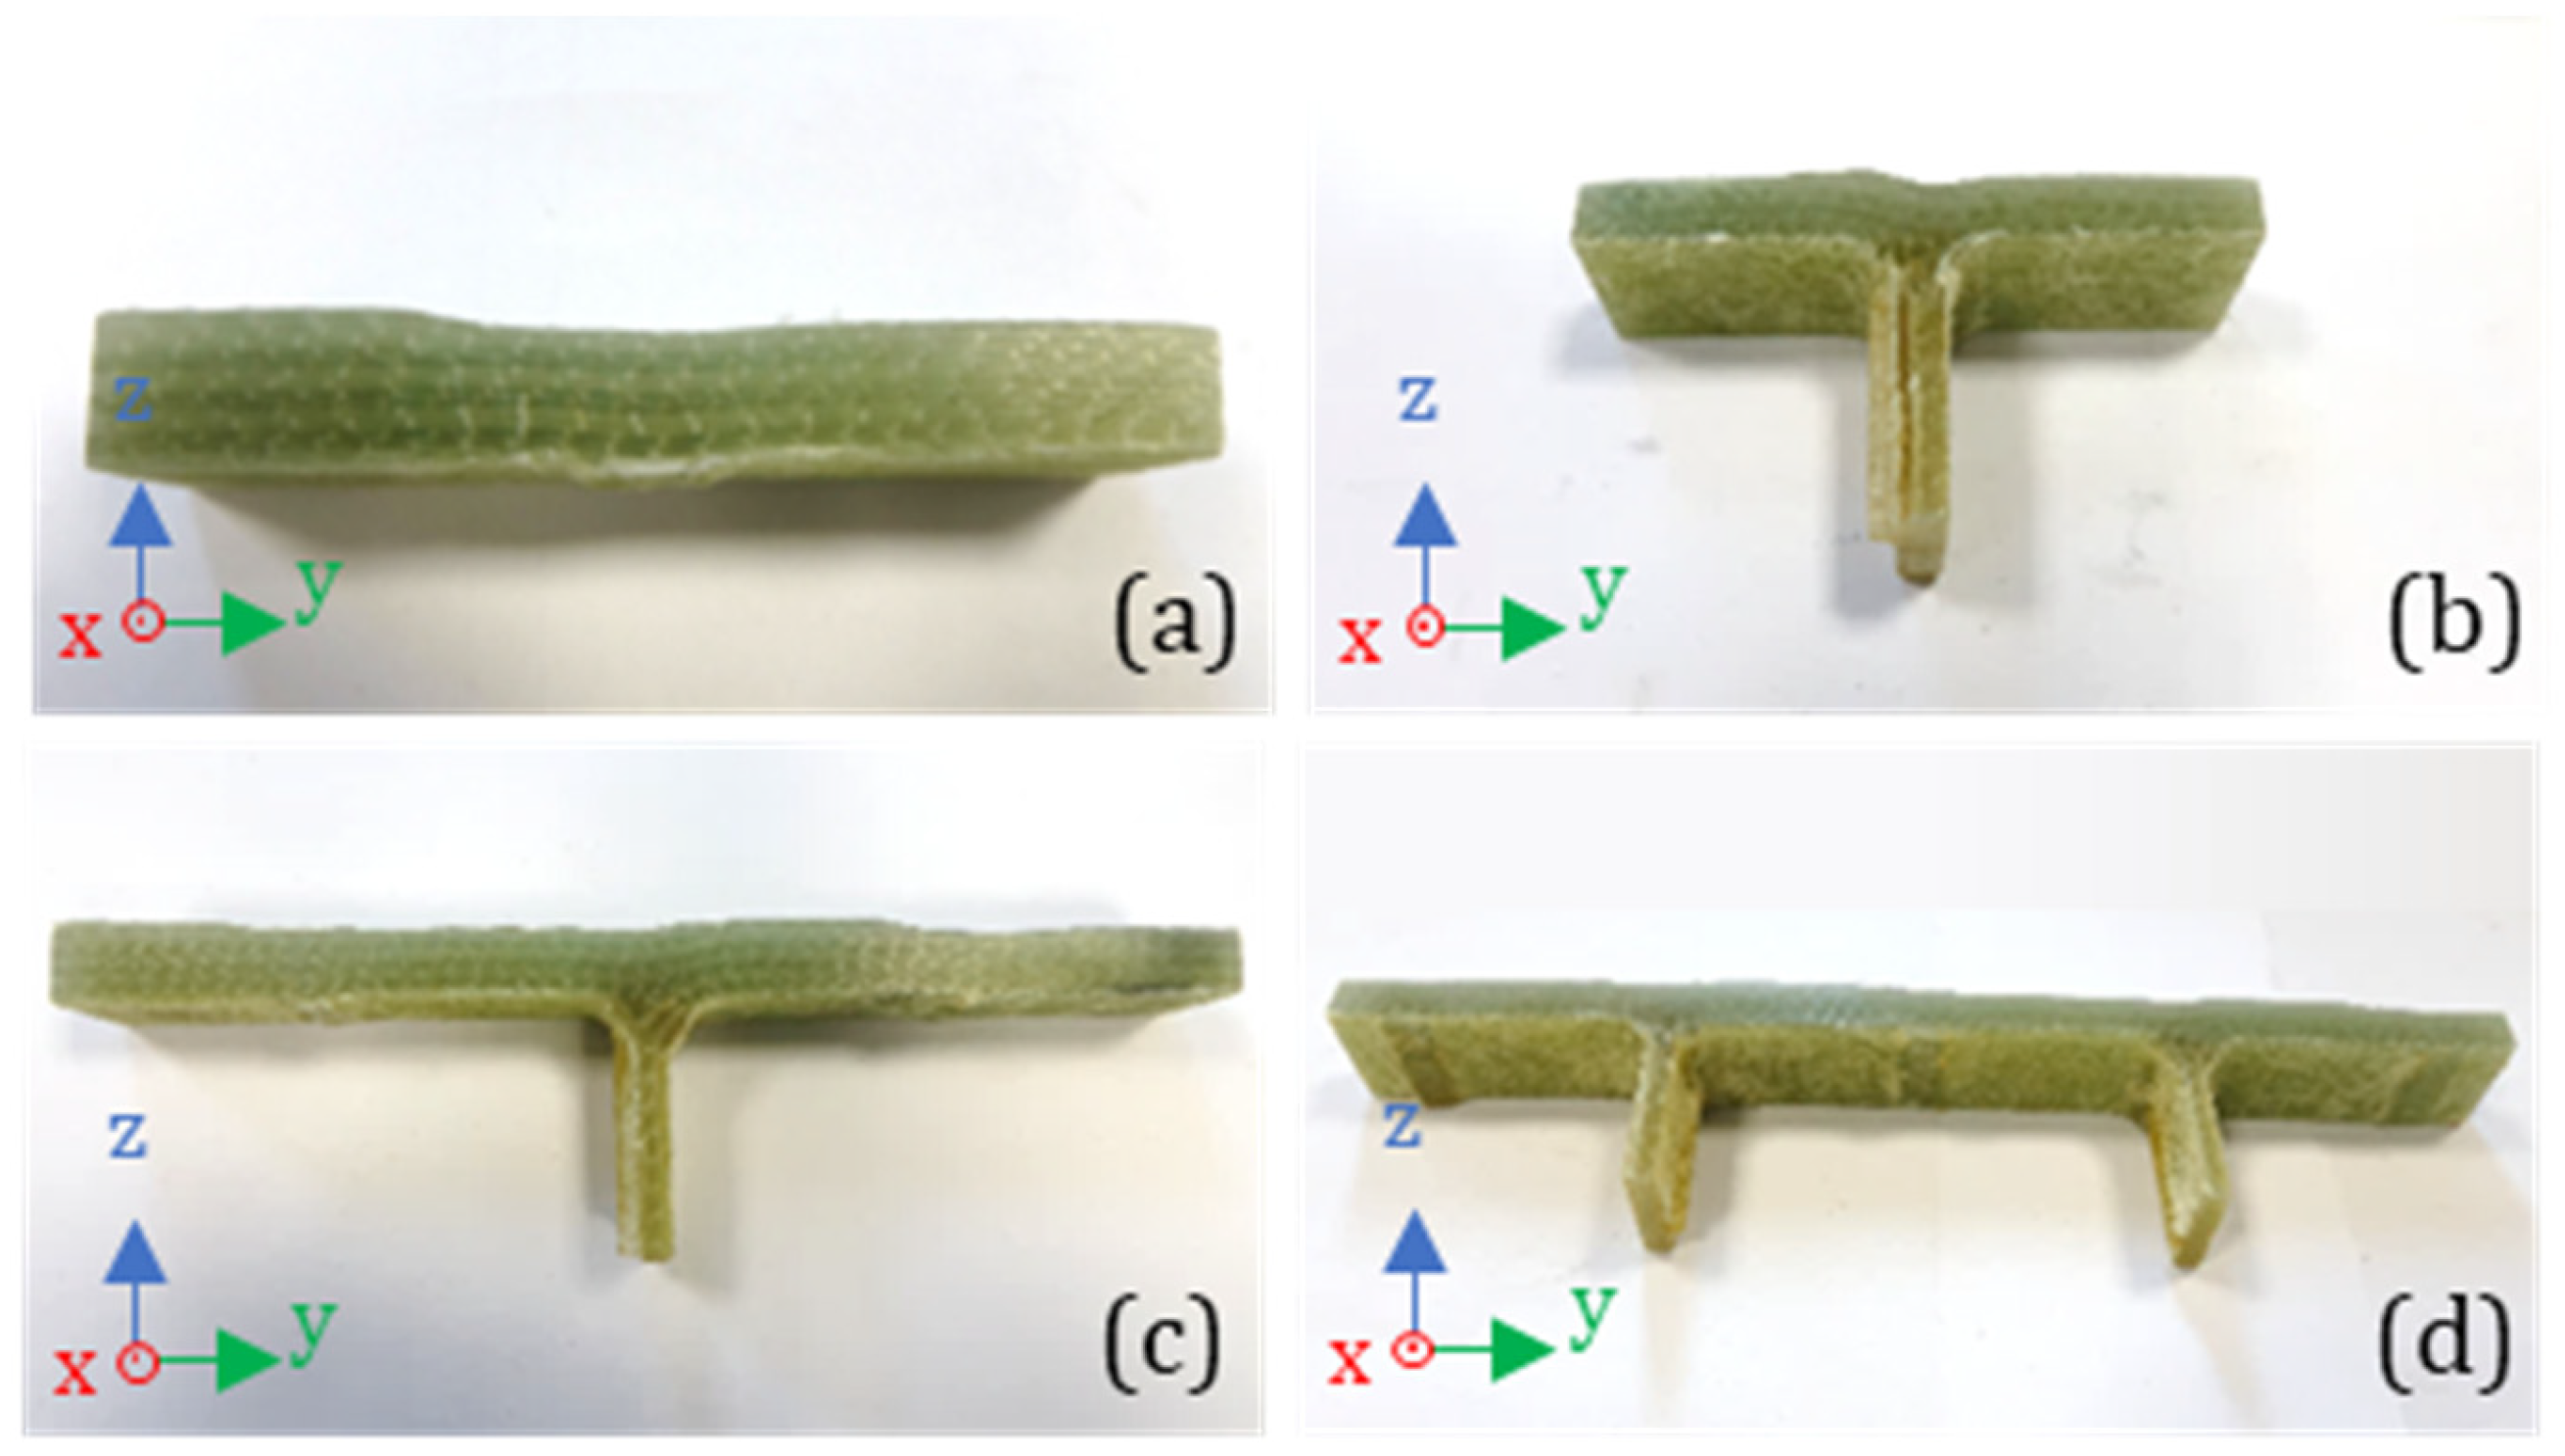
Additional coupons are extracted in the transverse 90°-direction from the top and bottom flange of the TL sandwich panel. These rectangular coupon specimens have a uniform width of 25 mm and variable lengths based on the specimen type and location within the top (TF) and bottom (BF) flange. The first type of specimen is again cut between two successive webs, as was the case for the 90° coupons above, and has a length of 90 mm. The second type of coupons examine the intersection between the flange and the web, with lengths of 90 mm and 190 mm. Here, the web is in both coupons positioned exactly in the middle. The final type of coupons has a length of 250 mm and incorporate two equally spaced webs, offering a global assessment of the mechanical properties of the top and bottom flange. Here, the difference between the mechanical properties between the top and bottom flange is also studied to incorporate the influence of the specific manufacturing process. Specimen names consist of two parts separated by a hyphen: the first part, composed of two letters, denotes the specimen’s location in the bridge deck (top flange—TF; bottom flange—BF), while the second part represents the number of webs (0 W, 1 W, and 2 W) present in the specimen, followed by the length for specimens with one web (s for short, 90 mm, and l for long, 190 mm). Figure 9 illustrates the different specimen types, and at least five coupons are tested for each type to ensure statistically significant results.
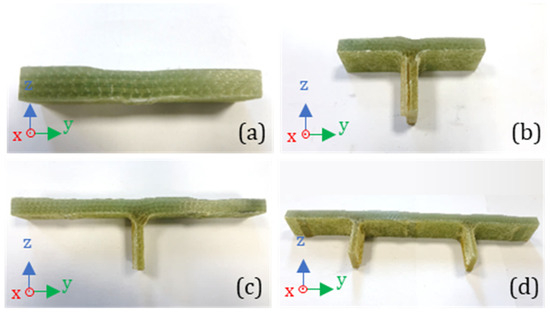
Figure 9.
Top flange transverse specimen with no (a), one (b,c) and two (d) webs.
To minimize bending stresses in the coupon specimens, a hinged clamp is employed at the top clamp of the tensile machine. This enables the clamps to align during force application, ensuring an even distribution of force across the specimen’s cross-section. Additionally, the specimen is vertically aligned with respect to the clamps to guarantee straight force introduction. The tensile test is displacement-controlled with a load rate of 2 mm/min.
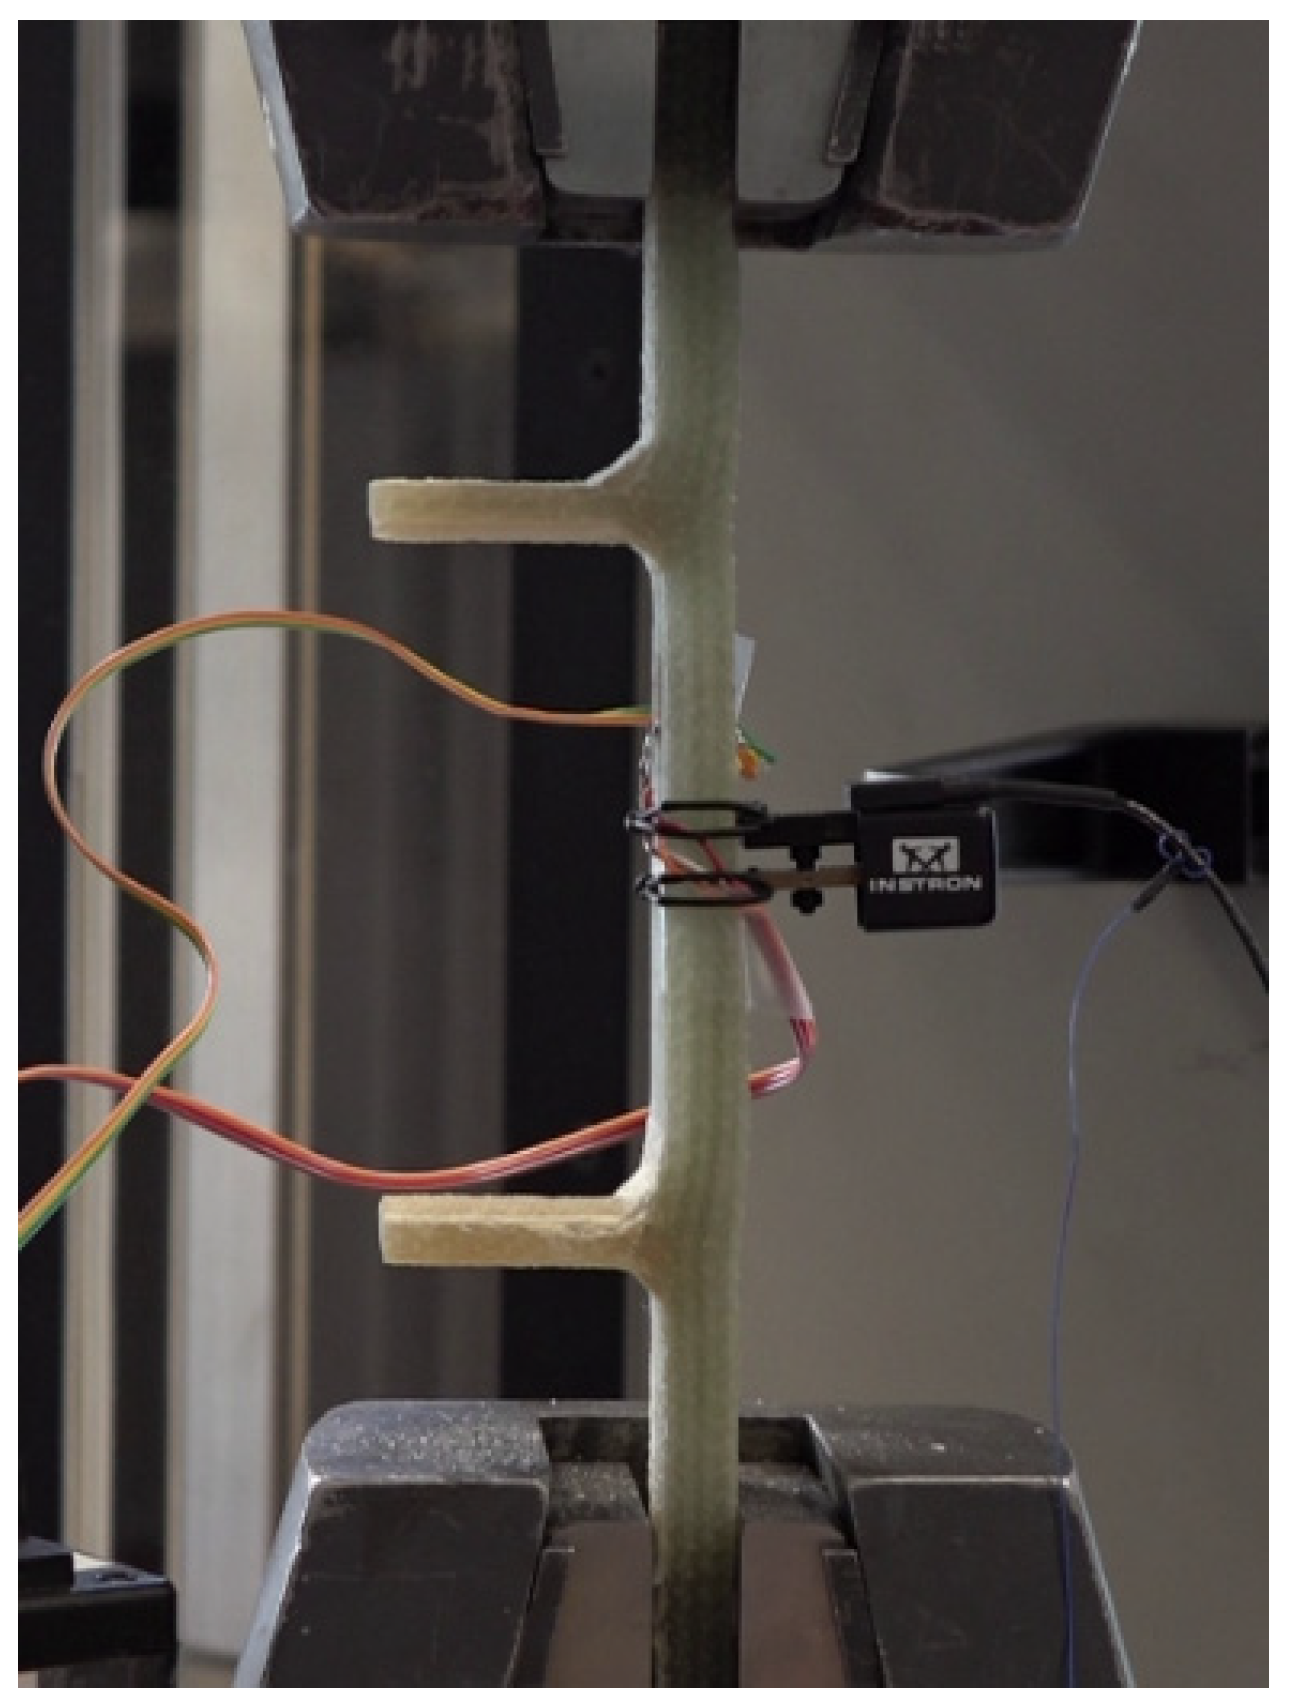
The bending of the specimens is monitored during the tensile test using two strain gauges with a strain factor of 2.16 and a resistance of 350 Ω, positioned on the front and back of the specimen. Furthermore, global strain in the specimens is measured using an extensometer with a gauge length ranging from 10 to 25 mm, depending on the specimen and situation. Figure 10 displays the test setup, including measuring equipment, during the tensile test on a coupon specimen with two webs.

Figure 10.
Tensile test setup with extensometer and strain gauges at the front and back.
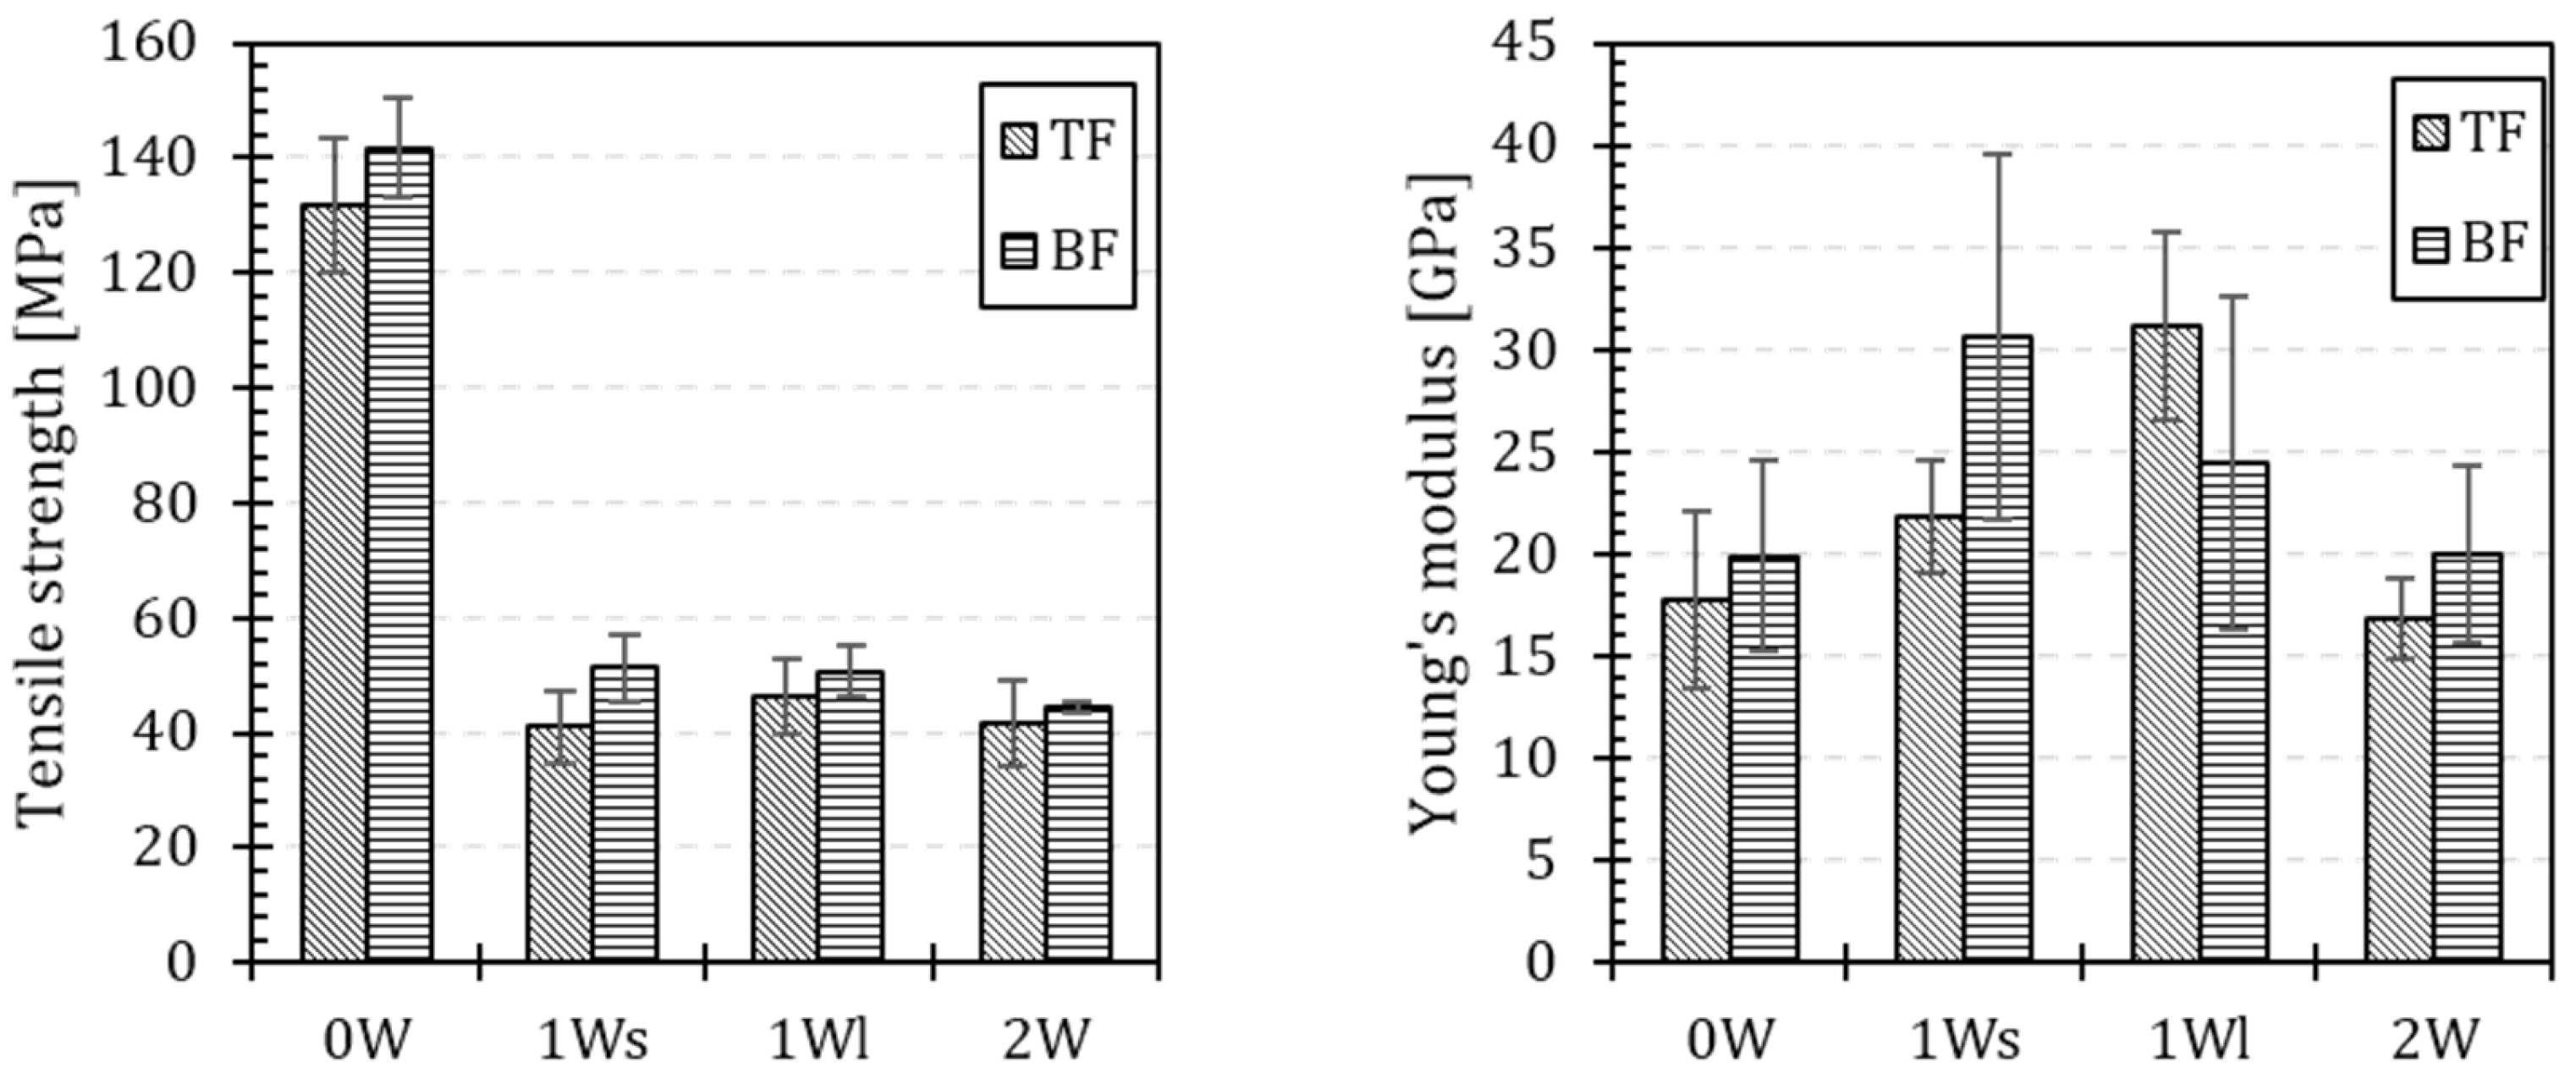
The displacement measurement represents the relative displacement of the tensile machine’s clamps. However, due to slip occurring between the specimen and the clamp jaws, the measured elongation exceeds that within the specimen. Additionally, results from the extensometer and strain gauges exhibit significant discrepancies, making it challenging to obtain a clear understanding of global strain development across the various specimens. For all next TL tests, DIC image capturing is used to obtain comprehensive full-field insights into the global and local strains of the specimens. Figure 11 offers an overview of the average maximum tensile strength and initial Young’s modulus for different coupon specimens, supplemented with error bars indicating standard deviation.

Figure 11.
Overview of the tensile strength (left) and Young’s modulus (right) of the top and bottom flange for the different types of specimens.
From Figure 11, it is evident that the presence of webs in the coupon specimens significantly reduces the maximum tensile strength of both the top and bottom flanges. The average tensile strength for specimens without webs is approximately 137 MPa, nearly three times higher than that of other specimen types. This reduction mainly results from the failure behavior in specimens with webs, where failure consistently initiates at the connection between a web and the flange due to localized geometric changes in the specimen. The tensile strength shows similar results across all specimens with webs, and specimens with two web plates do not necessarily exhibit lower tensile strength, as failure consistently begins at the weakest web location. Furthermore, it is noticeable that the tensile strength of coupons from the bottom flange is higher for all specimen types. This improved tensile strength is primarily attributed to the manufacturing process, where the bottom flange is placed against a hard bottom mold, resulting in slightly higher internal pressure within the bottom flange. This leads to better fiber compaction and, consequently, a higher fiber volume percentage compared to the top flange.
Regarding the Young’s modulus in Figure 11, a notable variation is observed. This variation can be attributed to the local extensometer measurement, with strains differing significantly depending on the measurement location due to the layered ply structure of the top and bottom flanges. However, it can be concluded that specimens with one web exhibit a higher initial stiffness compared to those with no webs and two webs, with an average value of approximately 27 GPa. These last two specimen types also exhibit the largest standard deviations due to considerable variability in failure behavior. The stiffness of specimens without webs and those with two webs is comparable, with average values of 18.84 GPa and 18.45 GPa, respectively.
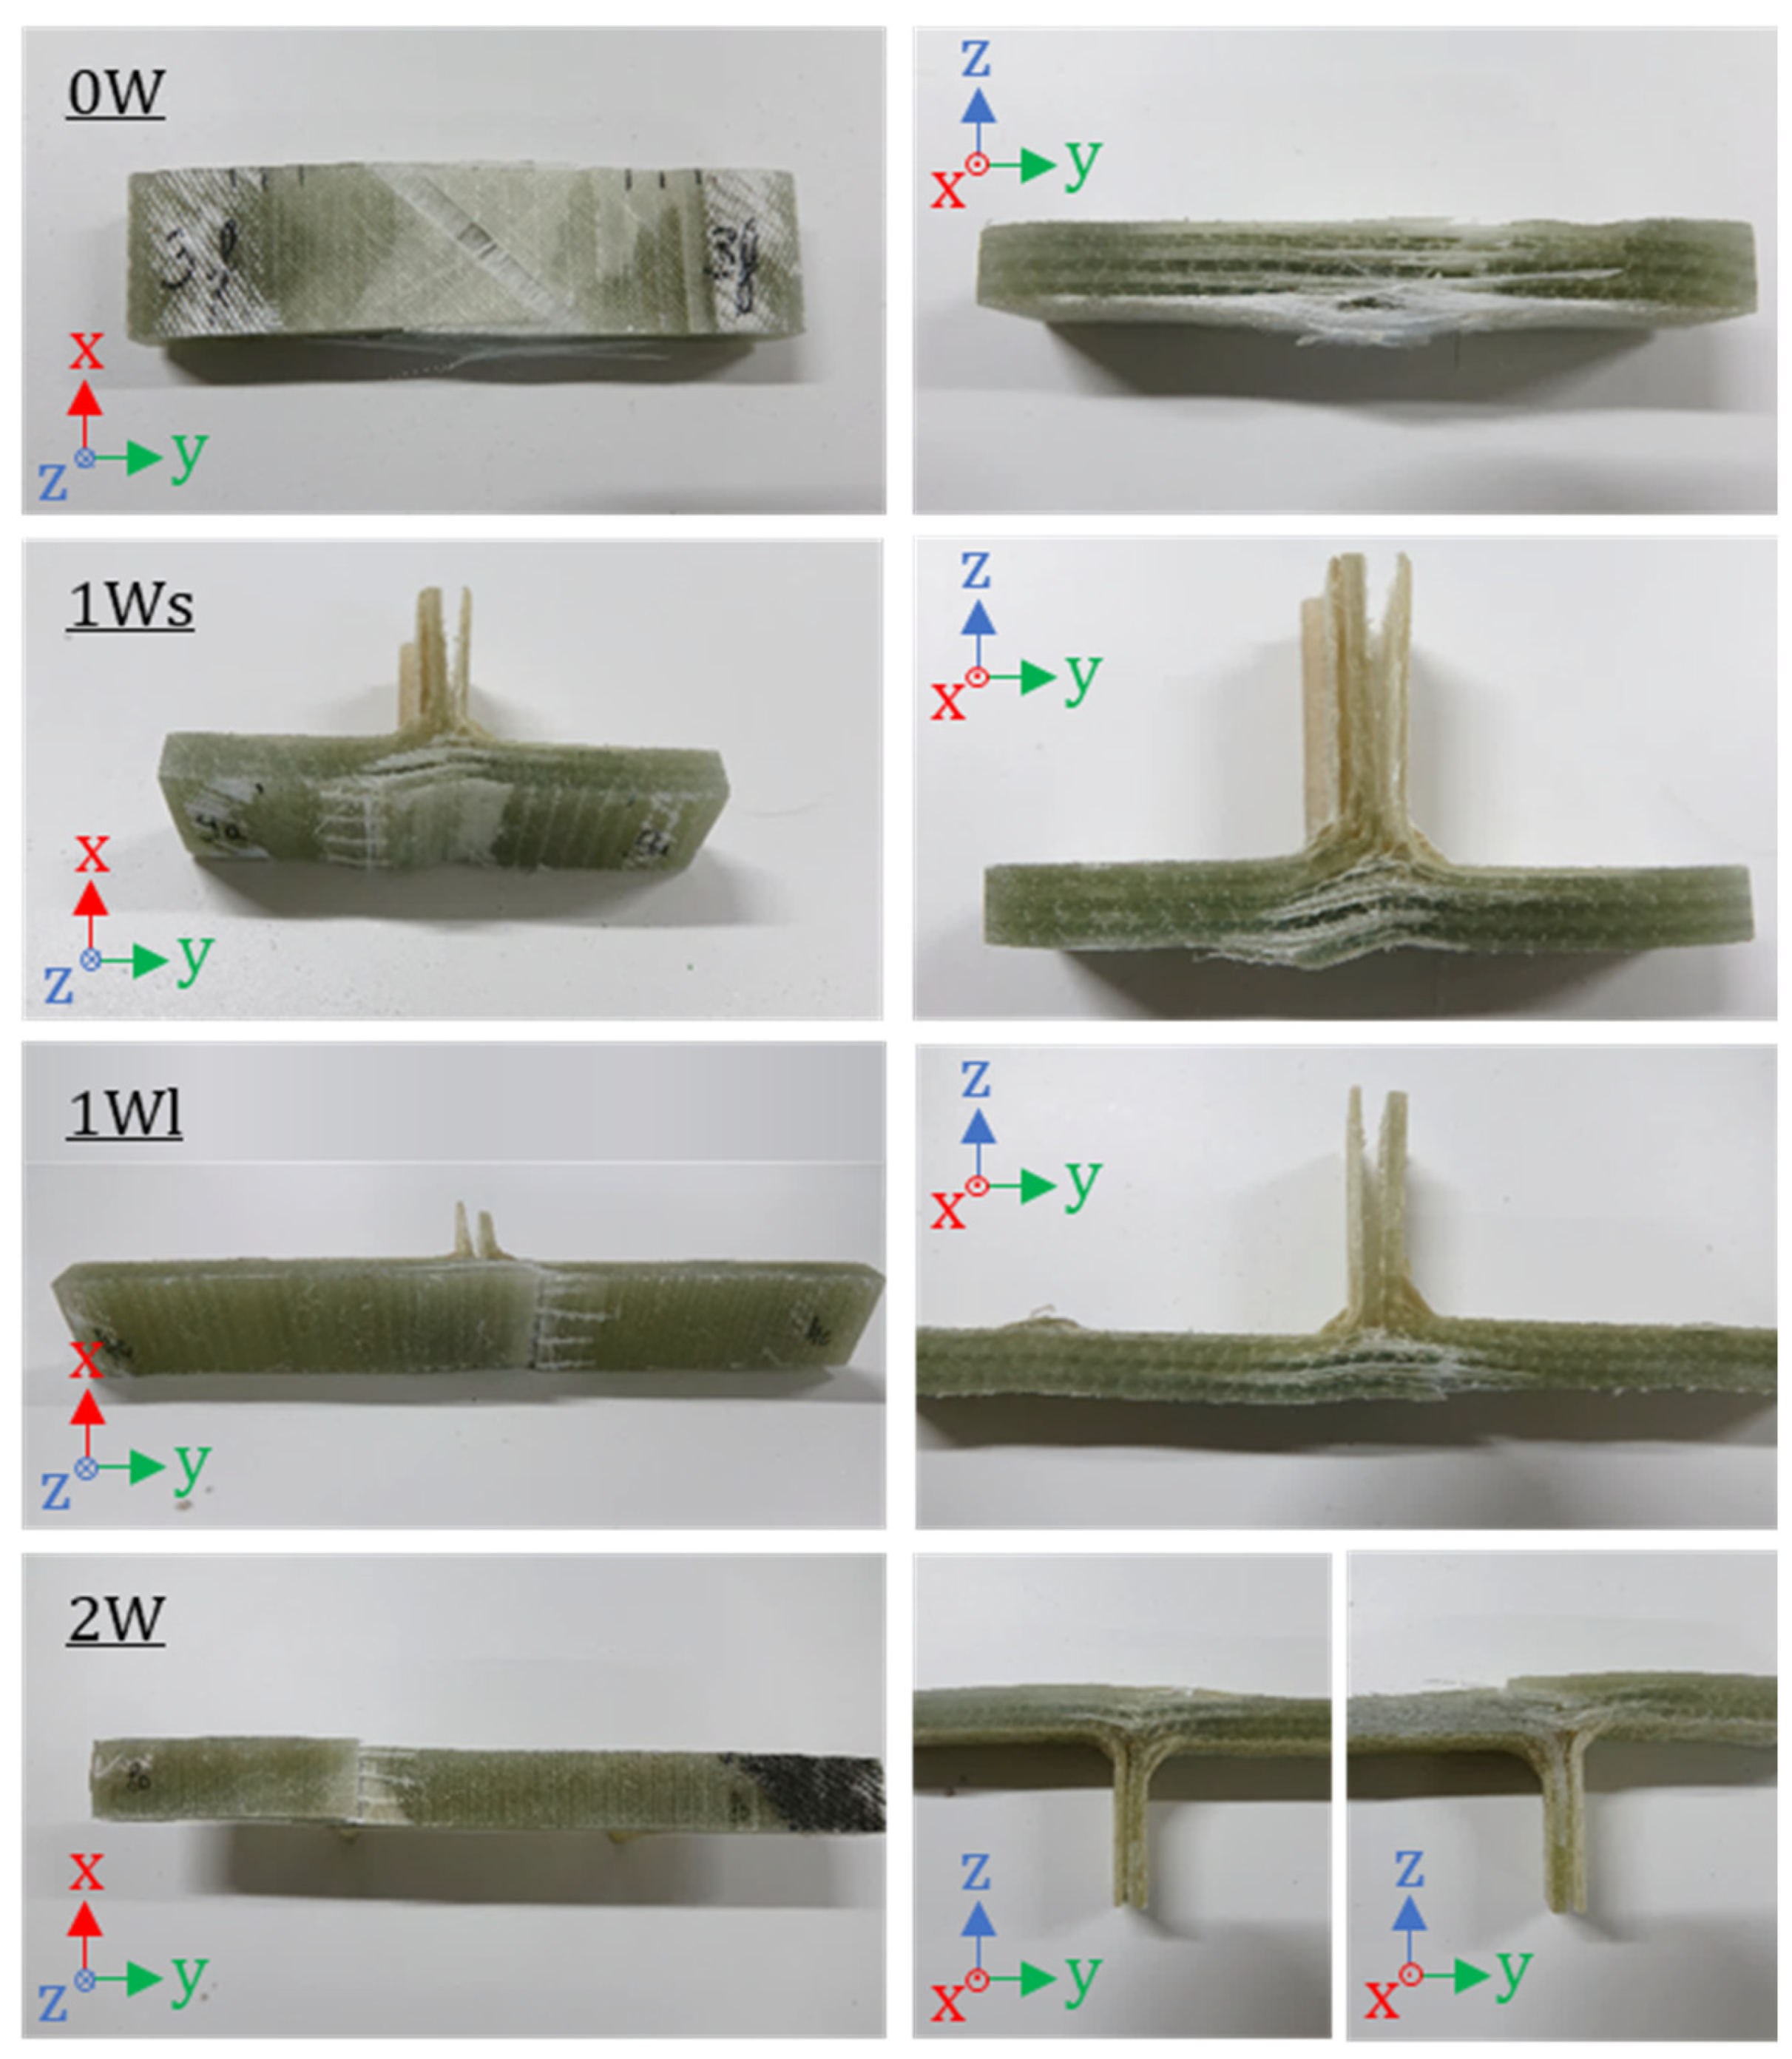
Figure 12 provides an overview of the typical failure behavior for the various types of test specimens. Failure of the specimens with webs occurs in multiple stages, whereas specimens without webs exhibit explosive failure behavior. Consistent with the findings in Figure 8, the failure of 0 W specimens is characterized by an explosive failure within the gauge length, primarily due to the single 0° ply close to the PUR foam cores at the inside of the bridge deck. In specimens with web plates, failure initiates at the resin-rich zone where the web connects to the flange. A crack forms between the resin zone and the ply wrapped around the foam core, propagating further toward the flange and in the web. Additionally, interlaminar cracks also develop at the location of a ply end, growing in the direction of resin concentration due to internal shear stresses between the individual plies of the flange.
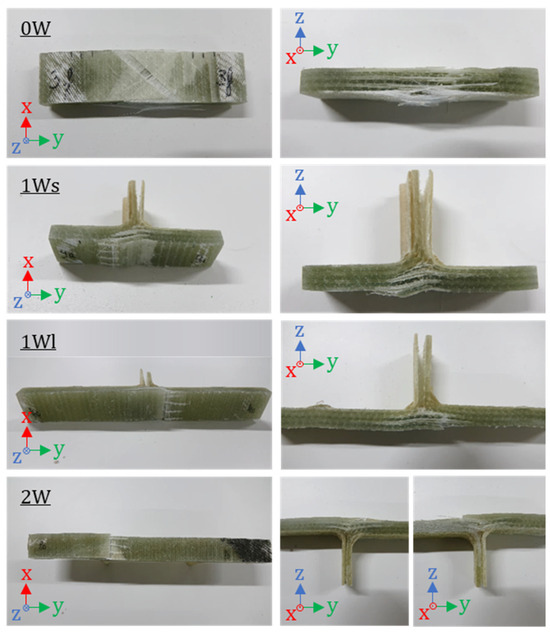
Figure 12.
Failure behavior of transverse specimens with no (0 W), one (1 W) and two webs (2 W).
5. Comparison between Tiled and Plane Parallel Laminates
Based on the microscopic research of Section 4.1, tiled laminates with similar constructions are manually produced. In this section, a comprehensive examination of these tiled laminates and the full strain field subjected to tensile loading using state-of-the-art 3D DIC imaging is executed. Here, DIC is used over point measurements with for example extensometers, which do not give an accurate representation of the entire strain field of a TL as indicated in Section 4.2. While the tiling of plies is typically associated with the transverse direction of a web–core sandwich bridge deck as concluded in Section 4.1, this study is extended to include tiling in the longitudinal direction in Section 5.2. These findings possess potential value for broader sectors and applications where tiling in the load-bearing direction could capitalize on the advantages of possible modular manufacturing associated with this tiled laminate configuration. The investigation encompasses an assessment of the influence of a tiled lay-up in both the longitudinal (strong) and transversal (weak) directions, as well as the role of the stacking angle in various laminate configurations. Concluding from the laminate lay-up data derived from microscopic imaging in Section 4.1, distinct laminates featuring sharp and gradual ply transitions are fabricated. Subsequently, the mechanical properties of the tiled laminates with varying stacking angles are scrutinized and compared to those of plane parallel (PP) laminates sharing the same laminate lay-up. This comparison is conducted separately for the transverse and longitudinal directions in Section 5.1 and Section 5.2, respectively.
In Section 5.1, first a comparison of the global mechanical properties for a TL in the transverse direction is given in comparison to a PP laminate, followed by an online microscopic analysis of the failure behavior of the TLs. Furthermore, a 3D DIC analysis of the full 3D strain field is also performed. Next, Section 5.2 discusses the global and local properties of TLs in the longitudinal direction in combination with an analysis of the failure behavior through online microscopy. Microscopic imaging of the cross-section is used to gain insight into the ply structure and to analyze the local phenomena causing local stiffness increases and decreases. In addition, the full 3D strain field of the TL is analyzed and discussed, including a discussion about the anomalies found along the longitudinal direction of the laminate. Finally, a comparison between the influence of the stacking angle on the transverse and longitudinal direction is given in Section 5.3.
5.1. Ply Stacking Transverse of the Supporting Direction
In this section, we investigate the impact of the tiling in the transverse direction as present in the top and bottom flange of a web–core sandwich bridge deck panel. As noted in Section 4.1, the majority of the 0° plies align with the global X-direction of the bridge deck. However, in the tensile tests performed in this section the local x-direction of the laminates aligns with the applied tensile force, as indicated in Figure 13 and Figure 14, which in this case lines up with the global Y-direction of the bridge deck perpendicular to the span direction. According to the findings of Section 4.1, the fiber reinforcement is therefore mainly present in the local y-direction of the specimen. To maintain a limited amount of stiffness and strength of the specimens during the tensile testing, an additional 90°-ply (i.e., according to the global bridge deck coordinate system) is added to the laminate, as depicted in Figure 13. In the following, the ply directions of the laminate configurations are given relative to the global bridge direction n. It should be noted that the stacking direction of the TL lines up with the longitudinal tensile direction of the specimens, requiring a 90° rotation of the laminate lay-up, as shown in Figure 14.
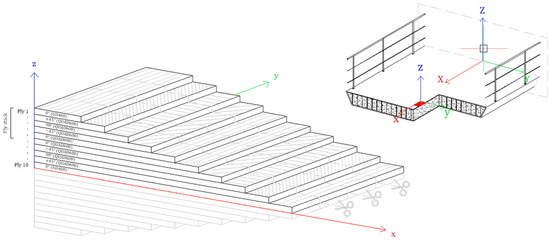
Figure 13.
Laminate construction and lay-up of the PP reference specimens including cutting lines.
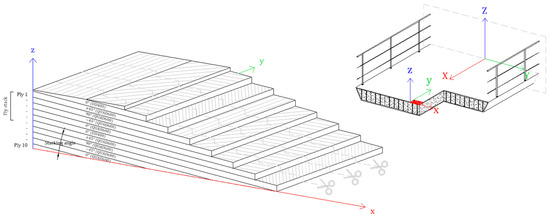
Figure 14.
Laminate construction and lay-up of the TL specimens including cutting lines.
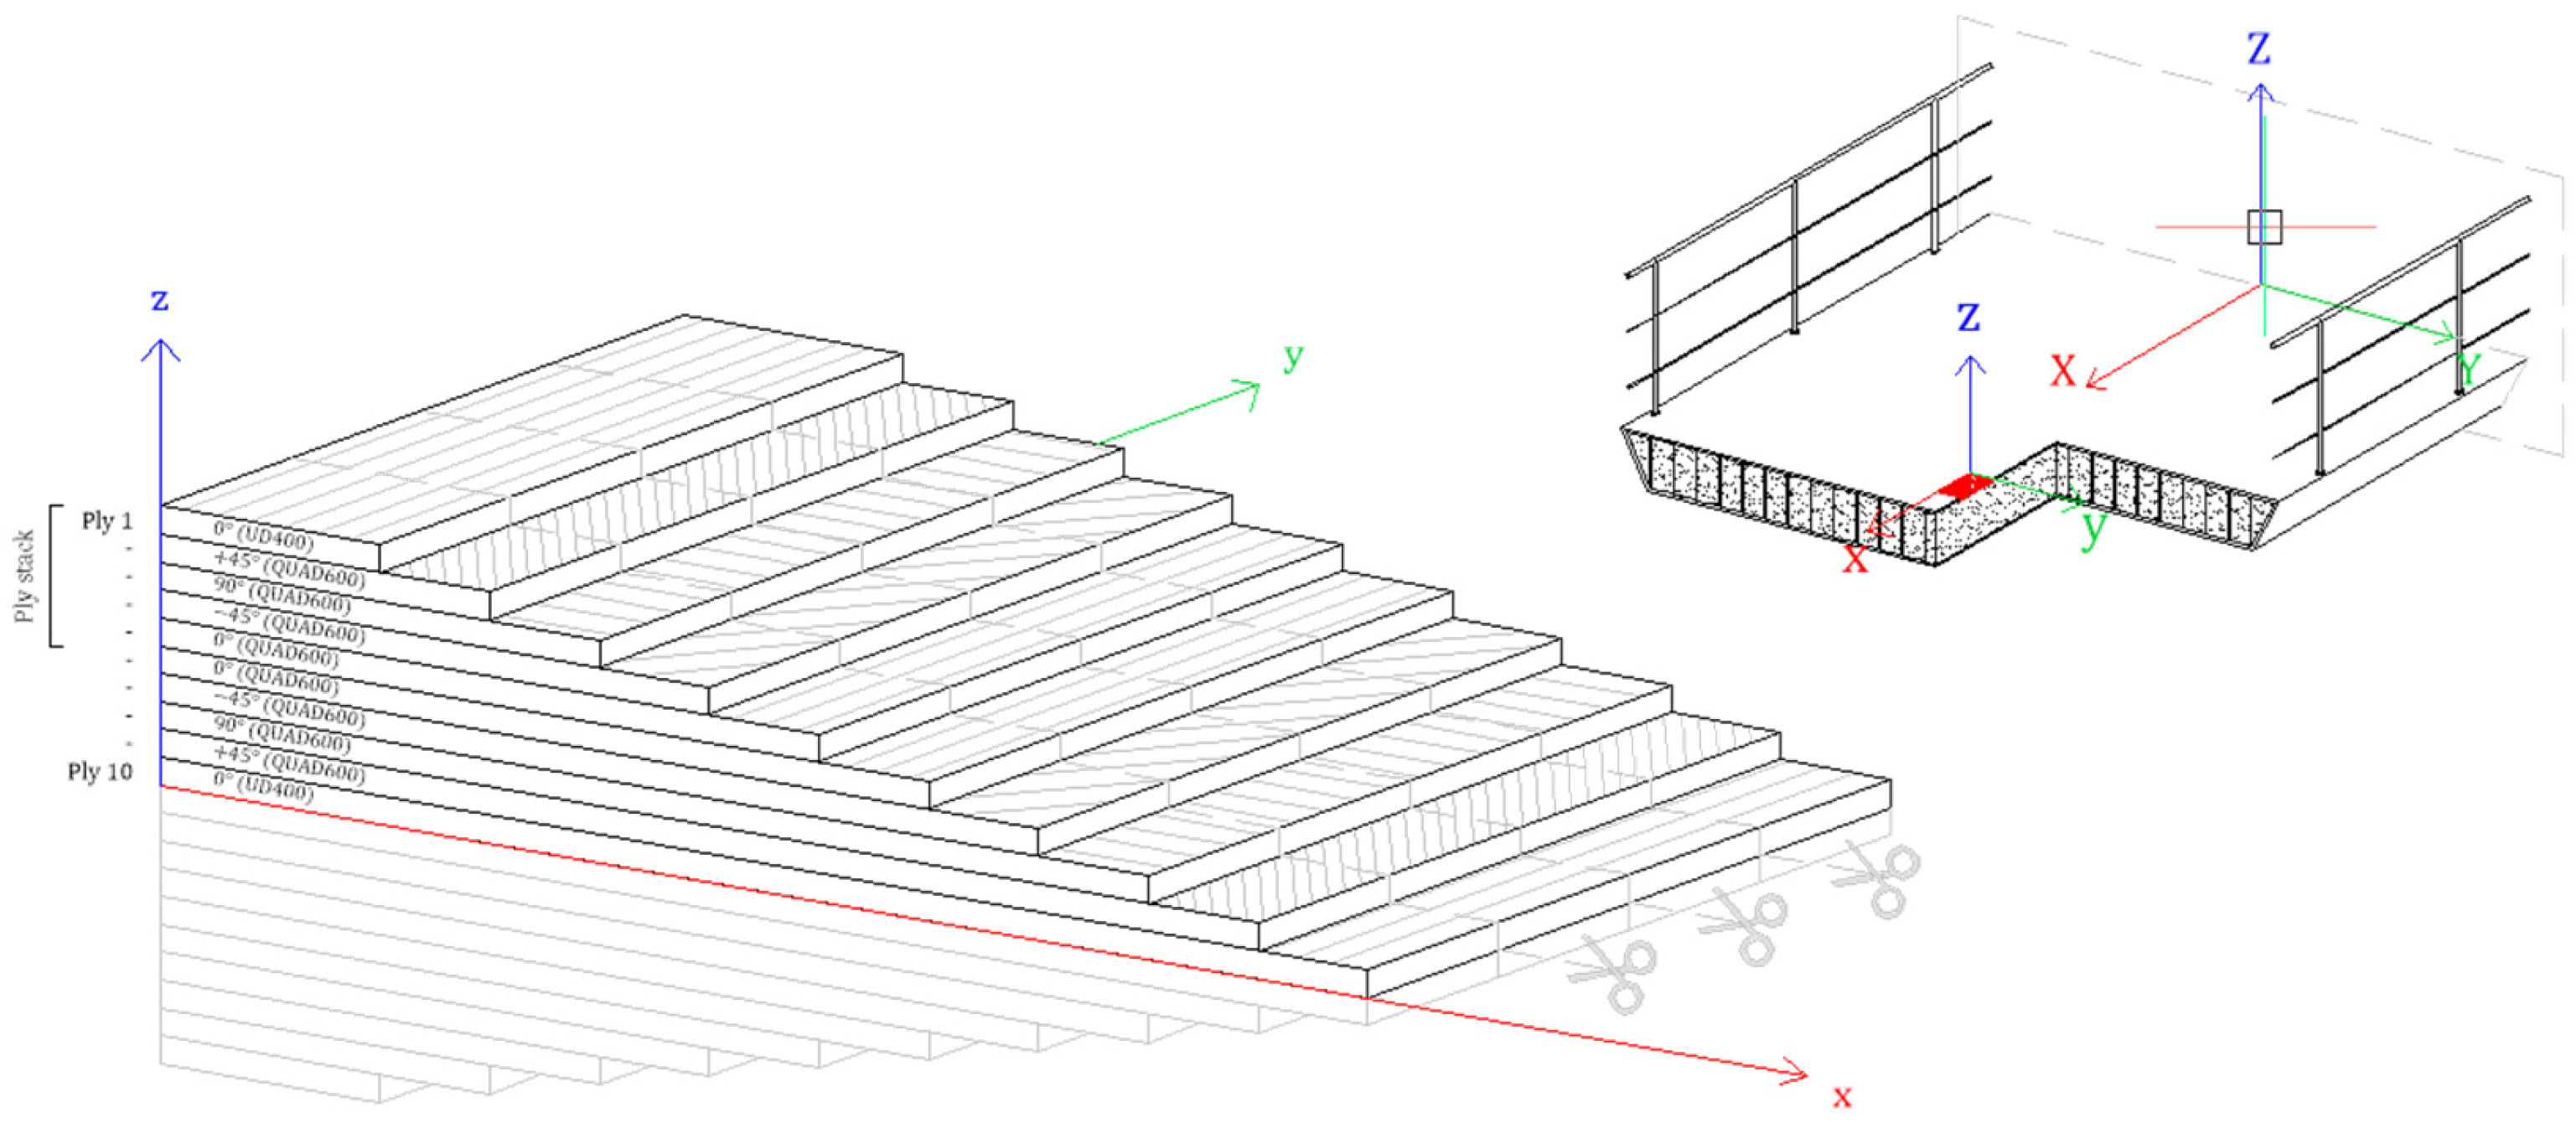
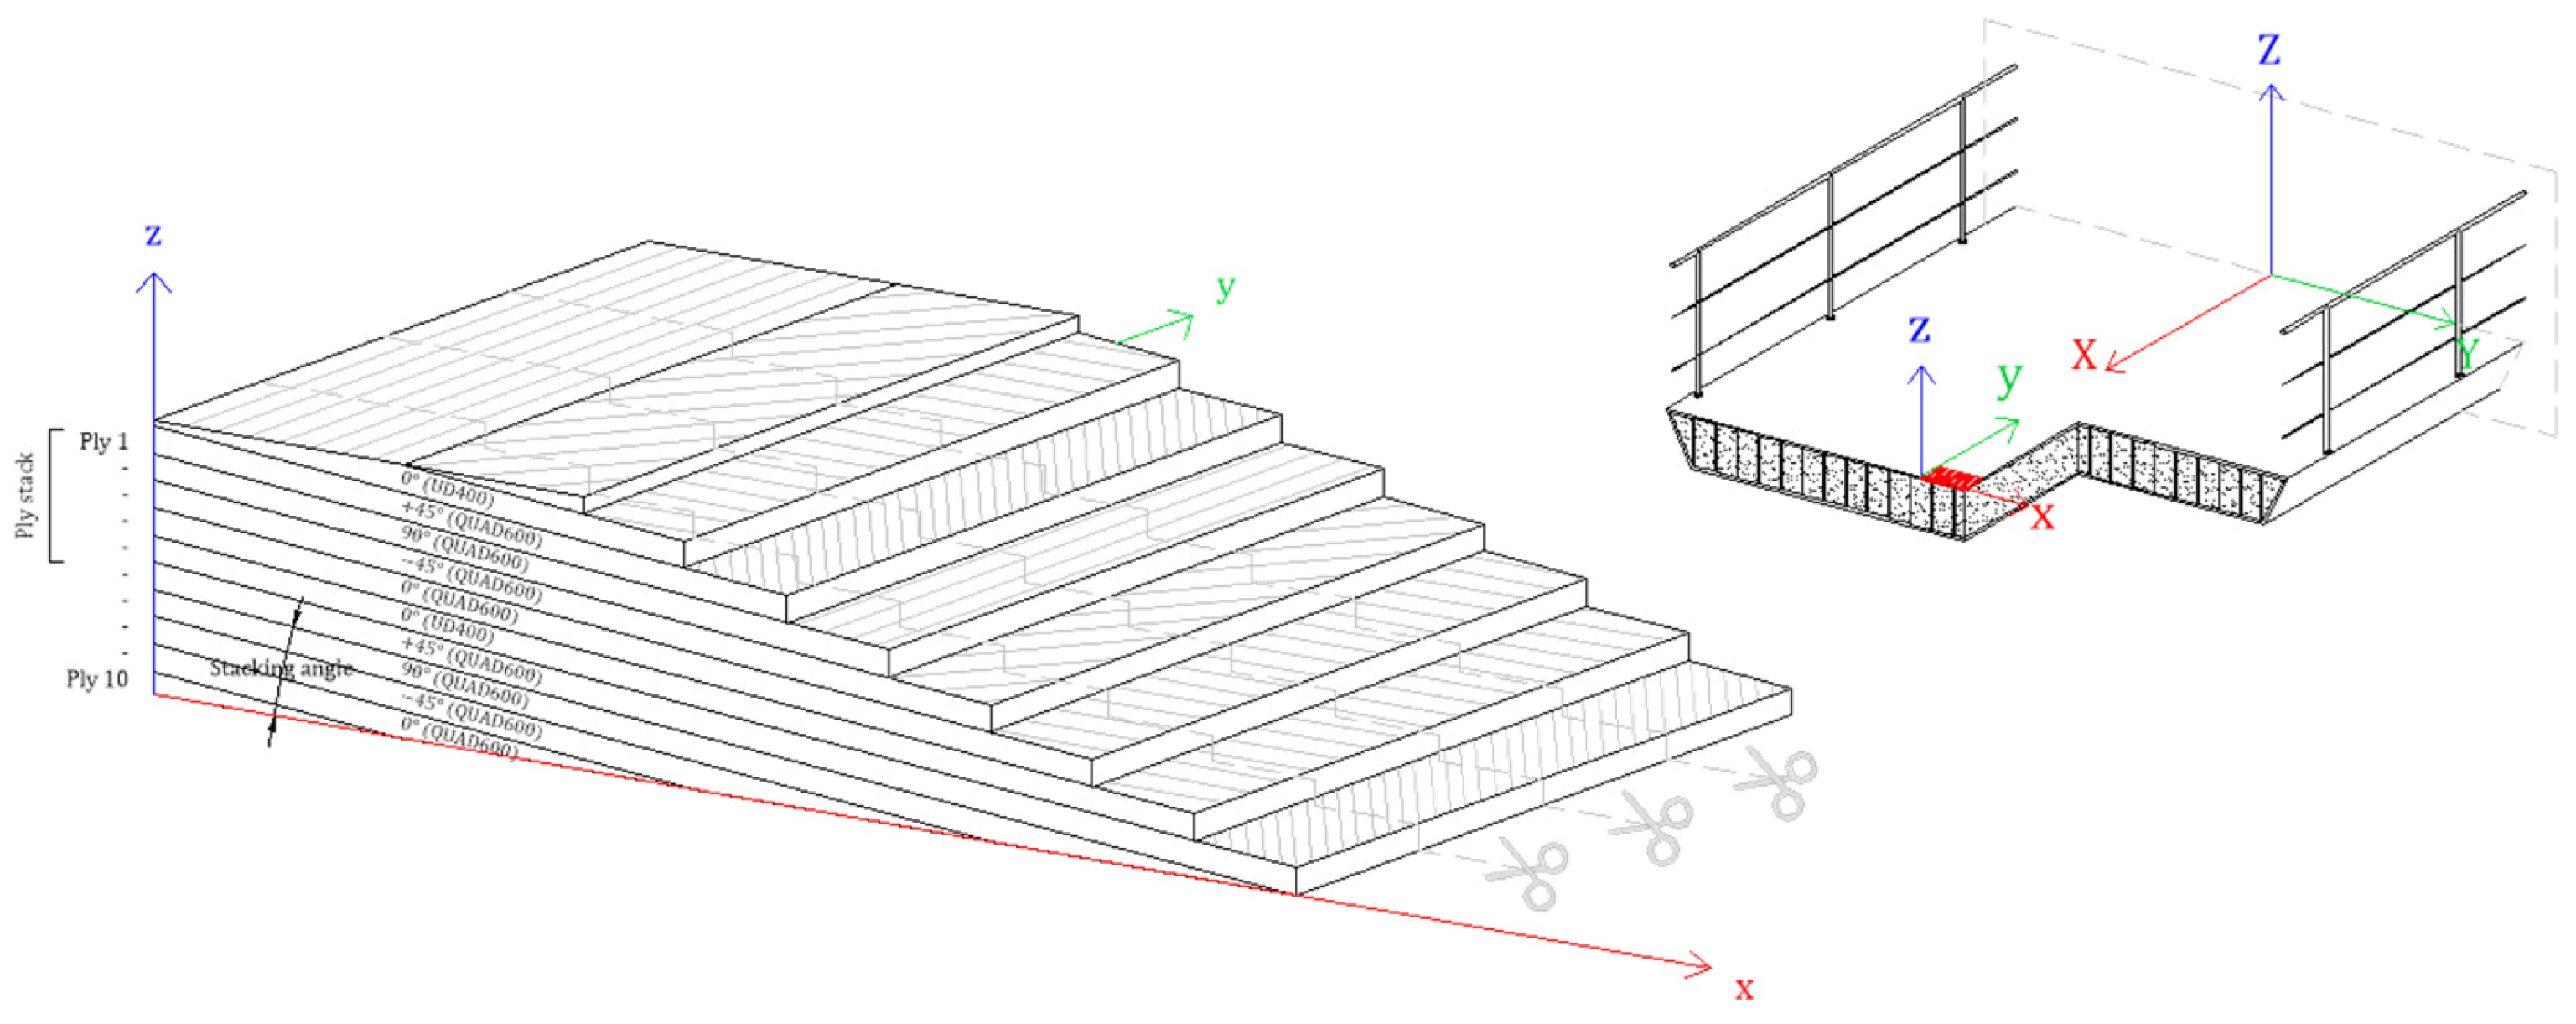
The specimens are composed of multiple plies of E-glass fiber unidirectional (UD) material infused with polyester resin (specifically, Disititron 3501 LS1). This polyester resin undergoes solidification through cross-linking chains, facilitated by a catalyst, methyl ethyl ketone peroxide (MEKP). During the production process, a 2% MEKP solution, in conjunction with polyester resin, is employed to infuse the GFRP TL plates. The laminate configuration is composed of symmetrically positioned ply stacks, consisting of one quadriaxial ply with a [0/45/90/−45] arrangement and a total fabric weight of 600 g/m2, along with one UD ply with a fabric weight of 400 g/m2. This results in a laminate lay-up unit stack with a [0/45/90/−45/0] configuration. Three types of specimens are fabricated using the VARI technique: a PP reference specimen and two TL specimens with stacking angles of 2° and 4°.
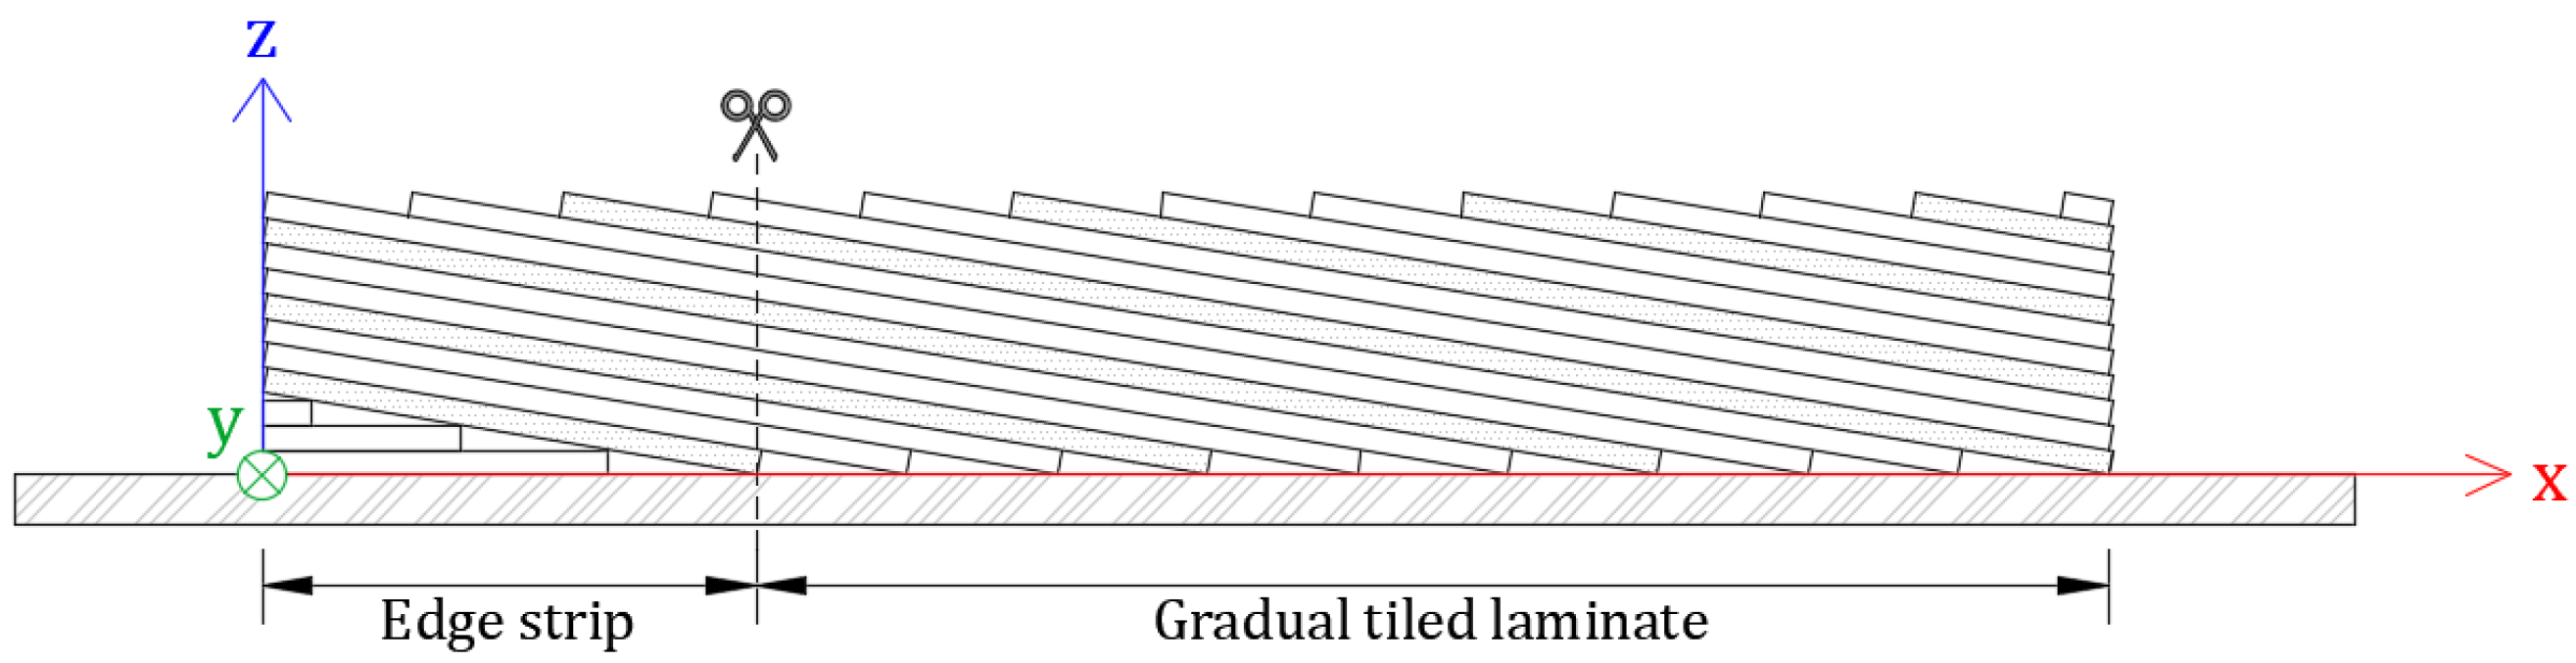
The PP reference specimens consist of a total of four ply stacks, resulting in a laminate of 20 plies and a theoretical thickness of 4 mm. For constructing the TL with theoretical stacking angles of 2° and 4°, edge strips are employed at both ends in the longitudinal direction of the specimen, as depicted graphically in Figure 15. These edge strips enable the creation of a specific thickness and length that determines the stacking angle of the laminate along the length of the TL specimen. During the cutting process of the specimen, the edge strip is first removed by making a transverse cut parallel to the local y-direction of the laminate, as indicated by scissor markings in Figure 15. This results in a tiled stacking of the plies throughout the full length of the TL specimens, in contrast to the TL specimens in Section 5.2. Subsequently, the TL specimens are cut parallel to the local x-direction of the laminate, as illustrated in Figure 13 and Figure 14, along the grey dotted lines marked with scissor symbols.
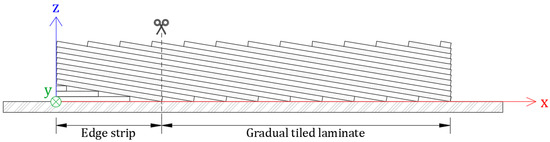
Figure 15.
Graphical representation of the manufacturing of a gradual TL using an edge strip.
The overlap length between consecutive plies in the TL varies based on the laminate lay-up (i.e., the thickness of individual plies) and the chosen stacking angle, which in turn depends on the height of the edge strip. Additionally, the length of each ply in the TL depends on its position within the laminate, the desired length of the laminate, and the dimensions of the mold. As a result, each ply has a distinct length, making the construction of this type of TL complex. Depending on the stacking angle, different laminate thicknesses are achieved. Angled plies are positioned and added on top of the edge strip until four full ply stacks are obtained, totaling 20 individual plies. Subsequently, successive elongating plies are added in the x-direction over a predefined interval, which depends on the thickness of individual plies. Plies continue to be added until the desired length of the TL is reached, constrained by the mold’s dimensions. Once this length is achieved, the process is repeated in reverse order with a gradual reduction in the length of the individual plies. This construction method results in a layered structure of the laminate with a gradual emergence and disappearance of individual plies. Although this process leads to more ply ends on the top and bottom surfaces of the laminate, it reduces stress concentrations and creates a more uniform strain distribution across the sample, as will later be demonstrated by the findings of Section 5.2.
Based on the dry weight of the fibers and the weight of the produced composite plate, the Fiber Volume Fraction (FVF) of the specimens is estimated. The FVF is found to fluctuate around 40% for both the PP and TL specimens. After cutting, the average cross-sectional area of the specimens is determined based on three measurements of width and thickness distributed along the longitudinal direction of the specimens.
Using the force data measured by the tensile machine and the displacements recorded by DIC across the entire field of the specimens, the stress–strain curves for the tensile tests conducted on the PP reference and TL specimens are established. The results are displayed in Figure 16.
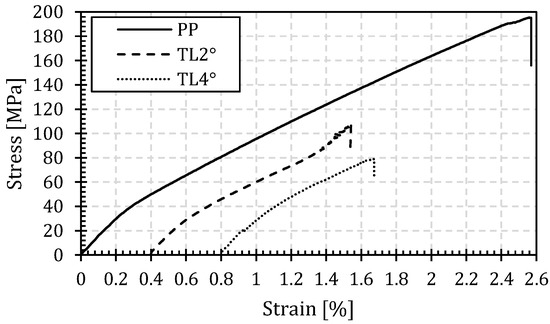
Figure 16.
Stress–strain data of the tensile tests on the PP reference and TL specimens with a 2° and 4° stacking angle.
For all specimen types, Figure 16 shows the presence of a knee point, distinguishing the initial linear elastic region from the region of transition stiffness. This knee point arises due to the matrix failure of the 0° plies (i.e., the 90°-plies in the global laminate directions are now aligned with the direction of tensile testing) within the laminate at an elongation of approximately 0.20%, resulting in a reduced stiffness. The initial stiffness is determined between 0.05% and 0.15%, while the transition stiffness after the knee point is determined between 0.40% and 0.60%. In addition to the stiffness, the first-ply-failure (FPF) and last-ply-failure (LPF) tensile strength and elongation are determined. The FPF strain is defined as the x-coordinate of the intersection of the linear trend lines representing initial and transition stiffness. The FPF stress is determined as the point where the curve intersects a vertical line drawn from the FPF strain on the x-axis. Table 2 provides an overview of the mechanical properties of the PP reference and TL specimens.
Table 2.
Mechanical properties of the PP reference and TL specimens [AVG ± STD (COV)].
Table 2 reveals that the tensile strength of a PP laminate is significantly larger than that of TLs. Additionally, increasing the stacking angle further reduces the LPF strength of the laminate. The tensile strength of TLs with stacking angles of 2° and 4° is 43% and 60% lower, respectively, compared to the PP reference laminate. Furthermore, the tensile strain at ultimate failure decreases by 56% and 66% for TLs with stacking angles of 2° and 4°, respectively. However, the initial stiffness remains nearly constant for different specimen types, at approximately 14.2 GPa.
The typical failure behavior of the PP reference and TL specimens is depicted in Figure 17a,b. The failure mode aligns with the observations from Section 5.2, with explosive fiber failure in the PP specimens and interlaminar shear between the individual plies of the TL specimens. The crack in the TL initiates at one of the plies end at the front and/or back of the specimen and then propagates under shear stresses in the thickness direction of the specimen. The final interlaminar crack within the specimen’s thickness direction can be seen in Figure 17c. It is evident that the individual plies of the laminate exhibit a consistent stacking angle, in contrast to the TL specimens in Section 5.2 where local angular rotations of different plies occurred.
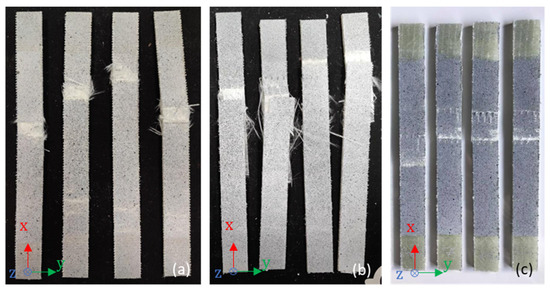
Figure 17.
Failure behavior of the PP reference (a), TL specimens (b) and a close-up of the interlaminar failure between the plies of a TL (c).
The strain field and evolution along a longitudinal centerline of the specimens during the tensile tests are shown in Figure 18 for the PP reference and TL specimens. As concluded in Section 5.2, the strain field for the PP reference is nearly uniform across the specimen’s entire length. In contrast, the strain evolution for the TL specimens exhibits multiple peaks and valleys at the ply ends and beginnings. The TL specimens with stacking angles of 2° and 4° experience strain variations of 32% and 24%, respectively.

Figure 18.
Full-field strain image (red highest strain and purple lowest strain) and DIC strain evolution over the centerline for the TL2° (left) and TL4° (right) specimens.
5.2. Ply Stacking in the Longitudinal Supporting Direction
In contrast to Section 5.1, this section investigates the impact of the tiling in the longitudinal direction. Here, the loading direction (i.e., local x-direction of the laminate) during the tensile testing are aligned with the global X-direction of the bridge deck. Here, the specimens are comprised of repetitive 150 mm-long fabric stacks, each composed of four individual plies. Within each stack, there are two 0°-plies, one 45°-ply, and one −45°-ply, denoted as [0/45/−45/0], in accordance with the findings of Section 4.1. These stacks are arranged in a tiled configuration with a predefined overlap length to create a TL with a specific stacking angle.
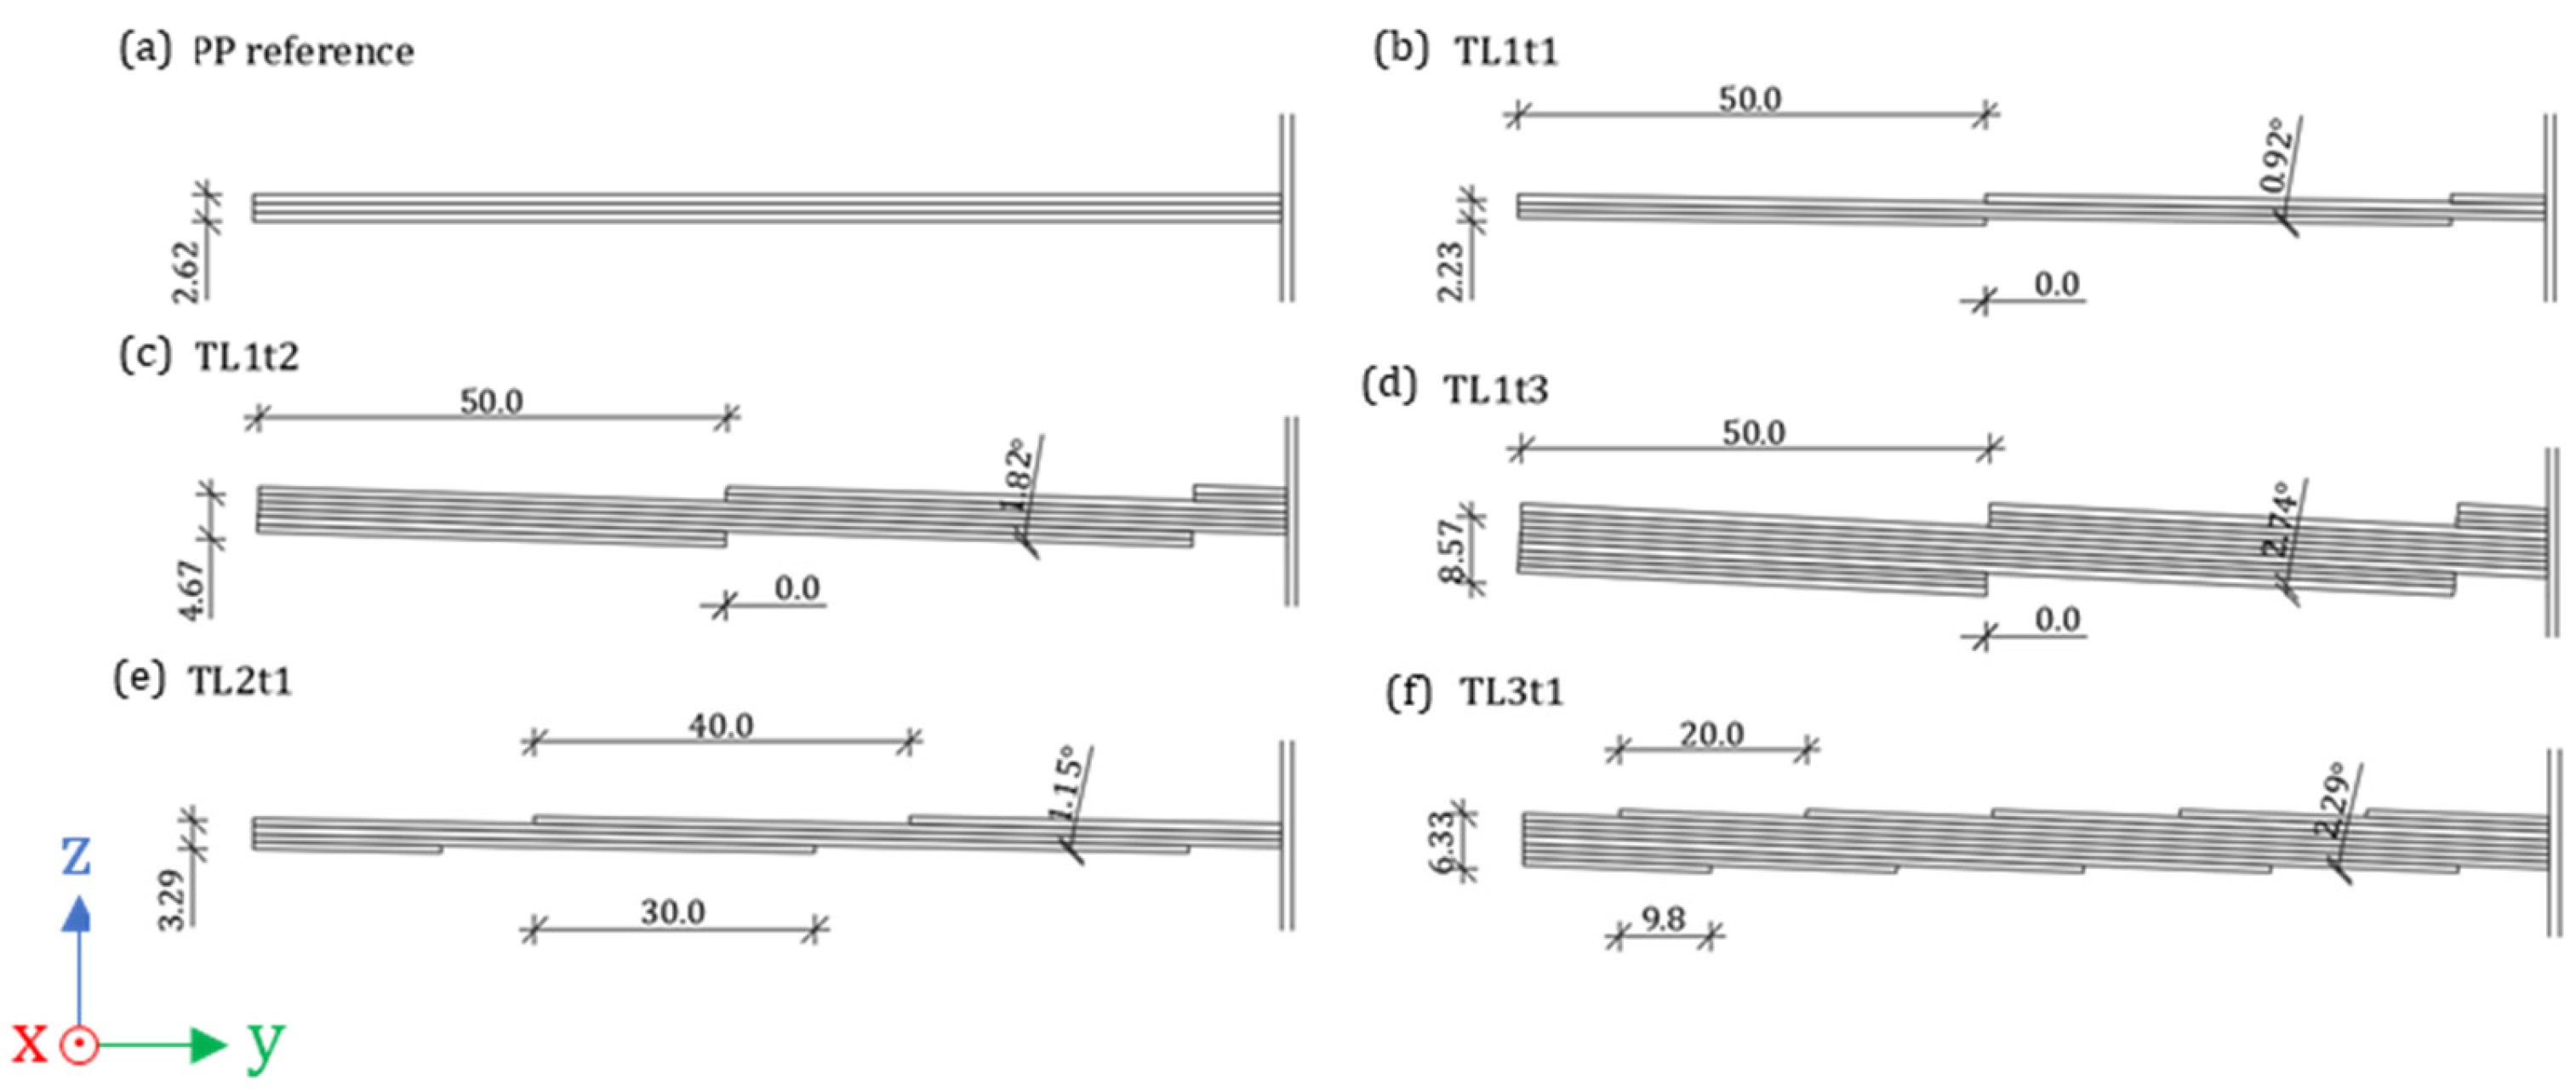
The plane parallel (PP) reference sample consists of three stacks sharing the same structural composition as described above. However, these stacks are arranged parallel to each other. Laminate plates, measuring 300 × 300 mm2, are infused using a vacuum-assisted resin infusion (VARI) technique. After curing, they are meticulously trimmed to the prescribed coupon size, following ASTM D3039 guidelines, with a length of 250 mm and a width of 25 mm. The specimen’s thickness varies, depending on the build-up and overlap length. To ensure statistical robustness, we tested a minimum of five specimens per laminate type. Various specimen geometries and build-ups (as depicted in Figure 19) underwent testing throughout this research.

Figure 19.
Geometry (in mm) and laminate construction of the PP reference and TL specimens.
To create diverse stacking angles within the tiled laminates, two techniques were employed. In the first technique, the thickness of a single stack was adjusted by doubling or tripling the build-up (indicated as TL1). In the second technique, the overlap length between the stacks was altered (indicated as TL2 and TL3), resulting in a gradual transition between the different stack layers. It is noteworthy that changing the overlap length of the stacks also increased the overall specimen thickness. The overall thickness indicated in Figure 19 represents the average thickness across five tested specimens from a single manufactured plate, measured at three distinct points along the specimen’s length. Specimens labelled as TL1 feature a consistent overlap length of 50 mm for the stacks. However, the thickness of a single stack varies, as indicated by the suffixes t1, t2, and t3, representing one, two, and three times the original stack thickness, respectively ([0/45/−45/0], [0/45/−45/0]2, and [0/45/−45/0]3). Given that the 50 mm overlap length is a multiple of the total stack length (150 mm), it results in an abrupt transition between different stack layers, as depicted in Figure 19b,d,f. For specimens TL2t1 and TL3t1, the overlap length between the stacks was altered to 40 mm and 20 mm, respectively, resulting in a gradual transition. The PP reference sample, featuring a stacking angle of 0°, serves as a benchmark for evaluating the global and local stiffness, as well as the strength at first ply and total failure of the TLs.
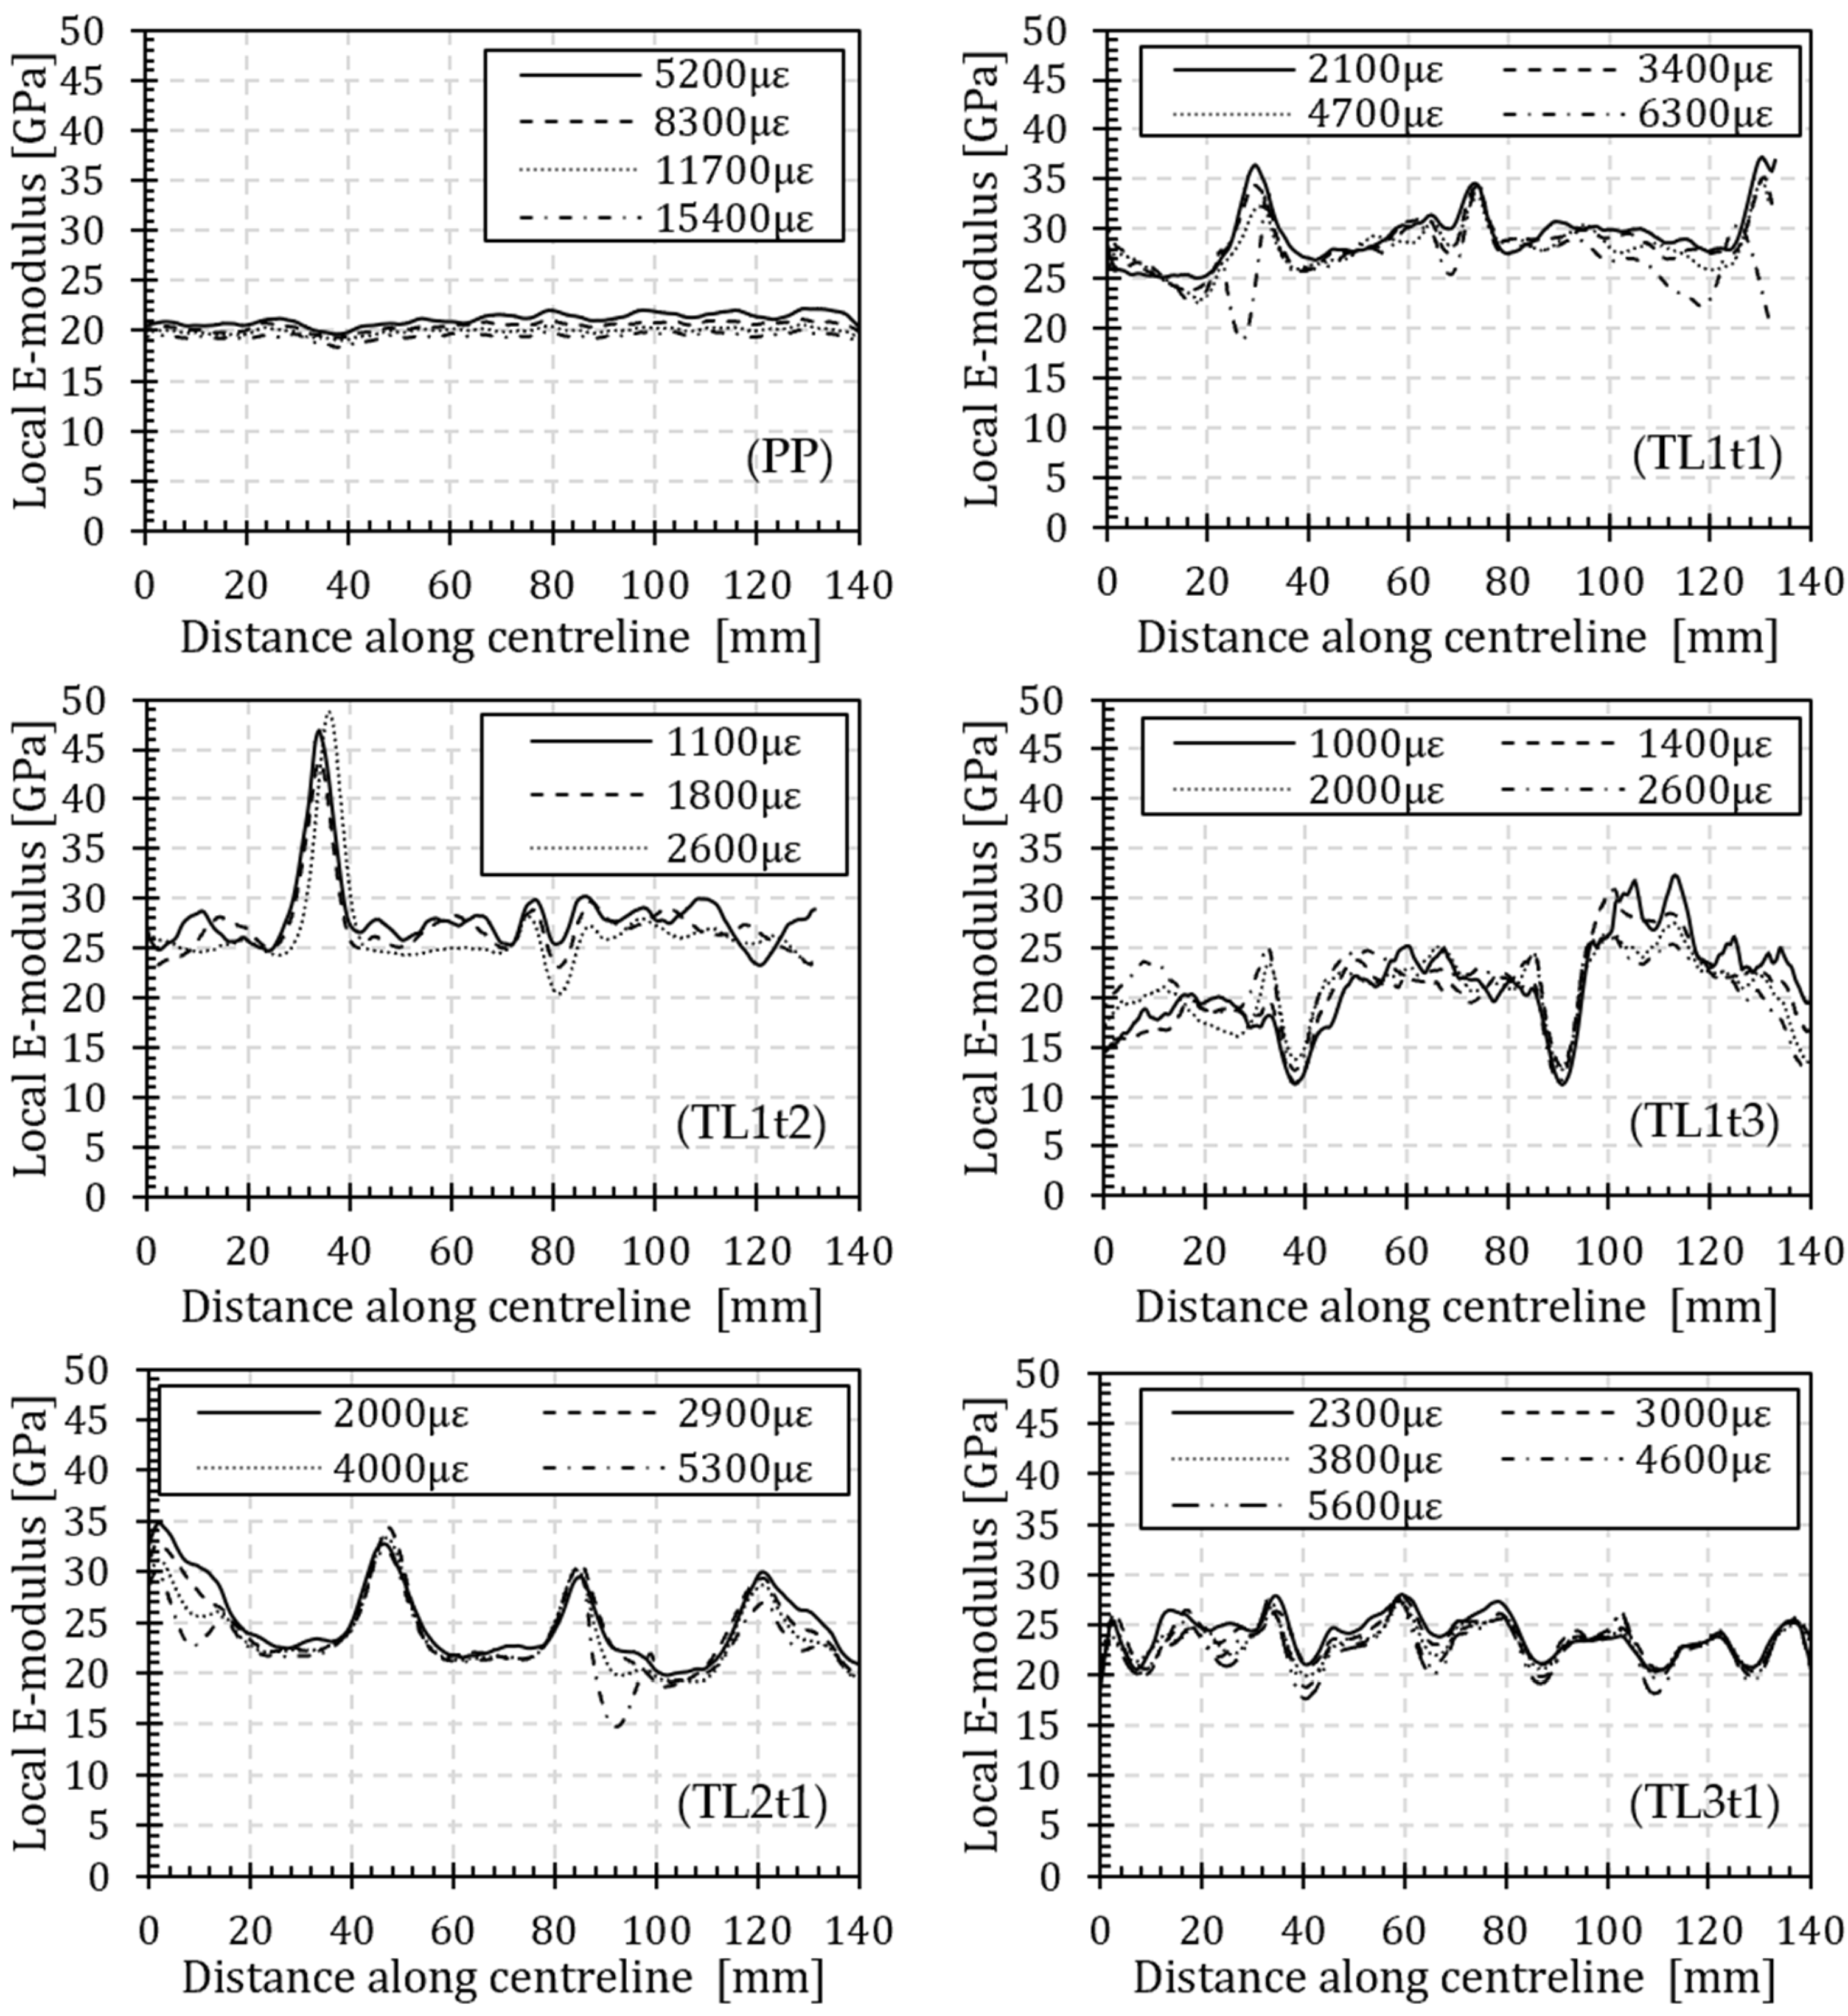
The DIC measurements indicate variations in stiffness along the centerline of the specimen’s length, indicating distinct strain values at every position along the test specimen’s surface. Consequently, traditional point measurements using strain gauges or extensometers on the surface of a TL are deemed unreliable for determining laminate stiffness, a conclusion substantiated by the previous research in Section 4.2. In this study, a comprehensive DIC measurement is opted for to capture the entire strain field of the specimen, providing a more accurate depiction of both global and local stiffness within the TLs. This enables the derivation of critical insights into the general stiffness and strength, concerning the first and last ply failures, influenced by the stacking angle. Here, the reference for these evaluations is the PP reference sample, which has a stacking angle of 0°.
Figure 20 presents the local Young’s modulus along the centerline of the plane parallel laminate and the different tiled laminates across a range of average global strains. The strains shown at regular interval, set at 20 s increments, commencing when a minimum strain threshold of at least 1000 με (0.1%) is attained to ensure a well-distributed strain profile along the specimen’s length. This interval is maintained until the specimen reaches its first failure. Importantly, at the point of failure, the speckle pattern is disrupted to such an extent that further pattern correlation becomes unfeasible. Consequently, at the location of the failure, a zero-strain value is recorded, which deviates from the reality of the situation, as substantial displacement typically occurs at that location. Consequently, the set of average strains may exhibit discrepancies across the graphs in Figure 20.
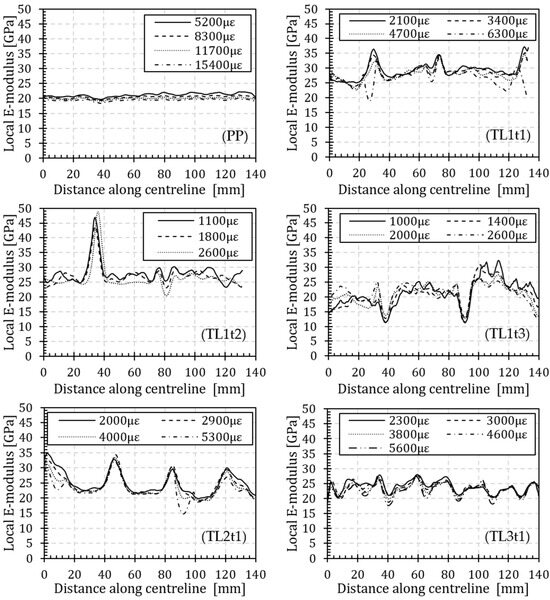
Figure 20.
Local Young’s modulus along the centerline of the PP reference and TL specimens.
Figure 20 not only reveals the presence of overlap regions in the TLs, indicated by peaks and valleys in the curves but also demonstrates that, as failure approaches (during the final time interval in the graphs), stiffness diminishes at the points of overlap. This reduction in stiffness is particularly pronounced at the overlap regions, as initial failure predominantly commences at the free edges of the top and bottom surfaces of the specimen, where a ply overlap terminates.
Figure 21 showcases the average stress–strain relationships for the PP reference sample and different TL specimens. Stress is computed by dividing the measured tensile force from the testing machine by the average cross-section along the specimen’s length. Strain, on the other hand, is directly derived from DIC measurements and is averaged across the full length of the specimen. It is important to note that the diagram represents only the elastic region of the stress–strain curve until the first failure occurs. Consequently, the maximal stress in this diagram does not correspond to the total tensile strength of the laminate specimen.
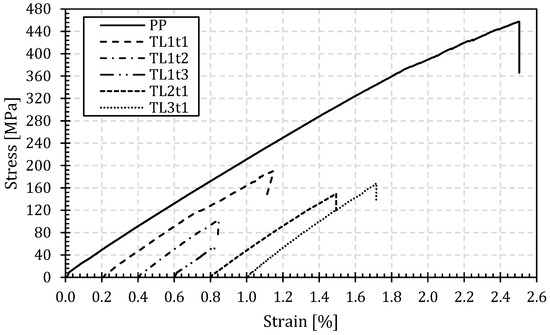
Figure 21.
Average stress–strain data of the PP and TL specimens (shifted every 0.2%).
Applying Hooke’s law, the average Young’s modulus for the laminates is calculated, enabling the plotting of the relative stiffness for the PP reference sample as a function of the stacking angle in Figure 22. This graph also includes relative strength data, both until the first failure (FF) and total failure (TF) in comparison to the PP reference sample. Notably, Figure 22 reflects a marginal reduction in stiffness between the PP reference sample and various TLs. In contrast, a significant decline in strength until FF and TF are observed when the stacking angle deviates from 0°, represented by the PP reference sample. The stacking angle exerts a minor influence on the overall stiffness of the specimen, given that a PP laminate is only marginally stiffer than the TLs, by 10%. However, the difference in strength until TF is substantial, with a PP specimen being approximately 53% to 83% stronger than its TL counterparts.
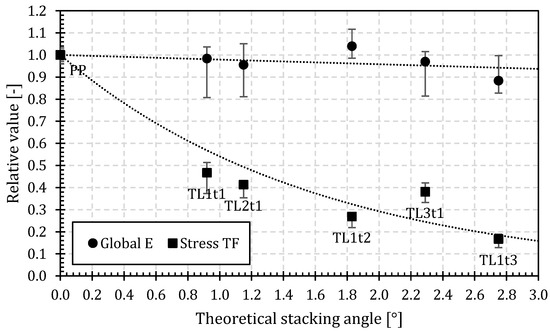
Figure 22.
Relative Young’s modulus in function of the theoretical stacking angle.
From numerous microscopic images of the specimens, it is shown that the theoretically expected stacking angle of the specimens does not precisely match the actual local stacking angle following the production. The production process leads to a significantly larger local angle at an overlap location between two plies than the theoretical stacking angle. Additionally, the ply arrangement between two consecutive overlap regions in a TL aligns closely with that of a PP laminate. This correspondence can also be inferred from Figure 20, which illustrates the local Young’s modulus along the centerline of the specimens.
In Figure 23, the failure behavior of a PP reference sample (on the left) alongside two TLs (in the middle and on the right) can be observed. As expected, the PP reference sample exhibits fiber failure, accompanied by an explosive failure event, serving as the primary failure mode. In contrast, both the TL1t1 specimen with a lower thickness and a straight overlap and the TL3t1 specimen with a larger thickness and a more gradual overlap experience failure through shear between the different layers of a stack. It is noteworthy that there are slight variations in the failure behavior between the two construction methods. In the case of TL1, failure occurs more gradually and can be anticipated, whereas, in the case of TL2 and TL3, failure is abrupt, without any preceding deformation of the specimen. Given the preference in civil engineering for a more gradual failure, TL1 laminates are favored over the other two TL types.
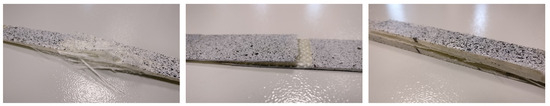
Figure 23.
Failure behavior for a PP (left), TL1t1 (center) and TL3t1 (right) specimen.
Moreover, the local stacking angle exerts influence on the commonly observed fracture mechanism, as illustrated in Figure 24. The tensile force applied results in substantial shear loading at the interfaces between the different plies, generating a shear-induced failure mechanism. Additionally, the applied tensile force leads to the straightening of the plies, involving a rotation and a local angle adjustment.
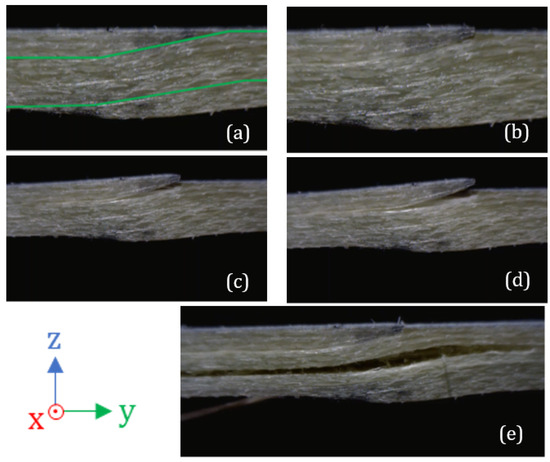
Figure 24.
Online microscopic images of the failure mechanism in TL2t1 at the location of an overlap and ply start/end (a) with the green lines indicating one ply stack; the propagation of the crack due to shear stresses (b–d), culminating in the ultimate failure (e).
By straightening these plies and consequently reducing the local stacking angle, adjacent plies are pushed outward. This results in interlaminar failure (i.e., peel effect) at ply start/end locations, as depicted in Figure 24a. Figure 24b–d illustrate the propagation of the crack due to shear stresses, culminating in the ultimate failure in Figure 24e of the specimens. At the final stage, it is seen that the failure mode predominantly consists of interlaminar shearing between the ply stacks.
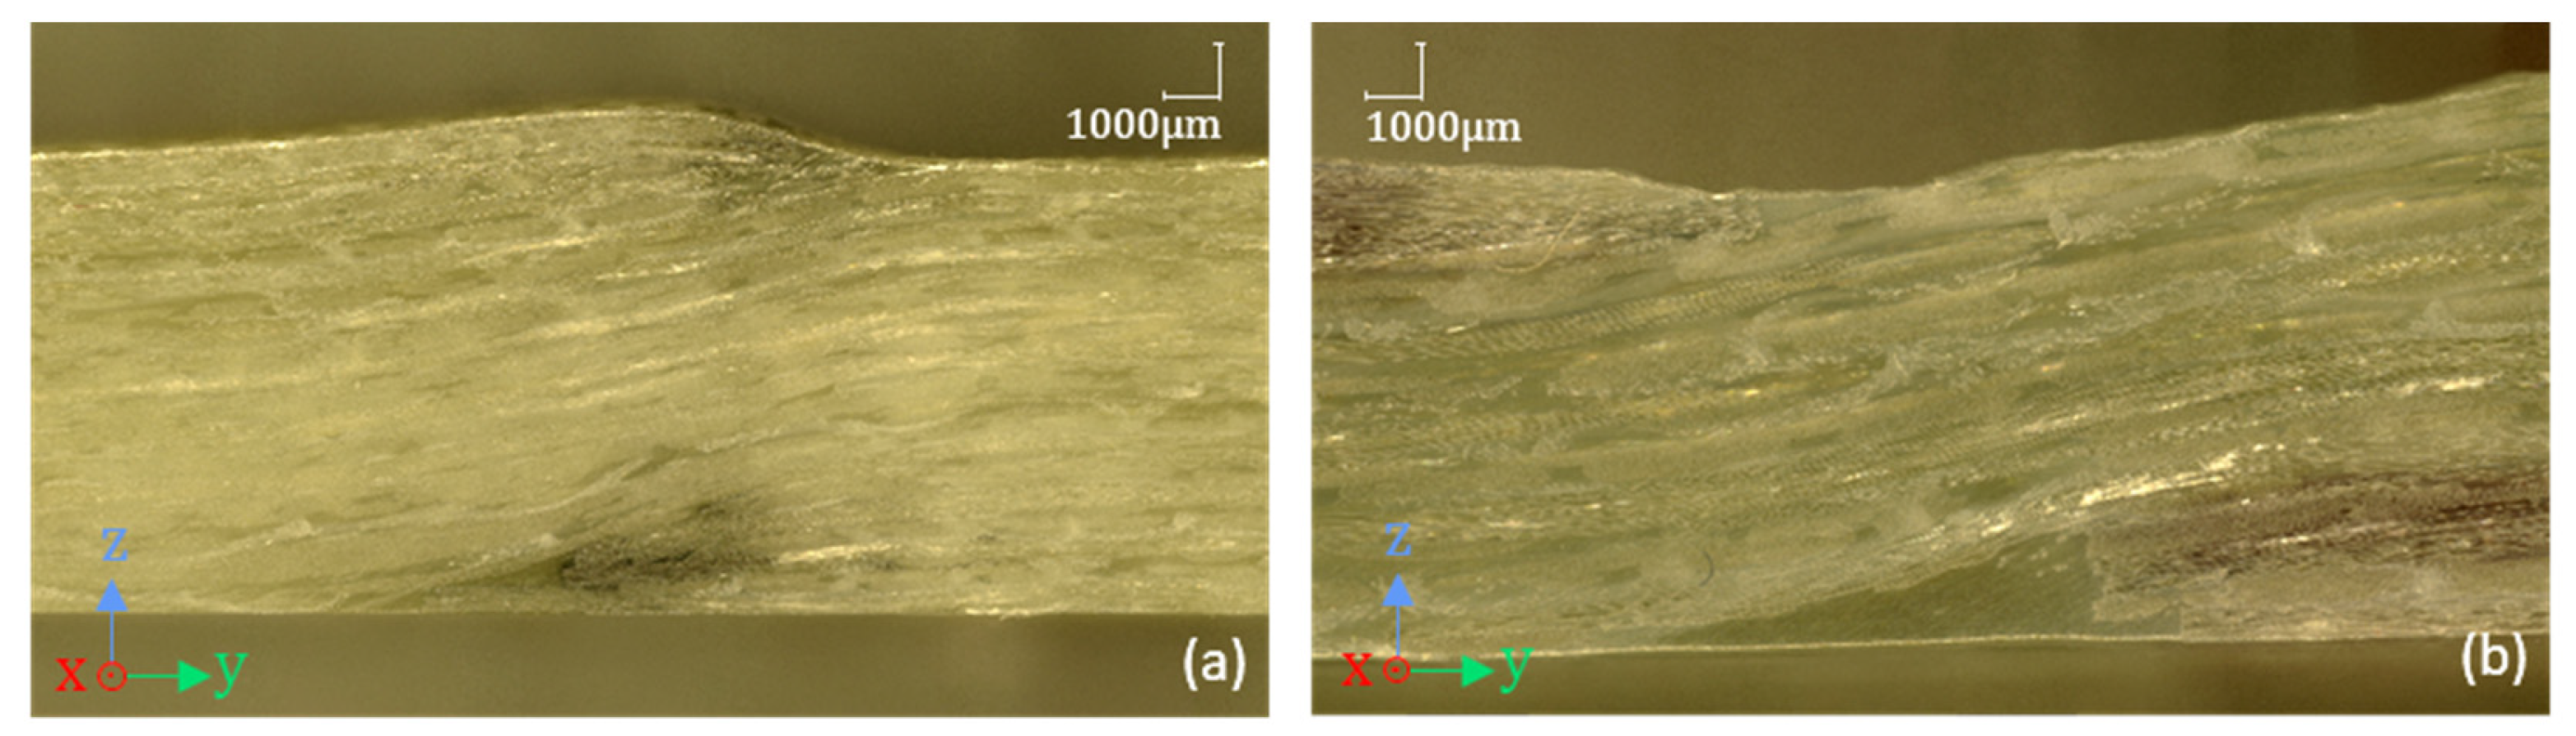
A plausible explanation for the peak and valley local stiffness values within a TL, as observed in Figure 20, can be elucidated based on microscopic images taken at the overlap location in the TL2t1 specimen, as displayed in Figure 25. On the flat side of the specimens (i.e., against the hard side of the mold during production), resin concentrations have developed between consecutive ply stacks, leading to localized cross-sectional reductions as can be seen from Figure 25b. Due to this uneven arrangement of the different stacks and the variations in cross-section thickness at these points, an increase in local deformations and consequently, strains become apparent. This phenomenon, seen in Figure 20, manifests itself as a reduction in local stiffness.

Figure 25.
Microscopic close-ups of failure onset in specimen TL2t1 at the location of a ply end/beginning with larger (a) and smaller (b) laminate thickness due to ply stacking.
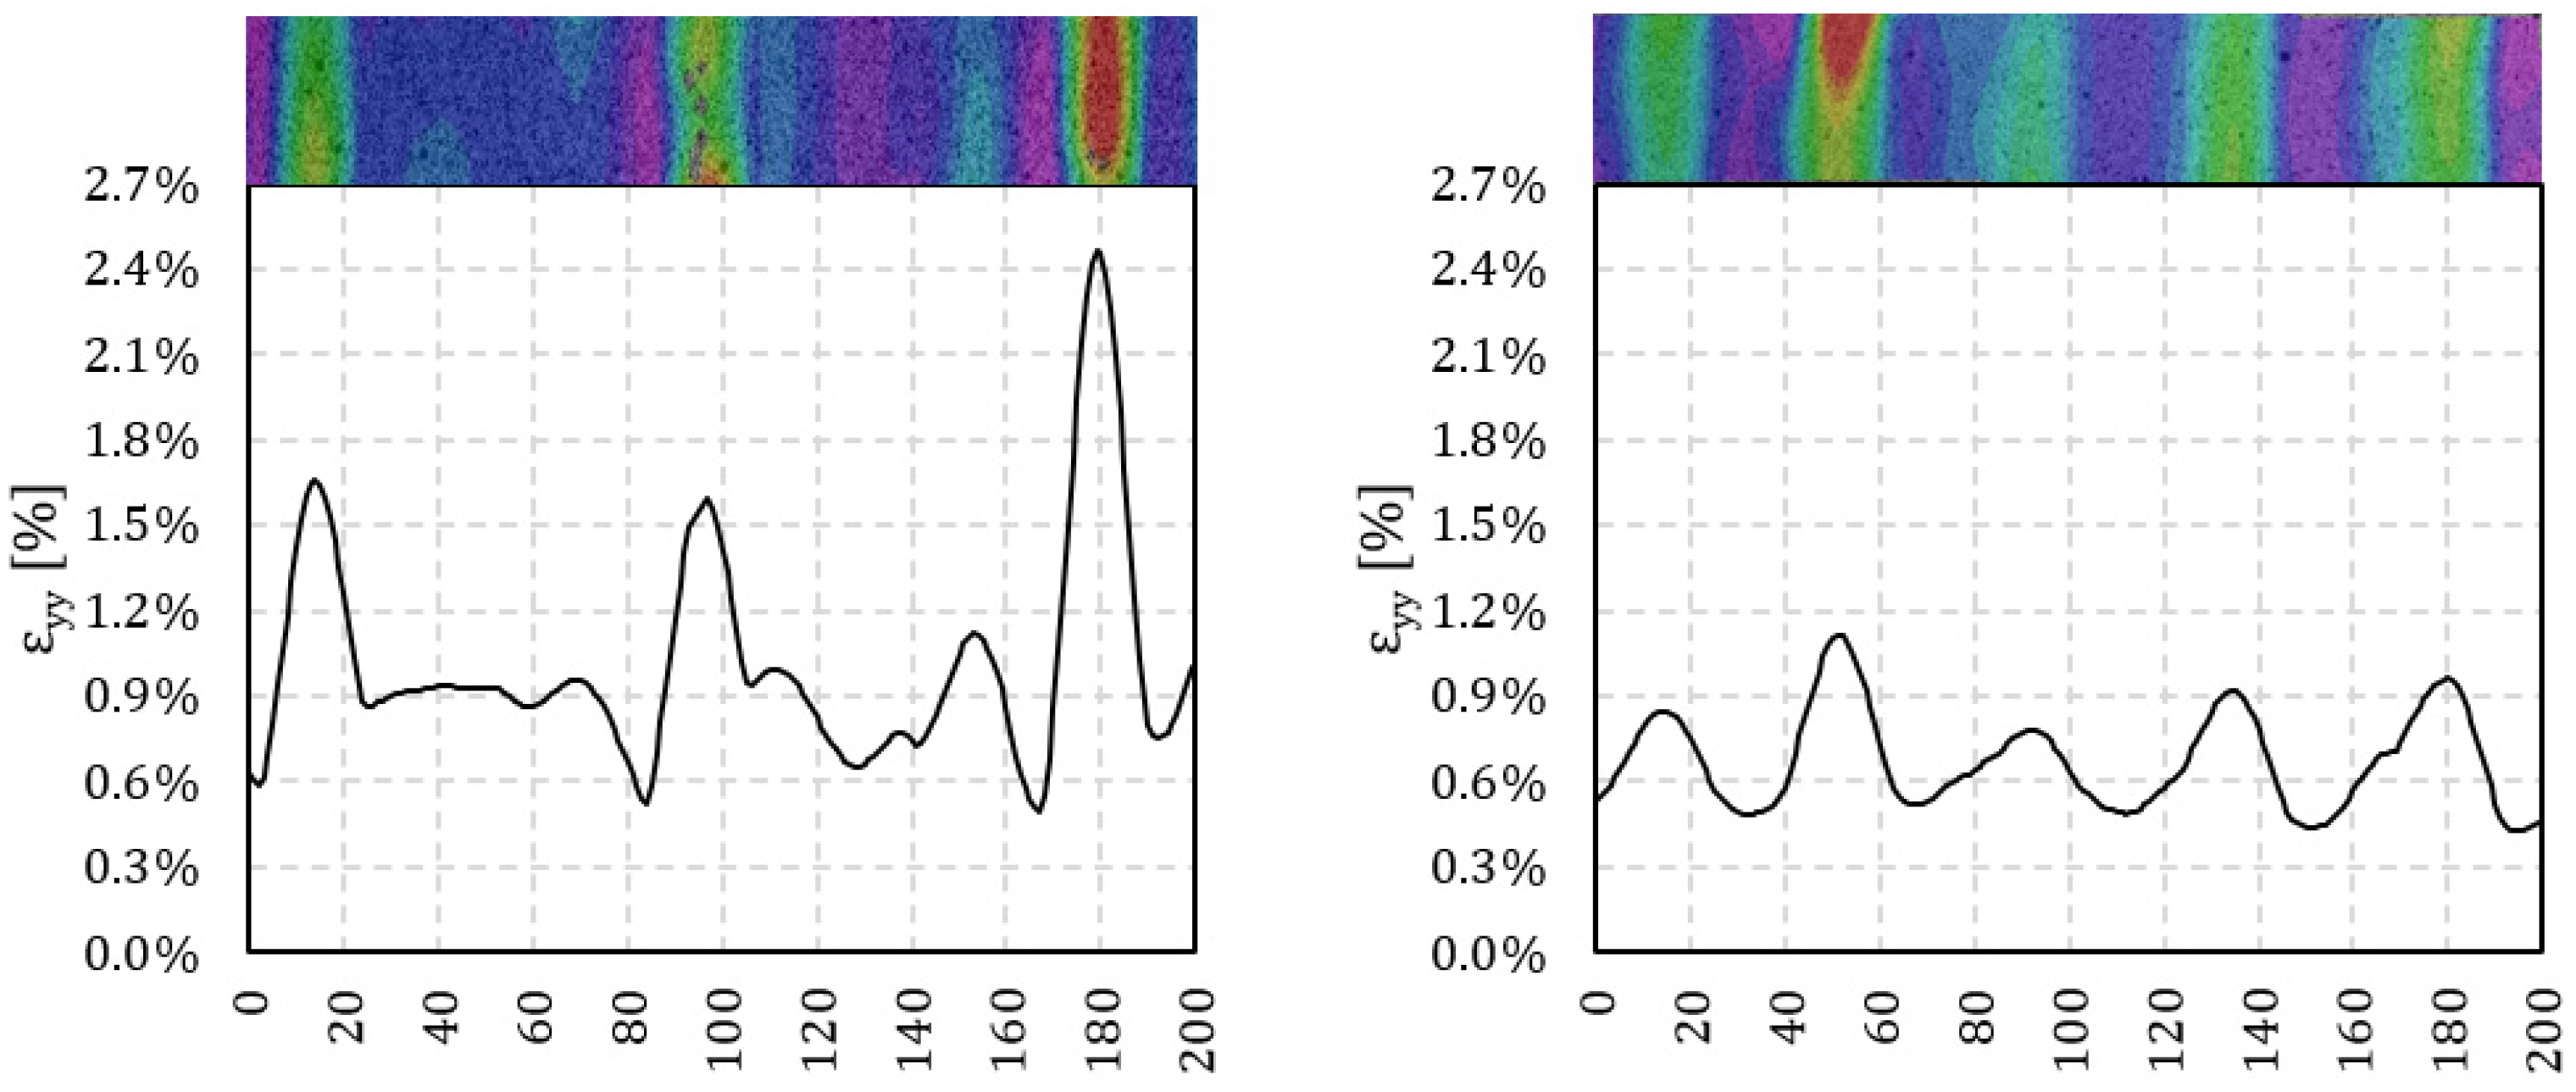
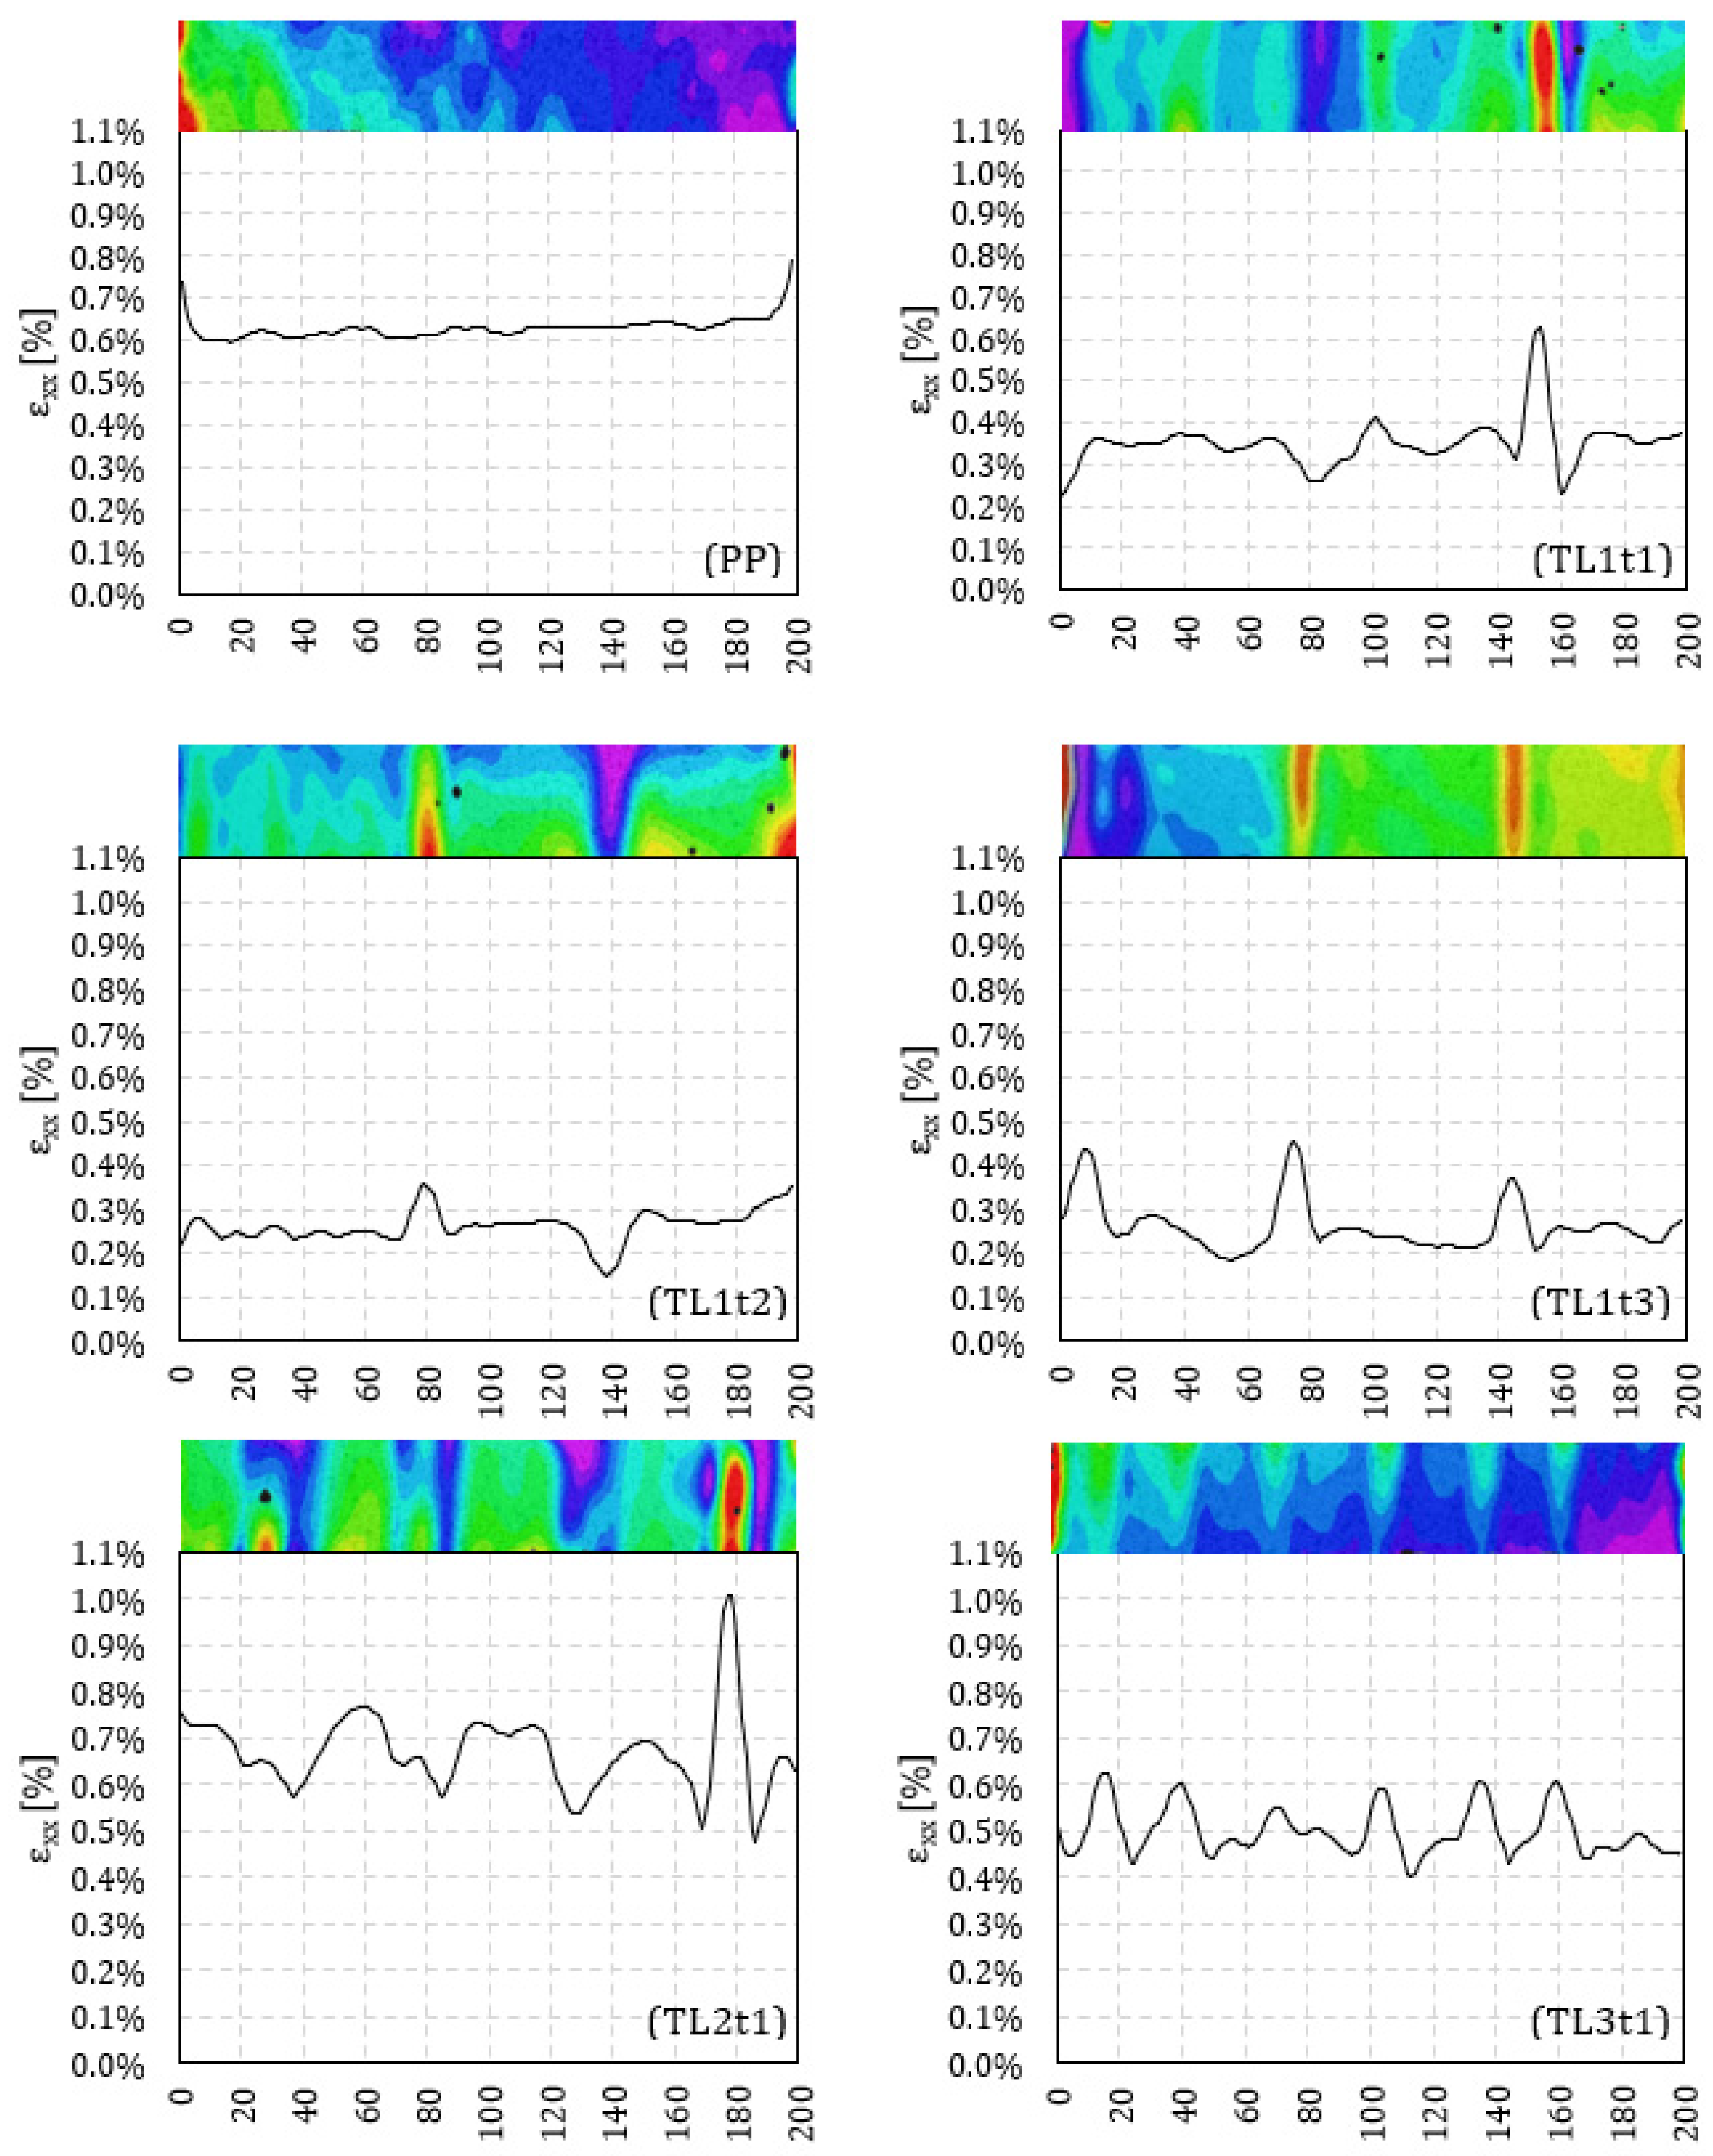
Based on the 3D DIC images, a complete strain field in the longitudinal direction of the specimen can be constructed, offering insights into the development of local strain concentrations on the specimen’s surface. To achieve this, εxx strain data obtained from the VIC-3D software (Version 9, Correlated Solutions, Columbia, SC, USA) are extracted at 200 points along a centerline in the longitudinal direction of the specimens. The strain pattern is analyzed at maximum load, just before ultimate failure, to gain a clear understanding of the occurring stress concentrations across the different specimens. In the following paragraphs, the strain pattern of one representative specimen from each type is assessed and discussed.
First, the reference PP sample is examined. From Figure 26, it becomes evident that the strain field in the PP reference specimens displays nearly uniform distribution across the specimen’s surface, with an average standard deviation of merely 2% among the individual measurement points along the centerline. Slightly elevated local strain levels are only observable near the grips of the tensile machine.

Figure 26.
Full-field strain image and evolution over the centerline for the PP reference and the different types of TL specimens.
Figure 26 showcases the strain field for a TL1t1 specimen. It confirms that the strain distribution across a TL’s surface is not uniform, corroborating the assumptions from the tensile tests conducted on transverse coupons from the top and bottom flange of a web–core sandwich panel, as highlighted in Section 4.2. Additionally, overlap locations are discernible in the strain field, marked by reduced strain levels. Between consecutive overlap locations, the strain pattern exhibits a quasi-uniform evolution, akin to that observed in a PP laminate. Microscopic images in Figure 5 suggest that these intermediate areas assume a quasi-PP laminate structure, with local angular rotations of plies occurring only at overlap locations. Manual production processes introduce an inherent challenge in achieving perfect transitions between successive stacks. Consequently, variations in thickness arise within the laminate, as illustrated in Figure 25. These variations cause the local strain to decrease or increase, corresponding to decreases or increases in thickness. As a result, the ultimate failure location can be identified as the point with the highest strain. Given the unique laminate structure with pronounced stack transitions at overlap locations, a similar strain pattern emerges in Figure 26 for the TL1t2 and TL1t3 specimens, respectively. However, the peaks and valleys in these laminate specimens occur more frequently and exhibit more pronounced extremes, owing to larger differences in cross-sectional thickness at overlap locations within the specimens. These extreme strain values are also reflected in the average standard deviation of the data along the centerline, amounting to 11%, 12%, and 14% for the TL1t1, TL1t2, and TL1t3 specimens, respectively.
In the second construction method (i.e., specimens labelled with TL2 and TL3) of the tiled laminates, a specific overlap length is introduced between the top stack’s initiation and the bottom stack’s termination within the TL. This results in a more gradual transition in thickness at the overlap locations and is also more forgiving in terms of potential errors during the placement of individual plies. Here, Figure 26 demonstrates that the peaks and valleys in a TL2t1 specimen are considerably less pronounced compared to the TL1-type specimens, with a standard deviation of 10% for the TL2t1 specimens. Strain concentration continues to occur solely at the location of ultimate failure. It can be inferred that strain is more uniformly distributed in the longitudinal direction for this type of construction method for a TL.
A similar strain pattern can be observed in Figure 26 for the TL3t1 specimens. However, no definitive failure location is evident in the strain field, and strain concentration spans the entire length of the specimens with overlap locations appearing in rapid succession in this case. The average standard deviation in strain along the longitudinal direction remains modest for the TL3t1 specimen, with a value of 9%.
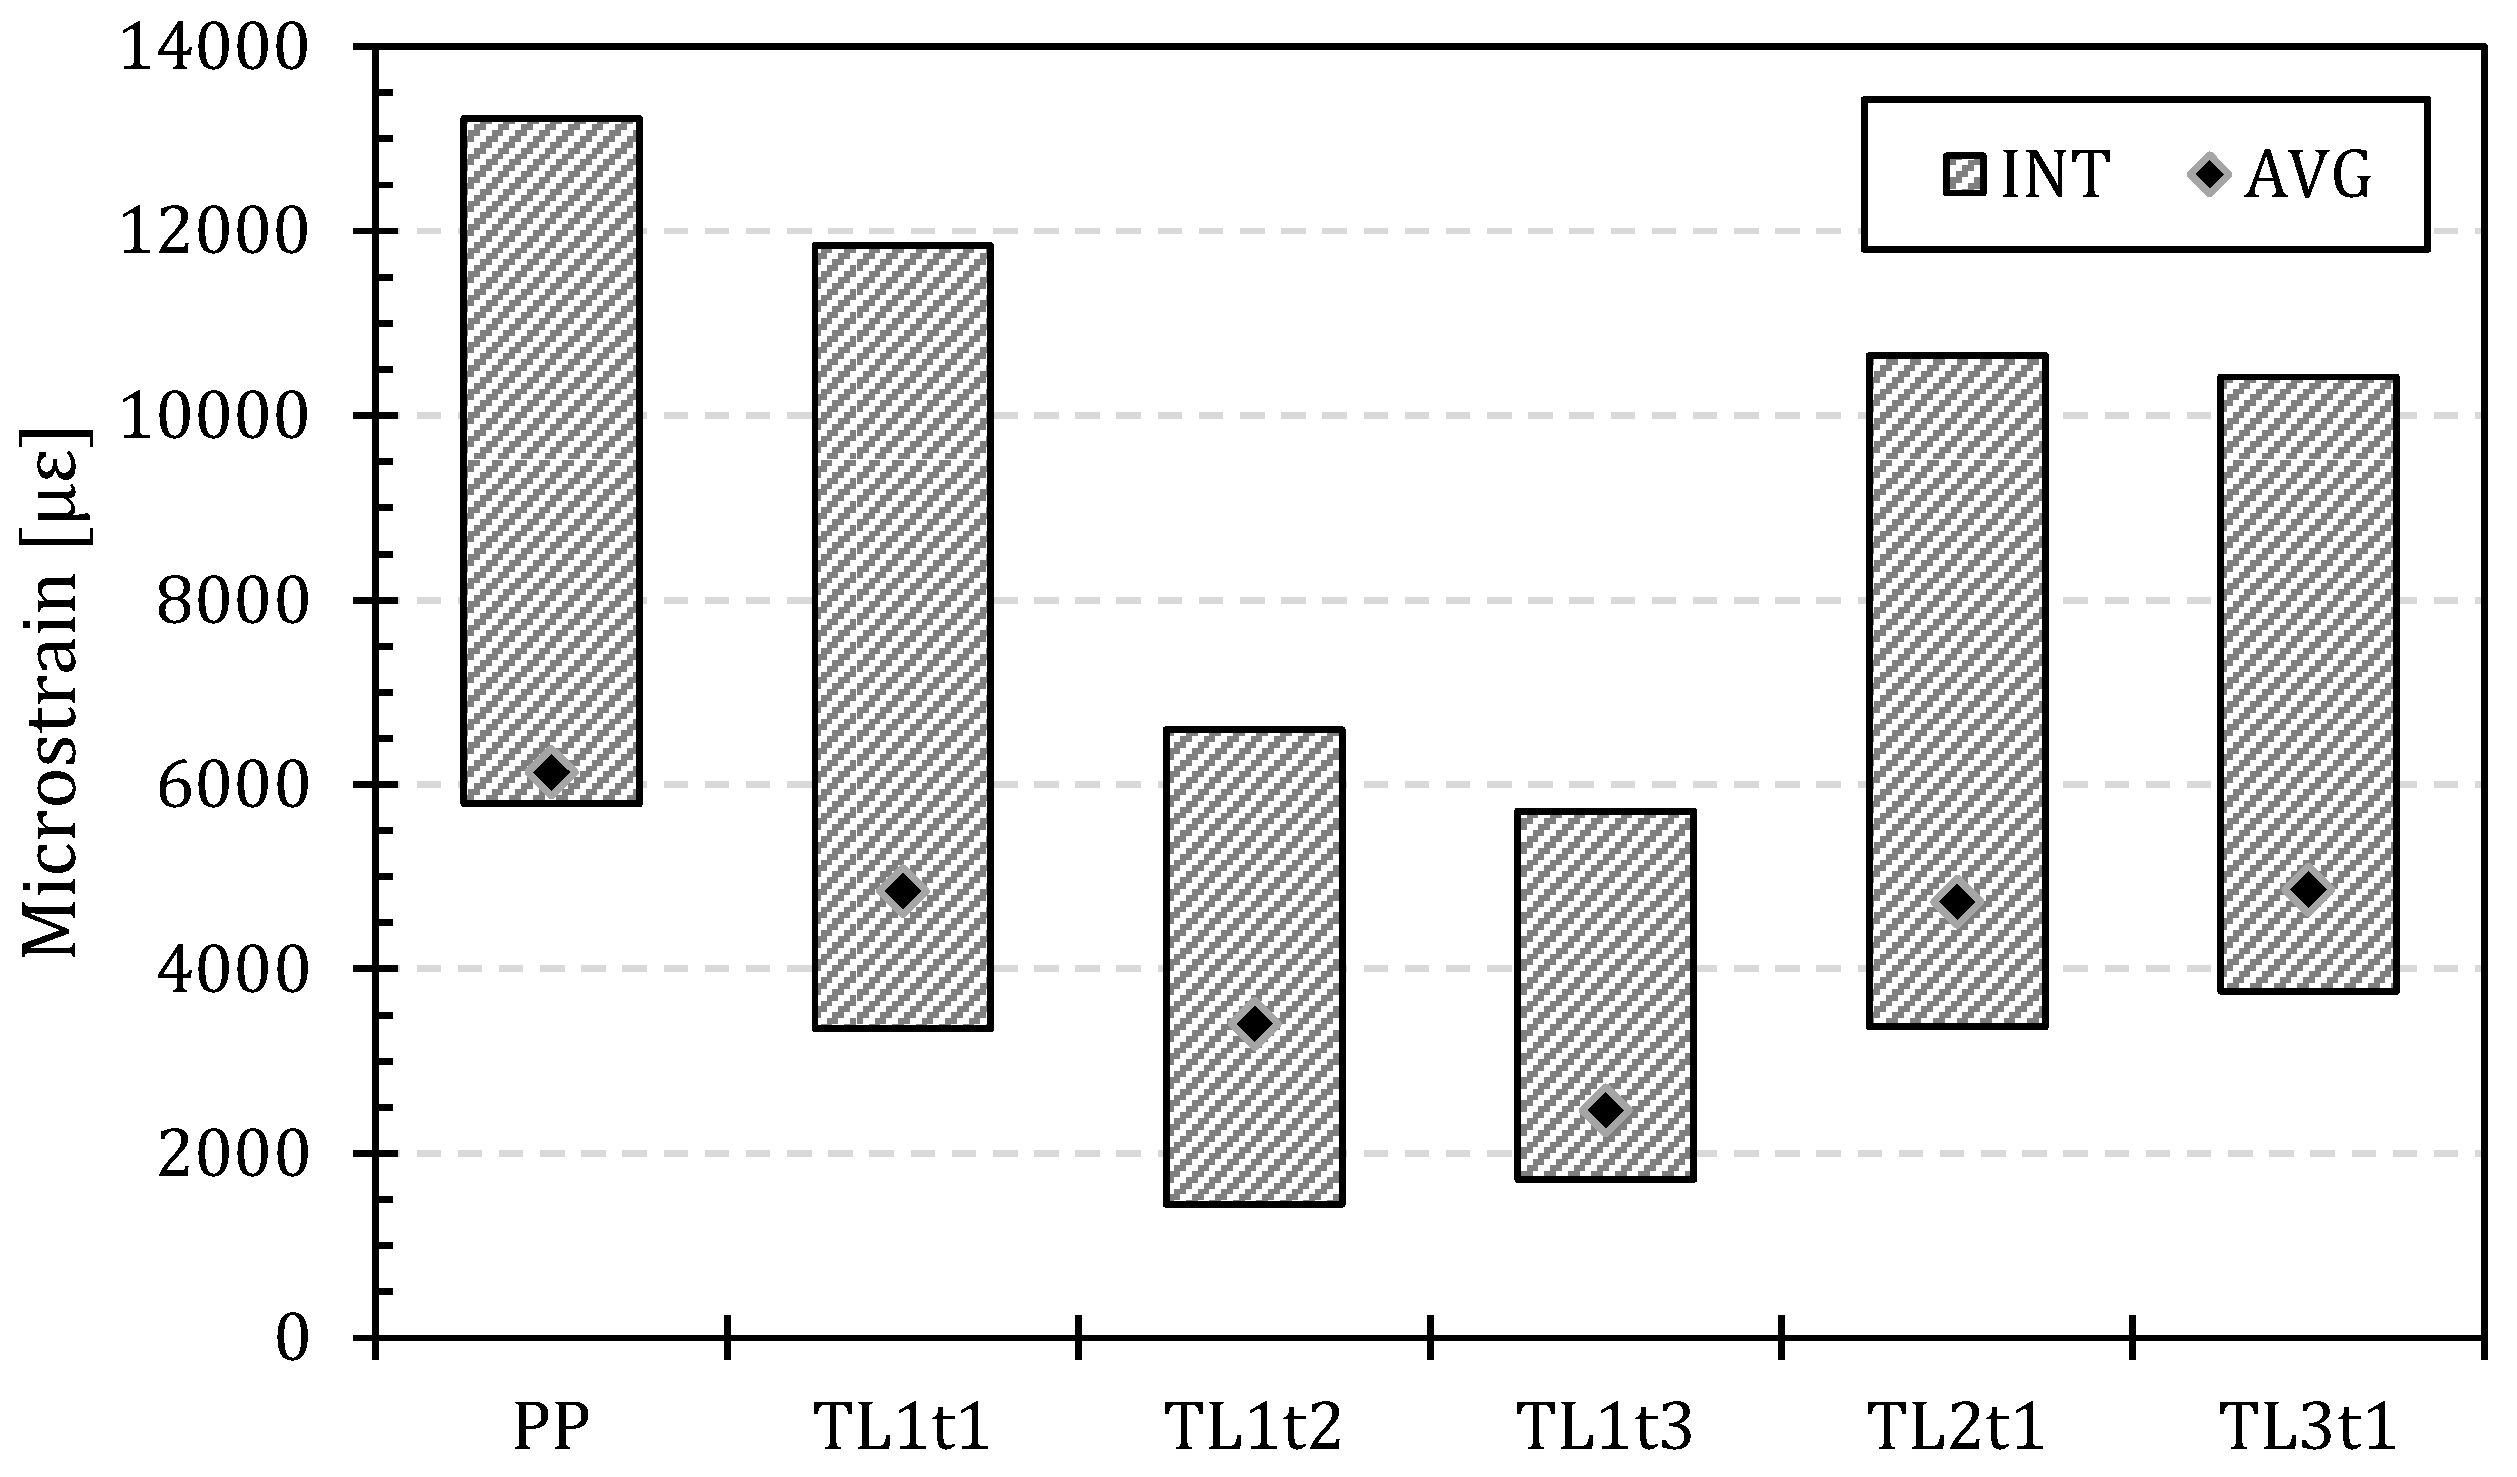
An overall summary of the average microstrain interval and average strain just before ultimate failure for the different specimen types is depicted in Figure 27. This reveals that PP specimens fail at the highest strain, while TL1t3 specimens fail at the lowest. Additionally, a decreasing trend is observed with increasing stack thickness in the TL1-type specimens. Furthermore, as previously established, TL2 and TL3 specimens fail at higher strains compared to TL1-type specimens with similar thickness and ply counts. Lastly, the scatter between the minimum and maximum strain is smaller for TL1t2 and TL1t3 specimens due to their lower strain at failure.

Figure 27.
Overall mean microstrain interval and average strain for the PP reference and the different types of TL specimens.
5.3. Comparison of Longitudinal and Transverse Tiled Laminates
Figure 28 illustrates the evolution in stiffness and LPF strength relative to those of a PP laminate with an increasing stacking angle in the TL, both in the longitudinal and transverse directions. These results are based on data from Section 5.1 and Section 5.2. In the graph, circles and squares represent the relative mechanical properties of the stiffness and strength, respectively, with white markers representing the tiling in the transverse direction and black markers representing the tiling in the longitudinal direction. Trend lines are included in the graph to show the trends in stiffness and strength for the different TL configurations.
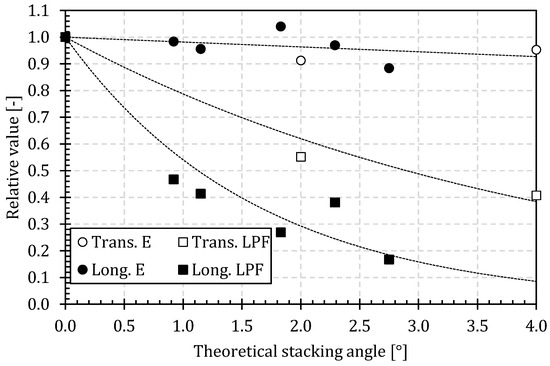
Figure 28.
Comparison between the stiffness (circle) and LPF strength (square) relative to a PP laminate for a tiled laminate in the longitudinal (black) and transverse (white) direction with trendlines (dotted lines).
From Figure 28, it can be inferred that the global stiffness decreases to a similar extent for longitudinal and transverse tiling. Here, the reduction in stiffness between a PP and a TL is relatively small, peaking at 10% for a stacking angle of 4°.
Regarding the strength, the LPF strength in the longitudinal direction, as previously established in Section 5.2, experiences a significant decline of over 70% at a stacking angle of 2°. Conversely, in the transverse direction, tiling results in a milder reduction in the LPF strength, with a decrease of approximately 45% compared to a PP laminate for a stacking angle of 2°. It can be concluded that the reduction in strength is less pronounced in the transverse direction than in the longitudinal direction, primarily because the strength in the former direction is already significantly reduced, from 459 MPa to 194 MPa for a PP laminate, due to the presence of numerous 90° plies.
However, since the design of this type of lightweight GFRP web–core sandwich panel bridges is mainly dominated by the serviceability limit state design requirements (i.e., stiffness) and not the strength of the individual components [25], this reduction in transverse LPF strength may be admissible, in view of its improved robustness claim. Indeed, the stiffness decrease in both tiling directions is limited, leaving TLs a possible candidate for use in GFRP bridges.
6. Conclusions
In this paper, the mechanical properties, including stiffness and strength, of different tiled laminates were examined. A first part involved the study of coupons extracted from the top and bottom flanges of the tiled web–core sandwich bridge deck panel. Here, microscopic imaging was performed to assess the laminate lay-up, total laminate thickness, and ply thicknesses in both the longitudinal and transverse span directions. This revealed that the top and bottom flanges consist of multi-ply stacks, featuring two 0°-plies, two ±45°-plies, and a single 90°-ply wrapped around PUR foam cores. The microscopic images also confirmed the tiled ply structure in the transverse direction and a plane parallel ply structure in the longitudinal direction. However, it is important to note that tiling in the transverse direction occurs only at the flange–web connection, where the plies from a single stack extend downward into the web, and a new ply stack is introduced at the top of the flange. In the area between two webs, the ply structure in the transverse direction is like that of a PP laminate, either with no stacking angle or with a minimal stacking angle of the plies relative to the top surface of the flanges.
In the second part, tiled laminates were manually fabricated with a tiling lay-up in both the longitudinal (strong x-direction) and transverse (weak y-direction) directions, based on the outcome of the microscopic imaging from the first part. Here, the mechanical properties and the influence of the stacking angle in the transverse and longitudinal directions were studied. Then, the difference between global and local stiffness in tiled laminates was demonstrated and the mechanical properties were compared to those of PP laminates with the same ply lay-up. TL specimens with varying stacking angles were created using different ply lay-up techniques, resulting in either a sharp transition between ply ends or a more gradual transition. It could be concluded that the global stiffness for the tiling in both the transverse as the longitudinal direction only marginally decreases. The strength at the last ply failure of the TLs in the longitudinal direction decreases significantly as the stacking angle increases, reaching a reduction of approximately 70% at a 2° stacking angle. As for tiling in the transverse direction, the decrease in last ply failure strength is less pronounced, amounting to a 45% reduction at a 2° stacking angle. The decrease in the Young’s-modulus is consistent with that observed for tiling in the longitudinal direction, with a maximum decrease of 10% at a 4° stacking angle. Given that tiling in a web–core sandwich bridge deck is always present in the transverse direction, the reduction in strength is acceptable, maintaining most of its stiffness. Indeed, the design of GFRP bridges is primarily influenced by serviceability criteria, i.e., by stiffness which experience only a modest decrease for both directions.
Regarding the failure behavior of tiled laminates, the accurate assembly of plies within thin laminates significantly impacts the stress distribution within the laminate itself. Additionally, due to the specific structure of tiled laminates, local out-of-plane rotation occurs at the overlap location. When a tensile force is applied, forces emerge in the transverse direction of the laminate at this location. Consequently, one of the plies of the TL detaches at the free edges, and the resulting crack propagates as a delamination between two stacks due to shear stresses. This phenomenon is analogous to what is observed in a single-lap joint loaded in tension. Strain/stress concentrations arising at the free ply edges can be mitigated by gradual ply ends.
This research initially centered on web–core sandwich bridge deck panels, yields valuable insights applicable to a broader spectrum of applications involving GFRP materials. The microscopic analysis provided essential information on laminate composition and structure, aiding material selection and design processes not only in civil engineering but also in aerospace, automotive, and other fields. This study’s findings on the impact of stacking angles on stiffness and strength offer practical knowledge for optimizing laminate lay-up techniques across diverse industries. Moreover, the importance of precise ply assembly and its implications for stress distribution and delamination mitigation extend the research’s relevance to various applications relying on GFRP composites, from aircraft components to wind turbine blades, enhancing overall reliability and efficiency.
Author Contributions
Conceptualization, J.U., W.D.C. and W.V.P.; methodology, J.U., W.D.C. and W.V.P.; software, J.U.; validation, W.D.C. and W.V.P.; formal analysis, J.U.; investigation, J.U.; resources, W.D.C. and W.V.P.; data curation, J.U., W.D.C. and W.V.P.; writing—original draft preparation, J.U.; writing—review and editing, J.U., W.D.C. and W.V.P.; visualization, J.U.; supervision, W.D.C. and W.V.P.; project administration, W.D.C. and W.V.P.; funding acquisition, J.U., W.D.C. and W.V.P. All authors have read and agreed to the published version of the manuscript.
Funding
This research was funded by the Strategic Basic Research Fellowship (1S50522N) of FWO–Flanders in collaboration with the host institution Ghent University.
Data Availability Statement
The datasets presented in this article are not readily available because the data are part of an ongoing study. Requests to access the datasets should be directed to Prof. Wouter De Corte (wouter.decorte@ugent.be).
Acknowledgments
This research was made possible by all the technical staff from the department of Structural Engineering and Building Materials and the department of Materials, Textiles and Chemical Engineering involved.
Conflicts of Interest
The authors declare no conflicts of interest. The funders had no role in the design of the study; in the collection, analyses, or interpretation of data; in the writing of the manuscript; or in the decision to publish the results.
References
- Kendall, D. Developments in FRP bridge design. Reinf. Plast. 2010, 54, 38–42. [Google Scholar] [CrossRef]
- Curran, P.N. Use of Fibre Reinforced Polymers in Bridge Construction. Bridge Eng. 2005, 158, 39. [Google Scholar] [CrossRef]
- Friberg, E.; Olsson, J. Application of Fibre Reinforced Polymer Materials in Road Bridges—General Requirements and Design Considerations. Master’s Thesis, Chalmers University of Technology, Göteborg, Sweden, 2014; p. 359. [Google Scholar]
- Nizam, E.H.; Das, S.C. Applications of Fiber Reinforced Polymer Composites (FRP) in Civil Engineering. Int. J. Adv. Struct. Geotech. Eng. 2014, 3, 299–309. [Google Scholar]
- Hollaway, L.C. A review of the present and future utilisation of FRP composites in the civil infrastructure with reference to their important in-service properties. Constr. Build. Mater. 2010, 24, 2419–2445. [Google Scholar] [CrossRef]
- Sonnenschein, R.; Gajdosova, K.; Holly, I. FRP Composites and their Using in the Construction of Bridges. Procedia Eng. 2016, 161, 477–482. [Google Scholar] [CrossRef]
- Valbona, M.; Haghani, R.; Harryson, P. Bridge decks of fibre reinforced polymer (FRP): A sustainable solution. Constr. Build. Mater. 2014, 50, 190–199. [Google Scholar] [CrossRef]
- Smits, J. Fiber-Reinforced Polymer Bridge Design in the Netherlands: Architectural Challenges toward Innovative, Sustainable, and Durable Bridges. Engineering 2016, 2, 518–527. [Google Scholar] [CrossRef]
- Veltkamp, M.; Peeters, J. Hybrid Bridge Structure Composed of Fibre Reinforced Polymers and steel. Struct. Eng. Int. 2014, 24, 425–427. [Google Scholar] [CrossRef]
- Kim, Y.J. State of the practice of FRP composites in highway bridges. Eng. Struct. 2019, 179, 1–8. [Google Scholar] [CrossRef]
- De Corte, W.; Uyttersprot, J.; Somers, R. FRP bridges in the Flanders region: Experiences from the C-bridge project. In Proceedings of the 10th International Conference on FRP Composites in Civil Engineering, Istanbul, Turkey, 8–10 December 2021. [Google Scholar]
- European Commission. Prospect for New Guidance in the Design of FRP; Publications Office of the European Union: Ispra, Italy, 2016. [Google Scholar]
- Van Der Steen, C. CUR96:2019 Vezelversterkte Kunststoffen in Bouwkundige en Civieltechnische Draagconstructies; CROW: Delft, The Netherlands, 2019; p. 196. (In Dutch) [Google Scholar]
- Mottram, J.T.; Henderson, J. Fibre-Reinforced Polymer Bridges—Guidance for Designers; CIRIA: London, UK, 2018. [Google Scholar]
- CEN/TS 19101:2022; Design of Fibre-Polymer Composite Structures. European Committee for Standardization: Brussels, Belgium, 2022.
- Invernizzi, S.; Montagnoli, F.; Carpinteri, A. Fatigue assessment of the collapsed XXth century cable-stayed polcevera bridge in genoa. Procedia Struct. Integr. 2019, 18, 237–244. [Google Scholar] [CrossRef]
- Tuwair, H.; Hopkins, M.; Volz, J.; ElGawady, M.A.; Mohamed, M.; Chandrashekhara, K.; Birman, V. Evaluation of sandwich panels with various polyurethane foam-cores and ribs. Compos. Part B Eng. 2015, 79, 262–276. [Google Scholar] [CrossRef]
- Liu, W.; Zhang, F.; Wang, L.; Qi, Y.; Zhou, D.; Su, B. Flexural performance of sandwich beams with lattice ribs and a functionally multilayered foam core. Compos. Struct. 2016, 152, 704–711. [Google Scholar] [CrossRef]
- De Corte, W.; Jansseune, A.; Van Paepegem, W.; Peeters, J. Structural behaviour and robustness assessment of an InfraCore® inside bridge deck specimen subjected to static and dynamic local loading. In Proceedings of the ICCM International Conferences on Composite Materials, Xi’an China, 20–25 August 2017. [Google Scholar]
- ASTM D3039; Standard Test Method for Tensile Properties of Polymer Matrix Composite Materials. American Society for Testing and Materials: West Conshohocken, PA, USA, 1995.
- McCormick, N.; Lord, J. Digital image correlation. Mater. Today 2010, 13, 52–54. [Google Scholar] [CrossRef]
- Pan, B.; Xie, H.; Wang, Z.; Qian, K.; Wang, Z. Study on subset size selection in digital image correlation for speckle patterns. Opt. Express 2008, 16, 7037. [Google Scholar] [CrossRef] [PubMed]
- Pan, B.; Li, K. A fast digital image correlation method for deformation measurement. Opt. Lasers Eng. 2011, 49, 841–847. [Google Scholar] [CrossRef]
- Lecompte, D.; Smits, A.; Bossuyt, S.; Sol, H.; Vantomme, J.; Van Hemelrijck, D.; Habraken, A.M. Quality assessment of speckle patterns for digital image correlation. Opt. Lasers Eng. 2006, 44, 1132–1145. [Google Scholar] [CrossRef]
- Uyttersprot, J.; De Corte, W.; Ingelbinck, B. Influence of SLS design requirements on the material consumption and self-weight of web-core sandwich panel FRP composite footbridges. Compos. Struct. 2021, 262, 18. [Google Scholar] [CrossRef]


Disclaimer/Publisher’s Note: The statements, opinions and data contained in all publications are solely those of the individual author(s) and contributor(s) and not of MDPI and/or the editor(s). MDPI and/or the editor(s) disclaim responsibility for any injury to people or property resulting from any ideas, methods, instructions or products referred to in the content. |
© 2024 by the authors. Licensee MDPI, Basel, Switzerland. This article is an open access article distributed under the terms and conditions of the Creative Commons Attribution (CC BY) license (https://creativecommons.org/licenses/by/4.0/).