Article

Modifying the Characteristics of the Electrical Arc Generated during Hot Switching by Reinforcing Silver and Copper Matrices with Carbon Nanotubes

Department of Materials Science and Engineering, Saarland University, Campus D3.3, 66123 Saarbrücken, Germany
*
Authors to whom correspondence should be addressed.
J. Compos. Sci. 2024, 8(7), 285; https://doi.org/10.3390/jcs8070285
Submission received: 12 June 2024 / Revised: 18 July 2024 / Accepted: 19 July 2024 / Published: 22 July 2024
(This article belongs to the Special Issue Metal Composites, Volume II)

Abstract

:
Switching elements are crucial components in electrical and electronic systems that undergo severe degradation due to the electrical arc that is generated during breaking. Understanding the behavior of the electrical arc and modifying its characteristics via proper electrode design can significantly improve durability while also promoting optimal performance, reliability, and safety in circuit breakers. This work evaluates the feasibility of carbon nanotube (CNT)-reinforced silver and copper metal matrix composites (MMCs) as switching electrodes and the influence of CNT concentration on the characteristics of the arcs generated. Accordingly, three different concentrations per MMC were manufactured via powder metallurgy. The MMCs and reference materials were subjected to a single break operation and the electrical arcs generated using 100 W and 200 W resistive loads were analyzed. The proposed MMCs displayed promising results for application in low-voltage switches. The addition of CNTs improved performance by maintaining the arc’s energy in the silver MMCs and reducing the arc’s energy in the copper MMCs. Moreover, a CNT concentration of at least 2 wt.% is required to prevent unstable arcs in both metallic matrices. Increased CNT content further promotes the splitting of the electrical arc due to a more complex phase distribution, thereby reducing the arc’s spatial energy density.

1. Introduction

Silver is widely used in circuit breakers and in low-voltage switches in air due to its outstanding electrical conductivity, as well as its low tendency towards welding. It is common practice to alloy or improve the performance of silver to further enhance its erosion resistance during arcing and to minimize its weldability in high-current applications, thus guaranteeing proper operation of the circuit breaker. However, the lifetime of silver switches is significantly reduced by electro-erosion, caused by ion and electron bombardment during arcing. Zinc, copper, nickel, and palladium are frequently utilized as an alloying element in switching applications in order to decrease electrode erosion. Other options involve creating silver composites with metal oxide materials, such as cadmium, zinc, tungsten, and tin oxide. These materials vary in their applicability, but are generally utilized in low-voltage direct current (LVDC) applications such as relays, switches, and protective components [1,2,3]. Due to its toxicity and associated health risks [4], silver-cadmium oxide is no longer utilized, with it predominantly being replaced by Ag/SnO2. However, while the addition of tin oxide increases the resistivity of the material, in-operando heat increments due to long-term use negatively impact the service life of this contact material [5]. As previously reported by Selzner et al. [6], the transport properties of Ag/SnO2 differ significantly between the affected area (after the first break operation) and the surrounding, unaffected area. This is attributed to a heterogenous distribution of silver, pores, and oxides within the area affected by the electrical arc. Moreover, the energy from the arc promotes the formation of layered tin oxide structures, which negatively impact the material’s conductivity. Furthermore, metal oxide content, particle size, and production processes influence the performance of the silver–tin oxide contact materials [7].
Pure copper also finds applicability in switching components due to its cost-effectiveness and good conductivity. However, copper electrodes are generally paired with silver-based materials to reduce the likelihood of welding. The performance of copper contacts is improved by coating them with tin, silver, etc., or by alloying them with other materials, such as cadmium, tin, chromium, tellurium, etc. [2]. In this manner, lower amounts of silver are required while still maintaining their switching characteristics [3].
Previous reports have studied the performance of graphite-containing silver switches [8,9,10,11,12]. These studies reported improved switching performance; however, due to the anisotropic properties of graphite, their performance is highly dependent on the relative orientation of the graphite reinforcement phase. The advantage of graphite-containing silver-based materials is not only that graphite reduces weldability, but also that it prevents the formation of non-conductive oxides on the metal’s surface [13]. However, the addition of graphite increases erosion in silver materials and the likelihood of arc reignition [13]. Likewise, graphite-containing copper contact materials have shown weld resistance due to arcing and have been found to have applications even for elevated switching currents [3,14]. However, copper-graphite contacts are primarily designed to operate in moving (i.e., rotating) contacts, such as brushes [15]. These composite materials show exceptional self-lubricating capabilities, with the carbonaceous tribofilm slowing down wear and corrosion. Furthermore, copper composites reinforced with graphene nanoplatelets have demonstrated enhanced arc erosion resistance, as reported by Shao et al. [16].
Moreover, carbon nanotube-containing metal matrix composites (MMCs) are not only a viable option for electrical contact materials in general [17,18], but also for use in switching applications [5,19]. Individual carbon nanotubes (CNTs) possess exceptional mechanical and transport properties [20,21,22,23,24,25], albeit the latter present high anisotropy. However, single CNTs are seldom found, but rather CNT agglomerates [26,27]. Therefore, CNT composite materials have the potential to incorporate the advantages of graphite-containing composites without this disadvantage and without incurring significant additional costs. Therefore, the main objective of this study is to evaluate both the feasibility of CNT-containing MMCs for switching applications and the influence that the reinforcement phase’s concentration has on the behavior of the electrical arc generated during hot switching. Accordingly, the characteristics of the arc generated during a single break operation will be analyzed and discussed.
It is important to understand the characteristics of the electrical arcs produced during hot switching, since this can provide abundant information on the circuit and on system efficiency, as well as provide insight into the breaker’s durability. It is well-established that LVDC switches (e.g., automotive contacts) operating under resistive loads produce arcs with durations that do not exceed 500 µs and arc lengths below 100 µm [28,29], whereas high inductances extend the duration (between 500 µs and 5 ms) and length (up to a few mm) of the arc [28]. Furthermore, arc duration (i.e., type of load) and the contact material used affect the erosion mechanism that takes place during arcing. Short arcs (i.e., resistive load) show an anode mass loss and cathode mass gain, whereas the opposite is true for long arcs (i.e., inductive loads) [28,30].
The mechanism behind arcing is schematically shown in Figure 1. As a load (F) is applied between the two electrodes, the topographic features of the surfaces meet, generating the a-spots whereby conduction takes place (Figure 1a). Upon reaching the contact interface, the current (I) constricts and flows through the asperities in contact, which locally heats up the asperities to reach a temperature (T) above the melting temperature (Tm) of the metal (Figure 1b). As the electrodes separate (at a certain velocity v), the molten metal is drawn by the moving electrode (Figure 1c), thus forming a bridge between them. As the electrodes continue to move apart from one another, the molten bridge is drawn out, becomes unstable, and ruptures due to a significant local increase in the current density (J), as shown in Figure 1d. The instability within the molten bridge is caused by the flow of colder material from the root of the bridge towards the hotter regions and the ejection of the bridge’s material due to temperatures exceeding the boiling temperature (Tb) of the metal [2]. The bridges’ explosion establishes the arc, releasing metallic vapor into the contact gap and considerably increasing the pressure (Figure 1e,f) [2]. As the metallic vapor expands into lower pressure regions, the pressure between the electrodes decreases and what is known as a pseudo arc is established, where ions conduct current. Since the opening operation does not occur under vacuum, the continued reduction in pressure causes the arc’s transition from a metallic phase to a gaseous phase due to the flow of atmospheric gases into the gap. In the gaseous phase, the current is conducted by electrons rather than by the ions.
The metallic vapor generated in the arc’s explosion is the cause for material transfer. In the initial stages of the arc’s ignition, anodic erosion occurs due to electron bombardment, while the cathode gains mass due to particle recombination and condensation on the cathode’s surface [30]. If the arc’s duration is sufficiently long, there is a transition period wherein the cathode undergoes mass loss due to ion bombardment [1]. This transition only depends on the duration and length of the arc, where the latter is the predominant parameter governing the direction of mass transfer [28]. During the anodic to cathodic arc transition, there is an instance where the material deposited on the cathode during the anodic loss stage is removed, thereby leading to net zero erosion [31]. The anodic to cathodic transition is arc length dependent, and does not depend on electrode material or arc duration. On the other hand, the point at which net zero erosion occurs depends on the amount of material transferred during the anode loss stage. Therefore, it is dependent on arc duration (i.e., circuit type) and electrode material [28]. Although the current flowing through the electrodes does not influence the arc type, it does increase the arc’s energy, which in turn delays net zero erosion.
Therefore, it is established that, irrespective of the current level that circulates through the joint, for an electrical arc to generate, material melting takes place within the contact spot [2,32]. This is because as the electrodes separate and F tends to zero, the real contact area between the electrodes also tends to zero. The reduction in the contact area results in a rise in the constriction resistance (Rc), as stated in Equation (1) [1,2]. H and ρ in Equation (1) are the contact material’s hardness and resistivity, respectively, whereas α is the radius of the real contact area, under the assumption that it is circular (known as the Holm radius), and η is a coefficient that describes the cleanliness of the contacts. The increased constriction resistance produces an increased voltage drop between the contacts (Vc), which in turn significantly increases the temperature at the contact spot (Tc)—this relationship is shown in Equation (2), where T0 is the ambient temperature. Therefore, the increased constriction resistance due to the breaking of the circuit will cause the melting temperature of the metals to be reached, thus generating molten bridges.
R c = ρ 2 α = ρ η π H 4 F
T c = T 0 2 + V c 2 × 10 7
The objective of this study is to gain a deeper understanding of the arc characteristics of established switching materials and compare them to the arc characteristics of CNT-reinforced, silver- and copper-based metal matrix composites produced via powder metallurgy, and to evaluate the influence of the reinforcement phase’s concentration on the behavior of the resulting arc [33,34]. This understanding will enable the appraisal of the proposed materials in terms of feasibility, applicability, and efficiency for LVDC circuits. Therefore, break operations (hot switching) were conducted on different reference samples and on the proposed MMCs. The arcs in question were generated using a purely resistive load (standard automotive halogen lamps) while performing a single break operation. Two different ohmic loads were evaluated—i.e., 100 and 200 W. Voltage, current, and power curves during arcing were measured and evaluated to obtain arc duration and energy. Furthermore, the electrical contact resistance (ECR) of the different material systems was determined directly prior to the arc’s ignition. Moreover, high-speed videos were captured during arcing in 200 W tests to observe the arcs’ ignition, the existence of unstable arcs, and to qualitatively assess arc mobility. In addition, quantitative image analysis was carried out to provide insight into the mechanisms that modify the behavior of the arc produced as a consequence of the reinforcement phase: namely, the heterogeneity of the reinforcement phase in the MMCs.

2. Materials and Methods

2.1. Composite Production & Materials Characterization

Silver and copper MMCs reinforced with multiwalled CNTs were produced via powder metallurgy at three different concentrations, namely, 1 wt.%, 2 wt.%, and 3 wt.%. The composition of the samples and the nomenclature used in this work are shown in Table 1. Since the metallic matrices have relatively similar densities (10.49 and 8.95 g/cm3 for silver and copper, respectively [2]), the difference in CNT content in vol.% and wt.% is marginal. Dendritic copper powder with a 325 mesh and 99% purity (Alfa Aesar GmbH, Berlin, Germany) and silver flakes with at least 80% of the flakes below 20 μm and a purity of 99.9% (Alfa Aesar GmbH, Berlin, Germany) were used as metallic matrices. The reinforcement phase used was chemical vapor deposition (CVD)-grown, multiwalled CNT (Graphene Supermarket, New York, NY, USA). The nanotubes have an outer diameter distribution between 50 and 85 nm, an as-received state length from 10 to 15 μm, and a carbon purity above 94%. To fully assess the performance of the proposed composite materials, different reference samples were also characterized—i.e., 0 wt.% sintered silver and copper samples, and high-purity samples (silver rod: 99.95% purity, Alfa Aesar GmbH, Berlin, Germany and copper rod: 99.9% purity, Goodfellow Cambridge Limited, Huntingdon, UK). The unreinforced, sintered samples (i.e., Ag 0% and Cu 0%) were included in the analysis in order to evaluate samples with similar hardness and mechanical properties while excluding the influence of the reinforcement phase. Furthermore, materials commonly used in hot switching applications were also characterized, namely: Ag/Ni 90/10, Ag/SnO2 88/12, Ag/SnO2 90/10, and Ag/SnO2 92/8 (Umicore N.V., Brussels, Belgium).
The metallic powder and the CNT were blended through colloidal mixing in ethylene glycol. After evaporating the solvent, disk-shaped (8 mm diameter) green pellets were produced by placing the mixed powders in a steel die and pressing at 990 MPa for 20–30 s. The green pellets were densified (achieving relative densities higher than 95%) via hot uniaxial pressing (HUP). The sintering temperature is crucial for achieving sufficient sample density [18], particularly for electrical applications. Suarez et al. have previously reported that the structural integrity of multiwalled CNTs is not compromised during high temperature sintering [35]. The authors showed that, for CNT content of up to 3 wt.%, sintering at 850 °C in vacuum improved the crystallinity of the CNT compared to their state after dispersion, due to thermal annealing processes which alleviated defects. Moreover, thermogravimetric analyses have demonstrated that multiwalled CNTs are more stable to oxidation during vacuum annealing than single-walled CNTs [36], while also improving graphitization due to the removal of metallic and metal oxide content stemming from the manufacturing process [37]. Accordingly, HUP was carried out at a temperature of 750 °C and a pressure of 264 MPa at high vacuum (2 × 10⁻⁶ mbar) to minimize oxidation of the samples. The copper MMCs were sintered for 2.5 h. The silver MMCs, on the other hand, required longer isothermal holding times to achieve sufficient densities. Silver samples sintered for 2.5 h did not surpass 90% relative density [38]. As a result of the higher degree of internal porosity in the green pellet prior to sintering, silver samples required an isothermal holding time of 7.5 h [39]. Further details on the preparation of the colloid and sample production can be found in [38,39].
The hardness of the sintered MMCs and reference materials was evaluated via micro-hardness measurements (Dura Scan 50 Micro-Hardness Tester, Struers Inc., Cleveland, OH, USA). A load of 0.098 N (HV0.01) was used to generate the imprint, holding the load for 15 s and optically micrographing the imprint using 40× magnification. At least 20 indentations were carried out per sample and averaged—results are shown in Table 2.

2.2. Hot Switching Tests

The electrical arc was generated by a breaking operation (hot switching) between the sample in question and a hard-gold-coated (AuCo0.2), silver–nickel core (AgNi0.15) rivet (Adam Bornbaum GmbH, Neuhausen, Germany). The counter electrode (rivet) has a hemispherical geometry, with a radius of curvature at its tip of 4 mm and a hardness value of 1.38 ± 0.01 GPa. Both electrodes were mounted on a custom testing rig and connected to a 3000 W direct current power source (Gossen Metrawatt SSP 3000-52, Nürnberg, Germany) [40]. An oscilloscope (LeCroy WaveRunner 6100A, New York, NY, USA) was used to acquire the voltage drop between the electrodes during breaking. The current before, during, and after breaking was measured using the same device via a LeCroy CP031 current probe [19]. Two ohmic loads were evaluated: 100 W and 200 W. The loads were changed by adding or subtracting automotive 50 W halogen lamps. At least three hot switching tests were carried out per ohmic load and sample under atmospheric conditions (i.e., 23 ± 1 °C and 23 ± 2% temperature and relative humidity, respectively). A new counter electrode was used for each test. Prior to hot switching, the rivets were cleaned using isopropanol-based contact cleaner and dried with compressed air. Furthermore, the current probe was degaussed between measurements. Prior to electrical characterization, the MMCs and reference samples were ground and polished, achieving a mirror-polished surface. The polished samples were micrographed via confocal laser scanning microscopy (CLSM—LEXT OLS4100, Olympus, Tokyo, Japan), acquiring a 3 × 3 stitching at 50× with an overlap of 20% to obtain a larger field of view with high resolution. The root mean square roughness Sq of the stitching was measured. The reference samples and MMCs achieved an Sq value between 0.3–0.6 µm, whereas the counter electrode presented a roughness value of 0.3 µm.
The composite and reference samples were mounted on a moving platform and connected to the positive terminals of the source and oscilloscope (anode), whereas the rivet remained static and was connected to the negative terminals of the source and oscilloscope (cathode). A normal load of 4 N was established between both electrodes, and a current stabilization time of 10 s passed prior to breaking the circuit. Subsequently, the circuit was opened by retreating the linear stage at a constant acceleration of 8000 mm/s2 and a top speed of 58 mm/s. Further information on the accuracy of this setup, as well as schematic representations thereof, was previously reported by Puyol et al. and Suarez et al. [19,40]. Video footage of the arc during the break operation was recorded with a high-speed camera (Photron, FASTCAM SA-Z, Tokyo, Japan) using a macro-lens (LAOWA, 100 mm f2.8 2:1 Ultra Macro APO, Hefei, China), a 2:1 magnification ratio, and a frame rate of 210,000 frames per second. The field of vision was 2.5 mm × 1.0 mm with a resolution of 284 × 160 pixels, resulting in a pixel size of 6.5 µm.

2.3. Heterogeneity Analysis

To assess the heterogeneity of the silver and copper MMCs, a detailed analysis of the near neighbor distance (nnd) for each sample was conducted. The micrographs acquired with the CLSM of each sample were first binarized using Gaussian blur filtering and thresholding operation in ImageJ, and later subjected to particle analysis. This process allowed for the identification and measurement of the centroids of each particle in each image [41]. Using the centroid coordinates, the pairwise Euclidean distances between all particles were then calculated. For each particle, the smallest distance from one particle to another was recorded as its nnd. Considering the magnification and resolution of the image acquisition, all pixelated particles having an area below 0.8 µm2 (corresponding to 2 pixels) were excluded from the analysis.
Based on the skewness present in the raw data, it was assumed that the particle sizes and near neighbor distances were log-normally distributed [42]. Moreover, the coefficient of variation (COV) was introduced to quantify the heterogeneity of the CNT distribution based on the log-normal distribution of the nnd [43,44]. The standard deviation (σIn) of the log-normal distribution of the nnd was calculated and used to determine the COV using Equation (3). It is worth noting that a higher COV value corresponds to more heterogeneous particle distributions. Furthermore, the average size and area fraction of the particles in each sample were determined to further characterize the dispersion and distribution of the reinforcement phase.
C O V = e σ I n 2 1

3. Results and Discussions

Assessment of the proposed reinforced materials is crucial in order to fully understand their viability as contact materials for LVDC relays, contactors, and other switching applications. Accordingly, the focus of this study is to carry out an in-depth analysis of the arc’s characteristics for arcs generated by a single break operation with a resistive load of 200 W, as well as the influence that CNT concentration has on the characteristics of the arc generated. Resistive loads of 100 W generated arcs with similar behavior and tendencies to those generated with 200 W—further information on 100 W tests can be found in the Supplementary Information (Figures S1 and S2 and Table S1).

3.1. ECR Prior to Arcing

The ECR before electrode separation (i.e., prior to arcing) can be directly obtained from the current and voltage curves (using Ohm’s law). The average ECR value for each material prior to arcing at 200 W is shown in Table 2. The reference materials exhibit varying ECR values, ranging from approximately 2.5 mΩ to 6 mΩ, with the latter corresponding to Ag/Ni. As expected, the resistance of Ag/SnO2 increases alongside the tin oxide content. Among the materials tested, the silver MMC exhibited the lowest ECR value despite the addition of CNT. Similar to Ag/SnO2, the ECR tends to slightly increase with increasing CNT content. The resistance values of copper MMCs vary considerably depending on the content of CNT. This is because of the heterogeneous distribution of CNTs within the copper composite (further discussed in Section 3.4) [18,38,39]. The chemical incompatibility between copper and carbon causes CNTs to re-agglomerate during the production process. As a result, larger CNT clusters are found on the surface of copper MMCs compared to silver MMCs; this phenomenon is more prevalent in copper MMCs with lower CNT concentrations. Furthermore, it is important to consider the potential heterogeneity in material hardness caused by inhomogeneous CNT distribution, which could result in variations in ECR values depending on the area where the measurements were taken. However, in general, the resistance values fall within the range of the reference materials. Therefore, based solely on the ECR, copper MMCs are a viable material that should perform similarly to silver–nickel alloys and silver–tin oxide composites.
Table 2. ECR and hardness values of the reference and composite materials. ECR values were calculated prior to electrode separation for 200 W tests.
SampleECR/mΩHardness/MPa
Ag Rod1.36 ± 0.32847 ± 61
Ag 0%1.65 ± 0.36470 ± 49
Ag 1%1.79 ± 0.53505 ± 37
Ag 2%1.94 ± 0.27369 ± 54
Ag 3%2.13 ± 0.73408 ± 61
Cu Rod6.86 ± 2.791335 ± 82
Cu 0%3.59 ± 0.86650 ± 70
Cu 1%2.66 ± 0.06619 ± 88
Cu 2%2.73 ± 0.55555 ± 81
Cu 3%6.80 ± 0.28512 ± 87
Ag/Ni 90/105.75 ± 1.14615 ± 89
Ag/SnO2 92/82.93 ± 0.47728 ± 42
Ag/SnO2 90/102.63 ± 0.66757 ± 58
Ag/SnO2 88/124.57 ± 0.92820 ± 46
According to Holm, the spreading resistance of an isotropic material—i.e., the ideal resistance directly under the contact interface due to the spreading of the current within the conductor—is half that of the constriction resistance [1,45], as shown in Equation (4). Using the ECR values measured prior to arcing and the hardness values from Table 2 and Equation (1), the resistivity and the Holm radius of the contacting electrodes can be determined. These two parameters can then be used to determine the spreading resistance of the materials in question via Equation (4). The Holm radius of the contact as well as the resistivity and spreading resistance of the samples are shown in Table 3.
R s = ρ 4 α
The results from these numerical calculations correlate with the expectations generated from the MMC samples and reference samples. Since the hardness of the rod samples is higher than that of the sintered samples, the resulting Holm radius is smaller, thereby resulting in higher resistivity and resistances, whereas in the MMCs the rise in CNT concentration leads to a marginal rise in resistivity and spreading resistance. However, apart from Cu 3%, the increment in spreading resistance is negligible, representing a 0.17 mΩ increment between Ag 1% and Ag 3% for similar Holm radii. Likewise, the addition of tin oxide increases the samples’ hardness, which in turn reduces the Holm radii, thereby leading to higher resistances.

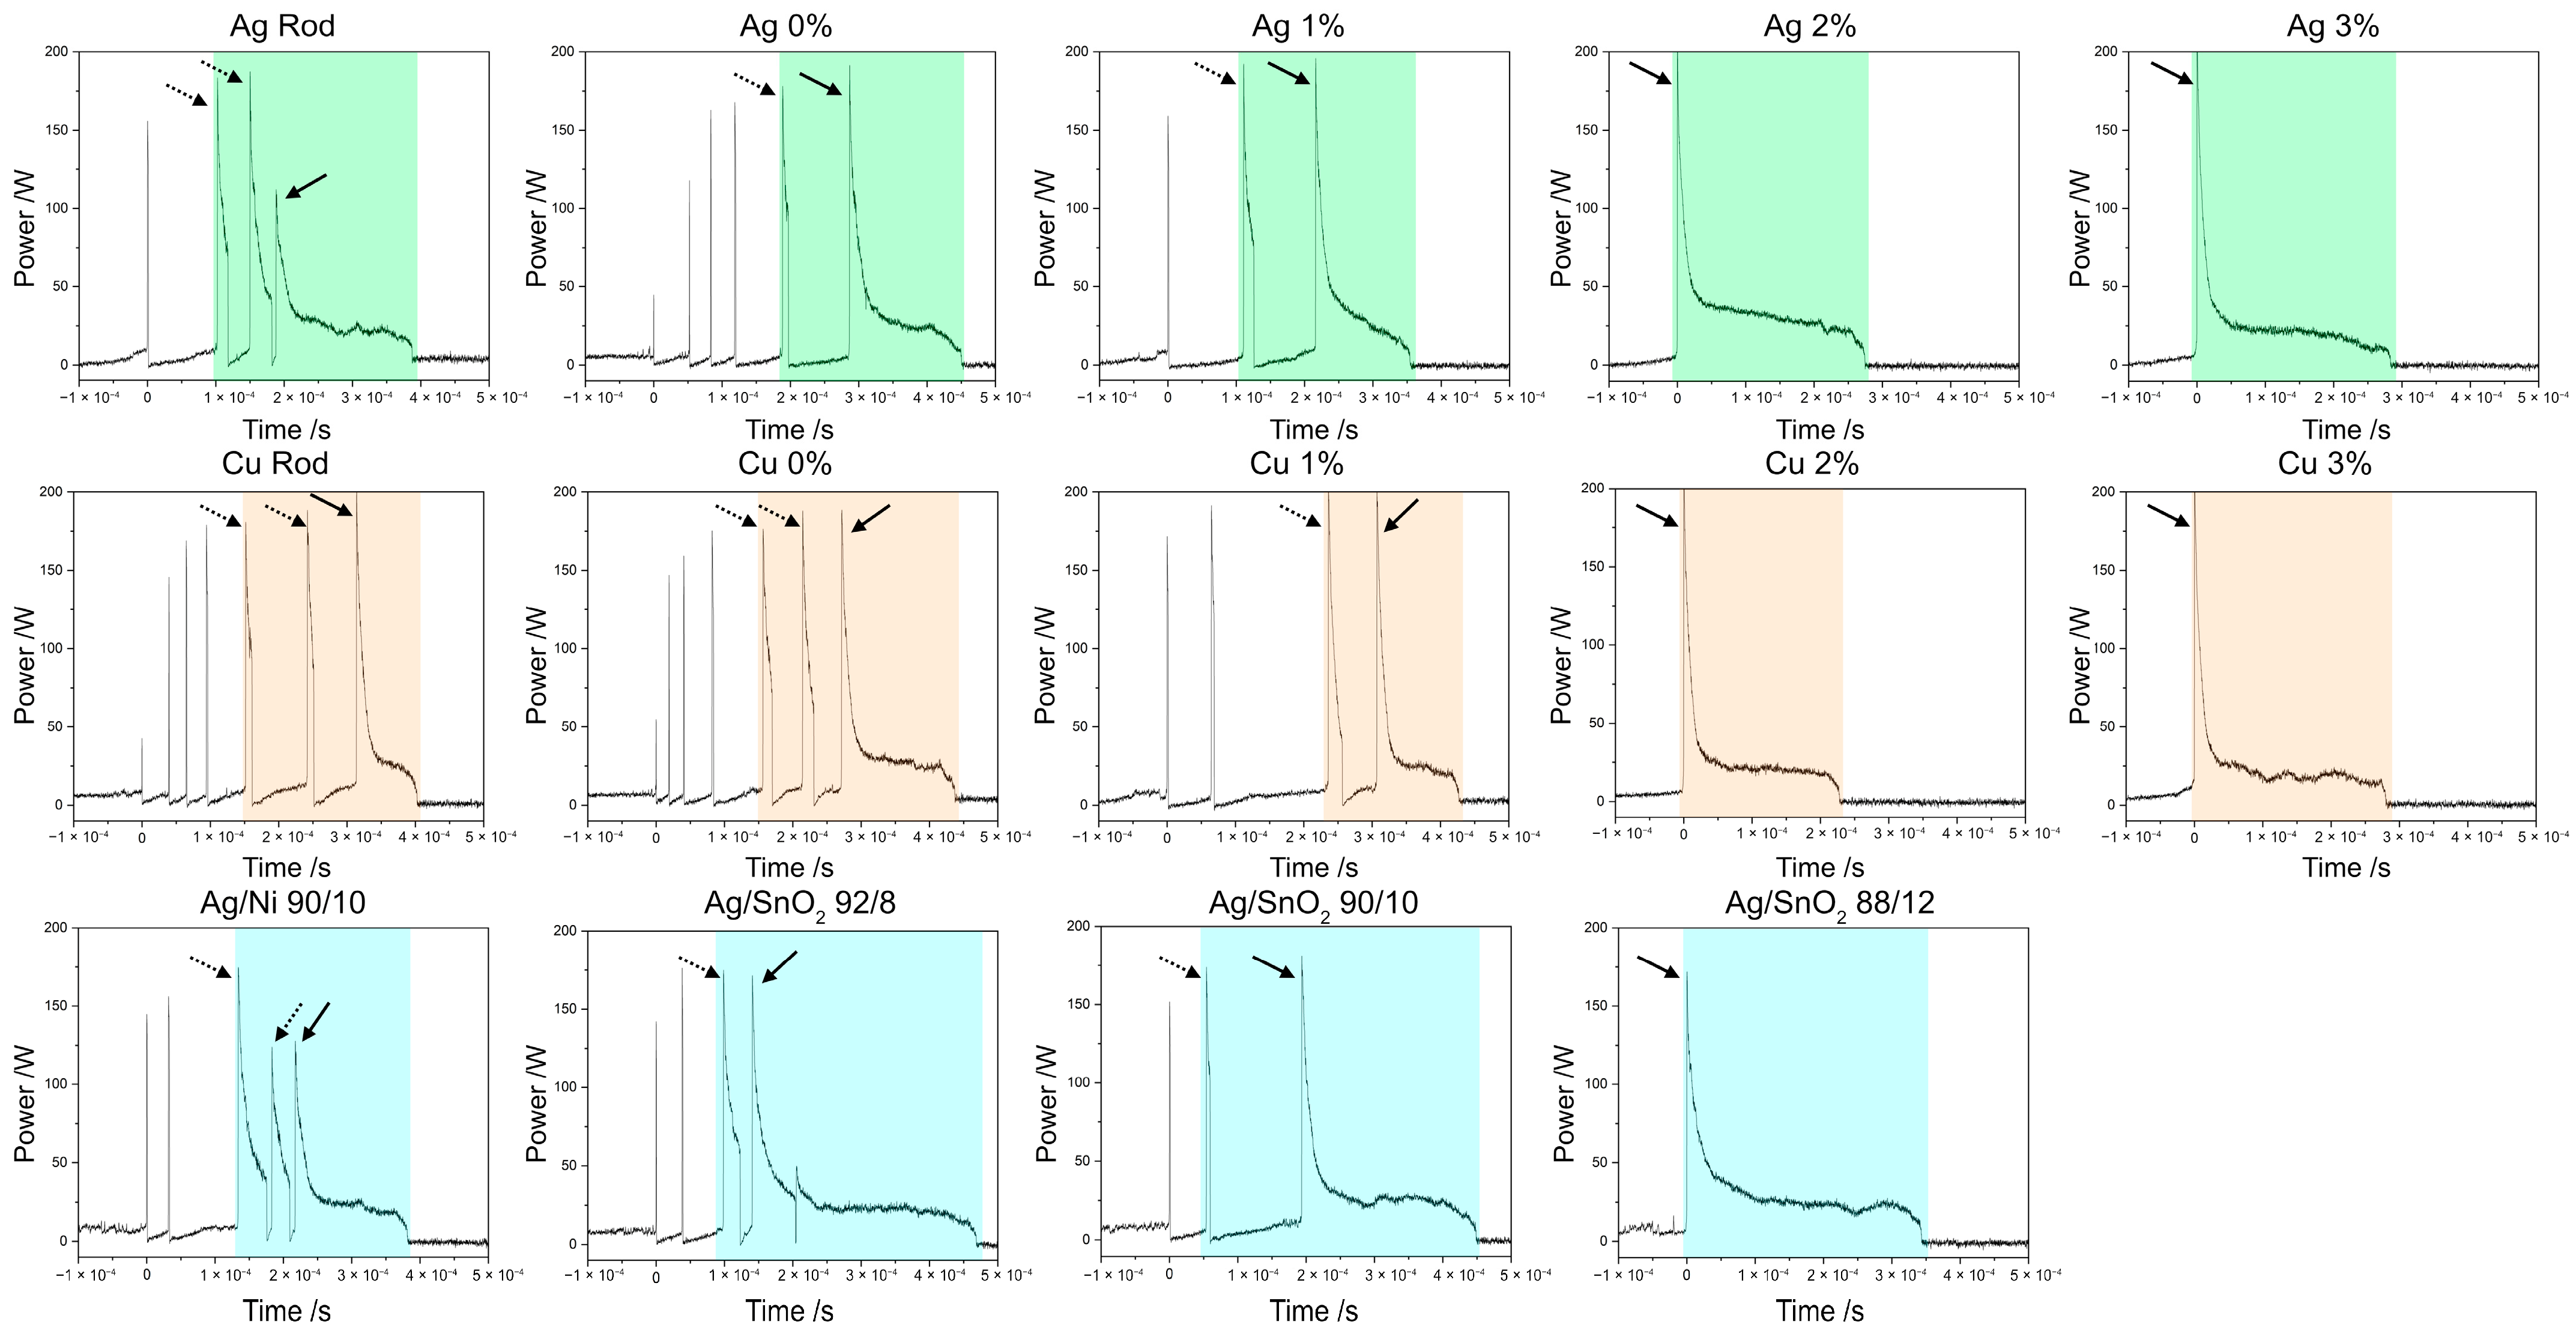
3.2. Arc Characterization

The current and voltage curves prior to, during, and after the arc’s extinction for all the materials tested are shown in Figure 2. Since the tests were conducted using direct current, the power curves can be directly obtained by multiplying the contact voltage and current, as shown in Figure 3. As the figures depict, the high purity samples, unreinforced sintered samples, and most reference materials show reduction peaks in the current flow and spikes in the voltage and the power curves (as indicated by the arrows in Figure 3). However, this was not observed in the 2% and 3% reinforced samples, nor in the Ag/SnO2 88/12 sample. To determine the duration and energy of the arcs accurately and systematically, the arc’s initiation was defined as the point when the current flow dropped by at least 20% of the nominal value. For the 200 W tests, the nominal current was approximately 17 A, whereas for the 100 W tests the nominal current was approximately 9 A. The durations and energy values over which the arc was considered are highlighted by the shaded areas in Figure 2 and Figure 3. Table 4 shows the values for the 200 W tests, whereas the results for 100 W are shown in Table S1.
During the ignition of the arc, the voltage curves show fluctuations that could be attributed to the variable contact of the inter-electrode molten bridges. The heat generated at these sites causes localized melting of the materials due to increased current constriction, which produces inconsistent voltage values. As the voltage and current curves in Figure 2 highlight, the MMCs with higher CNT concentrations produce more stable voltage curves. On the other hand, samples with lower CNT content possess variable voltage curves. In this case, the voltage curve while the arc is ignited tends to increase until the nominal voltage of 13.5 V is reached and the arc is extinguished (highlighted by the arrows in Figure 2). The more stable voltage curves during arcing in the MMCs could therefore be associated with fewer melting points in the contact due to the improved thermal conductivity of the contact material. As shown in Figure 2, the voltage curve for Ag 2% still shows an increasing trend during the arc; however, this is not the case with Cu 2%. This behavior could be attributed to the lower melting voltage of silver (0.37 V) compared to that of copper and gold, both of which have a melting voltage of 0.43 V [1,2]. These fluctuations could also be linked to the sublimation of the CNTs, which in turn causes the release of adsorbed gases and a non-conductive metal vapor (stemming from the explosion of the metallic bridge) in the vicinity of the electrodes, thereby locally increasing the pressure between the two surfaces [2,19]. Furthermore, the slope of the voltage curves while the main arc is ignited can provide information on the arc’s phase. The curve’s slope transitioning from a shallower slope to a steeper slope suggests the transition from a metallic ion phase to a gaseous ion phase [31]. Observing Figure 2, it is clear that lower CNT content promotes a longer gaseous arc phase. Therefore, the CNTs show the potential to minimize the ingress of gaseous ions within the electrode gap, which can consequently reduce gaseous ion erosion. The same behavior was observed for the 100 W tests (see Figure S1).
By observing the arc characteristics of the reference materials in Table 4, a clear distinction can be made between silver–tin oxide and silver–nickel contact materials. However, all values fall within the range reported by Ben Jemaa et al. for resistive loads [28,29]. The arc duration and energy levels of silver–tin oxide reference materials remain relatively constant regardless of the tin oxide content. In all three cases, the arc is extinguished within 400 µs, and the arc’s energy does not exceed 13 mJ. However, the silver–nickel alloy, on the other hand, presents a shorter arc duration (below 300 µs) and a lower energy input (below 10 mJ).
The results in Table 4 for silver samples do not exceed those observed for the references. In other words, the mean duration of the arc is not greater than that of the silver–tin oxide and silver–nickel samples. However, the arc duration tends to increase as the concentration of the reinforcement phase increases. Nevertheless, the increase in arc duration is marginal, typically in the range of 60 µs in the 2% and 3% reinforced silver samples. In contrast, the copper samples exhibit the opposite behavior. As the CNT concentration increases, the duration of the arc shortens, with a reduction of approximately 70 µs.
Regarding the energy input, the copper samples had the lowest amount of energy. The unreinforced copper samples performed similarly to the silver and reference samples. However, when CNTs were incorporated into the copper samples, a significant reduction in arc energy was observed (as well as in arc duration), resulting in the lowest arc energy among all evaluated samples. In contrast, the reinforced silver samples did not show a reduction in arc energy and had values that matched those of the reference materials. Therefore, the reinforcement phase has a stronger impact on the characteristics of the arc in copper electrodes.
The hot switching tests at 100 W (Table S1) showed similar performance. The arc duration in the reference materials did not exceed 350 µs, with a maximum mean energy of approximately 4 mJ. The silver samples exhibited slightly shorter arc durations, with a maximum duration of approximately 230 µs, corresponding to the high-purity (rod) silver sample and the 3% sample. As with the 200 W tests, higher CNT concentrations tended to increase arc duration in silver MMCs. The energy of the arc in the silver samples did not exceed the values of the reference materials, which ranged from 2.3 to 3.5 mJ. Copper samples in the 100 W tests showed moderately consistent results. The mean duration of the arc was approximately 240 µs for all samples. However, as with the 200 W tests, the lowest arc energy was observed in the copper samples with higher CNT content. Both the 2% and 3% reinforced copper MMCs showed arc energy values below 3 mJ. In both hot switching tests (i.e., 100 W and 200 W), the samples with the highest content of CNT also presented the highest standard deviation. However, this is due to the heterogeneous distribution of CNTs within the metallic matrix [17,39].
The spikes in current, voltage, and power observed prior to the proper ignition of the arc considered in this study (highlighted by the arrows in Figure 3) are not characteristic of a break operation. Instead, they resemble the bouncing phenomenon commonly seen in make operations. These spikes are short-lived and do not tend to decrease over time, as is the case with bouncing. On the contrary, these signal perturbations tend to exhibit a greater reduction in current flow (resulting in an increase in voltage and power signals) as the tests progress. It is hypothesized that the voltage and current spikes are caused by the extinction of smaller unstable arcs that occur during the initial stages of the breaking operation before the main arc is established. As these signal disruptions were not observed for all materials, it was of interest to observe the evolution of the electrical arc during break operations using a high-speed camera to better understand these perturbations.

3.3. High-Speed Footage

The high-speed video footage correlates with the voltage and current curves recorded during arcing (example for Cu 1% shown in Figure 4). High-speed camera videos for all samples can be found at https://doi.org/10.5281/zenodo.10838984 (accessed on 19 March 2024). As initially observed in Figure 2 and Figure 3, the videos highlight that most reference samples and unreinforced silver and copper samples show a larger tendency towards the establishment of unstable arcs. Unstable arcs are defined as small, short-lived electrical arcs that are established prior to the ignition of the main arc. These arcs can be identified as the small spikes in the current, the voltage, and the power curves (see Figure 2 and Figure 3). Unstable arcs ignite and are extinguished in a matter of tens of µs, whereas the main arcs last for several hundred µs (see Table 4). The dashed arrows in the power curves (Figure 3) point out the presence of unstable arcs, which were considered in the arc characteristics, whereas the solid arrows highlight the ignition of the main arc.
Unstable arcs ignite earlier in samples with low or no CNT content. In other words, as the CNT content increases in the MMCs, the ignition of unstable arcs takes place closer to the ignition of the main arc. For sufficiently high CNT content (namely 3%), the ignition of unstable arcs is avoided altogether, similar to the Ag/SnO2 88/12 sample. It is important to report that 2% samples in particular show variable results. In other words, unstable arcs were observed in one out of the three tests carried out at 100 W and 200 W. Therefore, it seems that 2% CNT content is the lower limit required to eliminate unstable arcs from taking place, with higher concentrations not showing unstable arcs throughout all tests. However, the 2% curves presented in Figure 2 and Figure 3 do not include curves where unstable arcing took place, as they were not fully representative of the general results.
The Cu 1% sample (exhibited in Figure 4) is a prime example of unstable arcing in MMCs with low CNT content. These unstable arcs initially marginally reduce the nominal current (as is the case in snapshot A). As the breaking operation progresses, the nominal current briefly decreases more markedly (B and C) until the main arc is ignited (D). These current reductions prior to the ignition of the main arc last a few tens of µs, followed by the extinction of the unstable arcs and the current approaching the nominal value. In this example, the unstable arcs shown in A, B, and C last for approximately 25, 45, and 50 µs. Snapshot C depicts the extinction of this unstable arc and the corresponding plume generated. Snapshot D exhibits the ignition of the main arc, with E, F, and G showing snapshots at different moments in the main arc’s duration.
The reference and unreinforced samples exhibit significant arc motion and small plumes. In particular, the Ag/Ni samples display multiple short, unstable arcs that gradually become longer until the main arc is established. On the other hand, the Ag/SnO2 samples exhibit significantly steadier arcs compared to Ag/Ni. The higher mobility in Ag/Ni samples is attributed to the higher work function of nickel (4.7–5.2 eV) compared to that of tin (3.6–4.1 eV) [2]. The addition of CNTs to the MMCs results in a confinement-effect of the electrical arc, reducing its mobility. It is important to note that this is a qualitative analysis and the degree to which CNT concentrations affect arc mobility cannot be discussed based solely on the high-speed video footage. However, the video footage confirms that the CNT clusters on the MMCs’ surfaces hinder the arc’s mobility. This is supported by the observation that electrical arcs on copper MMCs tend to show more mobility than those on silver MMCs. The effectiveness of CNTs in copper MMCs for confining the arc is not as high as in silver MMCs due to its less homogeneous CNT distribution (further discussed in Section 3.4).
Moreover, the work function of the materials in question can impact the behavior of the arcs. In other words, low work function will favor a steady and localized arc since it is easier to extract an electron from said material—as is the case with Ag/SnO2. The higher work function of copper (4.5 eV) compared to that of silver (4.2 eV to 4.5 eV) [2], coupled with its more heterogeneous phase distribution, explains the higher mobility of the arc in copper MMCs, with previous studies from Guo et al. reporting that CNT content increases the work function of copper MMCs [47], thereby further increasing arc mobility. In the proposed MMCs, the arc is more easily established between the metallic matrices and the counter electrode rather than between the reinforcement phase and the counter electrode. This is due to their higher electrical conductivity and to the higher work function of the multiwalled CNTs (4.95 eV and 5.05 eV for multiwalled and single-walled CNTs [48], respectively) used to produce the MMCs. The CNT-reinforced samples exhibit large plumes being expelled as arcing takes place. This behavior could be caused by two mechanisms, which are not mutually exclusive. The first mechanism is the increased material removal rate when adding CNTs, similarly to when adding graphite into these metallic matrices [8]. Furthermore, the large plumes observed are due to CNT sublimation, which increases local pressure. As the high-pressure regions expand to lower-pressure regions (i.e., the plume observed) it leads to material ejection, and it aids in arc extinction. It is worth noting that the plumes and metallic bridge explosions appear to be more severe in copper samples, both in the main arc and in unstable arcs. Compared to silver-based materials, unstable arcs occur more frequently and last longer in copper samples, resulting in more severe explosions. This is due to copper’s poorer resistance to welding and lower thermal conductivity compared to silver.

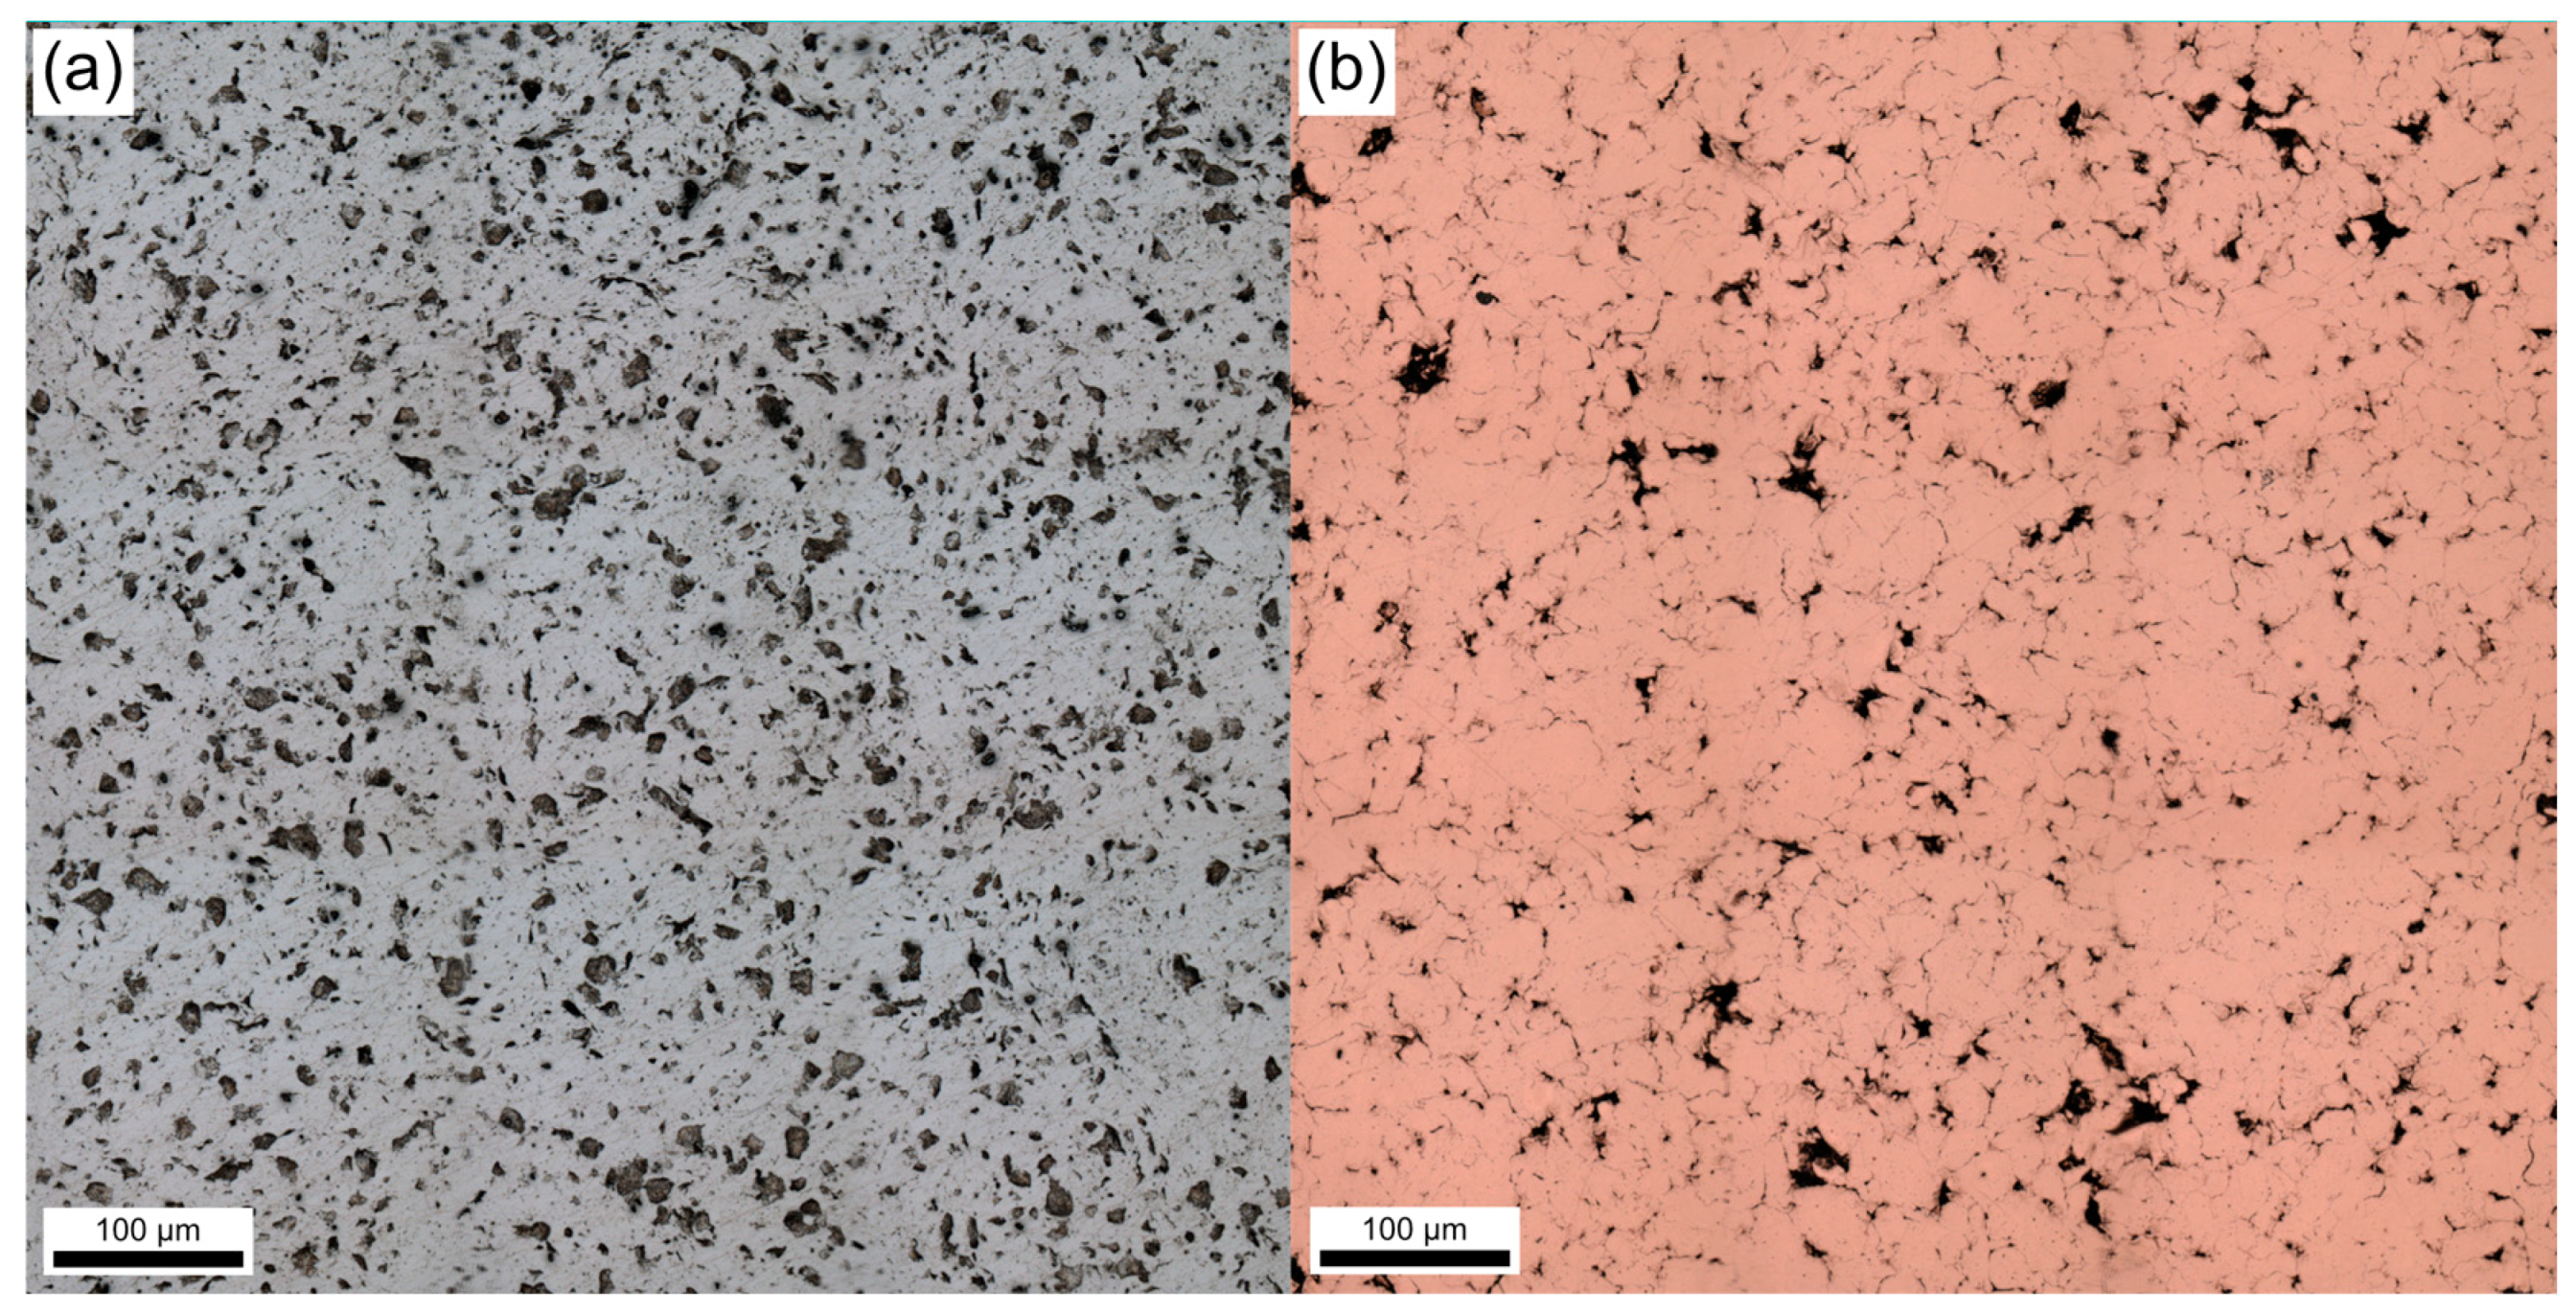
3.4. Reinforcement Phase Distribution

Due to the complexity of the systems herein analyzed, multiple mechanisms can explain the observed behavior of the aforementioned materials. These mechanisms are not mutually exclusive; therefore, a combination of these mechanisms can justify the performance of Ag 2%, Ag 3%, Cu 2%, and Cu 3%. One possible explanation for the absence of unstable arcing in the high concentration samples is their relative softness compared to purer samples. In softer materials, the contact area at 4 N is larger, which increases the potential area in which an arc can be established between the electrodes due to a larger number of asperities establishing electrical contact—this is corroborated by the larger Holm radius presented in Table 3. However, the difference in hardness between material types is minor, therefore it is unlikely that this is the sole cause of the lack of unstable arcing in MMCs containing higher amounts of CNTs. Additionally, the Ag/SnO2 88/12 sample is harder than the other silver–tin oxide samples and does not exhibit unstable arcing. It is probable that the unstable arcing occurs due to the explosion of smaller contact bridges as the electrodes separate. The contacts experience significant localized heating due to high currents flowing through the electrodes and the increased current density flowing through certain metallic bridges. This causes melting and the subsequent explosion of the bridges. This phenomenon is hindered in the reinforced sample due to the CNT content, which increases the thermal diffusivity of the material. Improved thermal characteristics have two benefits. Firstly, they eliminate or minimize unstable arcing in favor of a main arc with longer duration, and, secondly, they reduce the likelihood of welding, thereby ensuring optimal switching.
The incorporation of CNTs into silver and copper matrices results in a varied phase distribution, depending on the concentration of the reinforcement phase. An example of the CNT distribution produced is shown in Figure 5, which illustrates the heterogeneity of the CNT in the Ag 3% and Cu 3% samples. Micrographs of Ag 1%, Ag 2%, Cu 1%, and Cu 2% can be found in the Supplementary Information (Figure S3). A quantitative analysis of the micrographs was conducted to describe the distribution of the reinforcement phase and its heterogeneity as a function of CNT concentration, shown in Table 5. Initial calculations revealed that the COV for the nnd was above 100%, indicating significant variability, likely due to the presence of outliers. These outliers were eliminated from the dataset as described in Appendix A.
The characteristics of the arc generated will depend heavily on the distribution, agglomerate size, and area fraction of CNTs that the electrode encounters on the MMCs’ surfaces. Therefore, these parameters were determined using micrographs of the polished MMCs’ surfaces. The 3 × 3 stitching corresponds to a square area of approximately 0.45 mm2, which is a considerably larger area than the contact area and crater area. The largest crater generated due to the arc during the break operation among the samples herein analyzed had an approximate diameter of 240 µm. Overestimating the diameter to 300 µm, this corresponds to an affected area of approximately 0.07 mm2. This estimation is over 6 times smaller than the area used to analyze phase distribution and heterogeneity. Furthermore, it must be considered that this estimation is the affected area, which is expected to be considerably larger than the apparent contact area between the rivet and the MMC samples.
The parameters determined are summarized in Table 5. Logically, size and area fraction of CNT increases as the concentration increases. This indicates that higher CNT concentrations lead to larger and more widespread particle distribution within the matrices. It is of particular interest to note that both the particle size and area fraction increase at a lower rate in the copper MMCs compared to the silver MMCs. The difference between the area fraction in the 1% samples is approximately 1/2, whereas 2% and 3% copper MMCs show approximately 1/3 the area fraction of the silver MMCs. This is due to the clustering of the CNTs in the copper MMCs. As evidenced in Figure 5 and Figure S3, the surfaces of the copper MMCs present large CNT bundles and regions with minimal amounts of CNTs. The micrographs of the silver samples, on the other hand, show a more homogeneous distribution without the presence of large clusters. The increasing average size and area fraction with higher CNT concentrations indicates a more extensive and uniform coverage of the reinforcement phase within the silver matrix, contributing to the observed improvements in homogeneity. Therefore, the descriptive statistics correlate with the micrographs acquired (see Figure 5 and Figure S3). The comparison between the silver and copper MMCs at equivalent CNT concentrations suggests that silver facilitates better dispersion and distribution of the CNTs, although the dispersion process during manufacturing is identical [18,38,39,49].
The COV values for both copper and silver MMC samples show a decreasing trend with increasing reinforcement phase concentrations. Specifically, the COV for the silver and copper samples decreases from 0.49 to 0.41 and from 0.53 to 0.47 for 1% and 3% silver and copper MMCs, respectively. This indicates that the particle distribution becomes more homogeneous as the CNT concentration increases. Nonetheless, for equivalent concentrations, the silver MMCs exhibit slightly lower COV values compared to the copper MMCs. Therefore, a more uniform particle distribution within the silver matrix is achieved. The behavior suggests that the reinforcement phase exhibits greater affinity towards silver matrices as opposed to copper matrices. CNTs have a high affinity towards agglomeration as a result of Van der Waals interactions (primarily π-π interactions) [26,27]. Prior to mixing the metallic powders, large CNT agglomerates are broken down via shear mixing and ultrasonication [38,39]; however, the mechanical stress during ultrasonication can severely damage the structural integrity of the CNTs [49,50]. Consequently, prolonging the dispersion process for copper MMCs could prove counterproductive, since this would increase the reinforcement phase’s structural damage. After dispersion, and during the manufacturing process, CNTs tend to re-agglomerate to a higher extent when using copper metallic powder as opposed to silver, favoring re-agglomeration rather than copper-CNT entanglement, thereby leading to larger CNT clusters in the former.
The relative nnd frequency distribution and rug plots for both the silver- and copper-based MMCs exhibit a clear trend of increasing homogeneity with higher CNT concentrations (Figure 6a,b). For both matrices, the nnd distribution becomes narrower and more peaked as the CNT concentration increases, indicating a more uniform particle distribution. The cumulative distribution plot, shown in Figure 6c, further supports these observations. The 3% samples exhibit the steepest rise, indicating the highest homogeneity, followed by the 2% and then the 1% samples. This trend was observed irrespective of the metallic matrix. Nonetheless, the silver MMCs exhibit slightly lower standard deviation values compared to the copper MMCs for identical CNT concentrations. These findings demonstrate that higher CNT concentrations enhance the homogeneity of the composites, with silver matrices achieving better dispersion and uniformity compared to the copper matrices under similar conditions.
The complex phase distribution of the CNTs in the MMCs promotes the splitting of the main arc, which reduces the arc’s spatial energy density. This is favorable since a reduction in the arc’s energy density could reduce the area affected by it, thus potentially reducing erosion severity during switching. Furthermore, splitting the electrical arc could prevent the formation of unstable arcs by igniting the main arc over a larger area from the initial stages of the break operation. The CNTs dispersed throughout the surface act as bifurcating elements, causing the electrical arc to split onto different spots on the MMCs’ surfaces. As the electrodes separate, some smaller arcs (belonging to the main arc) may be extinguished while others remain. Therefore, the CNT-reinforced samples exhibited longer, continuous main arcs. Additionally, the CNT clusters on the surface minimize arc wandering, confining the motion of the arc to a specific region on the MMC’s surface where smaller clusters are located.
The lack of unstable arcing in the MMCs with higher CNT concentrations may also be explained by the elastic characteristics of the reinforcement phase. The CNTs exhibit outstanding elastic restitutive behavior [51,52,53], which could result in a conductive bridge between the electrodes remaining during the initial stages of the breaking operation, specifically between the counter electrode and the elastic CNTs. Thus, the current is constricted and continues to flow through the clusters of CNTs instead of producing the electrical arc. Once the separation between the electrodes is sufficiently high, the main arc is generated without the ignition of unstable arcs (as observed in samples with low or no CNT concentrations).

4. Conclusions

CNT-reinforced silver and copper MMCs were produced via powder metallurgy. These samples and reference silver and copper were subjected, along with well-established reference materials, to DC hot switching tests, and the characteristics of the arcs are herein reported. From this work, the main conclusions are the following:
  • All composite materials proposed performed similarly to the reference materials. The copper MMCs have the shortest arc duration and lowest arc energy among the materials herein evaluated.
  • 2 wt.% CNT content is the lower limit to avoid unstable arcing. These MMCs showed unstable arcing one-third of the time, whereas unstable arcing was not observed for samples with 3 wt.% CNT.
  • Increased CNT content confines the arcs, thus reducing its mobility. This effect is more significant in silver MMCs due to a more homogeneous distribution of the CNTs. Heterogeneity on the copper MMCs’ surfaces—produced by large CNT clusters—favors arc wandering.
  • The results shown highlight that although copper MMCs present higher resistance values, their arcing performance is comparable to silver-based materials. Therefore, in applications where low ECR is not crucial and atmospheric conditions allow it, copper MMCs are a low-cost option for switching contact materials, thereby reducing the demand for precious metals.
These results demonstrate the feasibility of CNT-based silver and copper MMCs for LVDC switching applications based on the characteristics of the electrical arcs produced. Future work should be carried out to evaluate the rate of material transfer and removal during arcing, as well as crater morphology and the degree to which the CNTs endured the electrical arc. Further evaluations of the heat generated and of dissipation are of significant importance for an in-depth understanding of the influence of CNTs on the MMCs’ molten pools and on the weld resistance provided.

Supplementary Materials

The following supporting information can be downloaded at: https://www.mdpi.com/article/10.3390/jcs8070285/s1. Figure S1: Current and voltage curves for reference and reinforced samples during 100 W hot switching tests. The shaded region highlights the time considered for the arc’s characteristics. The arrows highlight the tendency of the voltage curve during the arc’s duration. These plots show the most representative curves based on the average arc duration and energy; Figure S2: Power curves for reference and reinforced samples during 100 W hot switching tests. The shaded region highlights the time considered for the arc’s characteristics. The arrows point out the power spikes that were considered within the arc duration calculations. Dashed arrows point out the unstable arcs, whereas solid arrows highlight the main arc. These plots show the most representative curves based on the average arc duration and energy; Table S1: Arc characteristics of reference and reinforced samples for tests carried out at 100 W; Figure S3: 3 × 3 stitching at 50× optical micrographs of (a) Ag 1%, (b) Cu 1%, (c) Ag 2%, and (d) Cu 2% obtained via CLSM.

Author Contributions

Conceptualization, B.A. and S.S.; Methodology, B.A., C.S., U.P.N. and S.S.; Validation, B.A.; Formal Analysis, B.A.; Investigation, B.A.; Resources, F.M.; Data Curation, B.A. and U.P.N.; Writing—Original Draft, B.A.; Writing—Review and Edition, C.S., U.P.N. and S.S.; Visualization, B.A.; Supervision, S.S.; Project Administration, F.M. and S.S.; Funding Acquisition, F.M. and S.S. All authors have read and agreed to the published version of the manuscript.

Funding

This research received funding from Deutsche Forschungsgemeinschaft (DFG), project number 426339194 and the State of Saarland from the European Regional Development Fund in the Mat-Innovat (“Kreislauffähige Materialsysteme für innovatives Hochleistungswerkstoffe”) project.

Data Availability Statement

Data available upon reasonable request from the corresponding authors. High-speed camera footage can be found at https://doi.org/10.5281/zenodo.10838984 (accessed on 19 March 2024).

Acknowledgments

B. Alderete wishes to acknowledge the support from the German Academic Exchange Service (DAAD) and the Roberto Rocca Education Program (RREP). The authors wish to acknowledge funding from Deutsche Forschungsgemeinschaft (DFG), project number 426339194. The authors gratefully acknowledge funding in the Mat-Innovat (“Kreislauffähige Materialsysteme für innovatives Hochleistungswerkstoffe”) project, supported by the State of Saarland from the European Regional Development Fund (Europäischen Fonds für Regionale Entwicklung, EFRE).

Conflicts of Interest

The authors declare no conflicts of interest.

Appendix A

The interquartile range (IQR) method was applied to identify and remove outliers. This involved calculating the first quartile (Q1) and third quartile (Q3) of the nnd. Outliers were defined and removed following Equations (A1) and (A2), obtaining the lower (OLL) and upper limit (OUL) for outliers, respectively. The removal of these outliers refined the nnd values obtained.
O L L = Q 1 1.5 I Q R
O U L = Q 3 + 1.5 I Q R

References

  1. Holm, R. Electric Contacts; Springer: Berlin/Heidelberg, Germany, 1967. [Google Scholar]
  2. Slade, P.G. Electrical Contacts: Principles and Applications; CRC Press: Boca Raton, FL, USA, 2014. [Google Scholar]
  3. Braunovic, M.; Konchits, V.V.; Myshkin, N.K. Electrical Contacts: Fundamentals, Applications and Technology; CRC Press: Boca Raton, FL, USA, 2017. [Google Scholar]
  4. Genchi, G.; Sinicropi, M.S.; Lauria, G.; Carocci, A.; Catalano, A. The Effects of Cadmium Toxicity. Int. J. Environ. Res. Public Health 2020, 17, 3782. [Google Scholar] [CrossRef] [PubMed]
  5. Li, A.; Xie, M.; Yang, Y.; Zhang, J.; Wang, S.; Chen, Y.; Zhou, W. Effect of CNTs content on the mechanical and arc-erosion performance of Ag-CNTs composites. Diam. Relat. Mater. 2022, 128, 109211. [Google Scholar] [CrossRef]
  6. Selzner, C.; Mücklich, F. New microstructure investigations of arc damaged silver/tinoxide electrodes by means of FIB-technique. In Proceedings of the 27th International Conference on Electrical Contacts, Dresden, Germany, 22–26 June 2014; pp. 1–5. [Google Scholar]
  7. Rohberg, J.; Honig, T.; Witulski, N.; Finkbeiner, M.; Behrens, V. Performance of Different Silver/Tin Oxide Contact Materials for Applications in Low Voltage Circuit Breakers. In Proceedings of the 2009 55th IEEE Holm Conference on Electrical Contacts, Vancouver, BC, Canada, 14–16 September 2009; pp. 189–196. [Google Scholar] [CrossRef]
  8. Behrens, V.; Honig, T.; Kraus, A.; Mahle, E.; Michal, R.; Saeger, K.E. Test results of different silver/graphite contact materials in regard to applications in circuit breakers. In Electrical Contacts—1995, Proceedings of the Forty-First IEEE Holm Conference on Electrical Contacts, Montreal, QC, Canada, 2–4 October 1995; IEEE: Piscataway, NJ, USA, 1995; pp. 393–397. [Google Scholar] [CrossRef]
  9. Michal, R.; Saegar, K.E. Metallurgical aspects of silver-based contact materials for air-break switching devices for power engineering. IEEE Trans. Compon. Hybrids Manuf. Technol. 1989, 12, 71–81. [Google Scholar] [CrossRef]
  10. Wingert, P.; Bevington, R.; Horn, G. The effect of graphite additions on the performance of silver-nickel contacts. In Proceedings of the Thirty-Sixth IEEE Conference on Electrical Contacts, and the Fifteenth International Conference on Electrical Contacts, Montreal, QC, Canada, 20–24 August 1990; pp. 524–529. [Google Scholar] [CrossRef]
  11. Shobert, E. Carbon, Graphite, and Contacts. IEEE Trans. Parts Hybrids Packaging 1976, 12, 62–74. [Google Scholar] [CrossRef]
  12. Jiang, P.; Li, F.; Wang, Y. Effect of different types of carbon on microstructure and arcing behavior of Ag/C contact materials. IEEE Trans. Compon. Packag. Technol. 2006, 29, 420–423. [Google Scholar] [CrossRef]
  13. Wingert, P.C. The effects of interrupting elevated currents on the erosion and structure of silver-graphite. In Electrical Contacts—1996, Proceedings of the Forty-Second IEEE Holm Conference on Electrical Contacts, Joint with the 18th International Conference on Electrical Contacts, Chicago, IL, USA, 16–20 September 1996; IEEE: Piscataway, NJ, USA, 1996; pp. 60–69. [Google Scholar] [CrossRef]
  14. Xie, W.; Wu, G.; Yang, Z.; She, P.; Wang, H.; Zuo, H.; Wei, W.; Gao, G.; Tu, C. Study on the erosion characteristics of copper-carbon electrode pairs by DC air arc. High Volt. 2021, 6, 674–683. [Google Scholar] [CrossRef]
  15. Sawa, K.; Ueno, T.; Nakano, K. Evaluation of Arc Erosion of Cu-graphite Brush Used in Small DC Motors with and without Quenching Device. In Proceedings of the 2020 IEEE 66th Holm Conference on Electrical Contacts and Intensive Course (HLM), San Antonio, TX, USA, 30 September–7 October 2020; pp. 170–175. [Google Scholar] [CrossRef]
  16. Shao, G.; Liu, P.; Li, W.; Chen, X.; Ma, F.; Liu, X.; Zhou, H.; Zhang, K. Effects of graphene nanoplates on arc erosion resistance and wear behavior under electric current of copper matrix composites. J. Alloys Compd. 2020, 829, 154356. [Google Scholar] [CrossRef]
  17. Suarez, S.; Alderete, B.; Puyol, R.; Mücklich, F. Load-dependent electrical contact resistance of carbon nanotube-reinforced metal matrix composites. In Proceedings of the 2022 IEEE 67th Holm Conference on Electrical Contacts (HLM), Tampa, FL, USA, 23–26 October 2022; pp. 1–6. [Google Scholar] [CrossRef]
  18. García, D.; Suárez, S.; Aristizábal, K.; Mücklich, F. Powder-Metallurgical Fabrication and Electrical Contact Resistance Characterization of Copper–Nickel Composites Reinforced by Multiwalled Carbon Nanotubes. Adv. Eng. Mater. 2022, 24, 2100755. [Google Scholar] [CrossRef]
  19. Suarez, S.; Puyol, R.; Schafer, C.; Mucklich, F. Carbon Nanotube-reinforced Metal Matrix Composites as Novel Electrodes for Low-voltage Switching Applications: A Surface Degradation Analysis. In Proceedings of the 2019 IEEE Holm Conference on Electrical Contacts, Milwaukee, WI, USA, 14–18 September 2019; pp. 135–141. [Google Scholar] [CrossRef]
  20. Dresselhaus, M.S.; Dresselhaus, G.; Saito, R. Physics of carbon nanotubes. Carbon 1995, 33, 883–891. [Google Scholar] [CrossRef]
  21. Saito, R.; Dresselhaus, G.; Dresselhaus, M.S. Physical Properties of Carbon Nanotubes; Imperial College Press: London, UK, 1998. [Google Scholar]
  22. Saifuddin, N.; Raziah, A.Z.; Junizah, A.R. Carbon Nanotubes: A Review on Structure and Their Interaction with Proteins. J. Chem. 2013, 2013, 676815. [Google Scholar] [CrossRef]
  23. Popov, V.N. Carbon nanotubes: Properties and application. Mater. Sci. Eng. R Rep. 2004, 43, 61–102. [Google Scholar] [CrossRef]
  24. Ebbesen, T.W. Carbon Nanotubes. Annu. Rev. Mater. Sci. 1994, 24, 235–264. [Google Scholar] [CrossRef]
  25. Maiti, A.; Svizhenko, A.; Anantram, M.P. Electronic Transport through Carbon Nanotubes: Effects of Structural Deformation and Tube Chirality. Phys. Rev. Lett. 2002, 88, 126805. [Google Scholar] [CrossRef] [PubMed]
  26. Pérez, E.M.; Martín, N. π–π interactions in carbon nanostructures. Chem. Soc. Rev. 2015, 44, 6425–6433. [Google Scholar] [CrossRef] [PubMed]
  27. Klinovaja, J.; Schmidt, M.J.; Braunecker, B.; Loss, D. Carbon nanotubes in electric and magnetic fields. Phys. Rev. B 2011, 84, 085452. [Google Scholar] [CrossRef]
  28. Ben Jemaa, N.; Morin, L.; Benhenda, S.; Nedelec, L. Anodic to cathodic arc transition according to break arc lengthening. IEEE Trans. Compon. Packag. Manuf. Technol. Part A 2005, 21, 599–603. [Google Scholar] [CrossRef]
  29. Ben Jemaa, N.; Nedelec, L.; Benhenda, S. Break arc duration and contact erosion in automotive application. IEEE Trans. Compon. Packag. Manuf. Technol. Part A 1996, 19, 82–86. [Google Scholar] [CrossRef]
  30. Jemaa, N.; Nedelec, L.; Benhenda, S.; Neveu, J. Anodic and cathodic erosion of Ag, Ag alloys and Ag-MeO contact materials in energy range below 10 joules. In Electrical Contacts—1996, Forty-Second IEEE Holm Conference on Electrical Contacts, Joint with the 18th International Conference on Electrical Contacts, Chicago, IL, USA, 16–20 September 1996; IEEE: Piscataway, NJ, USA, 1996; pp. 70–74. [Google Scholar]
  31. Swingler, J.; McBride, J. The net zero erosion phenomena on opening switching contacts with AC loading. In Electrical Contacts—1997, Forty-Third IEEE Holm Conference on Electrical Contacts, Philadelphia, PA, USA, 20–22 October 1997; IEEE: Piscataway, NJ, USA, 1997; pp. 238–245. [Google Scholar] [CrossRef]
  32. Braunovic, M. Effect of connection design on the contact resistance of high power overlapping bolted joints. IEEE Trans. Compon. Packag. Technol. 2002, 25, 642–650. [Google Scholar] [CrossRef]
  33. Feng, Y.; Yuan, H.L.; Zhang, M. Fabrication and properties of silver-matrix composites reinforced by carbon nanotubes. Mater. Charact. 2005, 55, 211–218. [Google Scholar] [CrossRef]
  34. Silvestre, N. State-of-the-art Review on Carbon Nanotube Reinforced Metal Matrix Composites. Int. J. Compos. Mater. 2013, 3, 28–44. [Google Scholar] [CrossRef]
  35. Suarez, S.; Lasserre, F.; Prat, O.; Mücklich, F. Processing and interfacial reaction evaluation in MWCNT/Ni composites. Phys. Status Solidi (a) 2014, 211, 1555–1561. [Google Scholar] [CrossRef]
  36. Singh, D.K.; Iyer, P.K.; Giri, P.K. Diameter dependence of oxidative stability in multiwalled carbon nanotubes: Role of defects and effect of vacuum annealing. J. Appl. Phys. 2010, 108, 084313. [Google Scholar] [CrossRef]
  37. Huang, W.; Wang, Y.; Luo, G.; Wei, F. 99.9% purity multi-walled carbon nanotubes by vacuum high-temperature annealing. Carbon 2003, 41, 2585–2590. [Google Scholar] [CrossRef]
  38. Alderete, B.; Suarez, S.; Mücklich, F. On the Production & Tribo-Electrical Characterization of Carbon Nanotube-Reinforced Ag & Cu Metal Matrix Composites. In Proceedings of the 2023 IEEE 68th Holm Conference on Electrical Contacts (HOLM), Seattle, WA, USA, 4–11 October 2023; pp. 1–8. [Google Scholar] [CrossRef]
  39. Alderete, B.; Mücklich, F.; Suarez, S. Electrical Characterization of Carbon Nanotube Reinforced Silver and Copper Composites for Switching Contacts. J. Compos. Sci. 2023, 7, 284. [Google Scholar] [CrossRef]
  40. Puyol, R.; Suarez, S. A contact resistance measurement setup for the study of novel contacts. In Proceedings of the 2017 IEEE URUCON, Montevideo, Uruguay, 23–25 October 2017; pp. 1–4. [Google Scholar] [CrossRef]
  41. Nayak, U.P.; Müller, M.; Britz, D.; Guitar, M.A.; Mücklich, F. Image Processing using Open Source Tools and their Implementation in the Analysis of Complex Microstructures. Pract. Metallogr. 2021, 58, 484–506. [Google Scholar] [CrossRef]
  42. Limpert, E.; Stahel, W.A.; Abbt, M. Log-normal Distributions across the Sciences: Keys and Clues: On the charms of statistics, and how mechanical models resembling gambling machines offer a link to a handy way to characterize log-normal distributions, which can provide deeper insight into variability and probability—Normal or log-normal: That is the question. BioScience 2001, 51, 341–352. [Google Scholar] [CrossRef]
  43. Yang, N.; Boselli, J.; Sinclair, I. Simulation and quantitative assessment of homogeneous and inhomogeneous particle distributions in particulate metal matrix composites. J. Microsc. 2001, 201, 189–200. [Google Scholar] [CrossRef]
  44. Nayak, U.P.; Mücklich, F.; Guitar, M.A. Time-Dependant Microstructural Evolution and Tribological Behaviour of a 26 wt% Cr White Cast Iron Subjected to a Destabilization Heat Treatment. Met. Mater. Int. 2023, 29, 934–947. [Google Scholar] [CrossRef]
  45. Seki, K.; Kubo, T.; Ye, N.; Shimizu, T. Quantifying the spreading resistance of an anisotropic thin film conductor. Sci. Rep. 2020, 10, 10633. [Google Scholar] [CrossRef]
  46. Henger, U.; Korn, D. Electrical resistivity of thin films of AuCo solid solutions. J. Phys. F Met. Phys. 1981, 11, 2575–2584. [Google Scholar] [CrossRef]
  47. Guo, X.; Yang, Y.; Song, K.; Shaolin, L.; Jiang, F.; Wang, X. Arc erosion resistance of hybrid copper matrix composites reinforced with CNTs and micro-TiB2 particles. J. Mater. Res. Technol. 2021, 11, 1469–1479. [Google Scholar] [CrossRef]
  48. Shiraishi, M.; Ata, M. Work function of carbon nanotubes. Carbon 2001, 39, 1913–1917. [Google Scholar] [CrossRef]
  49. Reinert, L.; Zeiger, M.; Suárez, S.; Presser, V.; Mücklich, F. Dispersion analysis of carbon nanotubes, carbon onions, and nanodiamonds for their application as reinforcement phase in nickel metal matrix composites. RSC Adv. 2015, 5, 95149–95159. [Google Scholar] [CrossRef]
  50. Hilding, J.; Grulke, E.A.; Zhang, Z.G.; Lockwood, F. Dispersion of Carbon Nanotubes in Liquids. J. Dispers. Sci. Technol. 2003, 24, 1–41. [Google Scholar] [CrossRef]
  51. Alderete, B.; Nayak, U.P.; Mücklich, F.; Suarez, S. Influence of topography on electrical contact resistance of copper-based materials. Surf. Topogr. Metrol. Prop. 2023, 11, 025027. [Google Scholar] [CrossRef]
  52. Alderete, B.; Mücklich, F.; Suarez, S. Characterization and electrical analysis of carbon-based solid lubricant coatings. Carbon Trends 2022, 7, 100156. [Google Scholar] [CrossRef]
  53. Alderete, B.; Mücklich, F.; Suarez, S. Evaluating the effect of unidirectional loading on the piezoresistive characteristics of carbon nanoparticles. Sci. Rep. 2024, 14, 9247. [Google Scholar] [CrossRef]
Figure 1. Schematic representation of arcing mechanism. The schematic illustrates when (a) contacting surfaces approach each other and (b) two asperities come into contact, allowing current to constrict and flow between the electrodes. Here, the temperature at the contact spot T exceeds the melting temperature Tm of the metals. (c,d) As the moving electrode begins to retreat at velocity v, the molten bridge is pulled by the moving electrode, increasing the current density J. (e) The metallic bridge ruptures due to instability, significantly increasing the pressure and forming metallic vapor between the electrodes. The increased current density increases the temperature at the contact sites above the boiling temperature Tb of the metal. (f) After the metallic vapor expands and the pressure decreases, the electrical arc is generated.
Jcs 08 00285 g001
Figure 2. Current and voltage curves for reference and reinforced samples during 200 W hot switching tests. The shaded region highlights the time considered for the arc’s characteristics. The arrows highlight the tendency of the voltage curve during the arc’s duration. These plots show the most representative curves based on the average arc duration and energy.
Jcs 08 00285 g002
Figure 3. Power curves for reference and reinforced samples during 200 W hot switching tests. The shaded region highlights the time considered for the arc’s characteristics. The arrows point out the power spikes that were considered within the arc duration calculations. Dashed arrows point out the unstable arcs, whereas solid arrows highlight the main arc. These plots show the most representative curves based on the average arc duration and energy.
Jcs 08 00285 g003
Figure 4. Current curve and snapshots of high-speed video at different times during breaking for Cu 1% sample.
Jcs 08 00285 g004
Figure 5. 3 × 3 stitching at 50× optical micrographs of (a) Ag 3% and (b) Cu 3% via CLSM.
Jcs 08 00285 g005
Figure 6. Relative frequency for the nnd of (a) silver MMCs, (b) copper MMCs, and (c) comparison of the cumulative distribution.
Jcs 08 00285 g006
Table 1. Sample composition and nomenclature.
Matrix/vol.%Reinforcement/vol.%Reinforcement/wt.%Nomenclature
1000.000Ag 0%
94.775.231Ag 1%
89.9710.032Ag 2%
85.5414.463Ag 3%
1000.000Cu 0%
95.504.501Cu 1%
91.308.702Cu 2%
87.3912.613Cu 3%
Table 3. Resistivity, Holm radius and spreading resistance of the reference and MMC samples calculated using Equations (1) and (4). Hardness and resistance values were obtained from Table 2. The hardness of the samples was used for the calculations since the rivet is considerably harder than the samples.
SampleResistivity/ΩmHolm Radius/µmSpreading Resistance/mΩ
Ag Rod2.6 × 10−89.700.68
Ag 0%4.3 × 10−813.020.83
Ag 1%4.5 × 10−812.560.90
Ag 2%5.7 × 10−814.690.97
Ag 3%6.0 × 10−813.971.07
Cu Rod1.1 × 10−77.723.43
Cu 0%7.9 × 10−811.071.80
Cu 1%6.0 × 10−811.341.33
Cu 2%6.5 × 10−811.981.37
Cu 3%1.7 × 10−712.473.40
Ag/Ni 90/101.3 × 10−711.382.88
Ag/SnO2 92/86.1 × 10−810.461.47
Ag/SnO2 90/105.4 × 10−810.261.32
Ag/SnO2 88/129.0 × 10−89.852.29
Resistivity of AuCo (rivet) between 6.2 × 10⁻⁸ and 55.5 × 10⁻⁸ [3,46].
Table 4. Arc characteristics of reference and reinforced samples for tests carried out at 200 W.
SampleArc Duration/msArc Energy/mJ
Ag Rod0.29 ± 0.0110.25 ± 0.36
Ag 0%0.30 ± 0.029.86 ± 2.11
Ag 1%0.29 ± 0.048.79 ± 1.64
Ag 2%0.37 ± 0.0812.62 ± 2.45
Ag 3%0.36 ± 0.0510.71 ± 2.52
Cu Rod0.30 ± 0.018.28 ± 1.30
Cu 0%0.34 ± 0.0410.87 ± 0.82
Cu 1%0.20 ± 0.016.38 ± 0.25
Cu 2%0.23 ± 0.066.30 ± 0.76
Cu 3%0.23 ± 0.056.19 ± 0.95
Ag/Ni 90/100.27 ± 0.098.34 ± 1.68
Ag/SnO2 92/80.40 ± 0.0211.49 ± 0.78
Ag/SnO2 90/100.36 ± 0.039.56 ± 1.11
Ag/SnO2 88/120.37 ± 0.0311.71 ± 1.13
Table 5. Particle count, average size, and area fraction for silver and copper MMC.
SampleCountSize/µm2Area/%COV
Ag 1%137416.485.050.49
Ag 2%197720.649.100.44
Ag 3%301824.3216.360.41
Cu 1%11069.862.430.53
Cu 2%112414.723.690.50
Cu 3%136718.055.510.47
Disclaimer/Publisher’s Note: The statements, opinions and data contained in all publications are solely those of the individual author(s) and contributor(s) and not of MDPI and/or the editor(s). MDPI and/or the editor(s) disclaim responsibility for any injury to people or property resulting from any ideas, methods, instructions or products referred to in the content.

