Article

Focal Liver Lesion Detection in Ultrasound Image Using Deep Feature Fusions and Super Resolution

by
Rafid Mostafiz
1,
Mohammad Motiur Rahman
1,
A. K. M. Kamrul Islam
2,* and
Saeid Belkasim
2
1
Department of Computer Science and Engineering, Mawlana Bhashani Science and Technology University, Santosh, Tangail 1902, Bangladesh
2
Department of Computer Science, Georgia State University, Atlanta, GA 30302-5060, USA
*
Author to whom correspondence should be addressed.
Mach. Learn. Knowl. Extr. 2020, 2(3), 172-191; https://doi.org/10.3390/make2030010
Submission received: 30 May 2020 / Revised: 30 June 2020 / Accepted: 6 July 2020 / Published: 9 July 2020
(This article belongs to the Section Learning)

Abstract

:
This research presents a machine vision approach to detect lesions in liver ultrasound as well as resolving some issues in ultrasound such as artifacts, speckle noise, and blurring effect. The anisotropic diffusion is modified using the edge preservation conditions which found better than traditional ones in quantitative evolution. To dig for more potential information, a learnable super-resolution (SR) is embedded into the deep CNN. The feature is fused using Gabor Wavelet Transform (GWT) and Local Binary Pattern (LBP) with a pre-trained deep CNN model. Moreover, we propose a Bayes rule-based informative patch selection approach to reduce the processing time with the selective image patches and design an algorithm to mark the lesion region from identified ultrasound image patches. To train this model, standard data ensures promising resolution. The testing phase considers generalized data with a varying resolution and test the performance of the model. Exploring cross-validation, it finds that a 5-fold strategy can successfully eradicate the overfitting problem. Experiment data are collected using 298 consecutive ultrasounds comprising 15,296 image patches. This proposed feature fusion technique confirms satisfactory performance compared to the current relevant works with an accuracy of 98.40%.

1. Introduction

The final stage of liver lesion forms liver cancer. It is the largest cause of cancer-related death and causes 700,000 deaths each year as reported by the American cancer society. In 2020, it is estimated that around 42,810 new cases will be diagnosed in the USA, among them about 20,160 will die of this type of cancer [1]. However, the primary growth of lesions should be detected to prevent possible cancer formation. As the cancer symptoms are not visible in the earlier stage, some experts recommend screening through ultrasound images in every 6 months.
In the medical method, liver lesions are considered to be liver mass or tumor constituting from a group of abnormal cells. The lack of proper diagnosis of liver lesions is prone to be cancer. The recommended diagnosis is blood tests and imaging tests. Imaging tests mostly assist the radiologist to know the exact size, location, and condition of the lesion. Ultrasound is preferable to any other imaging modalities to make the live images of the liver. Moreover, it is cost-effective, comfortable, and noninvasive in nature [2]. This will provide the visual information of the disease state and condition to the doctor. However, the diagnostic accuracy is mostly dependent on ultrasound image quality and doctor experience [3]. With the growth of technology, the ultrasound system evolves challenges and opportunities [4]. Computer-aided (CAD) system can promote ultrasound in a new dimension by alleviating the existing drawbacks.
The scholars have suggested a large number of CAD methods to distinguish liver diseases using liver ultrasound. In [5], several computerized approaches were introduced for the diagnosis of liver using ultrasound images. This study shows the speckle affected image has reduced the performance of CAD system. An efficient filtering technique is crucial both for speckle suppressing and edge preserving. In [6], the focal liver lesions were classified from the normal liver. They extracted 208 textural features from the region of interest (ROI) of each segmented liver image. They obtained 86.4% classification accuracy using a two-step NN classifier. The ultrasound image modality was used to classify focal liver lesions using textural features [7]. They used a PCA-SVM-based classifier and obtained overall accuracy of 87.2% for classification. In [8], a multi-SVM was used to discriminate the focal liver lesion with accuracy 96.11%. They used Haralick local (HL) texture and histogram-based features for extracting textural features. High-level features are extracted using stacked sparse auto-encoder technique for focal liver lesions classification [9]. A level set method and Fuzzy c-means were used for the segmentation of liver lesions. The SoftMax classifier performed 97.2% classification accuracy for their proposed technique. Balasubramanian suggested an automatic classification of focal liver lesions by exploring texture features [10]. A PCA technique was applied to select the principle features for the classification using neural network-based classifiers. An artificial neural network has deployed to distinguish liver conditions from ultrasound image in [11]. They used 47 mixed feature set and obtained improved accuracy of 91.7% for training data. Xian et al. [12] presented an approach to detect malignant or benign liver tumor from ultrasound image. A fuzzy support vector machine adopted with texture features obtained 97.0% classification accuracy. Jeon et al. [13] proposed a novel ROI selection method to improve the classification accuracy of focal liver lesions. They suggested that the performance improved compared with the existing ROI selection approach with accuracy more than 80%. A back propagation neural network combined with principle feature selection technique was proposed by Virmani et al. [14]. PCA was applied as a dimensionality reduction technique for the extracted features of ROI with the overall classification accuracy of 87.7%. In their later work at paper [15], they introduced a two steps PCA-NN-based binary classifier. Using this proposed system, they were able to improve the classification accuracy to 95%. Hwang et al. proposed hybrid textural feature extraction modalities for focal liver lesions with accuracy over 96% [16]. They extracted 42 hybrid features among which 29 were selected using PCA to feed into back propagation NN. The deep analysis of several intelligent modalities depict that optimal patch selection and meaningful feature formation can improve the detection accuracy of focal liver lesion in ultrasound images.
Most of the literature review found that the ultrasound image quality seriously reduces the performance of any CAD system. The artifacts and speckle noise in the ultrasound image make these classification tasks more difficult and even wrong diagnoses. Sometimes, there is a want of high-frequency details in the filtered image. This low resolution and over smoothness cannot dig the reliable features in many cases. This experiment finds the room to improve these conditions with good classification accuracy. Modified anisotropic diffusion with edge preservation approach filters the input test images. A learning-based super-resolution technique will be applied to each filtered image. This research extracts the local textural features using Gabor Wavelet Transform (GWT) and Local Binary Pattern (LBP) and fused with a fine-tuned transfer learning model. An SVM classifier detects the focal lesion region in the input ultrasound test image. This research presents an amended performance to make the ultrasound modalities more reliable and effective. The epitome of our contributions are:
(i)
A Computer-aided technique obtaining amended performance in liver lesion detection through the deep CNN with local textural features of LBP and GWT.
(ii)
The main drawbacks of ultrasound images are resolved using edge-preserving anisotropic diffusion and enhance the significant information by learnable super resolution (SR) techniques.
(iii)
A proposed lesion detection technique outperforms state-of-the-art methods.
(iv)
An informative patch selection technique reduces the computation time.
(v)
A designed algorithm marks lesions’ region from identified ultrasound image patches.
This article is structured as follows. Section 2 elaborates on the research methodology of liver lesion detection in the ultrasound image. Section 3 shows the exploratory results. A complete discussion is demonstrated in Section 4. Finally, Section 5 draws a conclusion.

2. Research Methods

This segment represents the computer vision approach to detect liver lesions from ultrasound images. Several ultrasound including normal liver and lesion affected images train this proposed model. The promising quality and contrast are ensured for the training phase. The grayscale conversion processes all the input datasets and after that detects the Region of Interest (ROI) to remove the unwanted regions. Next, the patches are accrued from each of the ROI images. The feature vector is formed using the fusion of extracted features from the collected image patches. The SVM training is performed using these feature vectors. This experiment has used speckle affected and low-quality ultrasound images for the test to some extent. The test image is preprocessed with noise filtering and super-resolution (SR) techniques. Thus, it can successfully overcome the limitations of image quality. The feature extraction scheme is performed on the test images after preprocessing. Then, the image is classified whether affected by liver lesions or not. Figure 1 represents the complete diagram of our working approach.

2.1. Data Processing

This experiment collected 15,296 ultrasound images of 298 clinical studies from picture archival and communication system (PACS) [17] using Toshiba Xario XG scanner. MICCAI publicly available standard datasets [18,19] are also used in this experiment. The ultrasound image dataset comprising total of 10,687 normal liver images and 4609 liver lesions including Cyst, Hemangioma (HEM), Hepatocellular carcinoma (HCC), Metastases (MET). This study attempts to classify normal liver from the liver lesions of these four common types. It also reveals that the concentration is not for the classification of lesion types. The training and test scheme contains two classes one for normal class and other for lesion class. The whole dataset is split randomly into 0.7 portion for training phase and remaining 0.3 portion for test phase. All the training and testing was performed on a personal computer (PC) of 64-bit windows. The PC configuration is 8 GB RAM with Intel Core i5 CPU of 2.60 GHz. MATLAB 2019b has been used to conduct the full experiments.
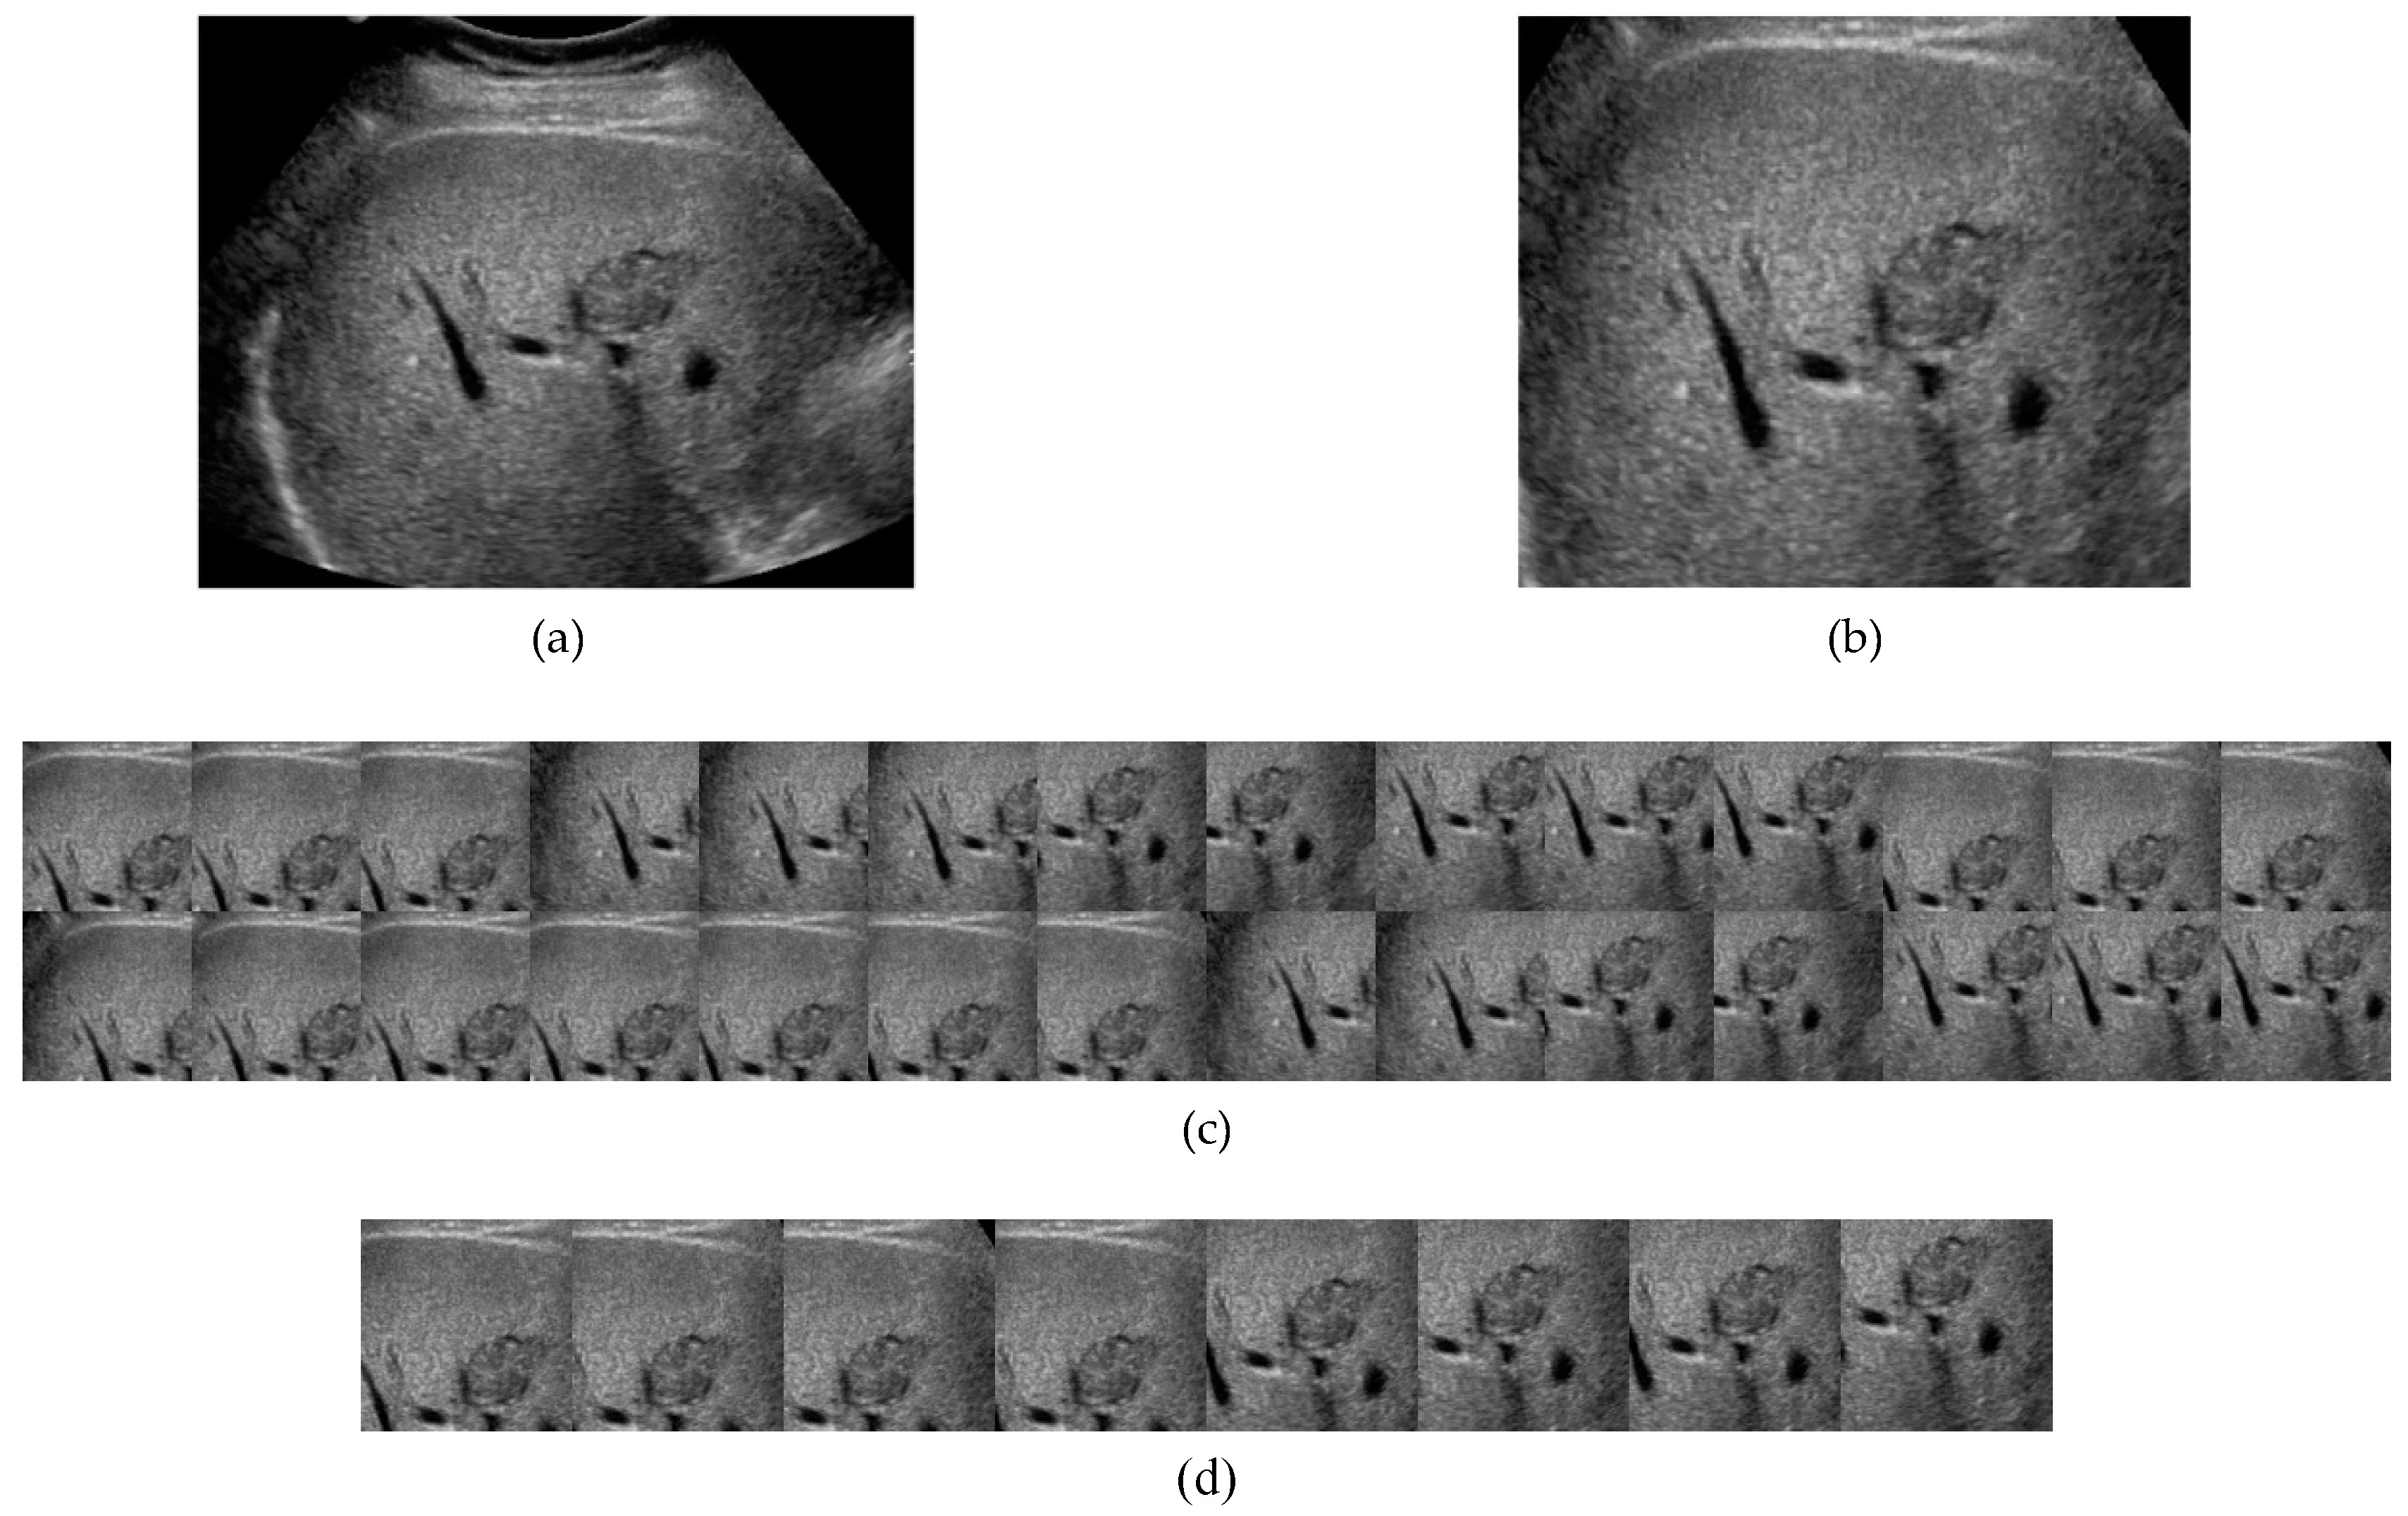
The region of interest (ROI) is extracted for training and test images in order to exclude unnecessary text and machine annotations around the images. Image patches are captured by a 224 × 224 window sliced from the top left corner to bottom right corner with stride 30. A Bayesian patch selection technique is applied to obtain the target object patches and reduces the processing time [20]. This approach suppresses the number of unnecessary training patches by considering the most informative patches of reference frames. This model can be explained using Equation (1). For an image region I the number of observed patches are 1, 2, 3,…., m ; reference frame R and target object patch S . The probability of estimating target object patch using Bayes rule is P ( S ,   R | I ) .
P ( S ,   R | I ) = P ( I | S ,   R )   P ( S ,   R ) P ( I )   .
Finally, the selected patches are considered using P ( S ,   R ) Equation (2).
( S ,   R ) = P ( I k | S ,   R ) P ( I k )
where k is the number of observed patches of 1 to   m .
Figure 2 demonstrates the procedure of image data processing and patch collection. Again, the huge amount of labeled data is a demand for any supervised learning for training phase. The insufficient training data may tend overfitting problem in most of the cases. Data augmentation technique leads to overcome this limitation by abolishing the over fitting status. A deep learning based on CNN model [21] is the best fitted in our model and eliminate the drawback of the lack of labeled images. The augmentation techniques such as translation, scaling, shearing, zooming, rotation, flipping, brightness changing are acting on patches as the size and shape of lesion are varying in ultrasound image.

2.2. Modified Anisotropic Diffusion Filtering

This experiment uses speckle affected test images in the testing phase and observes the detection accuracy. The filtering techniques also need to preserve the necessary information while filter noise. A detail preserving noise filtering [22] technique is necessary to extract the meaningful feature in our proposed model. In this sense, the anisotropic diffusion has an extensive value as it can preserve and even enhance the edge information in noise suppressing [23]. The edge information along with noise can be detected through the gradient operators. The image gradient has changed in smaller pieces for reducing noise while larger gradient preserves edge information. This experiment finds the gradient changes in noise for strong speckle and low contrast images may go beyond the gradient of edge. This will drain more edge information rather than noise. If this will have happened our experiment has found worse accuracy results than working with noisy and artifact images.
The main contribution of this modified model is to reduce speckles while preserving small details. We also do our experiment using poor contrast and low noise standard deviation images. To sustain the meaningful edge information, we did the experiment using correlation and kurtosis values of noise with image resolution. The iteration of the speckle suppression should be stopped when the noise part of image is close to Gaussian. The noise part is denoted by Equation (4). If the noise part is Gaussian, then the kurtosis value should be zero. The iteration cut-off is defined when the kurtosis value is below 0.001 that means low speckle with better edge preservation. The iterations continue unlit kurtosis of noise part falls under this measurement as derive from Equation (5). The correlation between the image class and noise class should be minimum is another iteration stopping condition. This can preserve optimal edge information and maximize noise reduction. Equations (3)–(9) represent the calculation, where I0 is a noisy image comprises with speckle noise n and original image I; the mean of noise intensity G is μ; finally, calculate the kurtosis κ using Equation (6).
I 0 = I n
n = I G G
μ = i = 1 N G i N
κ = 1 N i = 0 N ( G μ ) 4 [ 1 N i = 0 N ( G μ ) 2 ] 2 3
abs ( n κ ) 0.001
ρ I = i = 0 M 1 j = 0 N 1 i . j . P I ( i , j ) μ I x μ I y i = 1 N ( I i x μ I x ) ( I i y μ I y ) N
ρ G = i = 0 M 1 j = 0 N 1 i . j . P G ( i , j ) μ G x μ G y i = 1 N ( G i x μ I x ) ( G i y μ I y ) N
where Equation (8) calculates the correlation of image intensities and Equation (9) calculates the correlation of noise intensities. When the ρ I and ρ G show a minimum deviance, the filtering will get the optimum result.
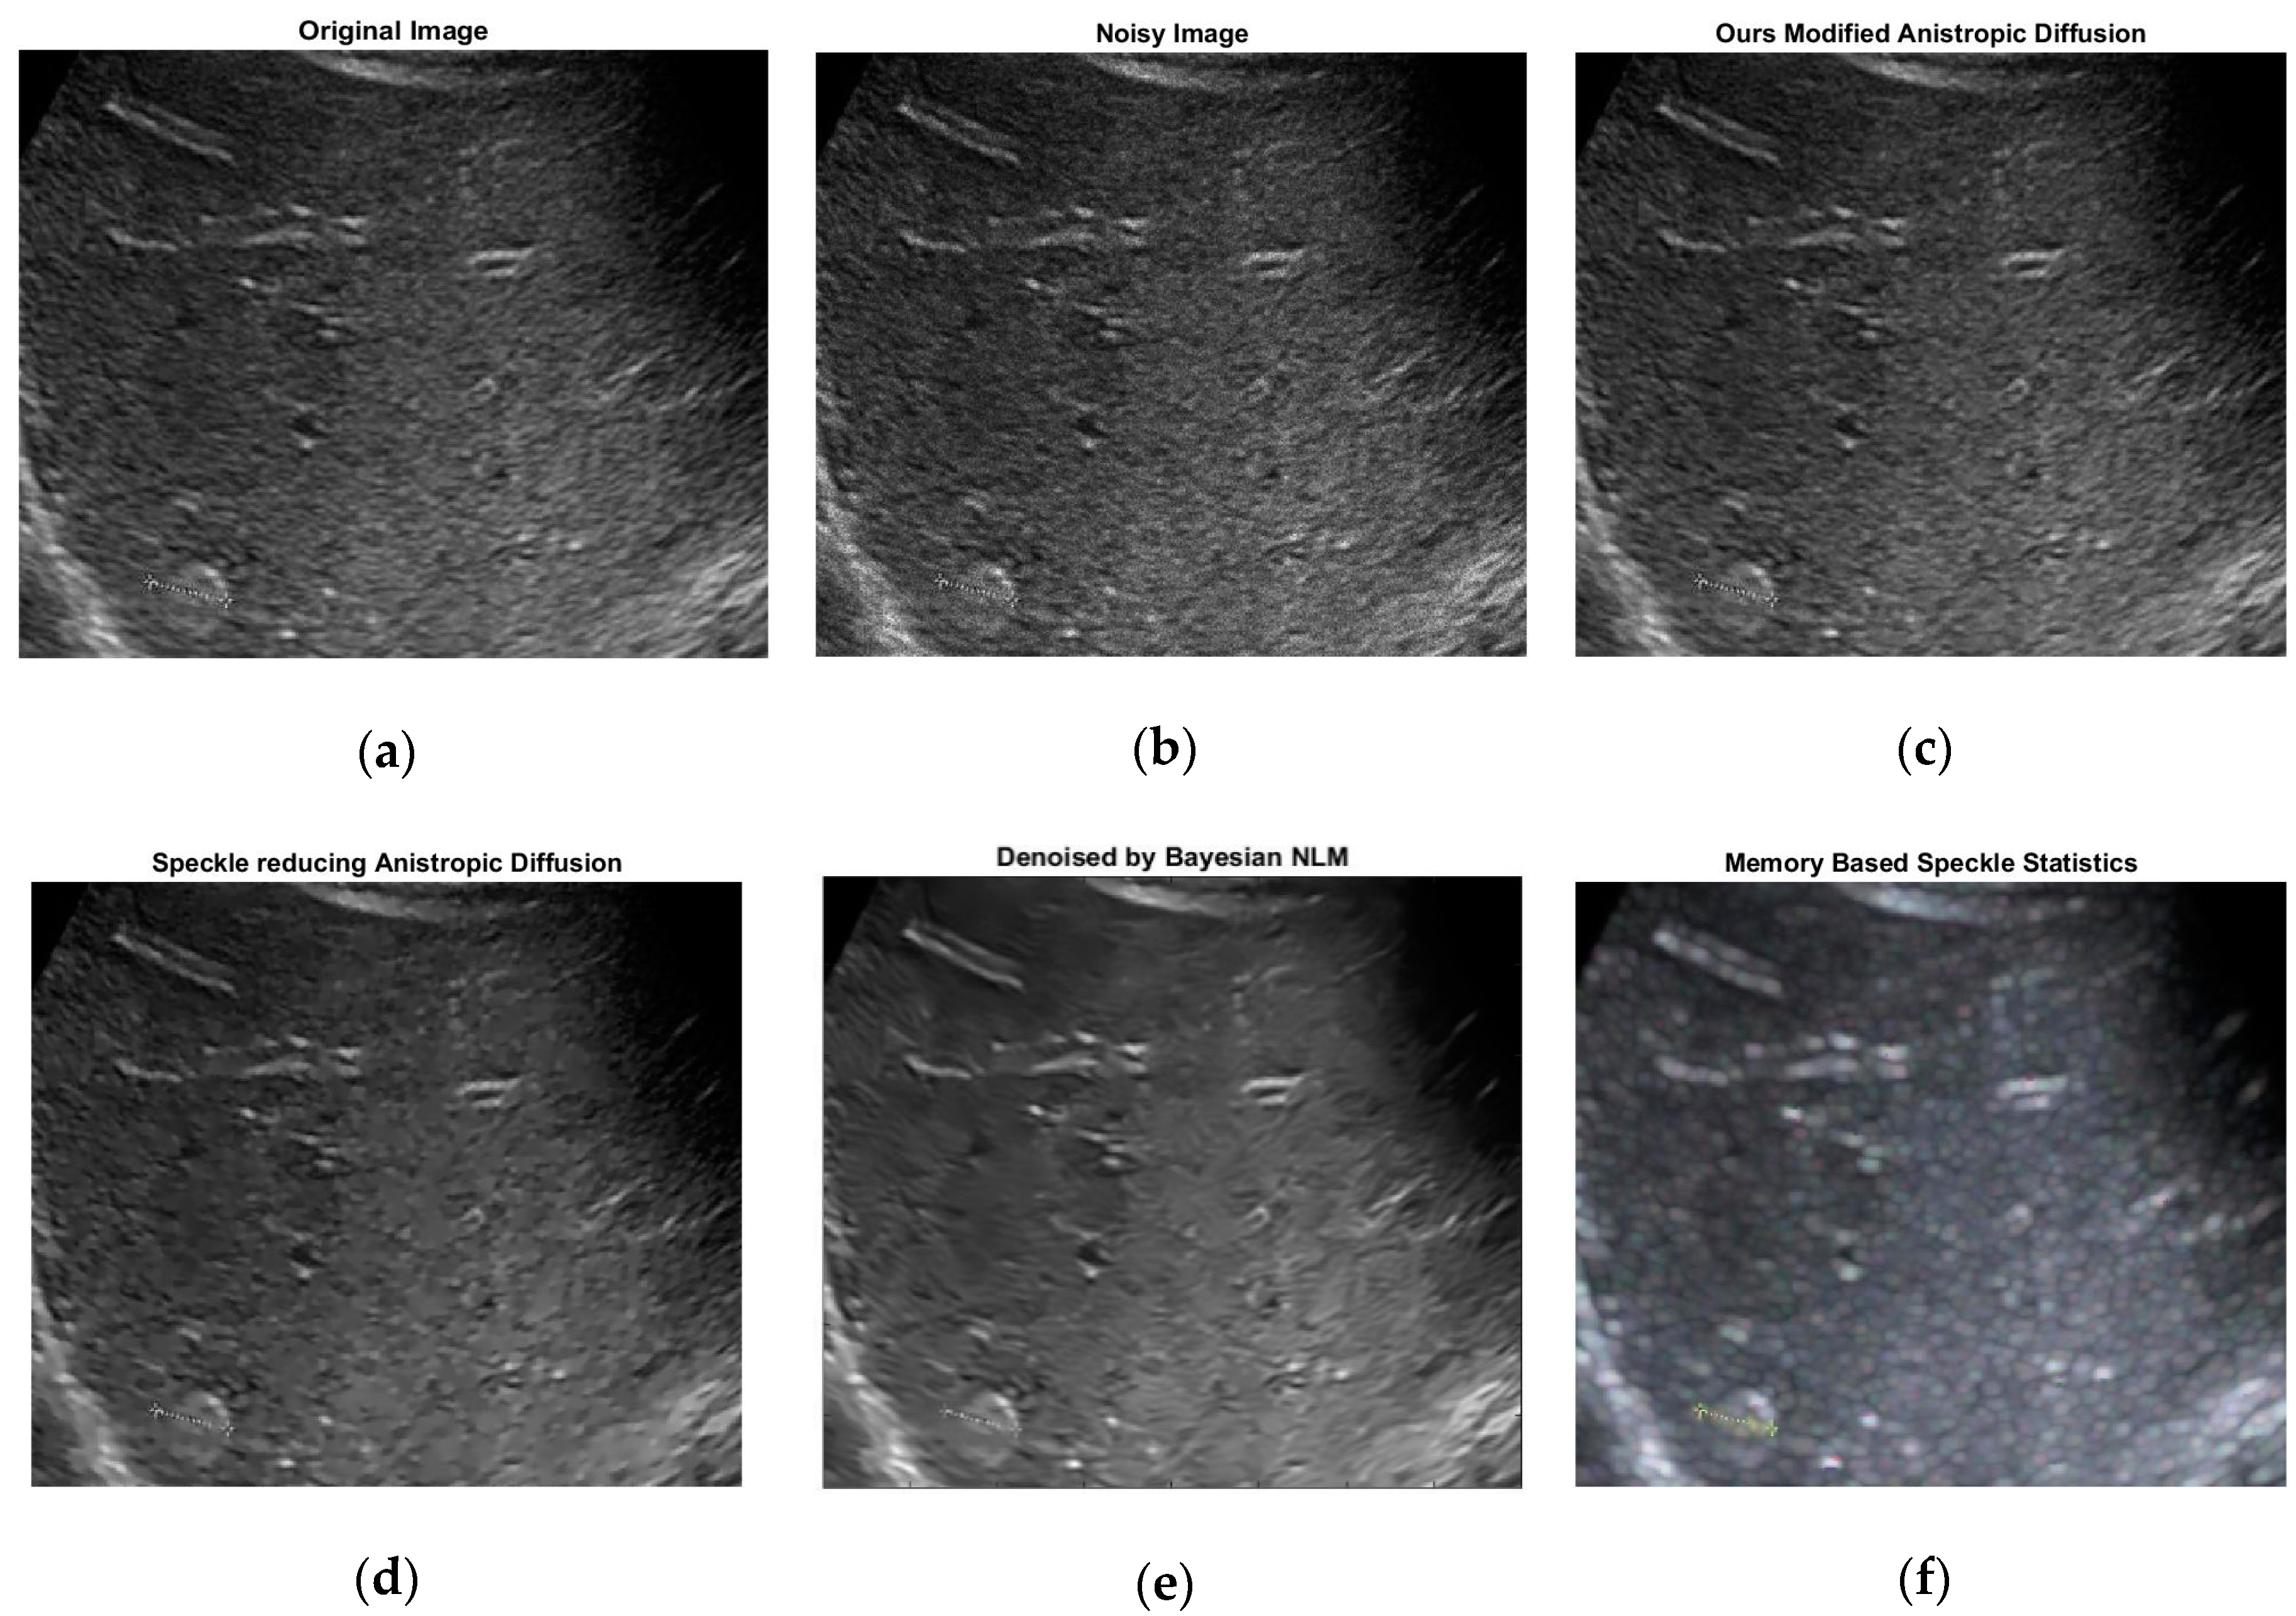
The experiment was also done using some well-known diffusion models based on Perona and Malik [23]. The speckle reducing anisotropic diffusion (SRAD) [24] keeps the image over smoothing and thus drains the edge information. Oriented-based non local means (OBNLM) [25] is affected with drift effect as well as failed to preserve important details. The anisotropic diffusion with memory-based speckle statistic (ADMSS) [26] has sharped the white pixels. The visual comparison is given in Figure 3.

2.3. Learning Based Super Resolution

The image super-resolution (SR) technique is mainly used for retrieving the flexible detail from a low resolution (LR) image. SR image reconstruction improves the detection accuracy by mapping the high resolution (HR) information from the input test image. The HR image estimation has a significant influence in this work while blurring and unexpected smoothness result from noise filtering. The main drawback of this research was the edge blurring effect after filtering. This may affect the performance result sometimes more than with noise and artifact of the image. The SR technique overcame this limitation and rescued most of the significant details.
The LR input image and the HR target image have similar image content while missing only the high-frequency details in LR image. The HR image can be achieved by estimating the residual image and a residual part contains the high-frequency information of the desired image. The network is trained to estimate the residual part from an LR input. Then the interpolation is used to upscale the end to end feature mapping from the LR image patch to the HR image patch. The luminance channel is used to upscale the residual part until match the size of reference HR image as the network is only trained using the luminance part.
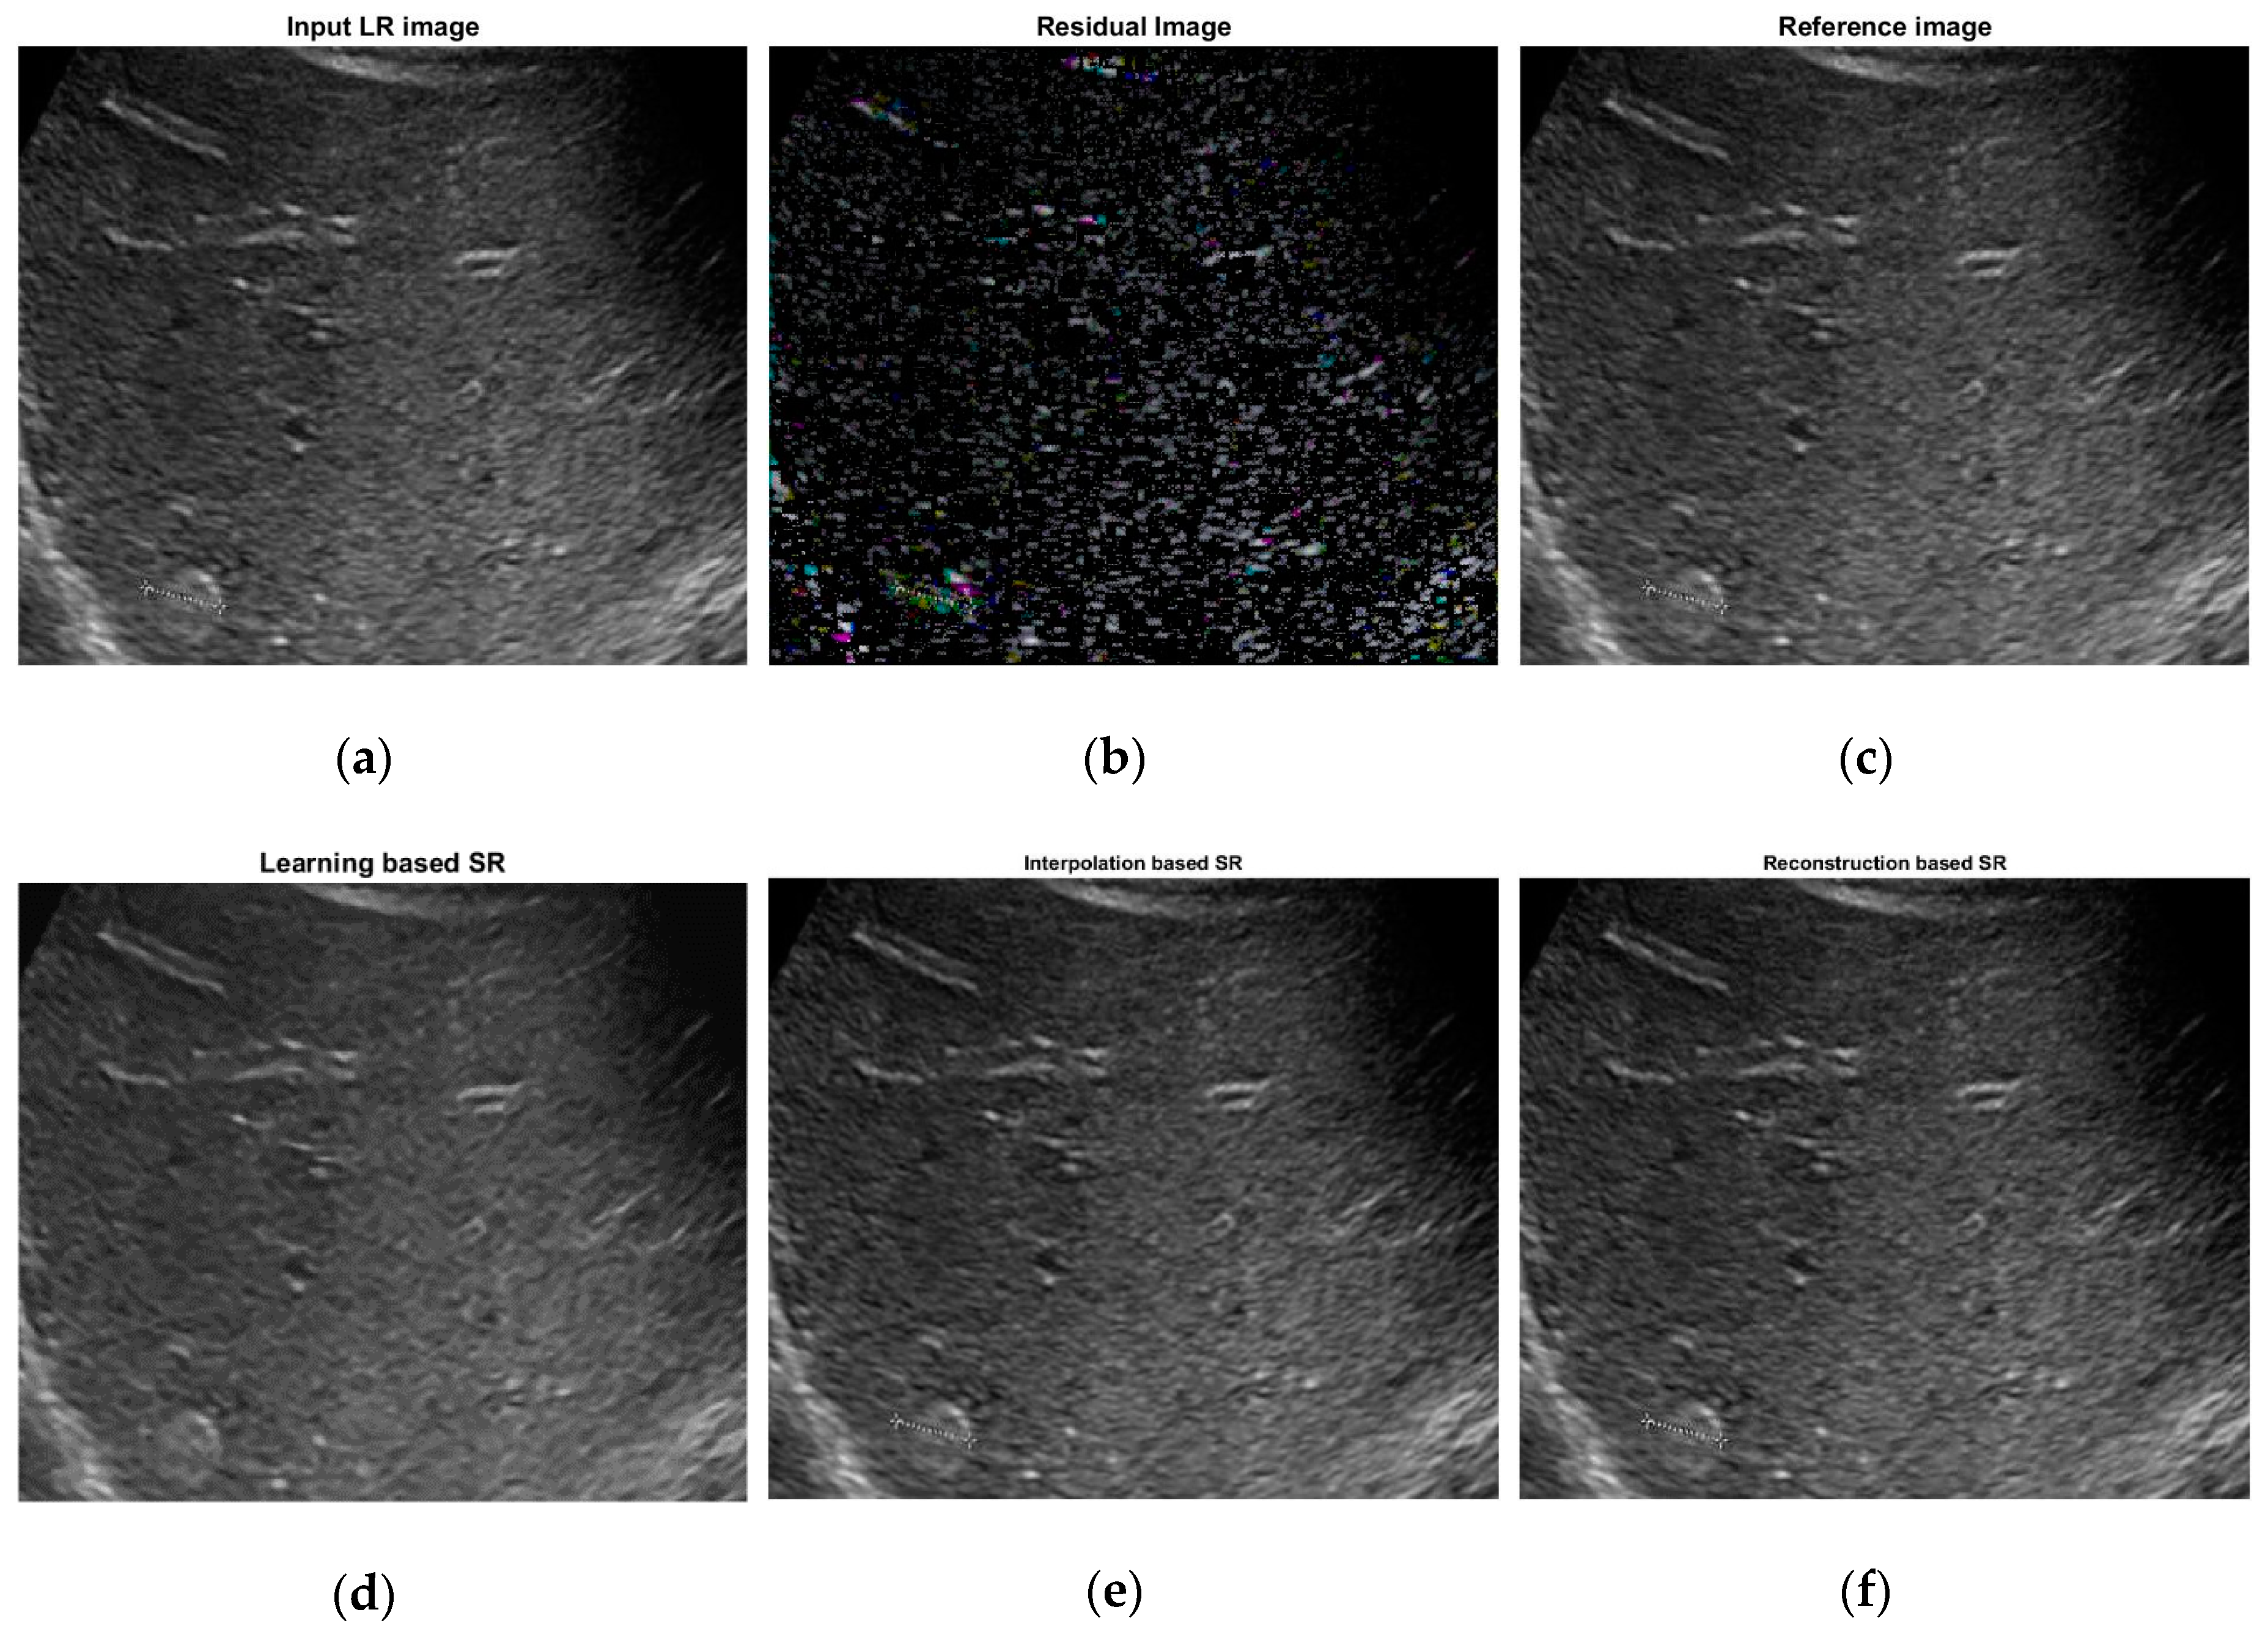
This experiment observes the performance of three mostly used SR techniques, such as a reconstruction-based SR [27,28,29], interpolation-based SR [30,31], and learning-based SR [32,33,34]. The deep learning-based SR shows prior results compared to others. Calculating the performance results, deep SR shows superiority in terms of peak signal to noise ratio (PSNR) and the structural similarity (SSIM). The larger the PSNR values generally indicate better image reconstruction performance. The comparative experiment is represented in Figure 4. In Figure 4a, shows the input low resolution (LR) after filtering and Figure 4c is the reference high resolution (HR) image. The residual image with high-frequency details is depicts in Figure 4b. The learning-based SR image in Figure 4d is obtained through the residual part targeting the reference image. Figure 4e,f represents the SR image achieved by interpolation-based and reconstruction-based approach respectively.

2.4. Feature Extraction

Feature extraction for any computer aided classification system is very crucial [35]. This study has observed several feature extraction techniques in our experiment. The fused feature of GWT and LBP shows the most promising in local texture feature extraction.

2.4.1. Gabor Wavelet Transform (GWT) Features

Multi-scale feature extraction at various orientation of ultrasound image using GWT provides useful description of texture [36]. A complex sinusoidal signal is performed on the spatial region of Gabor filter with the feature of Gaussian kernel. The sinusoidal signal of Gabor filter is denoted by Equation (10).
g = s 2 π γ η exp ( x + γ 2 y 2 σ 2 ) exp ( j 2 π s x + φ )
Here, θ is the orientation of the frequency s in phase offset φ . The standard deviation σ is used in the Gaussian envelope and the elliptic characteristics is represented by γ. The following Equations (11) and (12) describe the portion of x and y .
x = x   c o s θ + y   s i n θ
y = x   s i n θ + y   c o s θ
The GWT is obtain total 24 multi-scale image using four orientations and six scales. Four statistical features: correlation, energy, homogeneity, entropy are measured for these multi-directional images.

2.4.2. Local Binary Pattern (LBP) Features

Multi-scale The local spatial textural feature of ultrasound image can be described using LBP [37]. It levels the neighborhood pixels with a threshold value and represent as binary number 0 or 1. Firstly, each neighbor pixel gray values (3 × 3) are compared with the center pixel. The pixels are leveled as 1 if it is greater than the central pixel otherwise leveled as 0. Then, the neighbor pixel is represented as a sequence of binary digit and convert into decimal to replace the center pixel value. For instance, the sum (S) of all samples is 256 for the neighbor (8, i). When the gray level pixel variance is g p for the neighborhood pixels (i, j), the complementary constant can be obtained as g c . Equations (13) and (14) define the LBP segmentation across the image.
l = P = 0 P 1 S ( g p g c ) 2 P
S = { 1 ; 0 ;   i f   l ( i , j ) > 0 o t h e r w i s e }

2.4.3. CNN Features

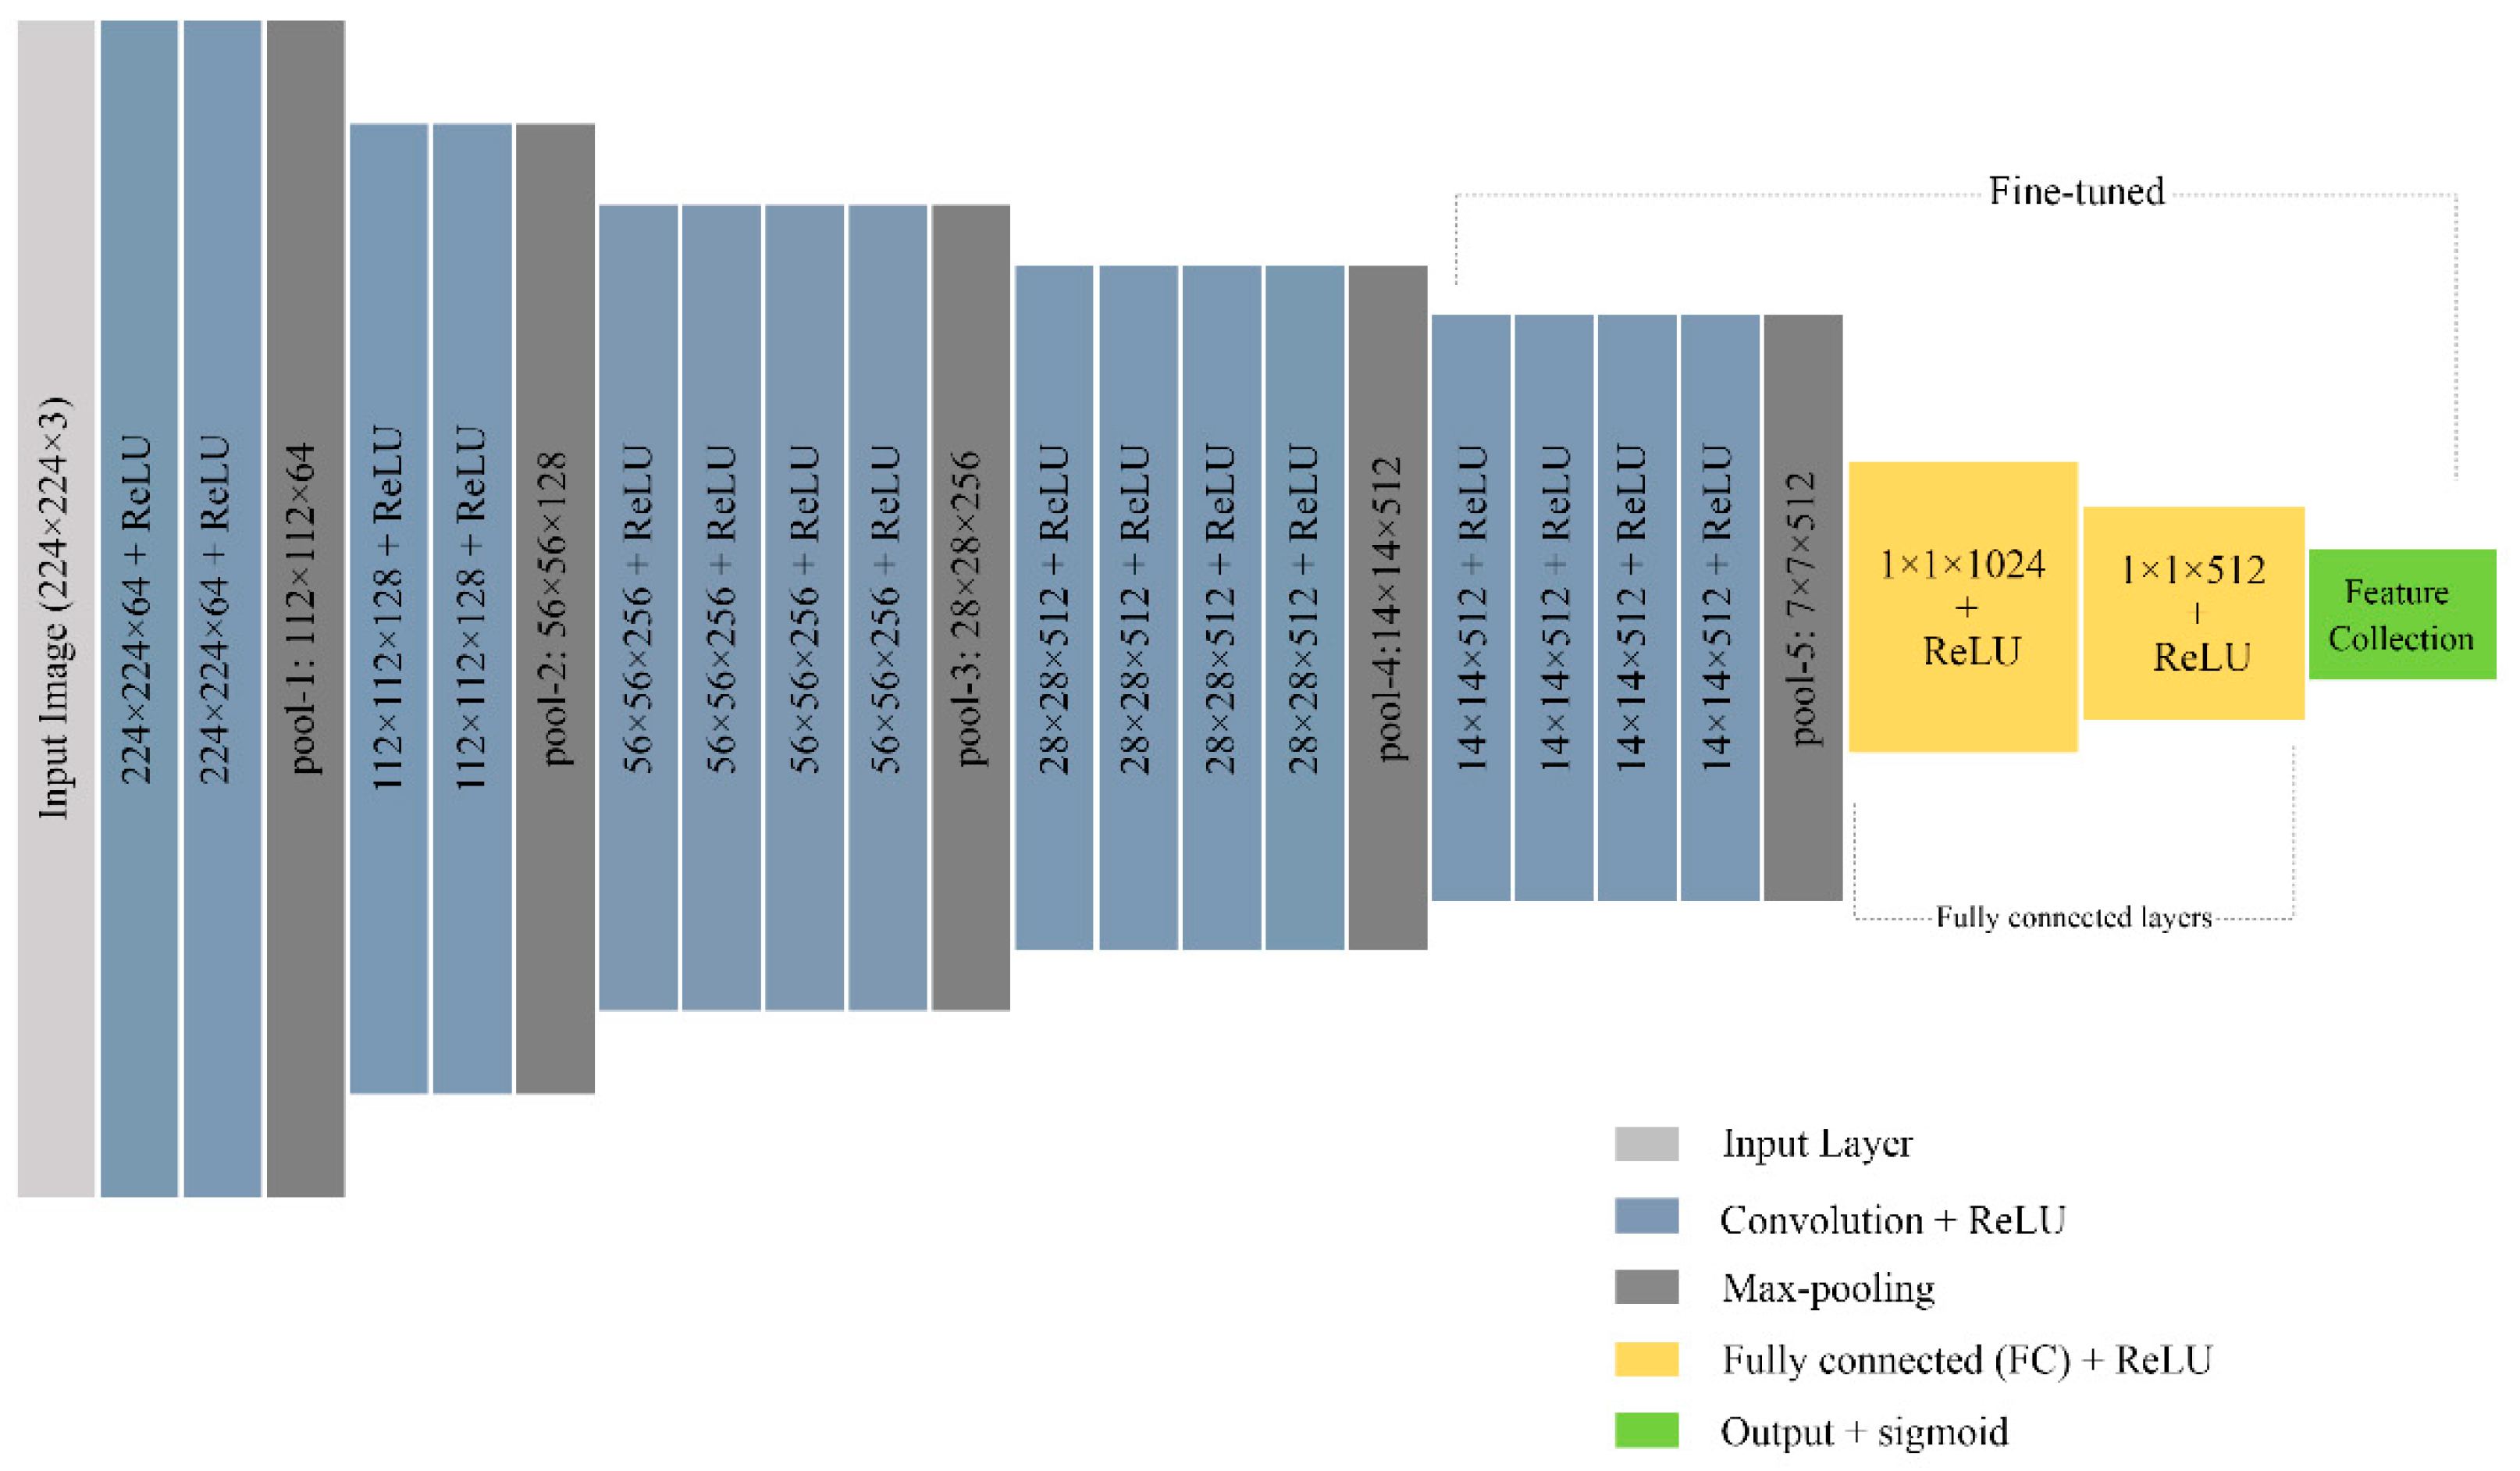
Image feature extraction using CNN is one of the influential innovations in the field of computer vision. This research did experiment on different CNN models from scratch and pre-trained models. While the scratch model shows an inadequate performance with a limited dataset, the pre-trained model helps to lessen the data demand. A pre-trained VGG19 [38] model is fine-tuned with our experiment dataset as a feature extractor. This network model is formed using a 19-layer version of VGGNet. This experiment has found that VGG19 outperformed VGG16 and other deep learning models such as ResNet50, Alexnet, and scratch model.
Figure 5 depicts the architecture of the VGG19 model with sixteen convolution layers followed by three fully connected layers. The activation function uses a non-linear ReLU for the output of each convolution layer. There are five consecutive max-pooling layers dividing the whole convolution part into five sub-regions. First and second sub-regions are comprised of two convolution layers each with a depth size of 64 and 128, respectively. The remaining three sub-regions consist of four consecutive convolution layers each with a depth size of 256, 512, and 512 respectively. Pooling layers are deployed to reduce the learnable parameter after the sub-regions of convolutional layers. The feature vector has obtained from the last layer of our VGG19 model. Two hidden layers with neurons 1024 and 512 are placed before the output feature collection layer. This fine-tuned model has used L2 regularization after each fully connected layer besides the dropout layer to reduce the overfitting in its implementation.

2.5. SVM Classifier

This experiment uses SVM to classify two classes of normal liver and liver lesions. It tries to find the best-fitted hyperplane that can divide those two classes. While forming a hyperplane it maximizes the margins of high dimensional features between the two classes [39]. This will create a decision boundary and the support vector data points are fall near the boundary. The experiment has found that SVM is quicker than other classifiers to find the hyperplane with minimum required steps. An efficient distance maximization technique makes it a better classification of liver ultrasound as well.
In medical imaging analysis, SVM performs better classification tasks for unseen and sparse data [40]. Moreover, it can design a reliable classifier in case of noisy data such as ultrasound images. The regularizations of SVM in this study are less affected by overfitting. It is less prone to the curse of feature space dimensionality and thus obtains a good generalization result for additional features. Good choice of λ as a kernel parameter and C as regularization parameter is the prerequisite of reliable generalization performance. The correct choice of C is to maximize the decision boundary with a very low value for training error. Five-fold cross-validation is performed in this study to find the optimal values of λ and C for training [41].

2.6. Lesion Region Finding

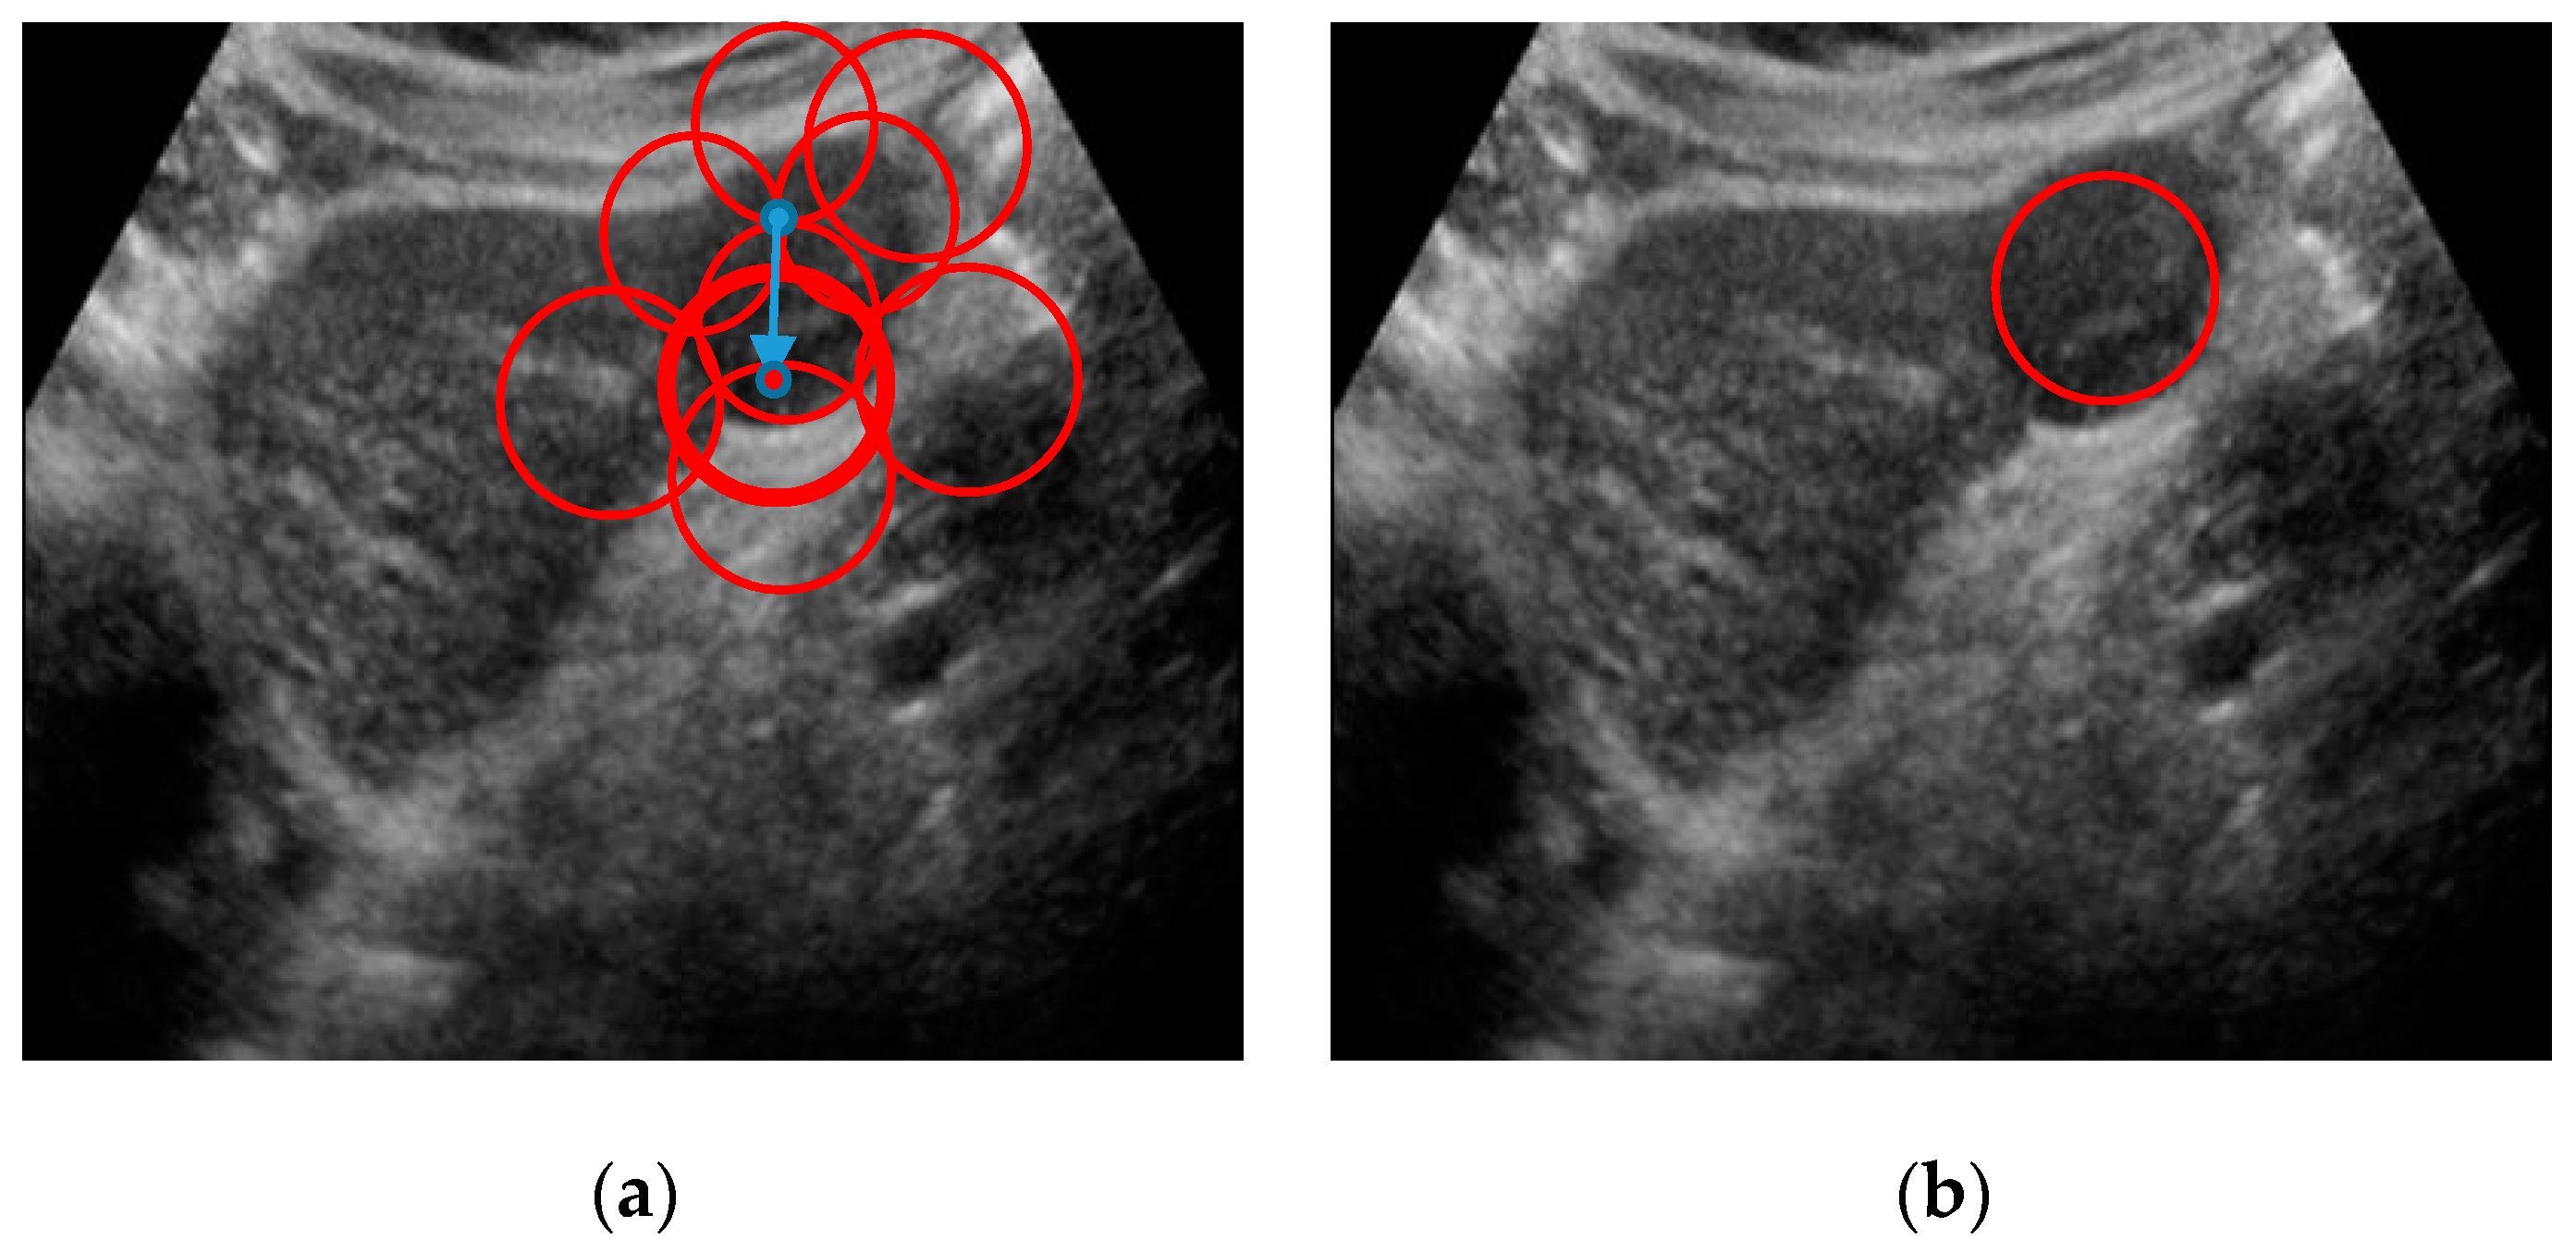
The output segment in this study is proposed to mark the possible lesion region if the image is detected as liver lesion. The liver lesions are of different shape and size varying with the lesion types. Whenever any region is detected as lesion, a circle is marked around that region. The patches are connected after classification to detect the center coordinate. The coordinates of overlapping circles are used to find the possible lesion region. A center is selected as the final center where most of the circles are overlapped. The distance between the final center and the minimum overlapped center is maximized to obtain final radius. Algorithm 1 demonstrates the procedures of detecting lesion regions. The marking instance of liver lesion is shown in Figure 6 according to our working algorithm.
Algorithm 1: Detecting lesion regions.
n n u m b e r   o f   c i r c l e
C n ( x , y ) = c e n t e r   c o o r d i n a t e   o f   c i r c l e s
P ( x , y ) = i n t e r s e c t   p o i n t
M P = m a p   t o   c l a c u l a t e   t h e   o v e r l a p p i n g   c i r c l e   i n   a   c e n t e r
S T = s t a c k   f o r   m i n i m u m   n u m b e r   o f   i n t e r s e c t i n g   c e n t e r   p o i n t
X = c e n t e r   x   c o o r d i n a t e ; Y = c e n t e r   y   c o o r d i n a t e
F = f i n a l   c e n t e r
r = r a d i u s
start
    F 1
    r 1
   for i: 1→n
       S T C i ( x , y )
      if C i ( x , y )   P ( x , y ) 1
         M P [ C i ( x , y ) ] + +
        if ( F < M P [ C i ( x , y ) ] )≡1
           F M P [ C i ( x , y ) ]
           X x
           Y y
        end if
        if ( M P [ C i ( x , y ) ] >1)≡1
           [ C i ( x , y ) ] S T // pop the left if it is overlapping value is greater than 1.
        end if
      end if
   end for
    
   do
       p S T . t o p ( x )
       q S T . t o p ( y )
      d= ( X p ) 2 ( Y q ) 2
       r = m a x ( r , d )
       S T . p o p ( )
   end until S T
    d r a w   c i r c l e   ( c e n t e r , r a d i u s ) = ( ( X , Y ) , r )
End

3. Experiment Results

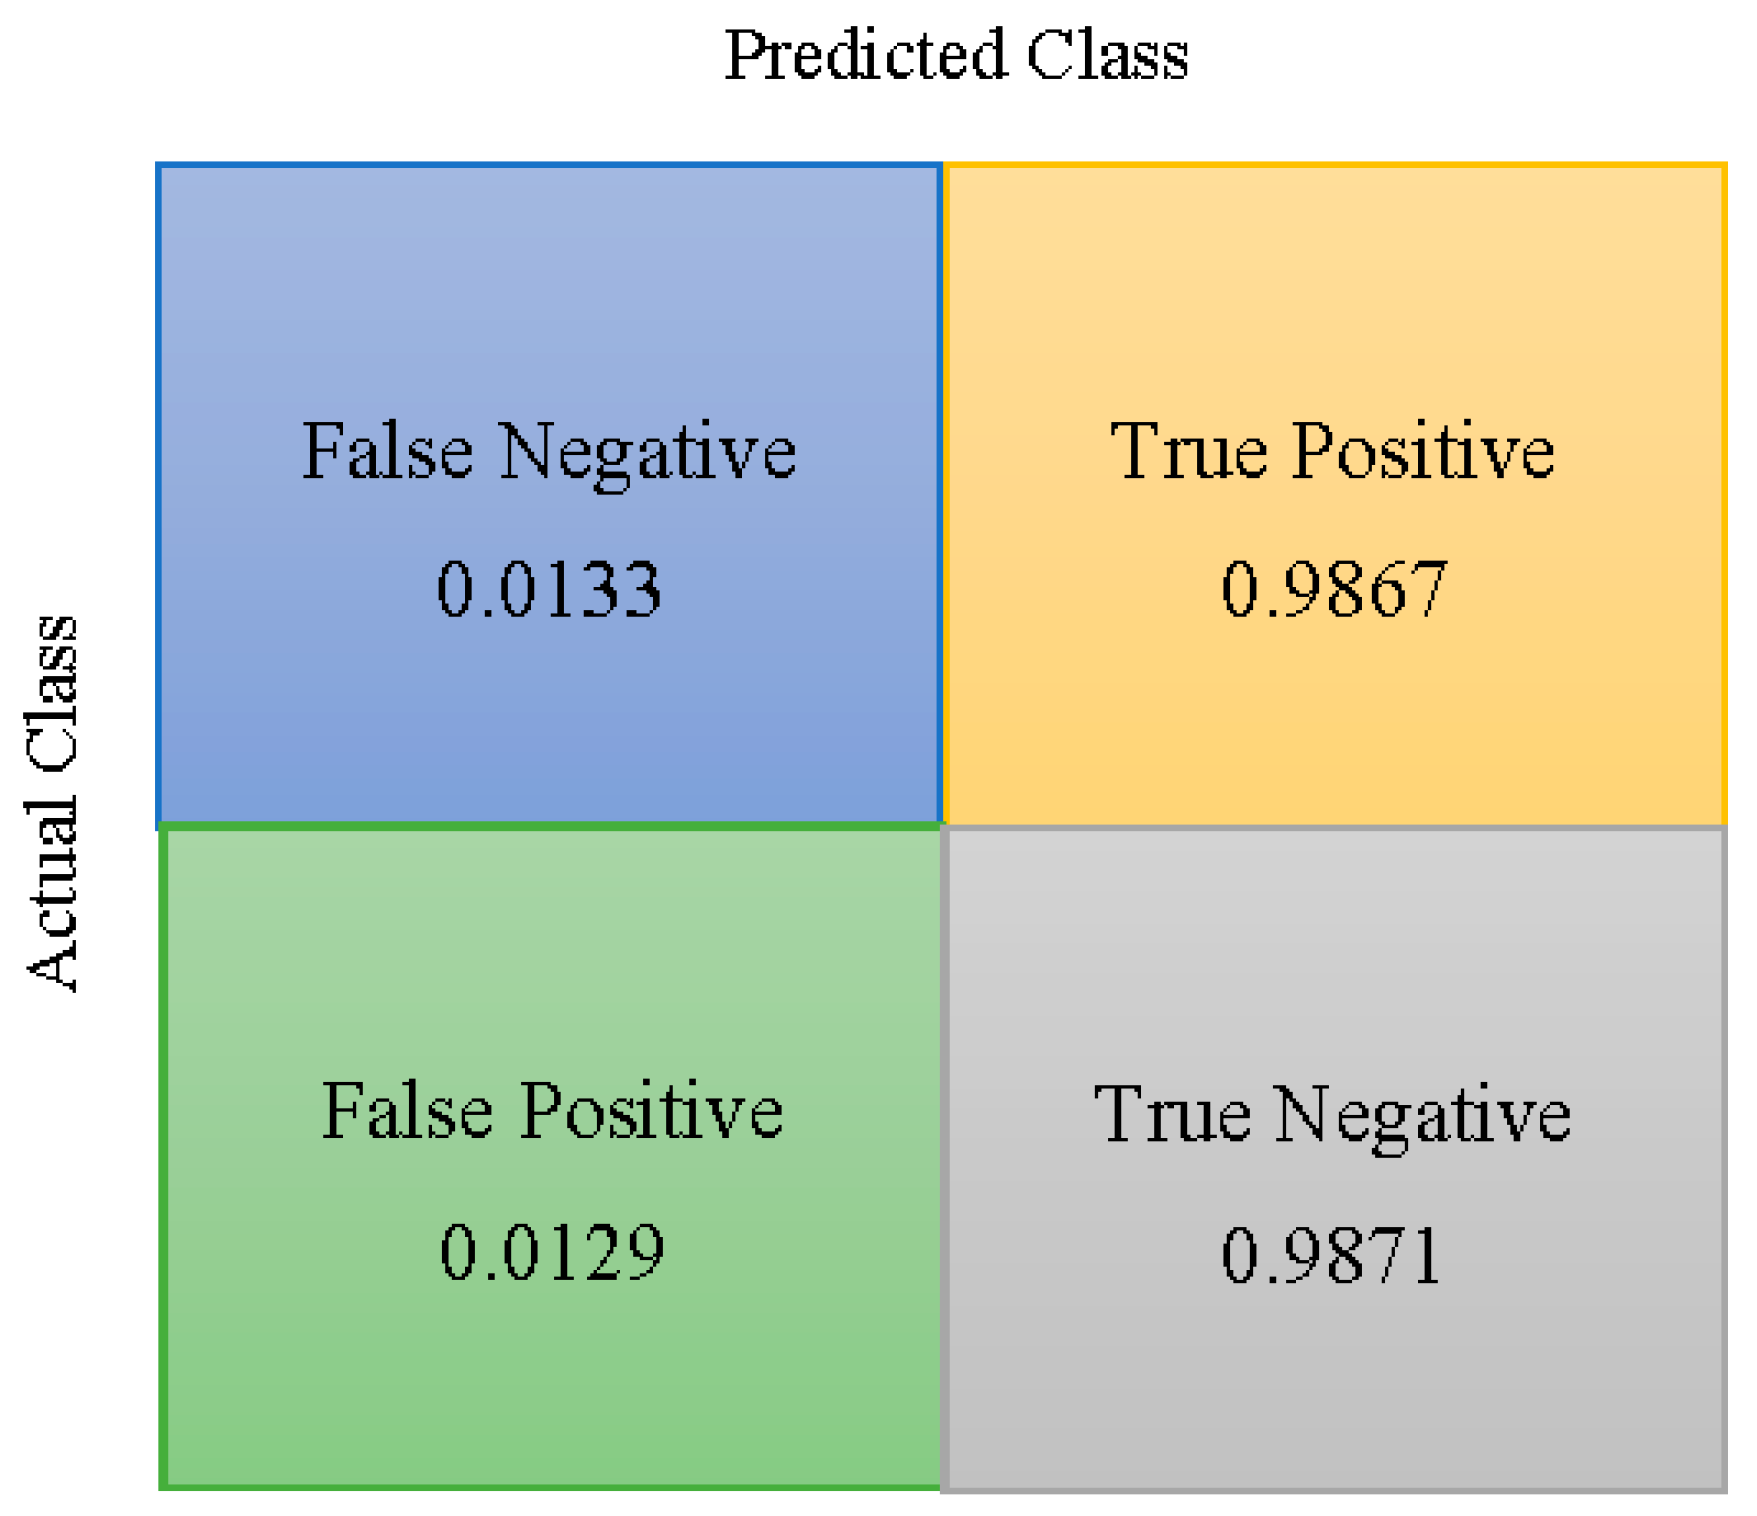
This experiment evaluates the computation result using the parameters, such as accuracy, specificity, sensitivity, and F-score. These parameters are achieved using True Positive (TP), False Positive (FP), True Negative (TN), False Negative (FN) derived from the confusion matrix in Figure 7. Equation (15) to Equation (19) represents the computing formula of these five performance parameters from the value of confusion metrics.
Accuracy   ( ACC ) = TP + TN TP + TN + FP + FN .
Specificity   ( SP ) = TN TN + FP
Sensitivity   ( SE ) = TP TP + FN
Precision   ( PR ) = TP TP + FP
F score   ( Fs ) = 2 × SE × PR SE + PR
This method is trained using a leveled training dataset of promising image quality. In performance validation, the proposed method used ultrasound test data set with varying resolution and speckle to some extent. To extract meaningful features, detail preservation is the prerequisite along with noise filtering. The test data sets usually go through a pre-processing with modified anisotropic diffusion filtering and super-resolution technique. The performance of filtering can be measured using three evaluation metrics [42], such as; signal to noise ratio (SNR), Edge preservation factors (EPF), Minimum square error (MSE). The higher the SNR means the more noise reduction using the filtering techniques. The higher edge preservation (EPF) result makes it clear that the filtering technique is efficient in detail preservation. Less MSE indicates the minimum error between the input image and filtered image. From Table 1, it is clear that all the existing filtering are good in MSE, but the SNR and EPF are comparatively better in our modified filtering technique.
Noise filtering sometimes hides significant information about the image. This will limit the feature extraction techniques suffering from meaningful details. The super-resolution technique is a good choice to achieve flexible detail from the filtered images. This research investigated the three well-developed SR techniques on varying scales. Among these, the proposed model achieves better results for the learning-based SR technique. Calculating performance results the deep SR outperforms superiority in evaluation criteria. The quantitative performance is measured using PSNR and SSIM for all the three SR modal. The larger the PSNR values generally indicate the better method. Table 2 shows that the learning-based SR technique obtains a better result on our simulated dataset.
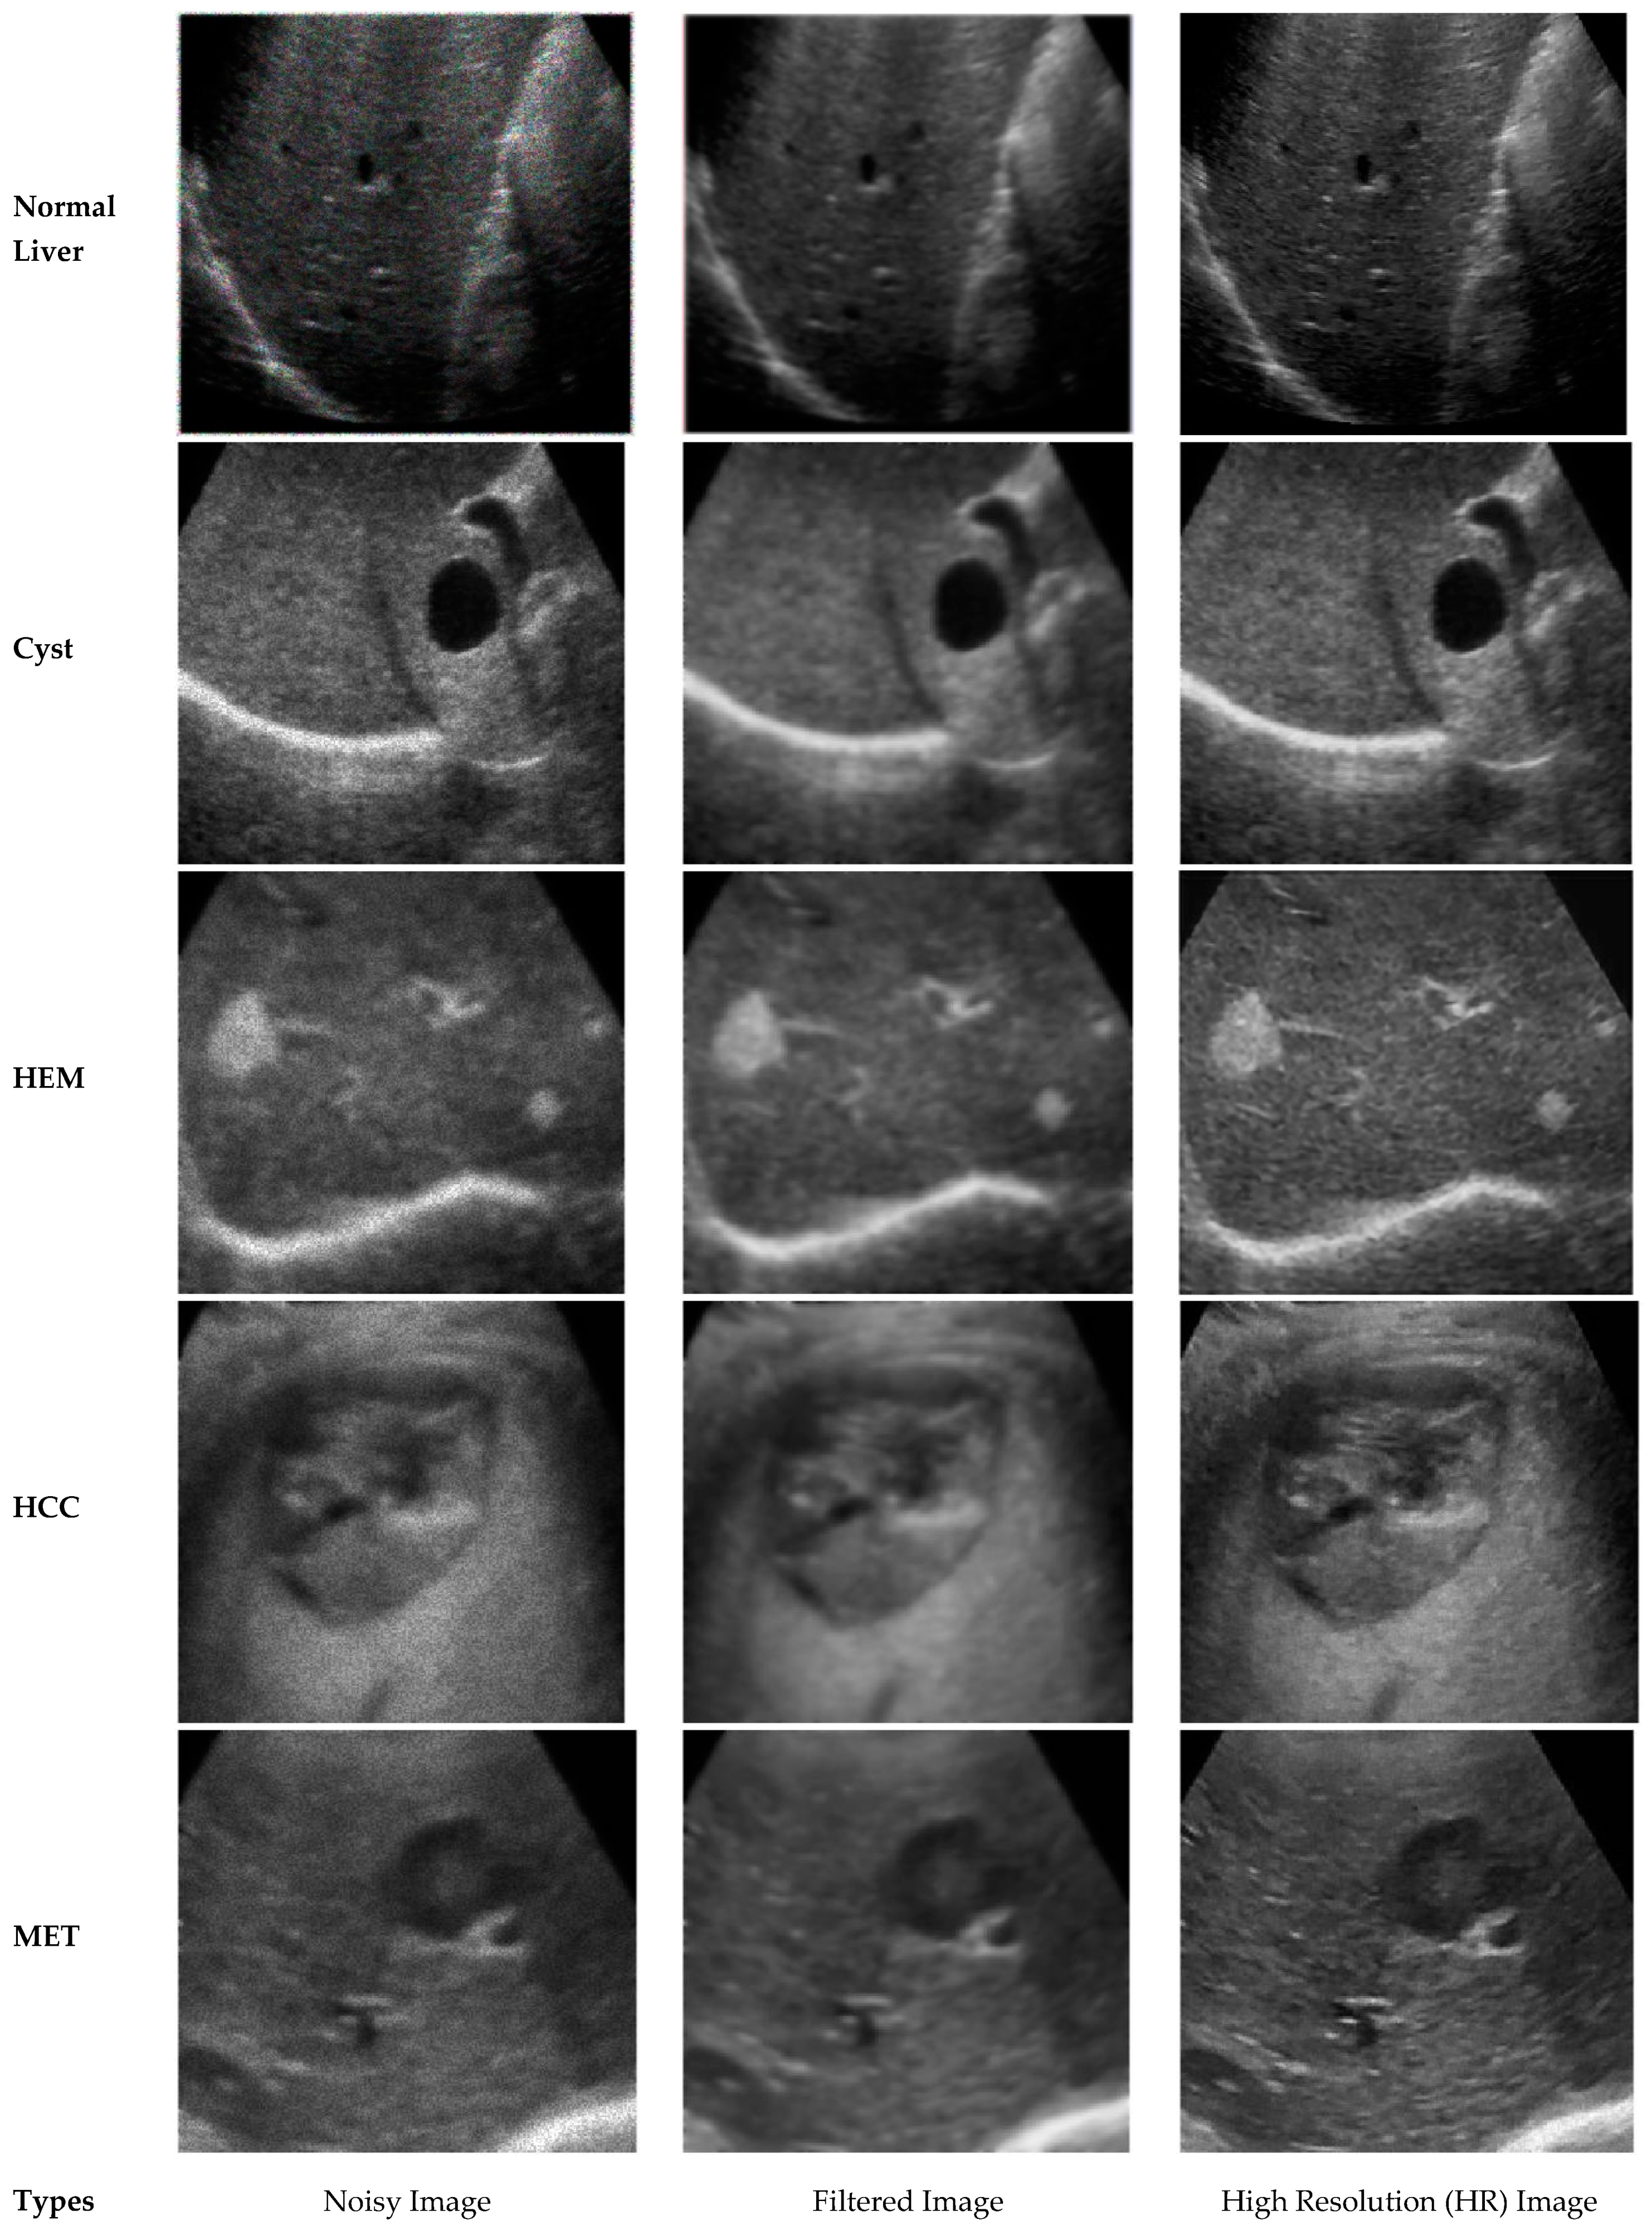
This research detects liver lesions against the normal liver. The lesion class includes four lesion types such as Cyst, HEM, HCC, MET. This research has no attempt to classify between the lesion types, rather it has just combined the four types of the lesion as a one lesion class and classifies with a normal liver image. The proposed method observed the classification result both for noisy and artifact image and filtered preprocessed images. The noise variance is added between 0.001 to 0.004 into the test image with varying resolution and artifacts. A modified anisotropic diffusion is applied to each of the test images with an edge-preserving technique while takes as input. Applying a learnable SR technique improves the classification accuracy from 95.02% to 98.40%. Figure 8 illustrates the visual quality improvement in SR image. The noisy image and artifact sometimes mislead the diagnosis using ultrasound. Again after filtering it may obscure the necessary details of ultrasound for being over smoothing low resolution (LR) image. The super resolution (SR) techniques successfully overcome this problem in most cases by achieving the high resolution (HR) images. This high resolution ultrasound images are considered for patch collection and then feature extraction.
This exploratory analysis attempted to find the best CNN model for feature extractor. Working on the training and test data the fine-tuned VGG19 performs better as a pre-trained model. Table 3 presents the comparative study of different CNN pre-trained models on our experiment data. All of the CNN models use a uniform benchmark dataset in training and the preprocessed test dataset is also identical to examine the performance of all those models. For the difference of the fine-tuned model, we have just changed the classifier head and train the layers of the desired model. However, this study has also computed the performance of a few scratch models, but the performance peak is not like fine-tuned models as well. These models use SVM classifiers in the classification schemes to evaluate detection accuracy. Extracted training features fed to SVM for training. Test features are extracted from the preprocessed test images to measure the performance of CNN models.
After a deep investigation, this study has selected the fine-tuned VGG19 as the pre-trained model for the feature extractor using CNN. While experimenting with the fine-tuned ResNet50 and the fine-tuned VGG19 compete in terms of performance metrics. Finally, VGG19 has achieved better accuracy for our preprocessed test dataset, although ResNet50 shows higher sensitivity.
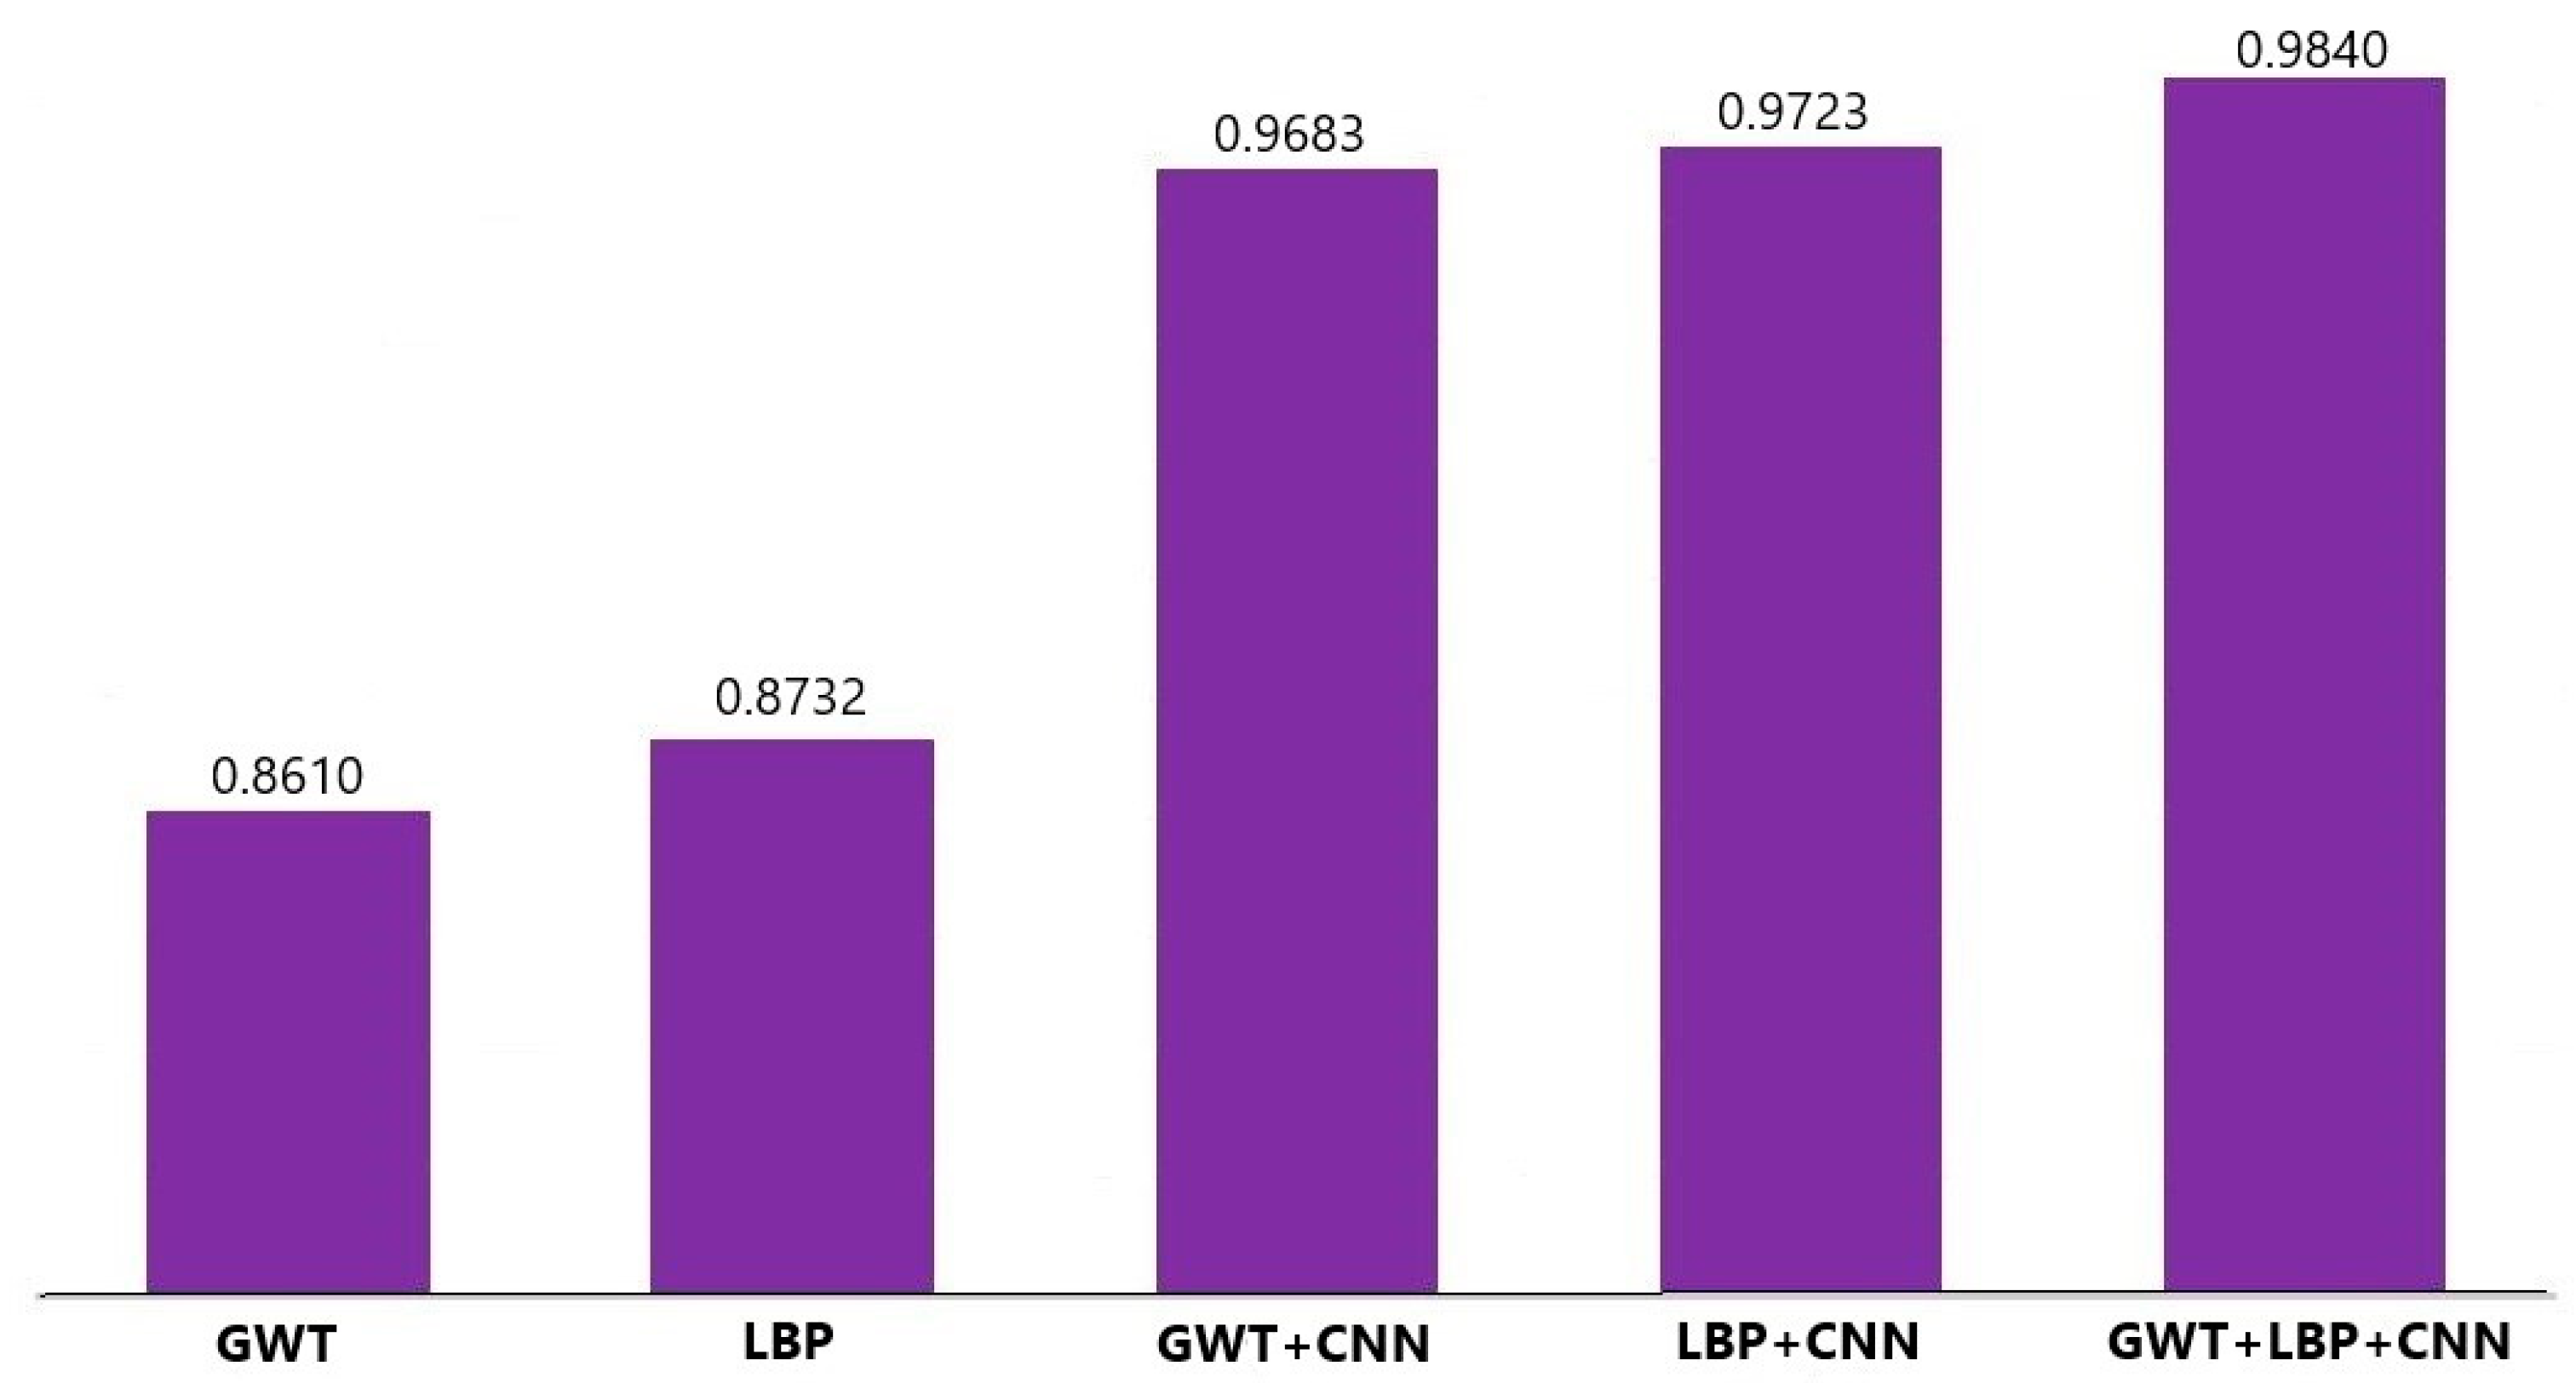
GWT and LBP textural features are extracted for the training benchmark dataset and preprocessed test dataset. This forms the local textural features set both for the training as well as a test vector. These textural features and CNN features are fused into a fusion vector. This fusion is considered for the final training and test vector. The training vector deploys to train the SVM. The experiment outcomes using different combinations of feature fusion is tabulated in Table 4. The proposed fused feature shows optimal performance in our final classification result.
Table 4 indicates the prior performance of the proposed fused feature than a single fusion. The performance evolution with noisy and sparse test data before any preprocessing is very crucial in this study. While preprocessing is absent from the test data set, the performance is measured both for the proposed fused features and CNN only. The impact of filtering and SR techniques on the classification result is comprehensive from Table 5.
The exploratory analysis was performed on several classification model besides SVM classifier to find the best suited one. Among them Decision Tree (DT), K nearest Neighbor (KNN), Artificial Neural Network (ANN), and Random Forest (RF) show satisfactory results. All the classifiers have been evaluated using the proposed feature vector. The KNN and DT shows some misleading result in case of medical image such as ultrasound. This misclassification can be overcome by introducing RF classification. Moreover, ANN shows better accuracy compare to the DT and KNN, but the false positive rate is still high. Finally, SVM outperforms all of them and the comparison result is tabulated in Table 6.
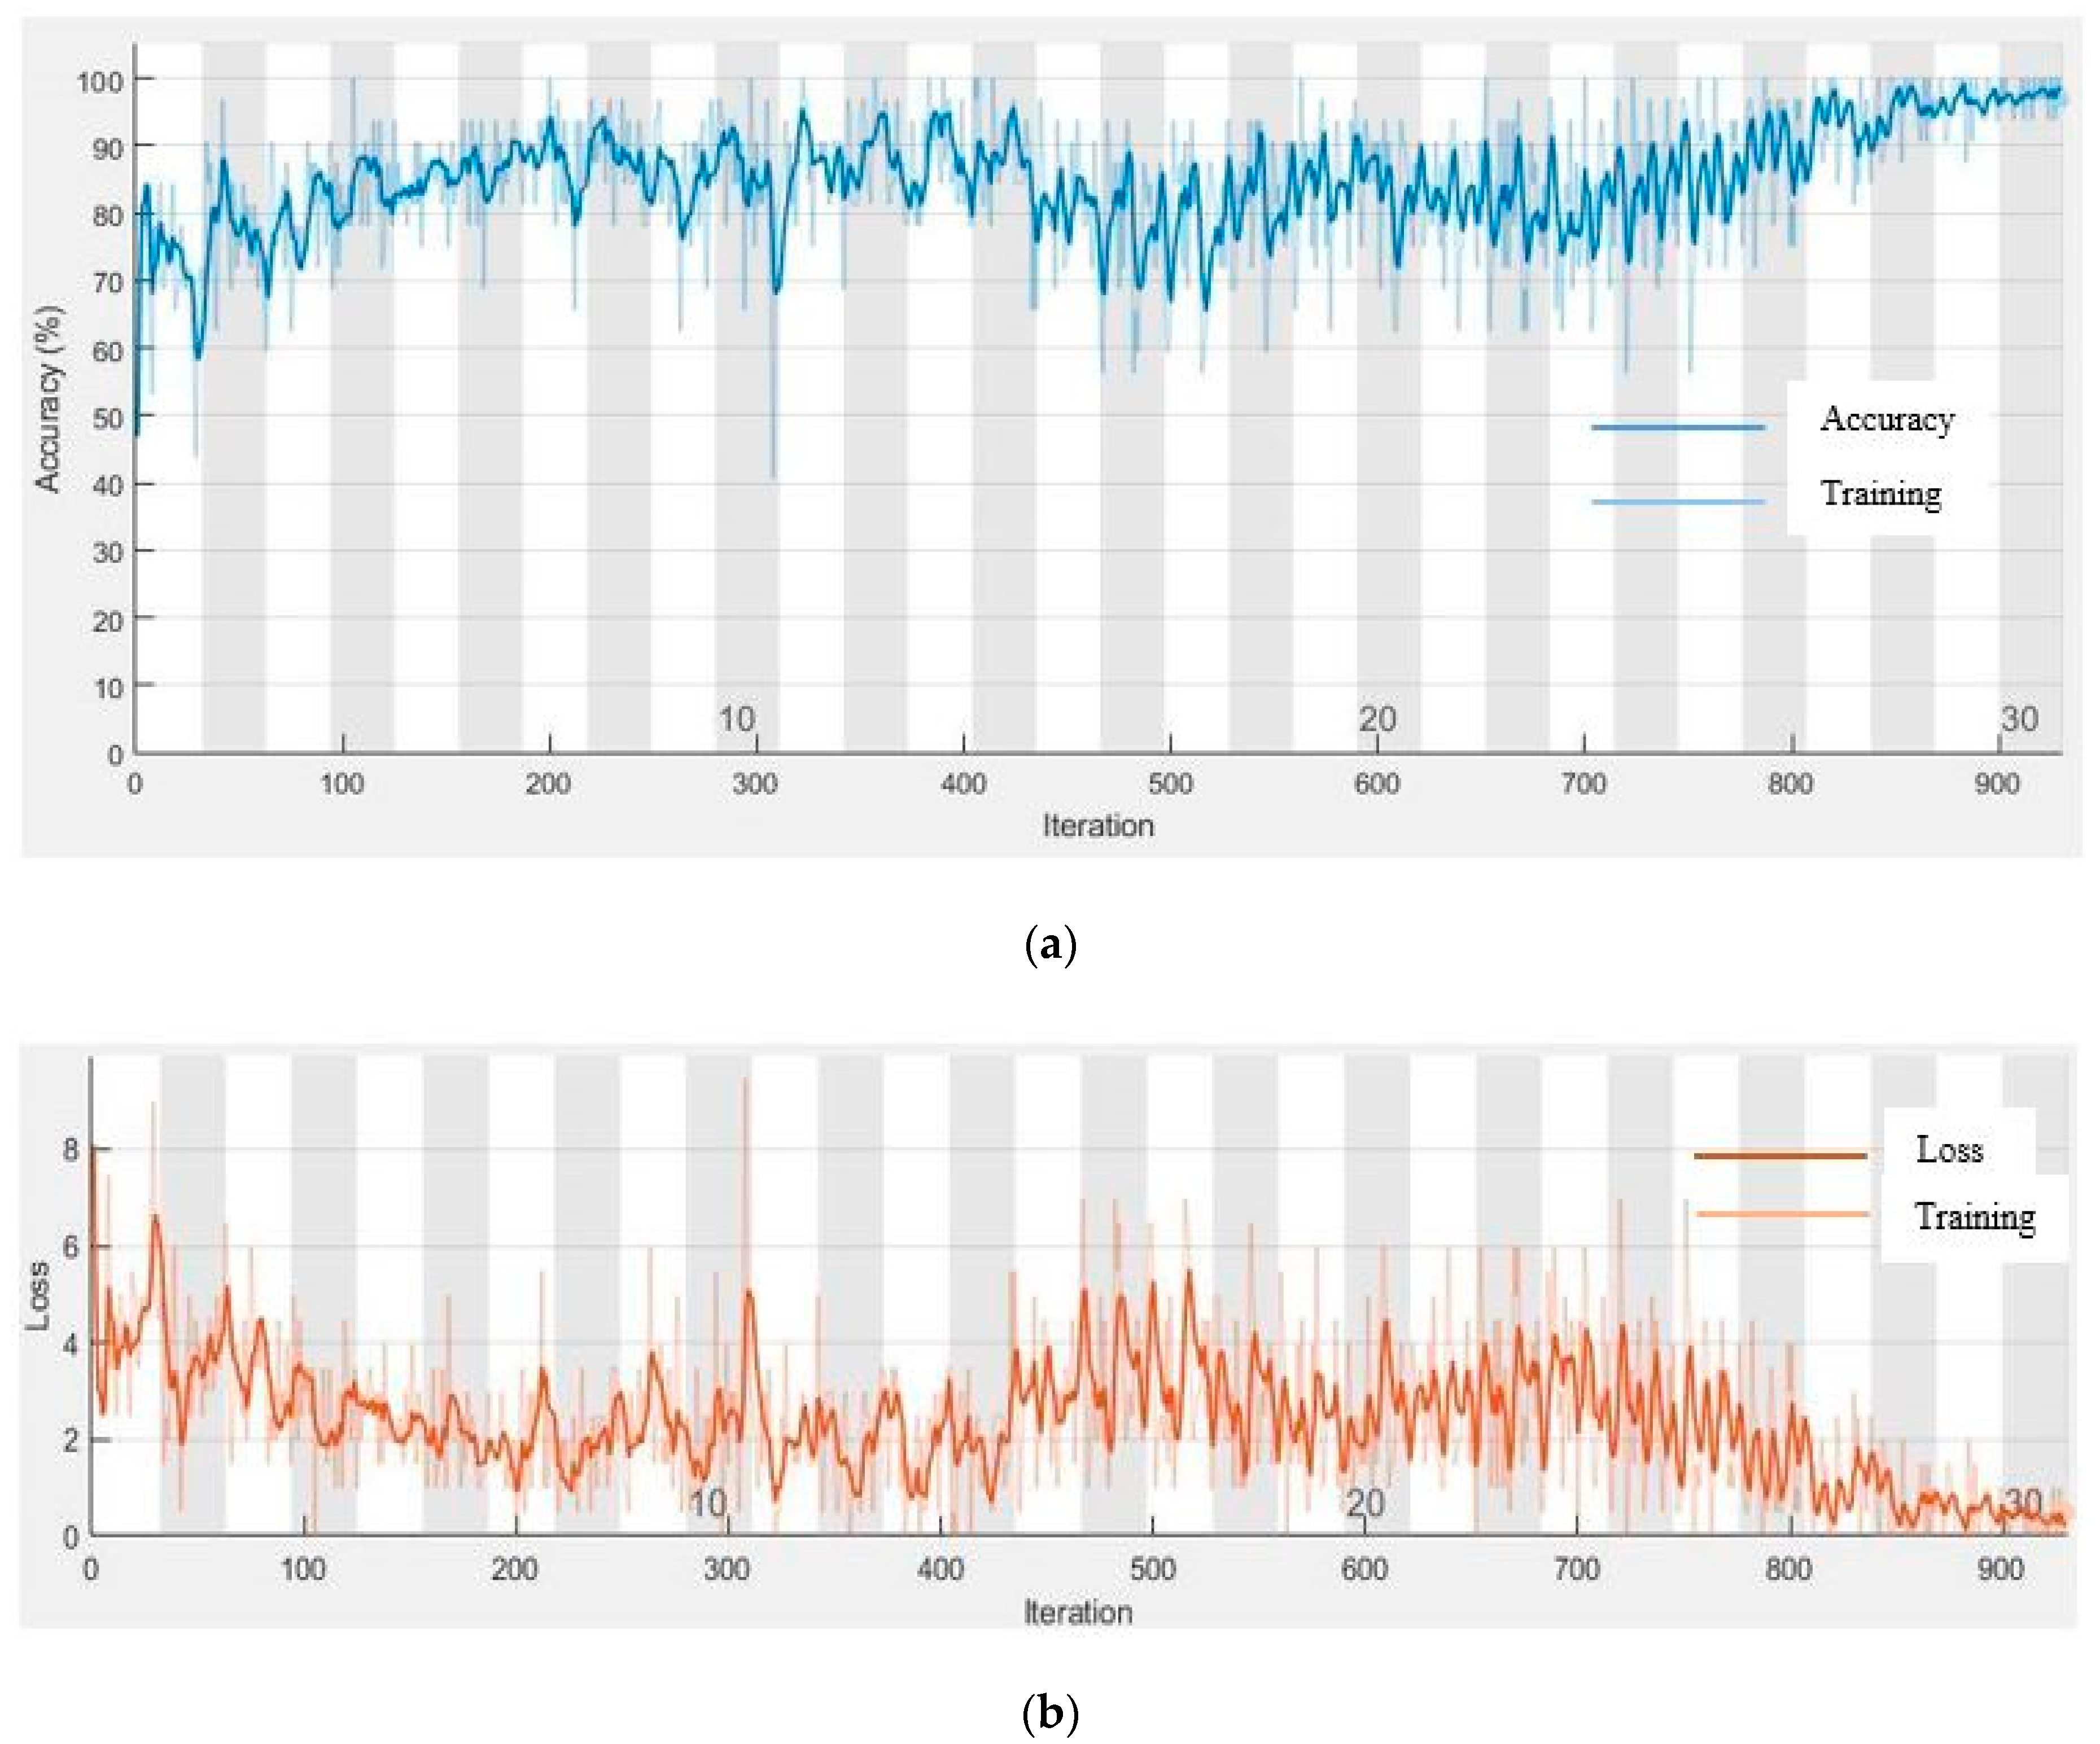
Accuracy vs. Epoch curve is plotted in Figure 9a. This is the clear evidence of no overfitting situation with very close training and accuracy curves. The learning rate starts from 0.001 with mini-batch size 64 and 36 epochs. The loss curve is depicted in Figure 9b indicating a little amount of lost value.

4. Discussion

The proposed technique is less submissive by the curse of drawbacks for the ultrasound. The speckle noise and artifact effect has successfully minimized in ultrasound images. Again, a learnable SR technique has lessened the blurring effect of over smoothness for noise filtering. Thus, the preprocessing for input test images is vital to make our proposed feature fusion system more reliable. The experiment result has observed performance falls without prepossessing of noise filtering and the SR technique. SR reconstruction has played a remarkable role to dig the necessary details.
The majority of the works in the literature review faced difficulties for the ultrasound image quality. This impact will reduce mostly generalization performance. The proposed method used the academic torrent ultrasound image dataset for generalization purposes. This dataset is previously unseen and unknown for this model. For generalization, we have used 6000 patches containing 4000 normal ultrasounds and 2000 lesion affected. The confusion metrics of the generalization results are demonstrated in Table 7. Among 2000 patches, only 176 lesion patches are miss-detected. The wrong detection rate is also a minimum for the normal liver as a liver lesion which achieves the generalization accuracy of 90.66%.
The main key challenge of this research was the limitation of ultrasound image quality mentioned in various literature. This work can address this problem by filtering the ROI of test image and then reconstruct using a learnable SR technique. Another significant work is image patch collection as considering all the patches will make the execution slower. The patches are derived from input ROI using the size of 224 × 224 for stride of (30,30). The informative patches are collected using the Bayes rule for the reference object. In addition, those selected patches are only considered for the feature extraction process. This will make our training process and hence the proposed method faster. The computation time is recorded and compared using Table 8.
Table 8 represents the recorded time for the selected patch approach and the conventional patch extraction approach. For each ROI this patch selection approach selects less than 100 informative patches. It will take on average 10.0371 s for the patches of each ROI to train while the conventional approach requires more times to process large number of extracted patches.
The accurate comparison is a very laborious task as all the existing methods are not done using the same datasets and machine facilities. However, there are some common characteristics for ultrasound dataset. Now, it is important to select the efficient techniques which are best suited to lessen the drawbacks, extract meaningful features, and classify the ultrasound images. The proposed method performed a deep study on noise filtering and image reconstruction with important details. Many relevant pieces of literature are compared in Table 9.
The proposed method of CNN and local textural feature fusion performed better using the SVM classifier shown in Table 9. Here, SVM shows better performance as a binary classifier for noisy and sparse ultrasound data. It is also less affected by the dimensionality of feature characteristics. The preprocessing of input test image is very crucial to obtain this performance. This will result in suppressing the limitation of test image and improve the generalization performance.
The k-cross validation is performed to obtain more embodied experimental result. After feature extraction step, SVM classifier is trained by the 5-fold cross validation with notable iteration. In this approach the feature vector is randomly split into 5 sub sets. One single sub set is selected for testing purpose while remaining others are used to train the SVM. This training and testing sets are picked randomly and thus the accuracy is changed in every steps. Each steps of proposed method are presented in Table 10.
Table 10 shows the accuracy result of each fold for the fusion of VGG19 CNN model and textural feature. The feature fusion of CNN with a single feature extraction method always reach the accuracy more than 96%. Finally, the proposed method obtains the accuracy of 98.40%. Figure 10 presents the accuracy graph of different fusion method. This suggests that proposed fusion method performed really better than a single fusion method of this study.
This research performed some inspection by human expert and the proposed CAD system using the same datasets. However, it is very laborious task to accurately investigate a large number of image patches in an open eye. Here, only some confusing image patches are selected for testing by the human inspection and proposed CAD system. Figure 11a shows a misdetection of liver lesion as a normal liver by human expert. However, this proposed approach can detect correctly for liver lesion. Again, Figure 11b is wrongly detected by human expert and proposed approach. Figure 11c represents the misdetection of CAD system but correctly detected by human expert.

5. Conclusions

This article presents a CAD system for focal lesion detection in ultrasound image. The exploratory analysis is conducted through a learnable SR technique to obtain high frequency detail and thus achieve a promising accuracy. The pre-trained fine-tuned model of CNN outperforms existing machine vison-based expert systems for lesion detection. The proposed textural feature fusion with CNN has improved the performance with accuracy of 98.40%. SVM classifier has been proven to be the best fitted in this model for lesion diagnosis in liver ultrasound. This classification is done between the normal liver ultrasound and focal liver lesion. An attempt to evaluate this method to classify among various lesion types would also be interesting. Future work will be extended in classification of lesion classes after the acquisition of sufficient leveled data.

Author Contributions

Conceptualization, M.M.R.; Data curation, R.M. and A.K.M.K.I.; Formal analysis, M.M.R. and A.K.M.K.I.; Investigation, A.K.M.K.I.; Methodology, R.M.; Project administration, M.M.R.; Software, R.M.; Supervision, M.M.R. and S.B.; Writing—original draft, R.M.; Writing—review & editing, A.K.M.K.I. and S.B. All authors have read and agreed to the published version of the manuscript.

Funding

This research received no external funding.

Conflicts of Interest

The authors declare no conflict of interest.

References

  1. Key Statistics about Liver Cancer. Available online: https://www.cancer.org/cancer/liver-cancer/about/what-is-key-statistics.html (accessed on 16 April 2020).
  2. Shajahan, B.; Sudha, S. Hepatic Tumor Detection in Ultrasound Images. In Proceedings of the 2nd International Conference on Devices, Circuits and Systems (ICDCS), Coimbatore, India, 6–8 March 2014; pp. 1–5. [Google Scholar]
  3. Xu, S.S.-D.; Chang, C.-C.; Su, C.-T.; Phu, P.Q. Classification of Liver Diseases Based on Ultrasound Image Texture Features. Appl. Sci. 2019, 9, 342. [Google Scholar] [CrossRef] [Green Version]
  4. Brattain, L.J.; Telfer, B.A.; Dhyani, M.; Grajo, J.R.; Samir, A.E. Machine learning for medical ultrasound: Status, methods, and future opportunities. Abdom. Radiol. 2018, 43, 786–799. [Google Scholar] [CrossRef]
  5. Jabarulla, M.Y.; Lee, H.-N. Computer Aided Diagnostic System for Ultrasound Liver Images: A Systematic Review. Optik 2017, 140, 1114–1126. [Google Scholar] [CrossRef]
  6. Mittal, D.; Kumar, V.; Saxena, S.C.; Khandelwal, N.; Kalra, N. Neural Network Based Focal Liver Lesion Diagnosis Using Ultrasound Images. Comput. Med. Imaging Graph. 2011, 35, 315–323. [Google Scholar] [CrossRef] [PubMed]
  7. Virmani, J.; Kumar, V.; Kalra, N.; Khandelwa, N. PCA-SVM Based CAD System for Focal Liver Lesions Using B-Mode Ultrasound Images. Def. Sci. J. 2013, 63, 478–486. [Google Scholar] [CrossRef]
  8. Li, S.; Kwok, J.T.; Zhu, H.; Wang, Y. Texture Classification Using the Support Vector Machines. Pattern Recognit. 2003, 36, 2883–2893. [Google Scholar] [CrossRef]
  9. Hassan, T.M.; Elmogy, M.; Sallam, E.-S. Diagnosis of Focal Liver Diseases Based on Deep Learning Technique for Ultrasound Images. Arab. J. Sci. Eng. 2017, 42, 3127–3140. [Google Scholar] [CrossRef]
  10. Balasubramanian, D.; Srinivasan, P.; Gurupatham, R. Automatic Classification of Focal Lesions in Ultrasound Liver Images Using Principal Component Analysis and Neural Networks. In Proceedings of the 29th Annual International Conference of the IEEE Engineering in Medicine and Biology Society, Lyon, France, 23–26 August 2007; pp. 2134–2137. [Google Scholar]
  11. Kalyan, K.; Jakhia, B.; Lele, R.D.; Joshi, M.; Chowdhary, A. Artificial Neural Network Application in the Diagnosis of Disease Conditions with Liver Ultrasound Images. Adv. Bioinform. 2014, 2014, 1–14. [Google Scholar] [CrossRef] [Green Version]
  12. Xian, G. An Identification Method of Malignant and Benign Liver Tumors from Ultrasonography Based on GLCM Texture Features and Fuzzy SVM. Expert Syst. Appl. 2010, 37, 6737–6741. [Google Scholar] [CrossRef]
  13. Jeon, J.H.; Choi, J.Y.; Lee, S.; Ro, Y.M. Multiple ROI selection based focal liver lesion classification in ultrasound images. Expert Syst. Appl. 2013, 40, 450–457. [Google Scholar] [CrossRef]
  14. Virmani, J.; Kumar, V.; Kalra, N.; Khandelwal, N. A Comparative Study of Computer-Aided Classification Systems for Focal Hepatic Lesions from B-Mode Ultrasound. J. Med. Eng. Technol. 2013, 37, 292–306. [Google Scholar] [CrossRef]
  15. Virmani, J.; Kumar, V.; Kalra, N.; Khandelwal, N. Neural Network Ensemble Based CAD System for Focal Liver Lesions from B-Mode Ultrasound. J. Digit. Imaging 2014, 27, 520–537. [Google Scholar] [CrossRef] [Green Version]
  16. Hwang, Y.N.; Lee, J.H.; Kim, G.Y.; Jiang, Y.Y.; Kim, S.M. Classification of Focal Liver Lesions on Ultrasound Images by Extracting Hybrid Textural Features and Using an Artificial Neural Network. Bio-Med. Mater. Eng. 2015, 26, S1599–S1611. [Google Scholar] [CrossRef] [PubMed] [Green Version]
  17. Rahmat, R.O.; Zamrin, D.M. Components and Implementation of a Picture Archiving and Communication System in a Prototype Application. Rep. Med. Imaging 2019, 12, 1–8. [Google Scholar]
  18. Petrusca, L.; Cattin, P.; De Luca, V.; Preiswerk, F.; Celicanin, Z.; Auboiroux, V.; Viallon, M.; Arnold, P.; Santini, F.; Terraz, S. Hybrid Ultrasound/Magnetic Resonance Simultaneous Acquisition and Image Fusion for Motion Monitoring in the Upper Abdomen. Investig. Radiol. 2013, 48, 333–340. [Google Scholar] [CrossRef] [Green Version]
  19. De Luca, V.; Tschannen, M.; Szekely, G.; Tanner, C. A Learning-based Approach for Fast and Robust Vessel Tracking in Long Ultrasound Sequences. In Proceedings of the International Conference on Medical Image Computing and Computer-Assisted Intervention, Nagoya, Japan, 22–26 September 2013; pp. 518–525. [Google Scholar]
  20. Zhao, Z.; Elgammal, A. A Statistically Selected Part-Based Probabilistic Model for Object Recognition. In Proceedings of the International Workshop on Intelligent Computing in Pattern Analysis and Synthesis, Xi’an, China, 26–27 August 2006; pp. 95–104. [Google Scholar]
  21. Shorten, C.; Khoshgoftaar, T.M. A Survey on Image Data Augmentation for Deep Learning. J. Big Data 2019, 6, 60. [Google Scholar] [CrossRef]
  22. Scherzer, O. Handbook of Mathematical Methods in Imaging; Springer Science & Business Media: Berlin, Germany, 2010. [Google Scholar]
  23. Perona, P.; Malik, J. Scale-space and edge detection using anisotropic diffusion. IEEE Trans. Pattern Anal. Mach. Intell. 1990, 12, 629–639. [Google Scholar] [CrossRef] [Green Version]
  24. Yu, Y.; Acton, S.T. Speckle Reducing Anisotropic Diffusion. IEEE Trans. Image Process. 2002, 11, 1260–1270. [Google Scholar]
  25. Krissian, K.; Westin, C.-F.; Kikinis, R.; Vosburgh, K.G. Oriented Speckle Reducing Anisotropic Diffusion. IEEE Trans. Image Process. 2007, 16, 1412–1424. [Google Scholar] [CrossRef]
  26. Ramos-Llordén, G.; Vegas-Sánchez-Ferrero, G.; Martin-Fernandez, M.; Alberola-López, C.; Aja-Fernández, S. Anisotropic Diffusion Filter with Memory Based on Speckle Statistics for Ultrasound Images. IEEE Trans. Image Process. 2014, 24, 345–358. [Google Scholar] [CrossRef] [Green Version]
  27. Tsai, R. Multiframe Image Restoration and Registration. Adv. Comput. Vis. Image Process. 1984, 1, 317–339. [Google Scholar]
  28. Irani, M.; Peleg, S. Motion Analysis for Image Enhancement: Resolution, Occlusion, and Transparency. J. Vis. Commun. Image Represent. 1993, 4, 324–335. [Google Scholar] [CrossRef] [Green Version]
  29. Patti, A.J.; Sezan, M.I.; Tekalp, A.M. Superresolution Video Reconstruction with Arbitrary Sampling Lattices and Nonzero Aperture Time. IEEE Trans. Image Process. 1997, 6, 1064–1076. [Google Scholar] [CrossRef]
  30. Rasti, P.; Orlova, O.; Tamberg, G.; Ozcinar, C.; Nasrollahi, K.; Moeslund, T.B.; Anbarjafari, G. Improved Interpolation Kernels for Super Resolution Algorithms. In Proceedings of the Sixth International Conference on Image Processing Theory, Tools and Applications (IPTA), Oulu, Finland, 12–15 December 2016; pp. 1–6. [Google Scholar]
  31. Zhang, L.; Wu, X. An Edge-Guided Image Interpolation Algorithm via Directional Filtering and Data Fusion. IEEE Trans. Image Process. 2006, 15, 2226–2238. [Google Scholar] [CrossRef] [PubMed] [Green Version]
  32. Freeman, W.T.; Liu, C. Markov Random Fields for Super-Resolution and Texture Synthesis. Adv. Markov Random Fields Vis. Image Process. 2011, 1, 3. [Google Scholar]
  33. Yang, J.; Wright, J.; Huang, T.S.; Ma, Y. Image Super-Resolution via Sparse Representation. IEEE Trans. Image Process. 2010, 19, 2861–2873. [Google Scholar] [CrossRef]
  34. Dong, C.; Loy, C.C.; He, K.; Tang, X. Learning a Deep Convolutional Network for Image Super-Resolution. In Proceedings of the European Conference on Computer Vision, Zurich, Switzerland, 6–12 September 2014; pp. 184–199. [Google Scholar]
  35. Mostafiz, R.; Rahman, M.M.; Uddin, M.S. Gastrointestinal polyp classification through empirical mode decomposition and neural features. SN Appl. Sci. 2020, 2, 1–10. [Google Scholar] [CrossRef]
  36. Ahmadian, A.; Mostafa, A.; Abolhassani, M.D.; Salimpour, Y. A Texture Classification Method for Diffused Liver Diseases Using Gabor Wavelets. In Proceedings of the 2005 IEEE Engineering in Medicine and Biology 27th Annual Conference, Shanghai, China, 1–4 September 2006; pp. 1567–1570. [Google Scholar]
  37. Liu, H.; Jiang, H.; Xia, B.; Yi, D. The Research of Feature Extraction Method of Liver Pathological Image Based on Multispatial Mapping and Statistical Properties. Comput. Math. Methods Med. 2016, 2016, 8. [Google Scholar] [CrossRef] [PubMed] [Green Version]
  38. Simonyan, K.; Zisserman, A. Very Deep Convolutional Networks for Large-Scale Image Recognition. arXiv, 2014; arXiv:1409.1556. [Google Scholar]
  39. Mostafiz, R.; Hasan, M.; Hossain, I.; Rahman, M.M. An Intelligent System for Gastrointestinal Polyp Detection in Endoscopic Video Using Fusion of Bidimensional Empirical Mode Decomposition and Convolutional Neural Network Features. Int. J. Imaging Syst. Technol. 2020, 30, 224–233. [Google Scholar] [CrossRef]
  40. Burges, C.J. A Tutorial on Support Vector Machines for Pattern Recognition. Data Min. Knowl. Discov. 1998, 2, 121–167. [Google Scholar] [CrossRef]
  41. Akter, M.; Rahman, A.; Islam, A.K. An Improved method of Automatic Exudates Detection in Retinal Images. Int. J. Innov. Res. Electr. Electron. Instrum. Control Eng. 2014, 2, 1514–1516. [Google Scholar]
  42. Mostafiz, R.; Rahman, M.M.; Kumar, P.M.; Islam, M.A. Speckle noise reduction for 3D ultrasound images by optimum threshold parameter estimation of bi-dimensional empirical mode decomposition using Fisher discriminant analysis. Int. J. Signal Imaging Syst. Eng. 2018, 11, 93–101. [Google Scholar] [CrossRef]
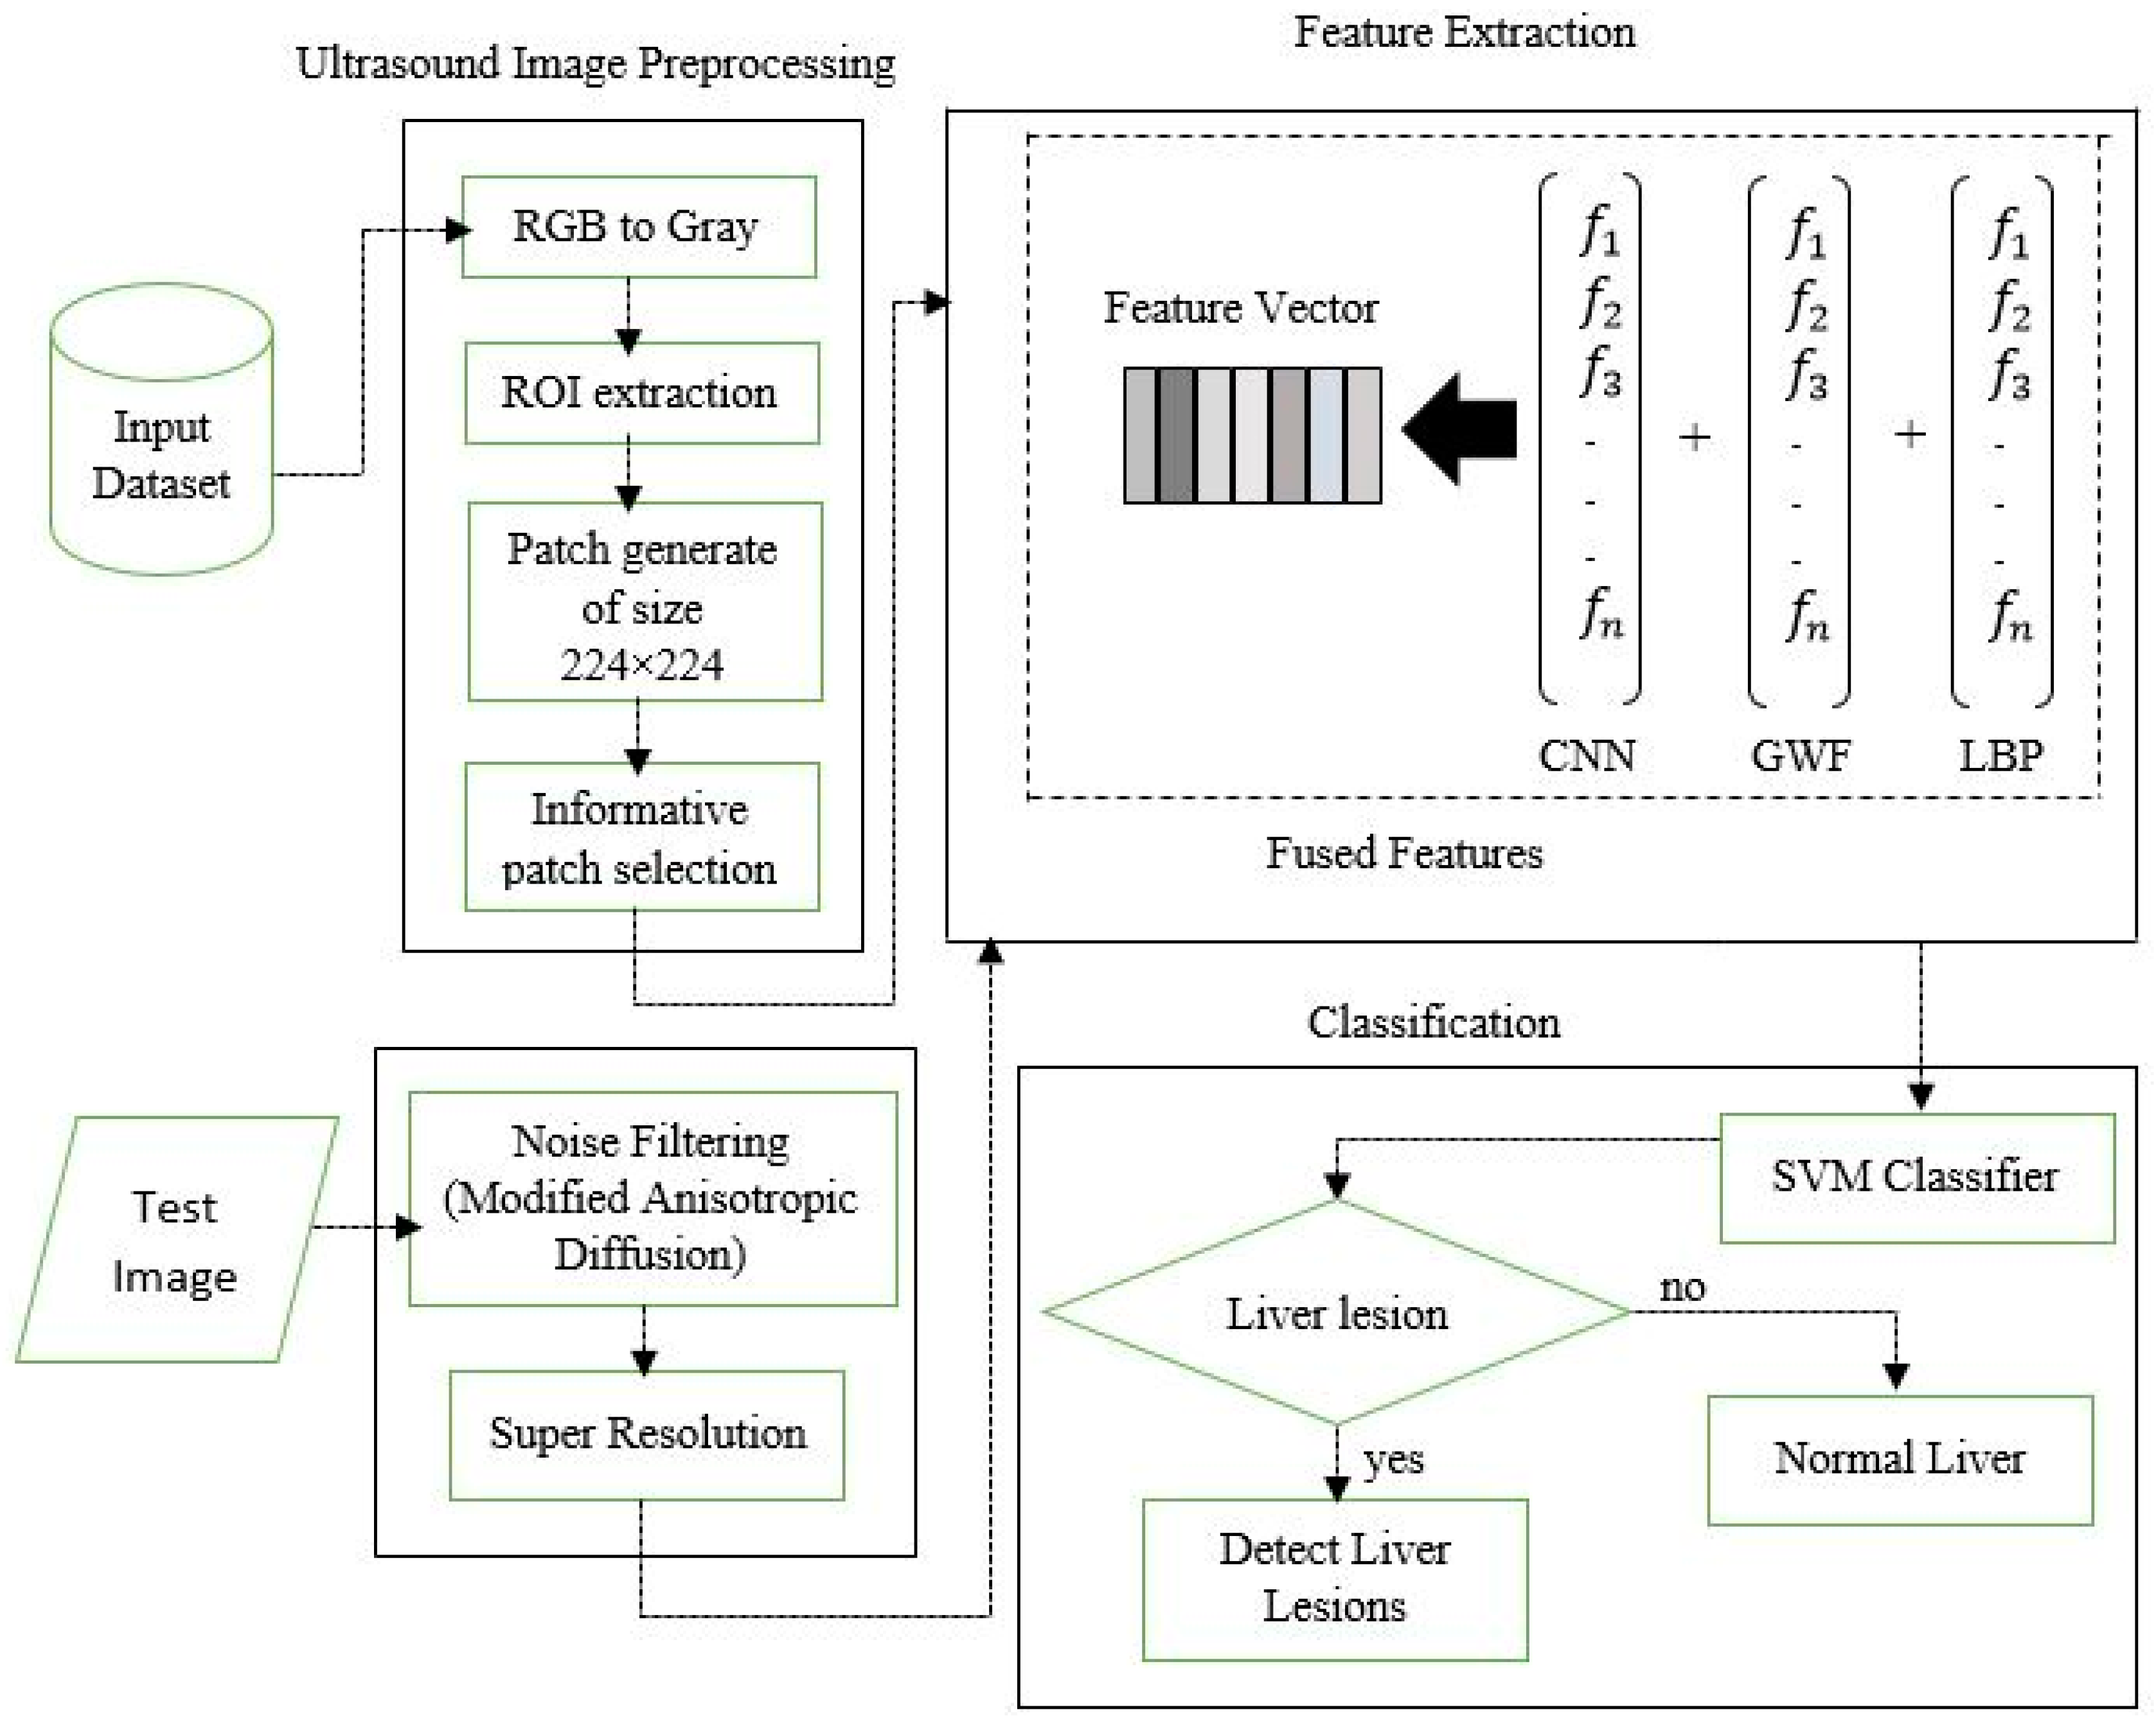
Figure 1. Diagram of our working approach.
Make 02 00010 g001
Figure 2. Image data processing: (a) Original input image; (b) Extract region of interest; (c) Patch collection from image; (d) Candidate patch selection using Bayes rule.
Make 02 00010 g002
Figure 3. Anisotropic diffusion techniques: (a) Original input image; (b) Speckle affected image; (c) Modified anisotropic diffusion; (d) SRAD; (e) OBNLM; (f) ADMSS.
Make 02 00010 g003
Figure 4. Super Resolution techniques: (a) Input filter image; (b) Residual image; (c) Reference image; (d) Learning-based SR image; (e) Interpolation-based SR image; (f) Reconstruction-based SR image.
Make 02 00010 g004
Figure 5. Illustration of fine-tuned VGG19 pre-trained CNN model.
Make 02 00010 g005
Figure 6. Output image with marked lesion: (a) all marked patches with center and radius (b) Final lesion region.
Make 02 00010 g006
Figure 7. Confusion Matrix.
Make 02 00010 g007
Figure 8. Ultrasound image processing for test dataset.
Make 02 00010 g008
Figure 9. Learning curves: (a) Accuracy vs. Epoch (b) Loss vs. Epoch.
Make 02 00010 g009
Figure 10. Accuracy graph of different fusion methods.
Make 02 00010 g010
Figure 11. (a) Misdetection by human but correctly detected by proposed system. (b,c) Misdetection by human expert and proposed approach.
Make 02 00010 g011
Table 1. Performance evaluation of various anisotropic diffusion base filtering technique.
MethodsEvaluation Criteria
SNREPFMSE
SRAD [22]33.36830.73180.6784
OBLMN [23]31.23610.70570.6850
ADMSS [24]32.08540.72980.6964
Ours modified anisotropic filtering37.16870.98220.6391
Table 2. Comparative study of super resolution froe different scales and parameters.
Super Resolution TechniquesScalePSNRSSIM
Interpolation-based SR [26]232.36760.8154
327.77830.7564
426.56390.6893
Reconstruction-based SR [27]232.47870.8395
329.32440.8330
427.56910.7321
Learning-based SR233.73590.8674
329.96040.8071
428.56320.7470
Table 3. Comparative study of different CNN model.
CNN ModelsAccuracySensitivitySpecificityF-Value
Scratch Model0.82940.81670.84210.8271
Alexnet0.92850.91720.93970.9276
VGG160.93610.94170.93050.9364
ResNet500.94830.94690.94970.9496
VGG190.95180.94090.96280.9591
Table 4. Comparison results of feature fusion.
Feature CombinationAccuracySensitivitySpecificity
GWT0.86100.86380.8581
LBP0.87320.88500.8613
GWT + CNN0.96830.97080.9658
LBP + CNN0.97230.97490.9697
Proposed fusion (GWT + LBP + CNN)0.98400.98670.9812
Table 5. Classification result without preprocessing of test data.
MethodsAccuracySensitivitySpecificityF-Value
CNN only0.90730.91520.89940.9138
Proposed fusion0.95020.95780.94260.9571
Table 6. Classification using different classifier models.
Classifier ModelsAccuracySensitivitySpecificityFalse Positive RateFalse Negative Rate
DT0.89790.90310.87260.09690.1274
KNN0.92030.92570.91490.08510.0743
RF0.96110.97060.95210.04790.0294
ANN0.96180.98590.93750.06250.0141
SVM0.98400.98670.98120.01290.0133
Table 7. Confusion matrix obtained from generalization.
True Label Predict Label
Liver LesionNormal Liver
Liver Lesion(TP) 1824(FN) 176
Normal Liver(FP) 383(TN) 3617
Table 8. Computation time between the selected patch and conventional patch extraction for each ROI.
MethodNumber of PatchesTime (s)
Informative patch selectionless than 10010.0371
Conventional patch extraction700–900120.021
Table 9. Comparison among existing method of focal liver lesion detection.
PapersDatasetMethodsResults
Virmani [7]108 ultrasoundTexture features + PCA + SVMAccuracy = 87.2%
Sakr [8]150 ultrasoundHL texture + Histogram + Multi-SVMAccuracy = 96.11%
Hassan [9]110 ultrasoundSSAE + Softmax classifierAccuracy = 97.2%
Balasubramanian [10]160 ultrasoundGabor + GLCM + PCA + NPNAccuracy = 90%
Kalyan [11]60 ultrasoundGLRLM + ANNAccuracy = 92.5%
Xian [12]400 ultrasoundGLCM+FSVMAccuracy = 97.0%
Jeon [13]150 ultrasoundStatistical features + SVMAccuracy 80%
Virmani [14]108 ultrasoundTexture features + PCA + BPNNAccuracy = 87.7%
Virmani [15]108 ultrasoundTexture ratio features + PCA + NNAccuracy = 95%
Hwang [16]512 ultrasoundHybrid textural features + PCA + feed-forward NNAccuracy = 96%
Proposed Method298 ultrasoundGWT + LBP + CNN + SVMAccuracy = 98.40%
Table 10. Accuracy measure using 5-fold cross validation.
MethodsFold 1Fold 2Fold 3Fold 4Fold 5Mean Accuracy
GWT0.85720.86750.85210.86430.86380.8610
LBP0.87320.87890.87410.86740.87300.8732
GWT + CNN0.96810.97490.96280.96850.96730.9683
LBP + CNN0.97510.97390.97040.97090.97130.9723
Proposed fusion (GWT + LBP + CNN)0.98820.98470.98130.98270.98330.9840