Explainable Artificial Intelligence for Human Decision Support System in the Medical Domain
Abstract
:1. Introduction
2. Literature Review
2.1. Explainable Artificial Intelligence in Machine Learning
2.2. Explainable Artificial Intelligence in the Medical Field
3. Background
3.1. Black-Box Predictions
- Transparency: A model is considered transparent if it is understandable on its own, which usually applies to easily interpretable models [30]. Simpler machine learning models tend to be more transparent and are thus inherently more interpretable due to their simple structure, such as models built with linear regression.
- Interpretability: The ability to describe or provide meaning that is clear to humans is known as interpretability. Models are considered interpretable if they are described in a way that can be further explained, such as through domain awareness [31]. The concept behind interpretability is that the more interpretable a machine learning system is, the easier it is to define cause–effect relationships between the inputs and outputs of the system [32].
- Explainability: Explainability is more closely linked to the machine learning system’s dynamics and internal logic. While a model is training or making decisions, the more explainable it is, the greater the human understanding of the internal procedures [32].
3.2. Explainable Artificial Intelligence (XAI)
3.3. LIME, SHAP and CIU
4. XAI Methods
4.1. LIME
4.2. SHAP
4.3. CIU
4.4. Grad-CAM
5. Methodology
5.1. Image Data Set
5.2. Implementation of the Black-Box Model
5.3. Explainability
5.3.1. LIME Explanations
5.3.2. SHAP Explanations
5.3.3. CIU Explanations
6. Human Evaluation User Study
6.1. Data Collection
6.2. Study Description and Design of the User Study
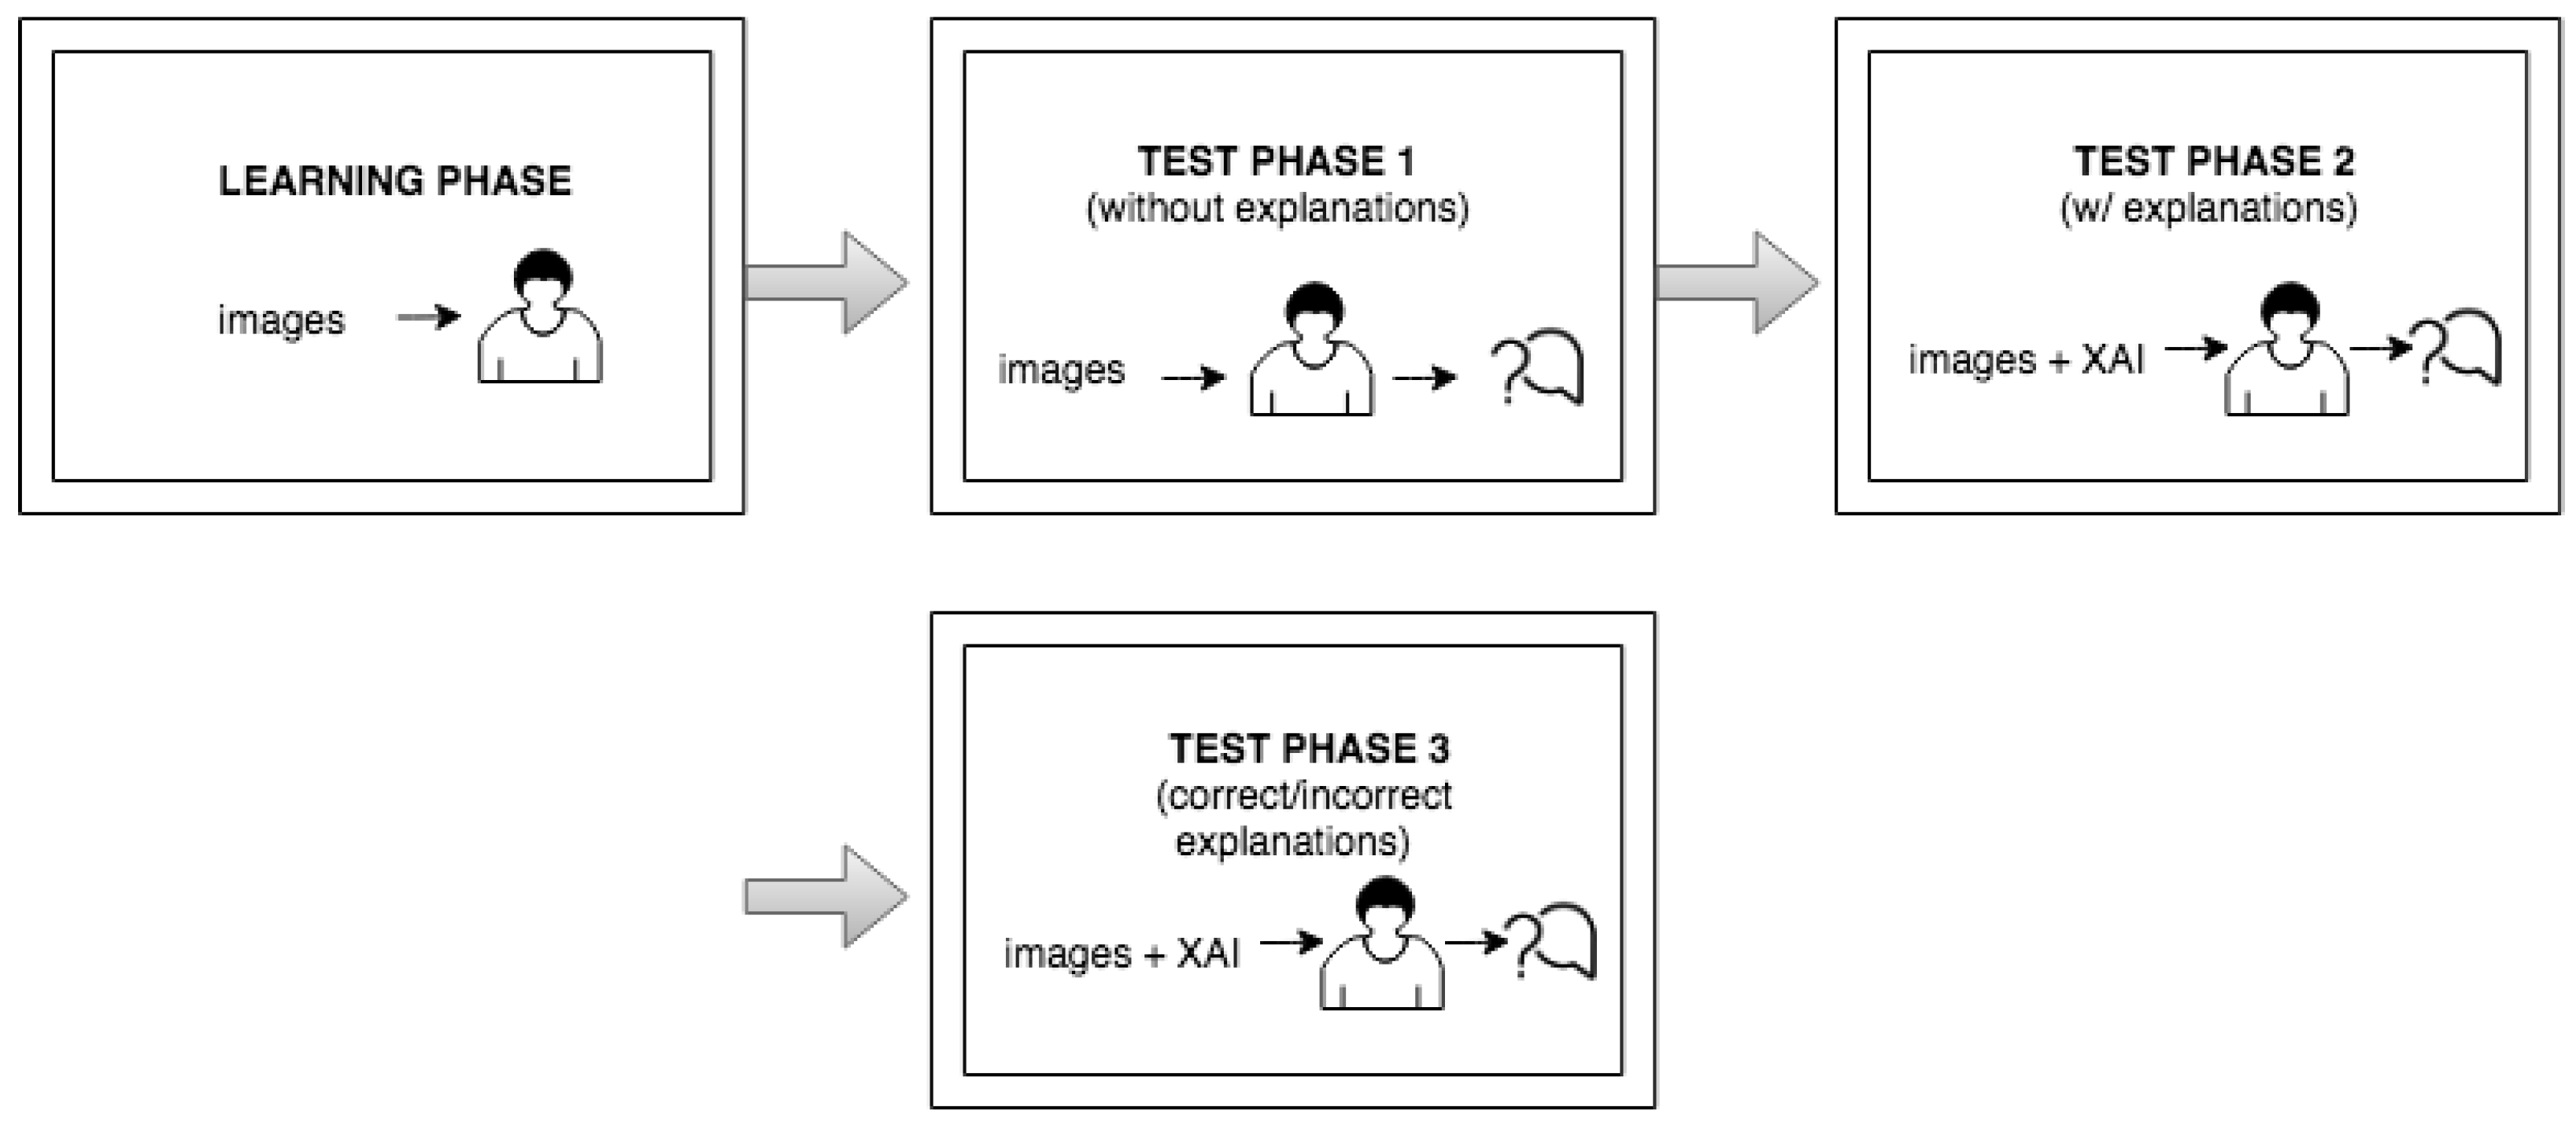
- In the first stage, we presented the selected medical images to the study participants and provided them with the essential information, both verbally and in the form of written instructions, for completing the study.
- After the users were familiarized with the required instructions, the user study was carried out under the supervision of one of the researchers, who was responsible for the control of the study process.
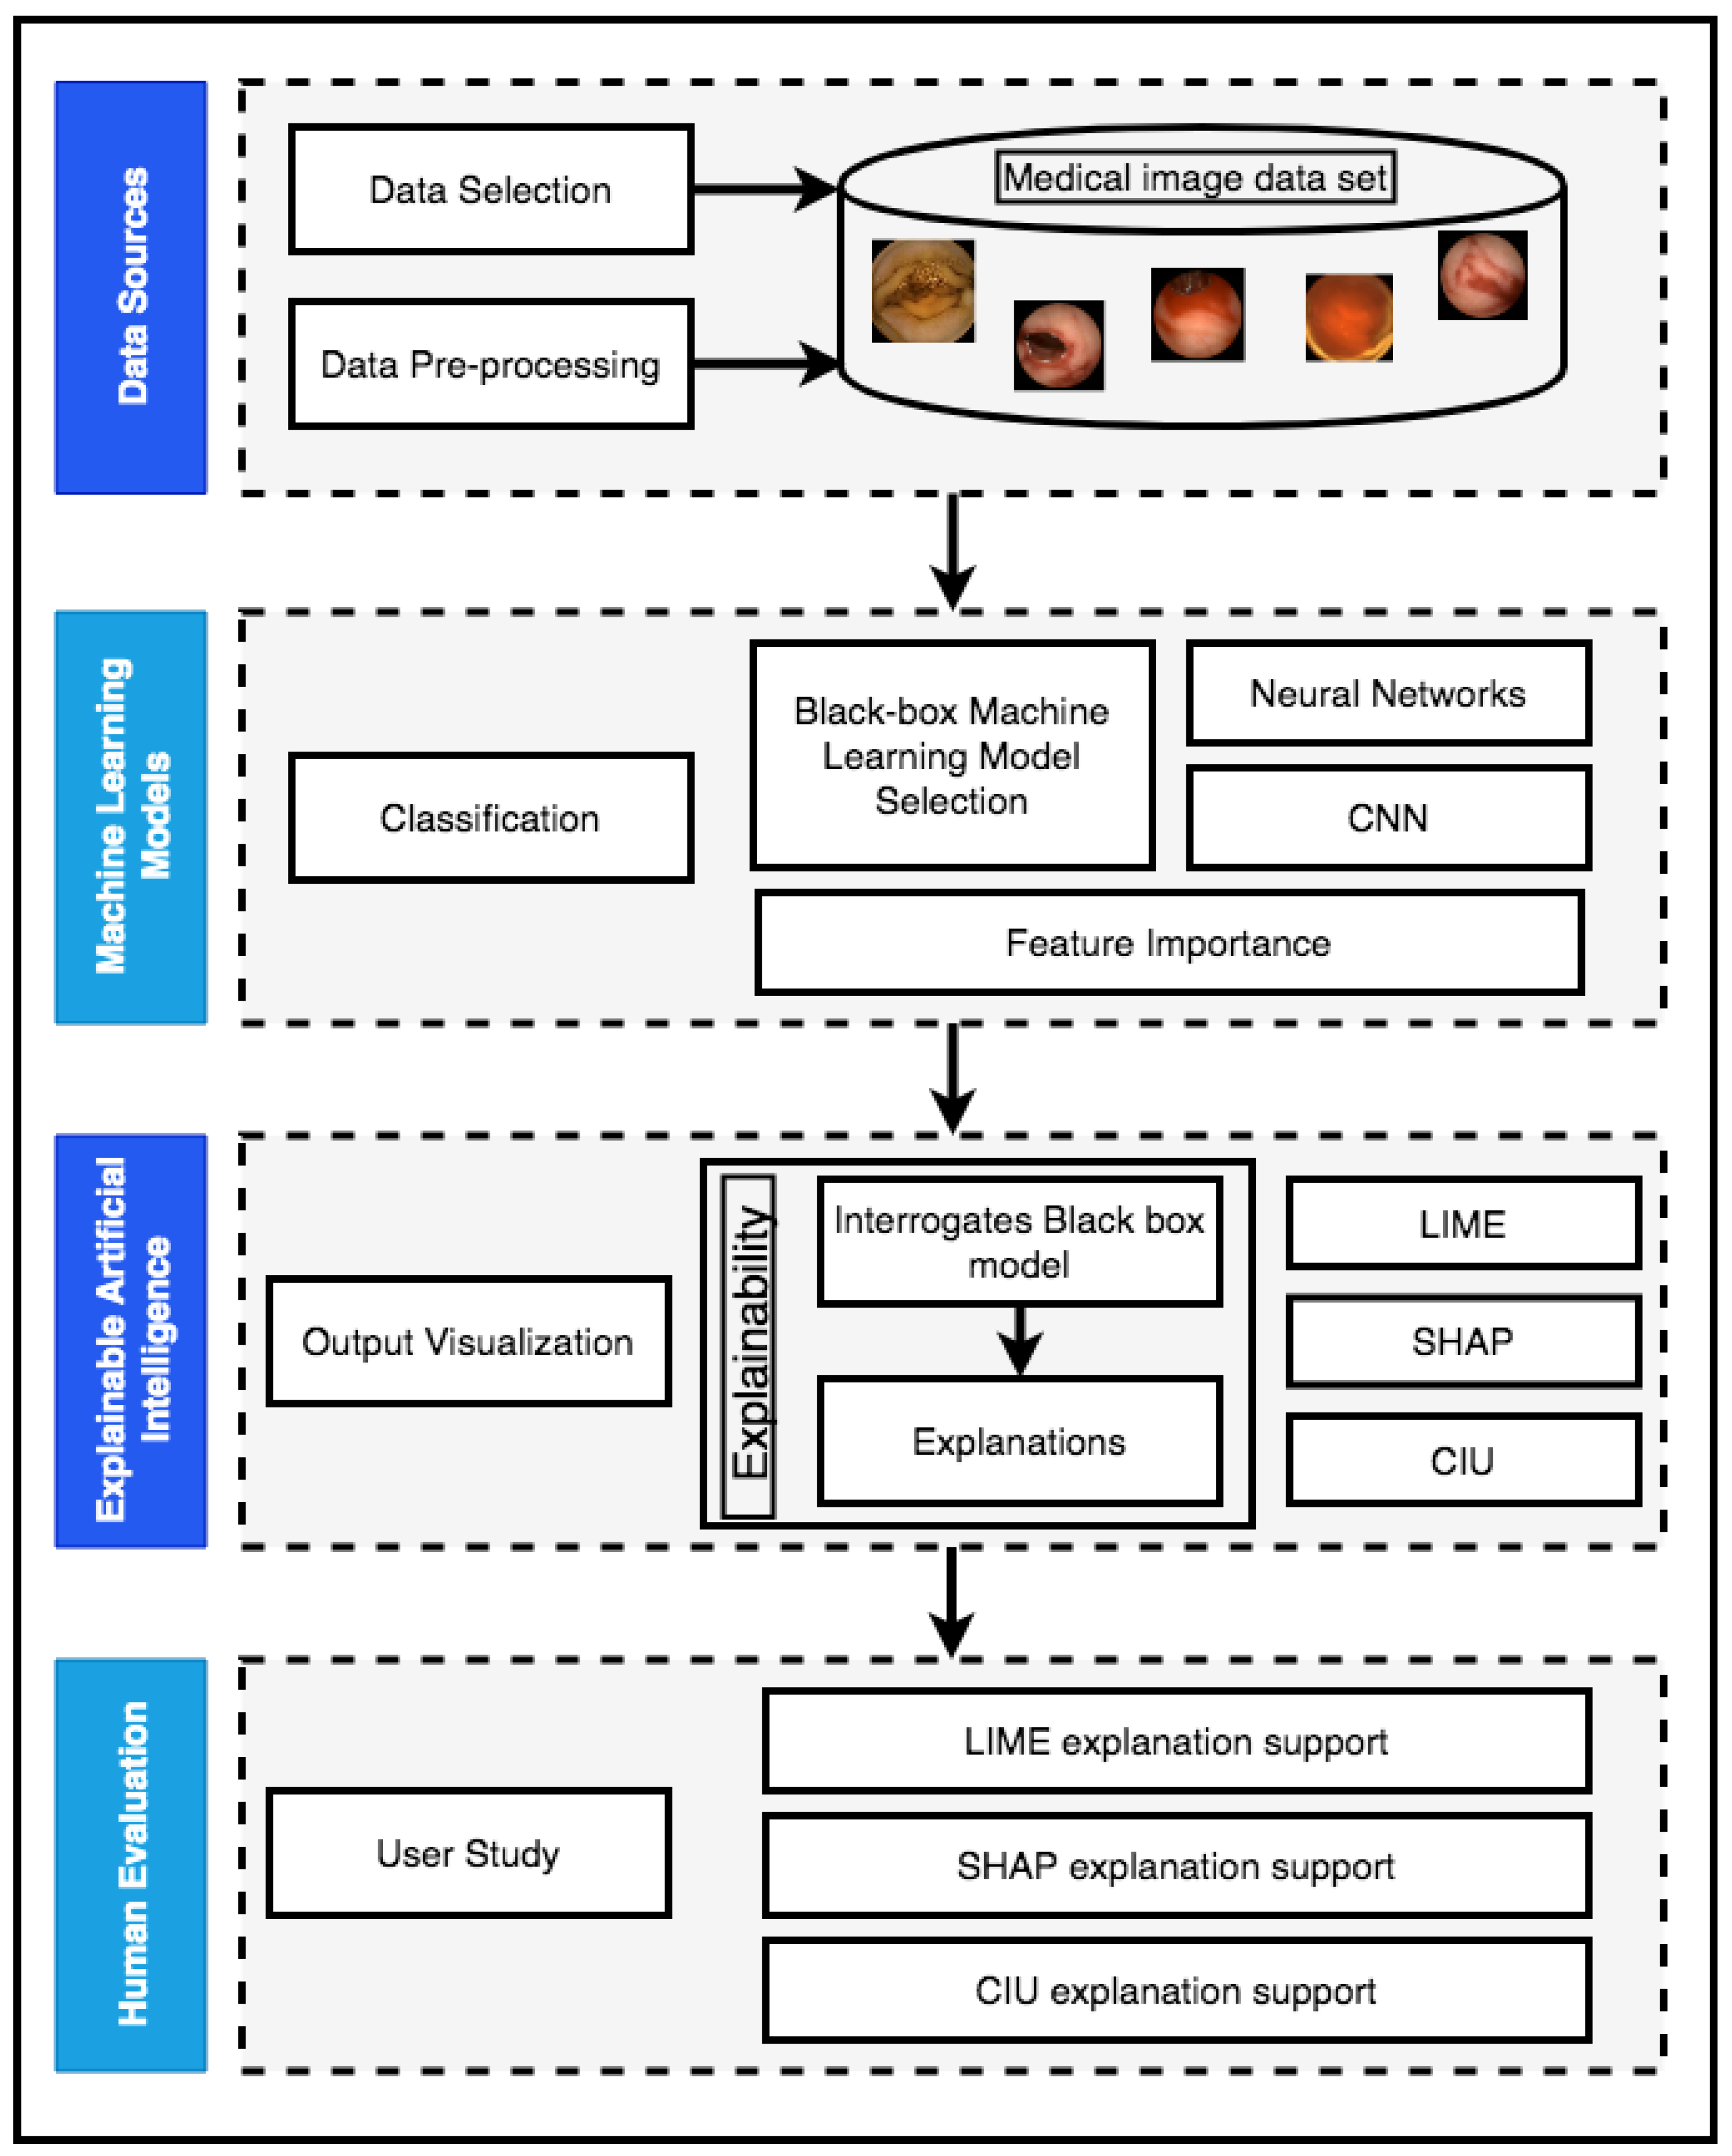
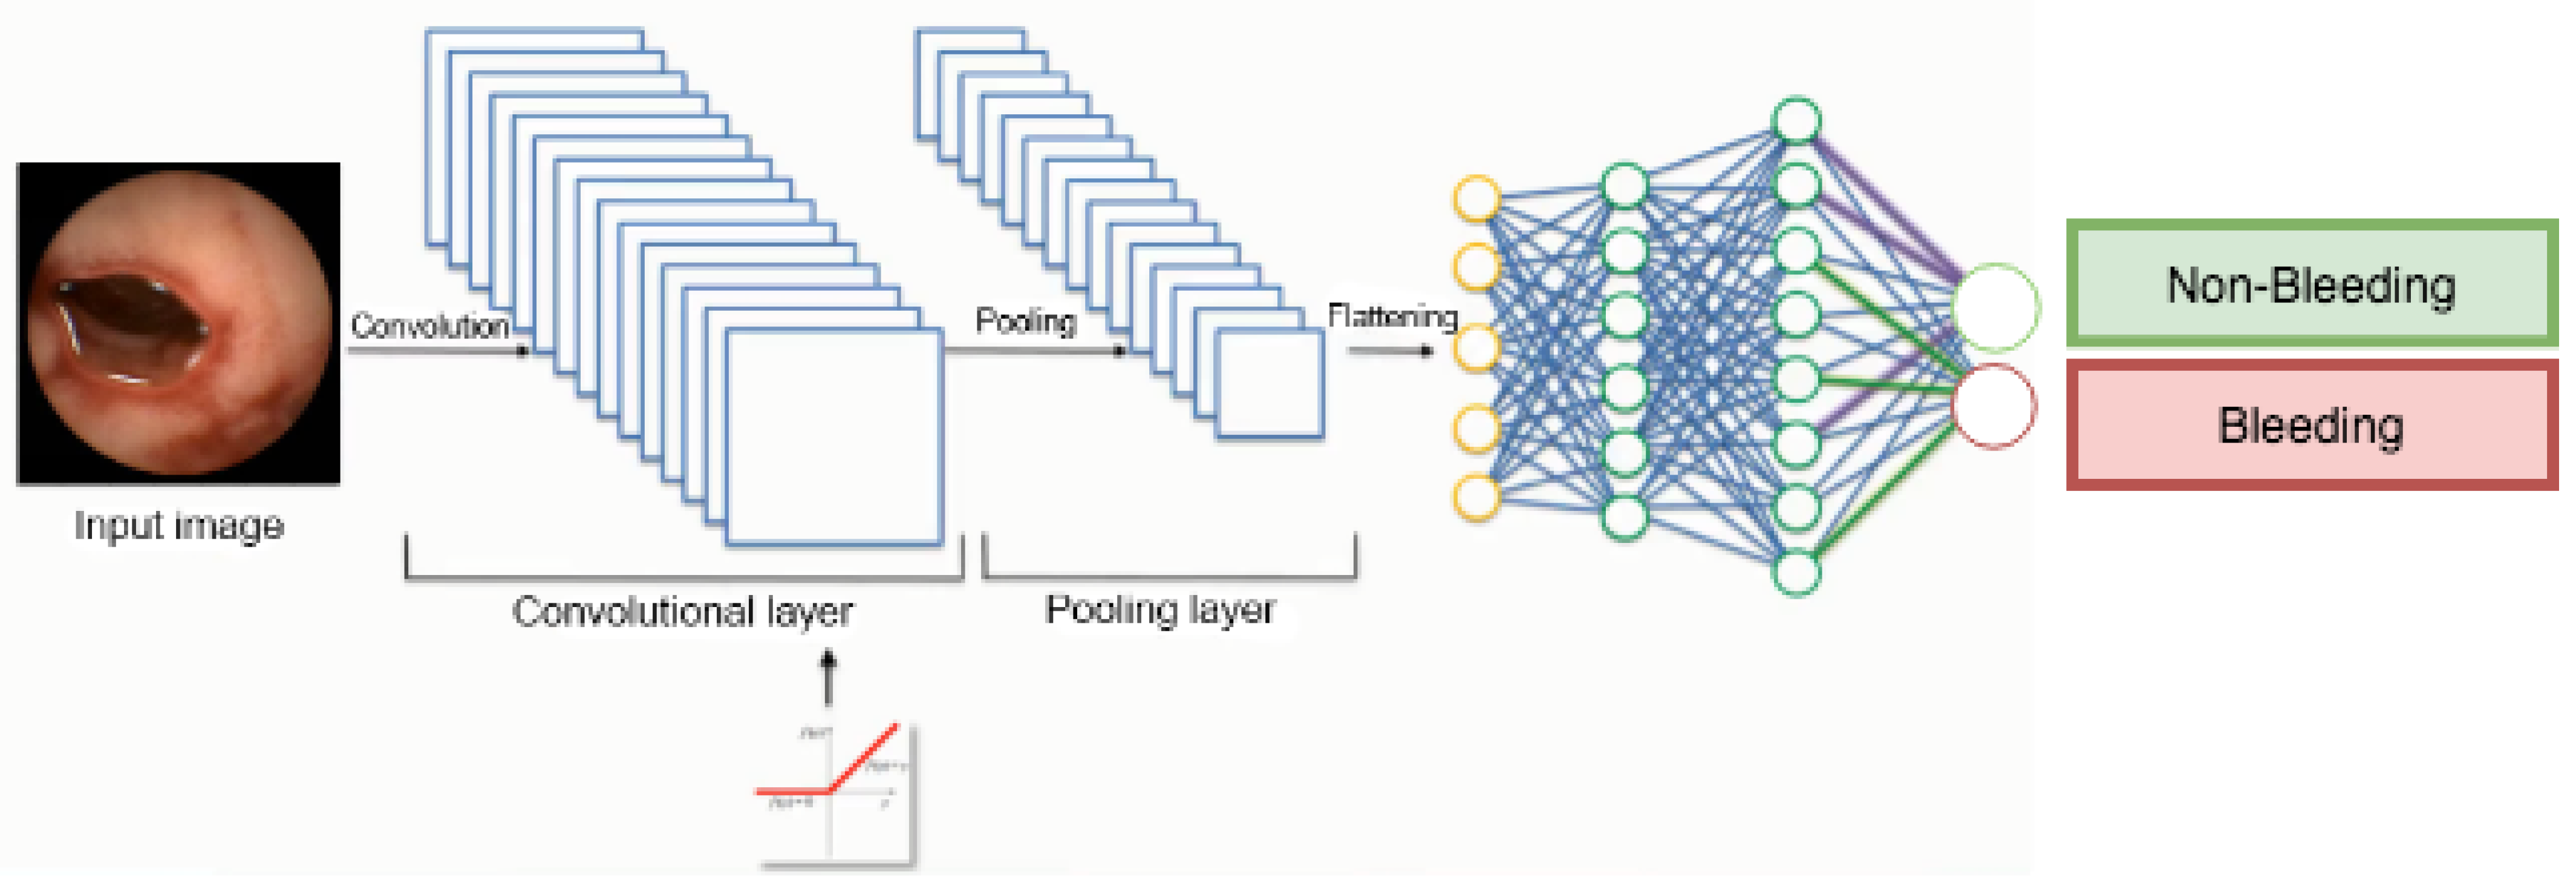
- The user study started with the learning part, in which the user was presented with a few test medical images with the model’s output so that the user could learn to distinguish bleeding from normal (non-bleeding) images.
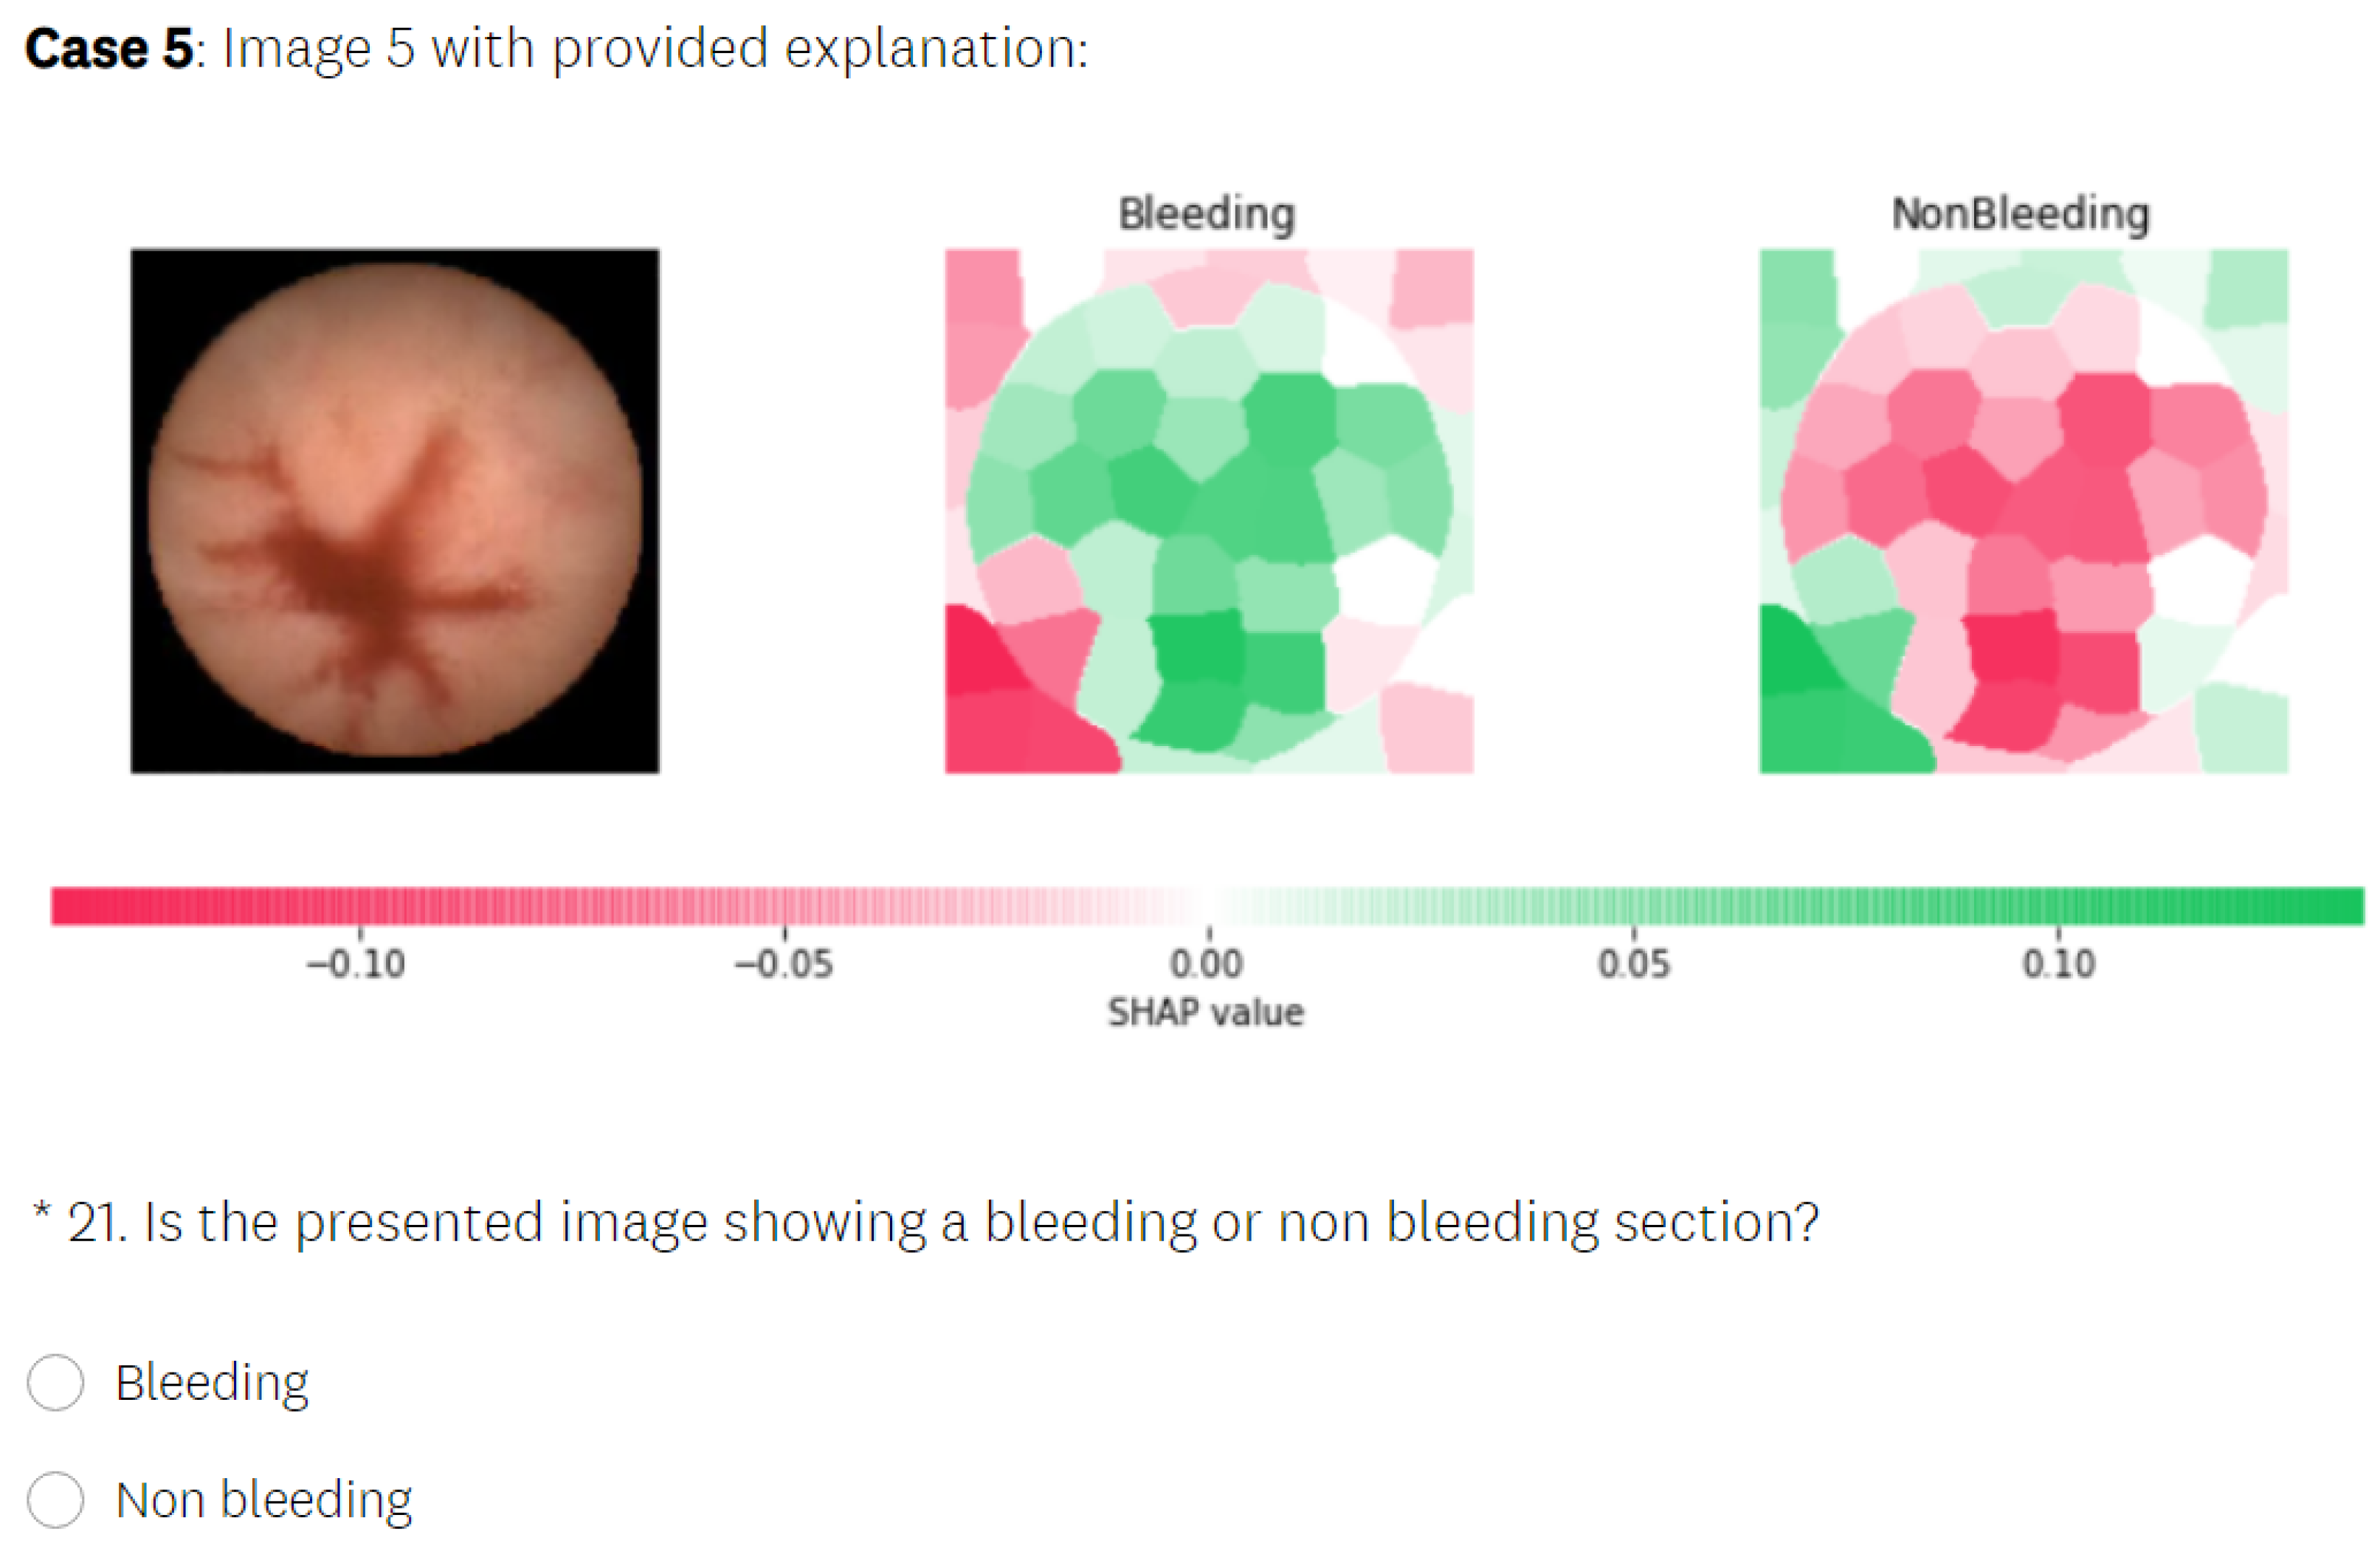
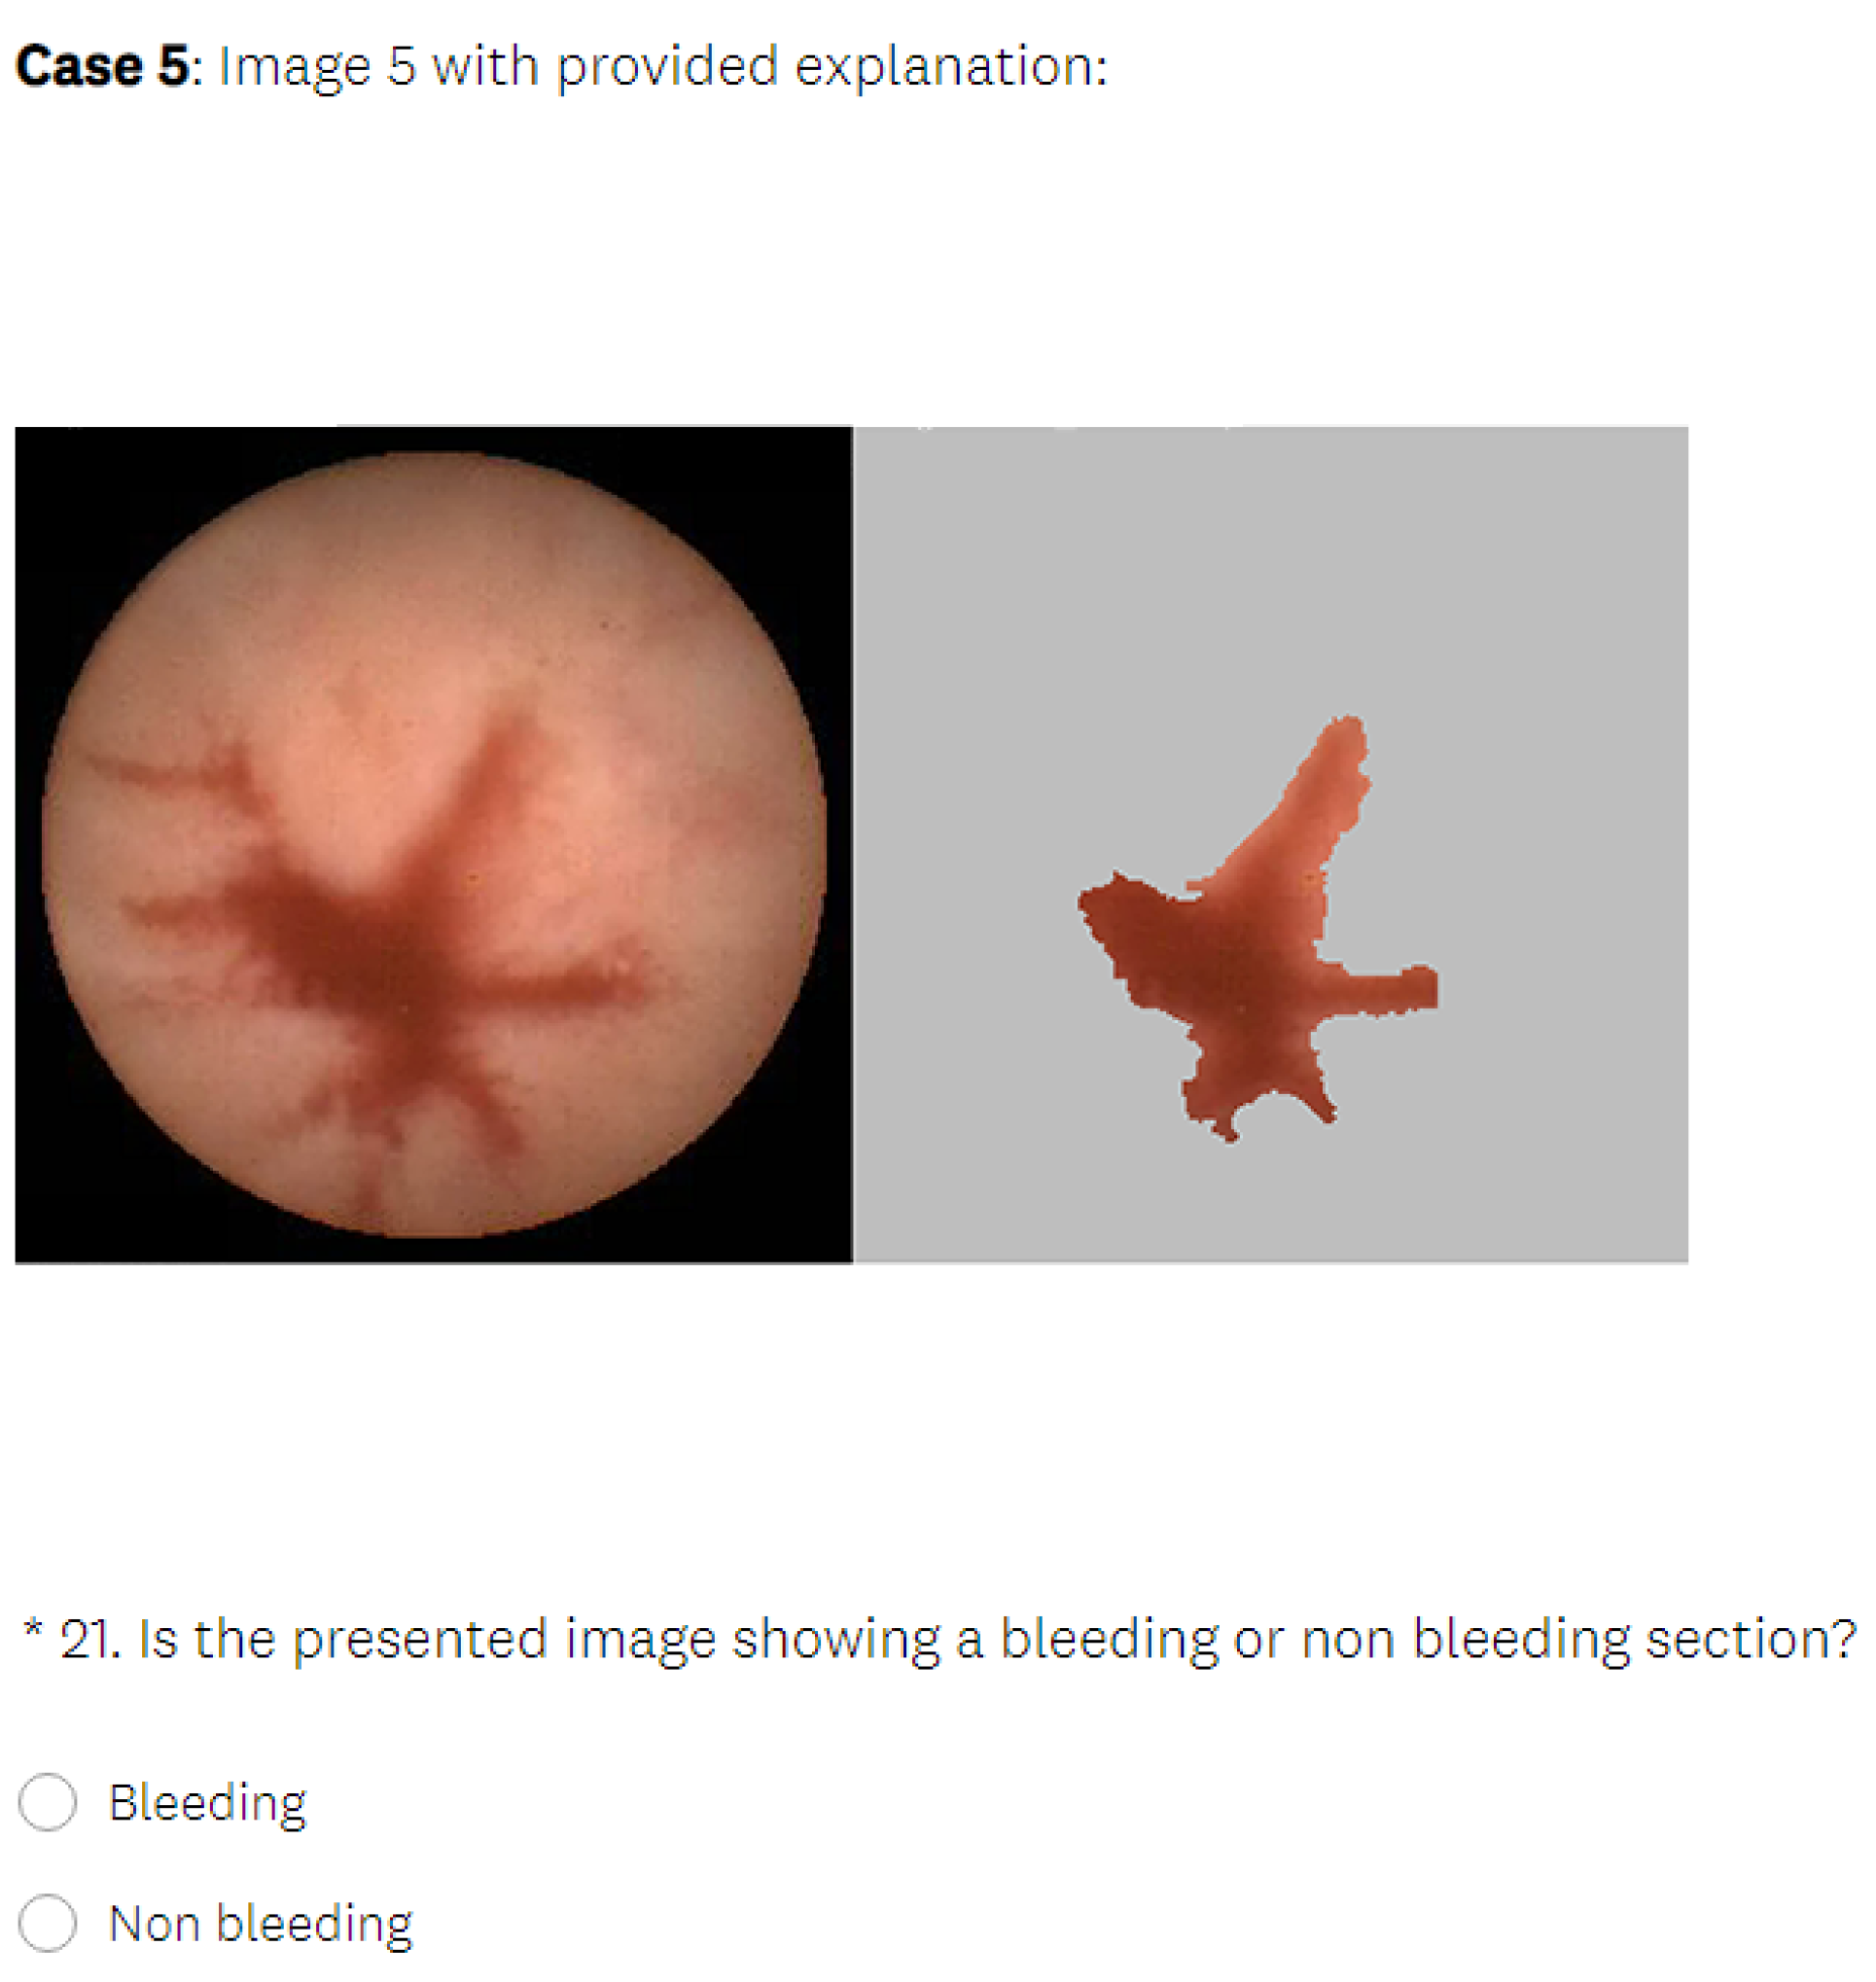
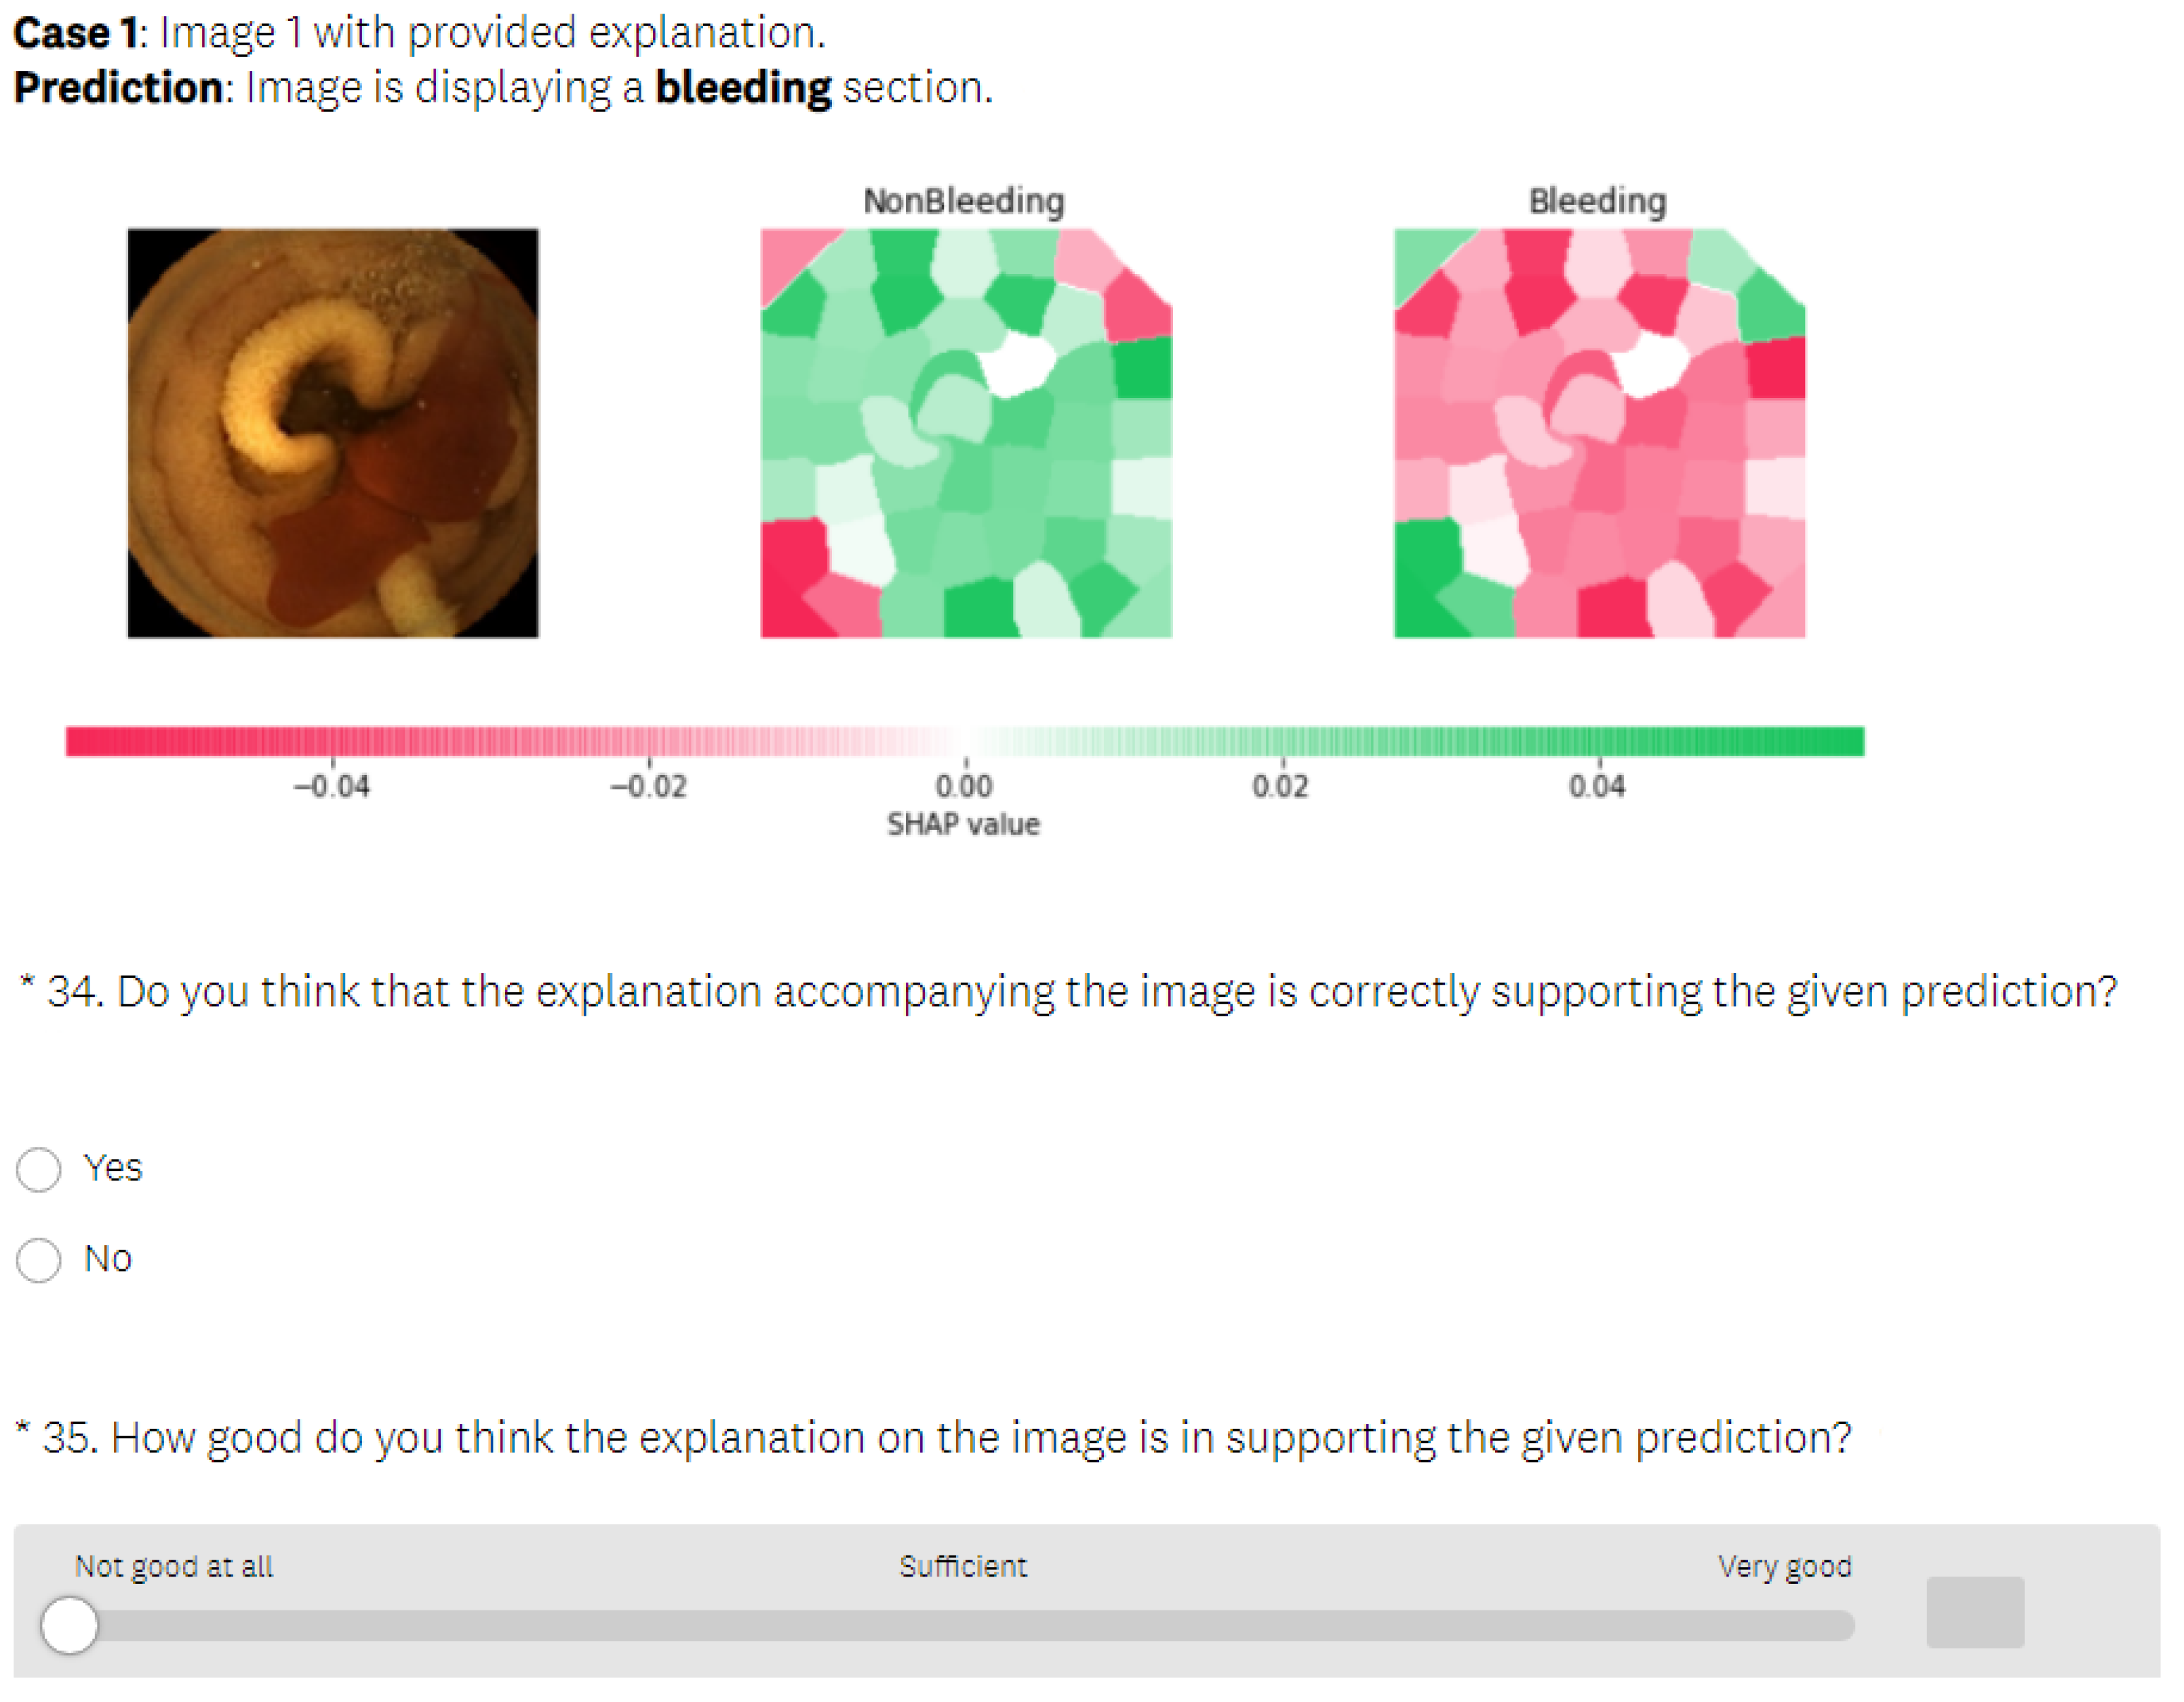
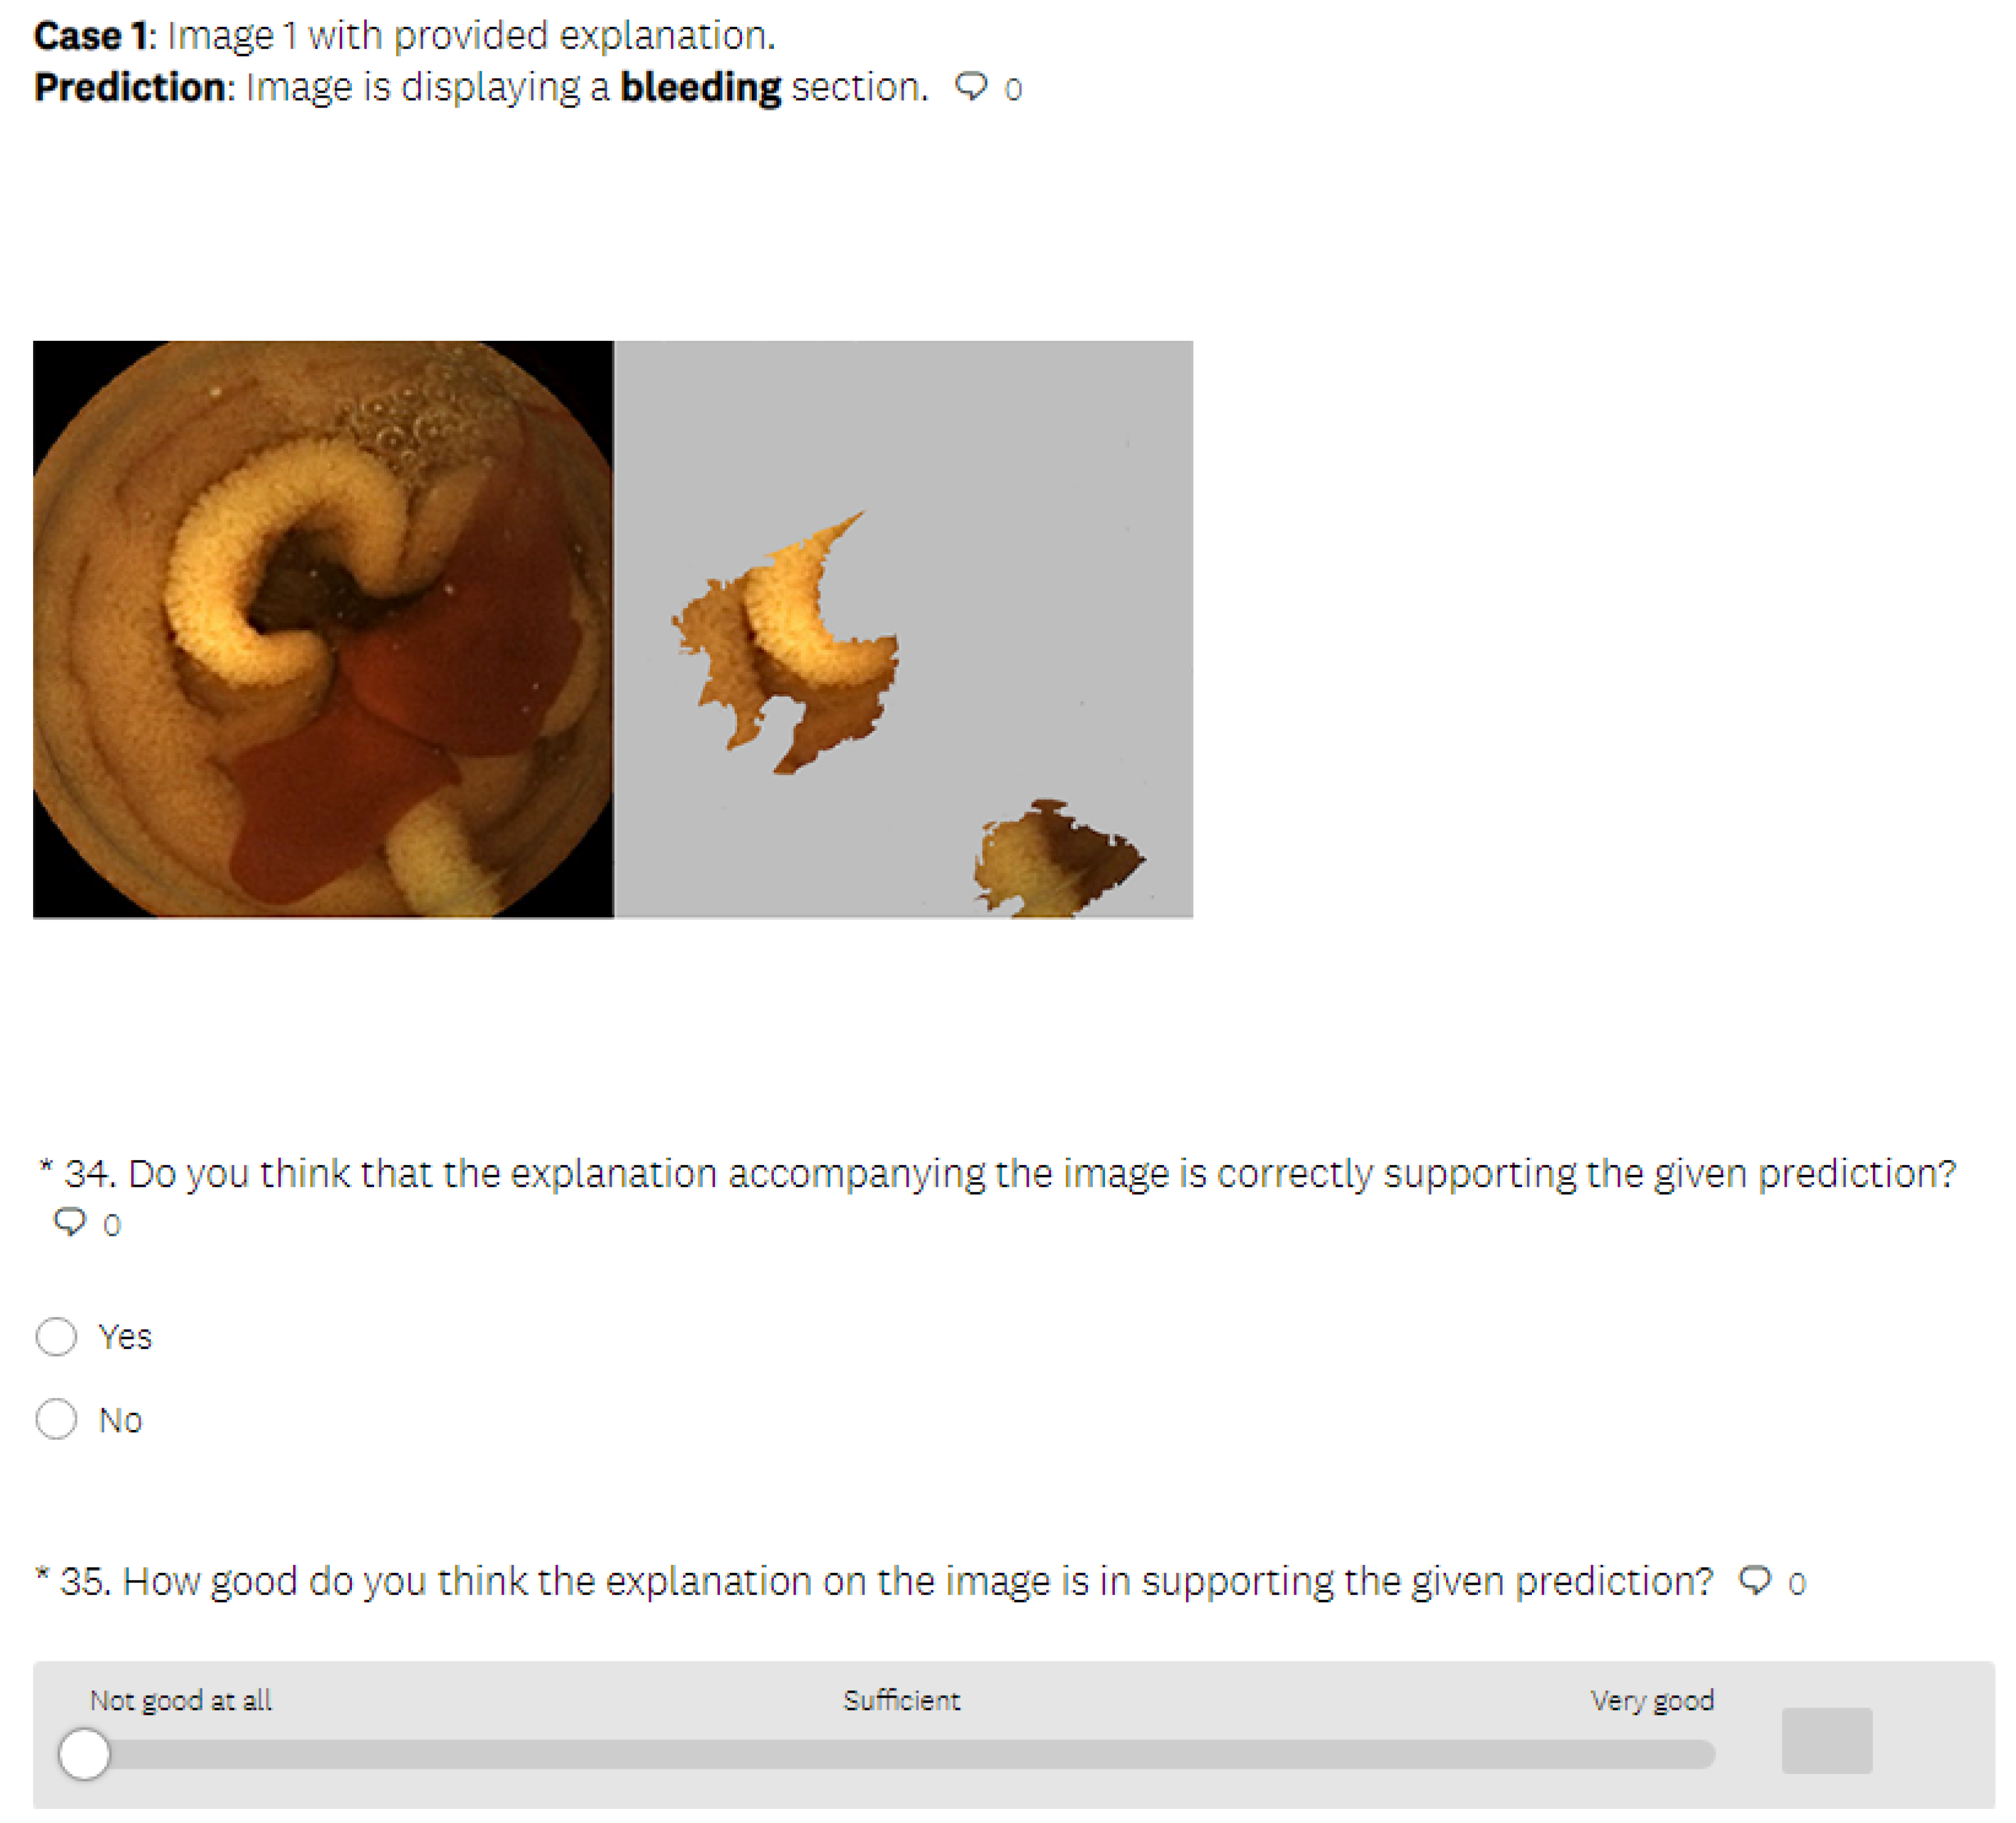
- In the test phase, the user was first presented with medical images that differed from those used in the learning section and had to make a decision about whether the images displayed a bleeding or normal section. In the next phase, the user was presented with the same medical images as in the previous phase, but this time, they were also provided with the visual explanations generated by an explainable method, without the precise decision offered by a black-box model. The explanation was presented in such a way that the important features in the initial image from our data set (in this case, normal or bleeding areas, if any) were highlighted or isolated. The user was instructed to make the diagnosis in both test phases. The user needed to decide if there was any bleeding present and if the image showed a severe condition or if there was no bleeding present. Thus, we could verify whether the proposed explainable methods enhanced the number of correct decisions made by the human. At the end of the second test phase, the user had to rate the explanations by marking how satisfied they were with them on a Likert scale ranging from 0 to 5 (where 0 indicates the lowest satisfaction with the explanations, and 5 indicates the highest satisfaction).
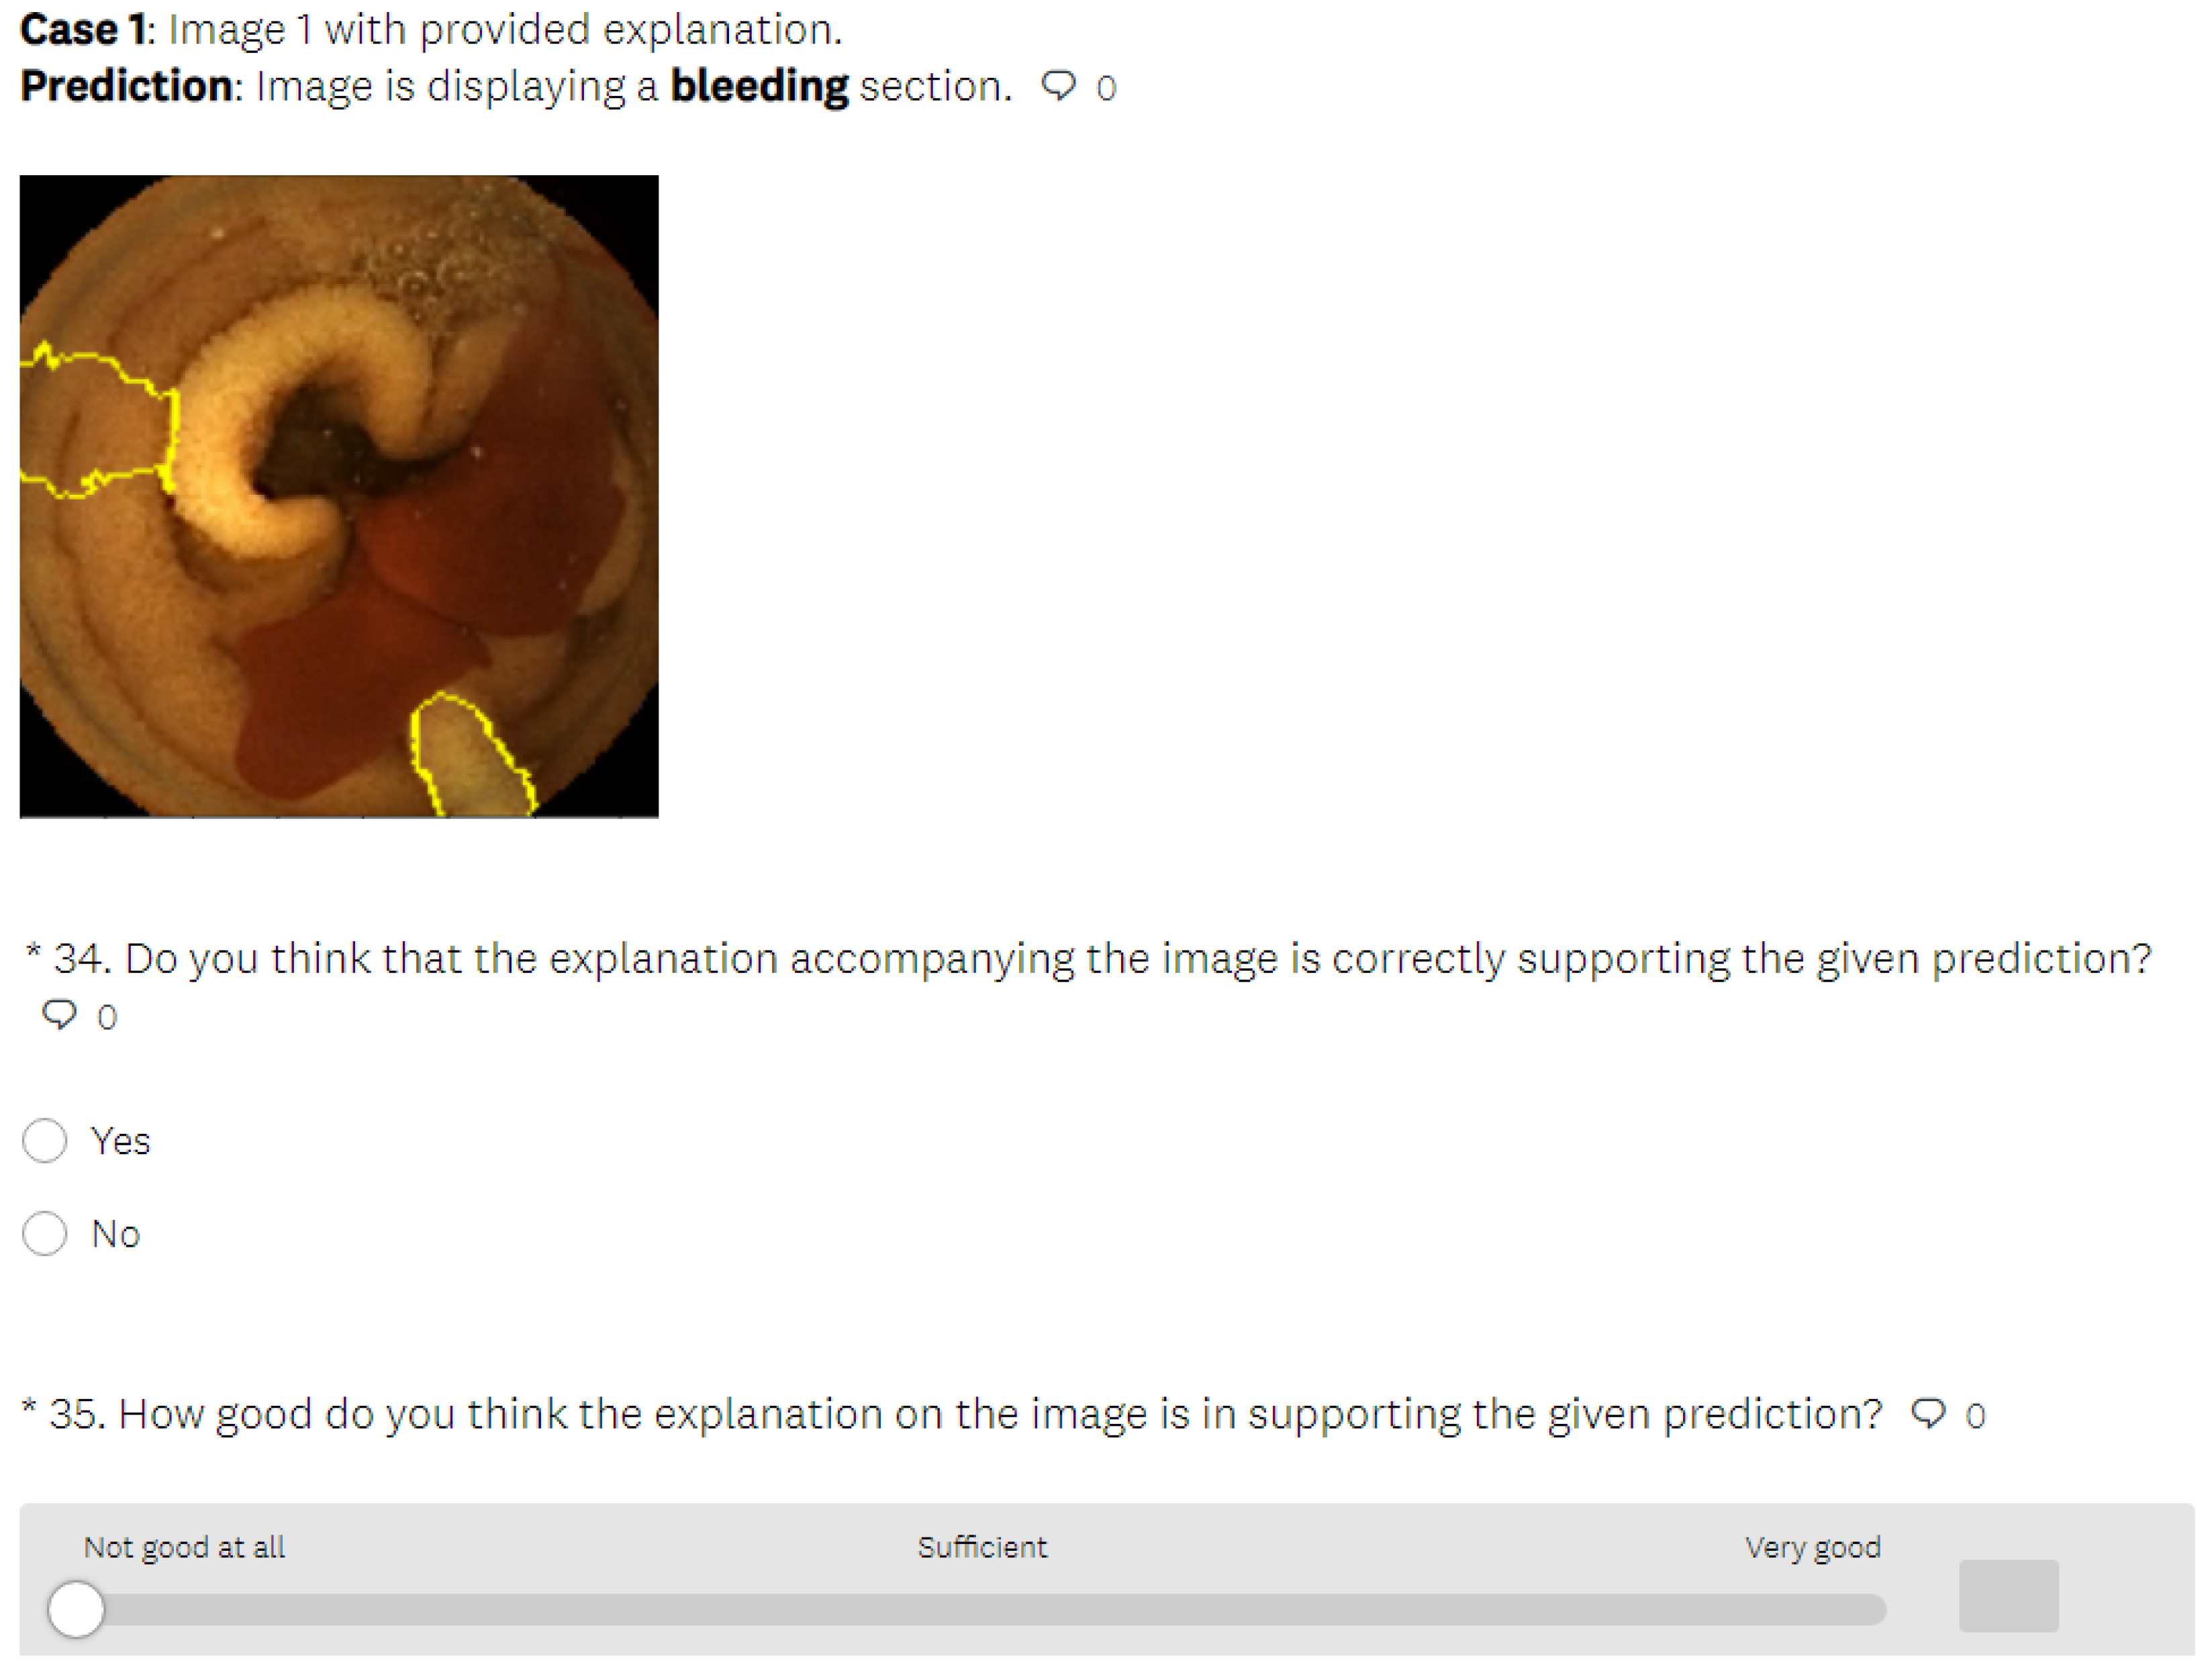
- In the last part of the test phase, users had to indicate if they thought that the presented explanation was correct or not for each presented image. Thus, we collected information about users’ ability to understand the explanations by having them judge whether the explainable method provided a correct or incorrect explanation.
- The process was iterated for four different cases of data in the learning stage, 16 cases in the second stage and 12 cases in the third stage. Cases in the learning phase differed from those in the test phase. The presented images from the first and second test phases also differed from those in the third part of the test phase. In the test phase, users were not allowed to reference the learning data.
- After all four rounds of the survey were completed, the users were also asked to complete the evaluation questionnaire, through which we collected information on their demographics and their understanding of the explanation support. Because these questions could influence the users’ perception of the procedure, they were only posed after the research evaluation was completed and could not be accessed by the user beforehand.
7. Analyses of the Results
7.1. Performance of LIME, SHAP and CIU
7.2. Quantitative Analyses of Explanations
7.2.1. Analyses of Human Decision-Making in the Three Users Groups with Different Explanation Support Methods
7.2.2. Correlation Analyses
7.3. Qualitative Analyses of Explanations
- Users want more precise identification of the important areas in some of the presented images.
- In addition to visual explanations, users want supplementary text explanations.
- Users would like to have an option to interact with the explainable method in order to gain more in-depth information.
8. Discussion
8.1. Limitations
- The current study’s focus is limited to a single medical data set. The current use of explanation support focuses only on one set of medical images, which can be further tested on other more complex medical cases in need of decision support for various diagnoses.
- It is important to expand the current scope of the studied data and apply these explanation methods to real-life settings. Using the data in real-world scenarios may facilitate their practical application.
- The scope of evaluation was limited to basic tests with laypersons due to time constraints. The study can be generalized to carry out application-based evaluations involving real tasks performed by domain experts. In the case of medical data, the most suitable users would be physicians working in diagnostics.
8.2. Future Work
- With future improvements, we aim to generalize the explanations provided by explainable methods (LIME, SHAP and CIU) by using different medical data sets and thereby provide greater decision support for medical experts.
- In this study, the number of participants was limited to 60 (20 for each case). The results should ideally be validated with a larger sample size. In addition, increasing the sample size could help produce more statistically meaningful hypothesis test results.
- In order to improve the evaluation and test the usability of the explanations, a user evaluation study with domain (medical) experts is required. Furthermore, the explanations could potentially be tested using application-based assessment, which would require domain experts conducting activities related to the use of the explanations.
- In the future, we aim to expand on the current work by dealing with real-life case scenarios. It would be interesting to work with real-world complexities in order to show that the explainable methods can help people to make better decisions in real-world situations.
9. Conclusions
Author Contributions
Funding
Institutional Review Board Statement
Informed Consent Statement
Data Availability Statement
Conflicts of Interest
References
- Meske, C.; Bunde, E. Transparency and Trust in Human-AI-Interaction: The Role of Model-Agnostic Explanations in Computer Vision-Based Decision Support. In Proceedings of the International Conference on Human-Computer Interaction, Germany, Copenhagen, Denmark, 19–24 July 2020; Springer: Berlin/Heidelberg, Germany, 2020; pp. 54–69. [Google Scholar]
- Coelho, P.; Pereira, A.; Salgado, M.; Cunha, A. A deep learning approach for red lesions detection in video capsule endoscopies. In Proceedings of the International Conference Image Analysis and Recognition, Waterloo, ON, Canada, 27–29 August 2018; Springer: Berlin/Heidelberg, Germany, 2018; pp. 553–561. [Google Scholar]
- Malhi, A.; Kampik, T.; Pannu, H.; Madhikermi, M.; Främling, K. Explaining Machine Learning-Based Classifications of In-Vivo Gastral Images. In Proceedings of the International Workshop on Explainable, Transparent Autonomous Agents and Multi-Agent Systems, Montreal, QC, Canada, 13–14 May 2019; IEEE: New York, NY, USA, 2019; pp. 1–7. [Google Scholar]
- Malhi, A.; Knapič, S.; Främling, K. Explainable Agents for Less Bias in Human-Agent Decision Making. In Proceedings of the International Workshop on Explainable, Transparent Autonomous Agents and Multi-Agent Systems, Auckland, New Zealand, 9–13 May 2020; Springer: Berlin/Heidelberg, Germany, 2020; pp. 129–146. [Google Scholar]
- Anjomshoae, S.; Kampik, T.; Främling, K. Py-CIU: A Python Library for Explaining Machine Learning Predictions Using Contextual Importance and Utility. In Proceedings of the IJCAI-PRICAI 2020 Workshop on Explainable Artificial Intelligence (XAI), Yokohama, Japan, 1 October 2020. [Google Scholar]
- Adadi, A.; Berrada, M. Peeking inside the black-box: A survey on Explainable Artificial Intelligence (XAI). IEEE Access 2018, 6, 52138–52160. [Google Scholar] [CrossRef]
- Guidotti, R.; Monreale, A.; Ruggieri, S.; Turini, F.; Giannotti, F.; Pedreschi, D. A survey of methods for explaining black box models. ACM Comput. Surv. (CSUR) 2018, 51, 93. [Google Scholar] [CrossRef] [Green Version]
- Anjomshoae, S.; Najjar, A.; Calvaresi, D.; Främling, K. Explainable agents and robots: Results from a systematic literature review. In Proceedings of the 18th International Conference on Autonomous Agents and MultiAgent Systems, International Foundation for Autonomous Agents and Multiagent Systems, Montreal, QC, Canada, 13–17 May 2019; pp. 1078–1088. [Google Scholar]
- Vilone, G.; Longo, L. Notions of explainability and evaluation approaches for explainable artificial intelligence. Inf. Fusion 2021, 76, 89–106. [Google Scholar] [CrossRef]
- Främling, K.; Graillot, D. Extracting Explanations from Neural Networks. In Proceedings of the ICANN, Citeseer, Paris, France, 9–13 October 1995; Volume 95, pp. 163–168. [Google Scholar]
- Främling, K. Modélisation et Apprentissage des Préférences par Réseaux de Neurones Pour L’aide à la Décision Multicritère. Ph.D. Thesis, INSA de Lyon, Lyon, France, 1996. [Google Scholar]
- Lundberg, S. SHAP Python Package. 2019. Available online: https://github.com/slundberg/shap (accessed on 4 June 2019).
- ELI5. 2019. Available online: https://github.com/TeamHG-Memex/eli5 (accessed on 4 June 2019).
- Skater. 2019. Available online: https://github.com/oracle/Skater (accessed on 4 June 2019).
- Xie, N.; Ras, G.; van Gerven, M.; Doran, D. Explainable deep learning: A field guide for the uninitiated. arXiv 2020, arXiv:2004.14545. [Google Scholar]
- Samek, W.; Wiegand, T.; Müller, K.R. Explainable artificial intelligence: Understanding, visualizing and interpreting deep learning models. arXiv 2017, arXiv:1708.08296. [Google Scholar]
- Choo, J.; Liu, S. Visual analytics for explainable deep learning. IEEE Comput. Graph. Appl. 2018, 38, 84–92. [Google Scholar] [CrossRef] [PubMed] [Green Version]
- Gunning, D.; Aha, D. DARPA’s explainable artificial intelligence (XAI) program. AI Mag. 2019, 40, 44–58. [Google Scholar] [CrossRef]
- Ghosal, S.; Blystone, D.; Singh, A.K.; Ganapathysubramanian, B.; Singh, A.; Sarkar, S. An explainable deep machine vision framework for plant stress phenotyping. Proc. Natl. Acad. Sci. USA 2018, 115, 4613–4618. [Google Scholar] [CrossRef] [PubMed] [Green Version]
- Hase, P.; Bansal, M. Evaluating Explainable AI: Which Algorithmic Explanations Help Users Predict Model Behavior? arXiv 2020, arXiv:2005.01831. [Google Scholar]
- Holzinger, A.; Biemann, C.; Pattichis, C.S.; Kell, D.B. What do we need to build explainable AI systems for the medical domain? arXiv 2017, arXiv:1712.09923. [Google Scholar]
- Holzinger, A.; Malle, B.; Kieseberg, P.; Roth, P.M.; Müller, H.; Reihs, R.; Zatloukal, K. Towards the augmented pathologist: Challenges of explainable-ai in digital pathology. arXiv 2017, arXiv:1712.06657. [Google Scholar]
- Sahiner, B.; Pezeshk, A.; Hadjiiski, L.M.; Wang, X.; Drukker, K.; Cha, K.H.; Summers, R.M.; Giger, M.L. Deep learning in medical imaging and radiation therapy. Med. Phys. 2019, 46, e1–e36. [Google Scholar] [CrossRef] [Green Version]
- Amann, J.; Blasimme, A.; Vayena, E.; Frey, D.; Madai, V.I. Explainability for artificial intelligence in healthcare: A multidisciplinary perspective. BMC Med. Inform. Decis. Mak. 2020, 20, 1–9. [Google Scholar] [CrossRef]
- Ribeiro, M.T.; Singh, S.; Guestrin, C. “Why Should I Trust You?”: Explaining the Predictions of Any Classifier. In Proceedings of the 22nd ACM SIGKDD International Conference on Knowledge Discovery and Data Mining, San Francisco, CA, USA, 13–17 August 2016; pp. 1135–1144. [Google Scholar]
- Wang, S.H.; Zhang, Y.; Cheng, X.; Zhang, X.; Zhang, Y.D. PSSPNN: PatchShuffle Stochastic Pooling Neural Network for an explainable diagnosis of COVID-19 with multiple-way data augmentation. Comput. Math. Methods Med. 2021. [Google Scholar] [CrossRef]
- Zhang, Y.; Zhang, X.; Zhu, W. ANC: Attention network for COVID-19 explainable diagnosis based on convolutional block attention module. CMES-Comput. Model. Eng. Sci. 2021, 127, 1037–1058. [Google Scholar]
- Voigt, P.; Von dem Bussche, A. The eu general data protection regulation (gdpr). In A Practical Guide, 1st ed.; Springer International Publishing: Cham, Switzerland, 2017; Volume 10, p. 3152676. [Google Scholar]
- Egger, J.; Gsaxner, C.; Pepe, A.; Li, J. Medical Deep Learning—A systematic Meta-Review. arXiv 2020, arXiv:2010.14881. [Google Scholar]
- Roscher, R.; Bohn, B.; Duarte, M.F.; Garcke, J. Explainable machine learning for scientific insights and discoveries. IEEE Access 2020, 8, 42200–42216. [Google Scholar] [CrossRef]
- Doshi-Velez, F.; Kim, B. Towards a rigorous science of interpretable machine learning. arXiv 2017, arXiv:1702.08608. [Google Scholar]
- Linardatos, P.; Papastefanopoulos, V.; Kotsiantis, S. Explainable AI: A Review of Machine Learning Interpretability Methods. Entropy 2021, 23, 18. [Google Scholar] [CrossRef] [PubMed]
- Došilović, F.K.; Brčić, M.; Hlupić, N. Explainable artificial intelligence: A survey. In Proceedings of the 2018 41st International Convention on Information and Communication Technology, Electronics and Microelectronics (MIPRO), Opatija, Croatia, 21–25 May 2018; IEEE: New York, NY, USA, 2018; pp. 210–215. [Google Scholar]
- Lundberg, S.; Lee, S.I. A unified approach to interpreting model predictions. arXiv 2017, arXiv:1705.07874. [Google Scholar]
- Pedersen, T.L. LIME R Package. 2019. Available online: https://github.com/thomasp85/lime (accessed on 20 September 2020).
- Ribeiro, M.T.C. LIME Python Package. 2019. Available online: https://github.com/marcotcr/lime (accessed on 10 September 2020).
- Shapley, L. A Value for N-Person Games. Contributions to the Theory of Games (Vol. 2); Princeton University Press: Princeton, NJ, USA, 1953; pp. 307–317. [Google Scholar] [CrossRef]
- Främling, K. Explainable AI without Interpretable Model. arXiv 2020, arXiv:2009.13996. [Google Scholar]
- Selvaraju, R.R.; Cogswell, M.; Das, A.; Vedantam, R.; Parikh, D.; Batra, D. Grad-cam: Visual explanations from deep networks via gradient-based localization. In Proceedings of the IEEE International Conference on Computer Vision, Venice, Italy, 22–29 October 2017; pp. 618–626. [Google Scholar]
- Främling, K.; Westberg, M.; Jullum, M.; Madhikermi, M.; Malhi, A. Comparison of Contextual Importance and Utility with LIME and Shapley Values. In Proceedings of the International Workshop on Explainable, Transparent Autonomous Agents and Multi-Agent Systems, London, UK (fully online), 3–7 May 2021; Springer: Berlin/Heidelberg, Germany, 2021; pp. 39–54. [Google Scholar]
- Molnar, C. Interpretable Machine Learning. 2019. Available online: https://christophm.github.io/interpretable-ml-book/ (accessed on 12 September 2020).
- Främling, K.; Knapič, S.; Malhi, A. ciu. image: An R Package for Explaining Image Classification with Contextual Importance and Utility. In Proceedings of the International Workshop on Explainable, Transparent Autonomous Agents and Multi-Agent Systems, London, UK (fully online), 3–7 May 2021; Springer: Berlin/Heidelberg, Germany, 2021; pp. 55–62. [Google Scholar]




| Method | Advantages | Disadvantages |
|---|---|---|
| SHAP | The greatest advantages of an explainability technique such as SHAP are its solid fundamental roots in game theory. This ensures that the explanation of a prediction instance is fairly distributed among the features. | SHAP is a slow and computationally expensive explainability technique as it requires Shapley values to be calculated for various features in a prediction instance. This also makes SHAP impractical for calculating global explanations if there are a lot of prediction instances. This is particularly true for Kernel SHAP. |
| LIME | As LIME builds a local surrogate model, it offers the flexibility to replace the underlying machine learning model while using the same surrogate model. For example, if the audience of the generation understands decision trees the best, the underlying ML can be changed, but the explanations can still serve as decision trees. | One of the greatest disadvantages of LIME is that the explanations provided can be really unstable. LIME samples data points from a Gaussian distribution, and this introduces some randomness to the process of producing explanations. If the sampling process is repeated a sufficient number of times, it leads to different explanations for a single prediction instance. This reduces trust in the explanation. |
| CIU | The greatest advantage of CIU is that it does not rely on a surrogate model, which allows it to provide more detailed, transparent and stable explanations as compared to additive feature attribution-based methods while remaining more lightweight. This makes the model much faster to run as compared to LIME and SHAP. | CIU is still in the early stage of development as compared to additive feature attribution methods such as LIME and SHAP. |
| Data | Normal (Non-Bleeding) | Bleeding | Total |
|---|---|---|---|
| Training | 1940 | 1001 | 2941 |
| Testing | 224 | 130 | 354 |
| Total | 2164 | 1131 | 3295 |
| Bleeding Images | Prediction Probability |
|---|---|
| Image 1 | [0.00 × 10, 1.00 × 10] |
| Image 2 | [0.00 × 10, 1.00 × 10] |
| Image 3 | [0.00 × 10, 1.00 × 10] |
| Image 4 | [0.00 × 10, 1.00 × 10] |
| Non-Bleeding Images | Prediction Probability |
| Image 5 | [1.00 × 10, 4.61 × 10] |
| Image 6 | [1.00 × 10, 3.78 × 10] |
| Image 7 | [1.00 × 10, 2.82 × 10] |
| Image 8 | [1.00 × 10, 4.28 × 10] |
| Methods | Total | Gender | Highest Degree | STEM Background | XAI Understanding | Age (years) | ||||||
|---|---|---|---|---|---|---|---|---|---|---|---|---|
| Female | Male | OTH | Ph.D (or Higher) | Master’s Degree | Bachelor’s Degree | Yes | No | Yes | No | |||
| LIME (and noEXP) | 20 | 6 | 14 | 0 | 3 | 12 | 5 | 19 | 1 | 12 | 8 | 22, 23, 24, 25(2), 26, 27(4), 28, 29, 30(2), 31(3), 32, 33, 34 |
| SHAP (and noEXP) | 20 | 7 | 13 | 0 | 6 | 12 | 2 | 18 | 2 | 8 | 12 | 22(2), 23, 24, 25, 26, 27(4), 28, 29(2), 30, 31, 33, 36, 38, 39, 42, |
| CIU (and noEXP) | 20 | 7 | 13 | 0 | 5 | 9 | 6 | 17 | 3 | 9 | 11 | 21, 25(2), 26(2), 27(3), 28(3), 29(3), 30(2), 32(2), 34, 35 |
| LIME | SHAP | CIU | ||
|---|---|---|---|---|
| Time comparison | 1 image | 11.40 s | 9.80 s | 8.50 s |
| 28 images | 5 min 20 s | 4 min 30 s | 4 min | |
| 354 images | 1 h 45 min | 1 h 30 min | 1 h 18 min |
| Measures | LIME User Study | ||
|---|---|---|---|
| With Explanation | Without Explanation | ||
| Correct decision | Mean | 14.15 | 13.95 |
| Median | 14.50 | 15.00 | |
| Incorrect decision | Mean | 1.80 | 2.05 |
| Median | 1.50 | 1.00 |
| Measures | SHAP User Study | ||
|---|---|---|---|
| With Explanation | Without Explanation | ||
| Correct decision | Mean | 13.40 | 14.05 |
| Median | 15.00 | 14.00 | |
| Incorrect decision | Mean | 2.60 | 1.95 |
| Median | 1.00 | 2.00 |
| Measures | CIU User Study | ||
|---|---|---|---|
| With Explanation | Without Explanation | ||
| Correct decision | Mean | 14.90 | 14.30 |
| Median | 16.00 | 14.00 | |
| Incorrect decision | Mean | 1.10 | 1.70 |
| Median | 0.00 | 2.00 |
| Measure | LIME | SHAP | CIU | |
|---|---|---|---|---|
| Recognition of correct and incorrect explanations | Mean | 8.85 | 8.65 | 10.25 |
| Median | 9.50 | 9.50 | 11.00 |
| t-Test | Hypothesis | p-Value (One-Tailed) | p-Value (Two-Tailed) | |
|---|---|---|---|---|
| 1 | (LIME, noEXP) | Ha0 | 0.334 | 0.738 |
| 2 | (SHAP, noEXP) | Hb0 | 0.232 | 0.464 |
| 3 | (CIU, noEXP) | Hc0 | 0.079 | 0.158 |
| 4 | (CIU, LIME) | Hd0 | 0.059 | 0.120 |
| 5 | (CIU, SHAP) | He0 | 0.036 * | 0.073 |
| 6 | (CIU, LIME) | Hf0 | 0.009 ** | 0.018 * |
| 7 | (CIU, SHAP) | Hg0 | 0.037 * | 0.073 |
| t-Test | p-Value (One-Tailed) | p-Value (Two-Tailed) | ||
|---|---|---|---|---|
| 1 | (LIME, SHAP) | User’s decision making | 0.185 | 0.370 |
| 2 | (LIME, SHAP) | Recognition of correct and incorrect explanations | 0.414 | 0.827 |
| LIME | SHAP | CIU | ||
|---|---|---|---|---|
| Satisfaction | Mean | 2.00 | 3.20 | 3.75 |
| Meadian | 2.00 | 3.00 | 4.00 | |
| Time in minutes | Mean | 15.57 | 23.18 | 16.30 |
| Median | 14.83 | 21.18 | 15.73 | |
| Understanding | Yes | 16.00 | 16.00 | 18.00 |
| No | 4.00 | 4.00 | 2.00 |
| t-Test | p-Value (One-Tailed) | p-Value (Two-Tailed) | |
|---|---|---|---|
| Satisfaction | (LIME, SHAP) | 0.007 ** | 0.0135 * |
| (LIME, CIU) | 0.000 *** | 0.000 *** | |
| (SHAP, CIU) | 0.072 | 0.144 | |
| Understanding | (LIME, SHAP) | 0.499 | 0.999 |
| (LIME, CIU) | 0.195 | 0.389 | |
| (SHAP, CIU) | 0.195 | 0.389 | |
| Time in minutes | (LIME, SHAP) | 0.005 ** | 0.011 ** |
| (LIME, CIU) | 0.317 | 0.633 | |
| (SHAP, CIU) | 0.008 ** | 0.0166 ** |
| Variable | LIME | SHAP | CIU | |
|---|---|---|---|---|
| Age | correlation | −0.451 | 0.229 | −0.413 |
| p-Value (two-tailed) | 0.046 * | 0.332 | 0.071 | |
| Gender | correlation | 0.349 | 0.272 | −0.02 |
| p-Value (two-tailed) | 0.132 | 0.246 | 0.934 | |
| Education | correlation | −0.073 | 0.210 | −0.321 |
| p-Value (two-tailed) | 0.760 | 0.374 | 0.167 | |
| STEM background | correlation | 0.387 | −0.309 | −0.132 |
| p-Value (two-tailed) | 0.092 | 0.185 | 0.580 | |
| XAI | correlation | −0.235 | 0.274 | −0.435 |
| p-Value (two-tailed) | 0.318 | 0.242 | 0.055 | |
| Time spent | correlation | −0.271 | 0.480 | −0.10 |
| p-Value (two-tailed) | 0.248 | 0.840 | 0.674 | |
| Satisfaction | correlation | −0.519 | 0.482 | 0.396 |
| p-Value (two-tailed) | 0.019 * | 0.031 * | 0.084 | |
| Understanding | correlation | −0.377 | 0.522 | 0.188 |
| p-Value (two-tailed) | 0.101 | 0.018 | 0.427 |
| Variable | noEXP (LIME) | noEXP (SHAP) | noEXP (CIU) | |
|---|---|---|---|---|
| Age | correlation | −0.18 | −0.063 | −0.318 |
| p-Value | 0.447 | 0.792 | 0.171 | |
| Gender | correlation | 0.069 | −0.166 | 0.313 |
| p-Value | 0.773 | 0.484 | 0.179 | |
| Education | correlation | 0.173 | −0.246 | −0.087 |
| p-Value | 0.465 | 0.296 | 0.715 | |
| STEM | correlation | 0.392 | 0.217 | 0.139 |
| p-Value | 0.087 | 0.357 | 0.558 | |
| XAI | correlation | 0 | −0.285 | −0.264 |
| p-Value | 1 | 0.223 | 0.261 | |
| Time spent | correlation | −0.191 | −0.491 | −0.191 |
| p-Value | 0.419 | 0.028 * | 0.419 |
Publisher’s Note: MDPI stays neutral with regard to jurisdictional claims in published maps and institutional affiliations. |
© 2021 by the authors. Licensee MDPI, Basel, Switzerland. This article is an open access article distributed under the terms and conditions of the Creative Commons Attribution (CC BY) license (https://creativecommons.org/licenses/by/4.0/).
Share and Cite
Knapič, S.; Malhi, A.; Saluja, R.; Främling, K. Explainable Artificial Intelligence for Human Decision Support System in the Medical Domain. Mach. Learn. Knowl. Extr. 2021, 3, 740-770. https://doi.org/10.3390/make3030037
Knapič S, Malhi A, Saluja R, Främling K. Explainable Artificial Intelligence for Human Decision Support System in the Medical Domain. Machine Learning and Knowledge Extraction. 2021; 3(3):740-770. https://doi.org/10.3390/make3030037
Chicago/Turabian StyleKnapič, Samanta, Avleen Malhi, Rohit Saluja, and Kary Främling. 2021. "Explainable Artificial Intelligence for Human Decision Support System in the Medical Domain" Machine Learning and Knowledge Extraction 3, no. 3: 740-770. https://doi.org/10.3390/make3030037
APA StyleKnapič, S., Malhi, A., Saluja, R., & Främling, K. (2021). Explainable Artificial Intelligence for Human Decision Support System in the Medical Domain. Machine Learning and Knowledge Extraction, 3(3), 740-770. https://doi.org/10.3390/make3030037


