Abstract
AIM: In this study, we use Artificial Intelligence (AI), including Machine (ML) and Deep Learning (DL), to predict the long-term survival of resectable esophageal cancer (EC) patients in a high-volume surgical center. Our objective is to evaluate the predictive efficacy of AI methods for survival prognosis across different time points of oncological treatment. This involves comparing models trained with clinical data, integrating either Tumor, Node, Metastasis (TNM) classification or tumor biomarker analysis, for long-term survival predictions. METHODS: In this retrospective study, 1002 patients diagnosed with EC between 1996 and 2021 were analyzed. The original dataset comprised 55 pre- and postoperative patient characteristics and 55 immunohistochemically evaluated biomarkers following surgical intervention. To predict the five-year survival status, four AI methods (Random Forest RF, XG Boost XG, Artificial Neural Network ANN, TabNet TN) and Logistic Regression (LR) were employed. The models were trained using three predefined subsets of the training dataset as follows: (I) the baseline dataset (BL) consisting of pre-, intra-, and postoperative data, including the TNM but excluding tumor biomarkers, (II) clinical data accessible at the time of the initial diagnostic workup (primary staging dataset, PS), and (III) the PS dataset including tumor biomarkers from tissue microarrays (PS + biomarkers), excluding TNM status. We used permutation feature importance for feature selection to identify only important variables for AI-driven reduced datasets and subsequent model retraining. RESULTS: Model training on the BL dataset demonstrated similar predictive performances for all models (Accuracy, ACC: 0.73/0.74/0.76/0.75/0.73; AUC: 0.78/0.82/0.83/0.80/0.79 RF/XG/ANN/TN/LR, respectively). The predictive performance and generalizability declined when the models were trained with the PS dataset. Surprisingly, the inclusion of biomarkers in the PS dataset for model training led to improved predictions (PS dataset vs. PS dataset + biomarkers; ACC: 0.70 vs. 0.77/0.73 vs. 0.79/0.71 vs. 0.75/0.69 vs. 0.72/0.63 vs. 0.66; AUC: 0.77 vs. 0.83/0.80 vs. 0.85/0.76 vs. 0.86/0.70 vs. 0.76/0.70 vs. 0.69 RF/XG/ANN/TN/LR, respectively). The AI models outperformed LR when trained with the PS datasets. The important features shared after AI-driven feature selection in all models trained with the BL dataset included histopathological lymph node status (pN), histopathological tumor size (pT), clinical tumor size (cT), age at the time of surgery, and postoperative tracheostomy. Following training with the PS dataset with biomarkers, the important predictive features included patient age at the time of surgery, TP-53 gene mutation, Mesothelin expression, thymidine phosphorylase (TYMP) expression, NANOG homebox protein expression, and indoleamine 2,3-dioxygenase (IDO) expressed on tumor-infiltrating lymphocytes, as well as tumor-infiltrating Mast- and Natural killer cells. CONCLUSION: Different AI methods similarly predict the long-term survival status of patients with EC and outperform LR, the state-of-the-art classification model. Survival status can be predicted with similar predictive performance with patient data at an early stage of treatment when utilizing additional biomarker analysis. This suggests that individual survival predictions can be made early in cancer treatment by utilizing biomarkers, reducing the necessity for the pathological TNM status post-surgery. This study identifies important features for survival predictions that vary depending on the timing of oncological treatment.
1. Introduction
Personalized medicine, in the era of digital patient data, has entered a new phase with the emergence of Artificial Intelligence (AI). However, AI-guided medical treatment has not developed its full potential yet. This is attributable to external factors, including legal concerns related to data protection, as well as to internal factors, notably, the gap between data scientists’ methodologies and the domain knowledge of medical staff. The process of selecting suitable AI methods and evaluating their applicability to medical inquiries has not yet been standardized and remains a learning curve for the medical community [1].
It is crucial to understand that AI confers significant advantages to the medical field by effectively handling extensive datasets to recognize patterns [2]. AI can be categorized into Machine Learning (ML) and Deep Learning (DL), both of which have been previously used in studies concerning patients with upper gastrointestinal cancer [3,4,5]. ML uses specific algorithms trained on a data sample to construct predictive models, such as ensemble methods based on decision trees like Random Forests or Gradient Boosting. DL, a subset of ML, is more complex and necessitates greater computational power. It is modeled after the human brain structure and excels in processing various data types, such as images, language, and tabular data [2,6].
A pivotal attribute of AI is rapid and individual data analysis, a quality of increasing importance in medical and oncological treatment [7]. The economic structures of the healthcare system demand time-efficient therapeutic approaches. Moreover, well-informed patients seek prompt and timely answers, particularly when confronted with a life-threatening disease such as upper gastrointestinal cancer.
Esophageal cancer (EC) is the eighth most common cancer globally. Surgical therapy remains the primary curative approach for locally advanced EC [8]. Furthermore, the overall survival (OS) benefits from additional neoadjuvant treatments, such as radiochemotherapy [9,10]. Currently, survival probabilities are primarily determined based on the pathological Tumor, Node, Metastasis (TNM) stage groups [11], and the long-term prognosis remains poor with a 5-year survival rate of approximately 20% [12,13].
The treatment choice for the patient is determined during the interdisciplinary tumor board conference after primary staging [14]. Factors including tumor histology from the primary biopsy, radiologically observed nodal and organ metastases, and patient comorbidities are pivotal in this decision-making process [15]. Nevertheless, this approach seems overly simplistic considering the wealth of additional, collectable data, such as various patient characteristics and tumor biomarkers. In particular, tumor biomarkers are gaining increasing significance in the treatment of EC such as the assessment of the programmed death-ligand 1 (PDL-1) status for targeted therapy [16].
In this context, AI could function as a valuable tool to investigate the relationship between the patient’s medical history and the histopathological specifics of the tumor disease, facilitating personalized therapy. Our institution, as a high-volume center for EC surgical treatment, offers the opportunity for AI-driven analysis of extensive patient cohorts with a large number of specified biomarkers.
This study’s objective is to predict 5-year survival status by comparing various AI algorithms trained on different data subsets. Initially, pre-, intra-, and postoperative clinical information, including pathological TNM, is used to train the respective models. Subsequently, the models are trained on the preoperative information obtained during the initial diagnosis (primary staging), a period when the pathological TNM status is not yet available. Then, biomarker analysis is incorporated into the data from the primary staging to assess its impact on the predictive power. Lastly, AI-driven feature selection is conducted to identify important variables for predictions.
2. Methods
2.1. Inclusion Criteria and Patient Characteristics
For this retrospective study, a total of 1002 patients with EC (adenocarcinoma AC 84.03%; squamous cell carcinoma SCC 14.7%; other carcinomas 1.2%) who underwent primary surgical treatment or surgery after neoadjuvant therapy between 1996 and 2021 at the Department of General, Visceral and Cancer Surgery, University of Cologne, Germany, were included (Table 1). The standard surgical approach involved laparotomic, laparoscopic, or robotic gastrolysis with the following right transthoracic en-bloc esophagectomy and two-field lymphadenectomy of mediastinal and abdominal lymph nodes (Ivor Lewis Esophagectomy).

Table 1.
Basic outline of patients with esophageal cancer who underwent surgical therapy. ACC = Adenocarcinoma, SCC = Squamous cell carcinoma, pT = histopathological tumor size, pN = histopathological lymph node status, pL = invasion into lymphatic vessels, pV = invasion into vein.
The inclusion criteria encompassed patients with a post-surgery OS of at least 90 days to exclude mortality due to postoperative complications. We decided to include features with a maximum missing rate of 87% (missing values per feature: mean 0.53, SD 0.22) to avoid prematurely excluding clinical attributes that could be crucial for AI-based predictions. Preliminary studies with a data completeness threshold of 75% per feature, resulting in fewer features but a lower missing rate, yielded inferior outcomes compared with the approach with more features and a higher missing rate.
Consequently, 110 patient characteristics were selected from the database comprising 13 clinical features, 11 characteristics related to medical history, 4 related to medical treatment, 8 postoperative complications, 5 tumor-associated factors, the clinical and the pathological TNM classification, and 55 biomarkers extracted from the tumor specimen. These biomarkers were identified from resected tumors through techniques such as immunohistochemistry (IHC) or fish in situ hybridization (FISH) using tissue microarrays, as described in detail in earlier publications by study groups of our institution [18,19,20,21,22,23,24,25,26,27,28,29,30,31,32,33,34,35,36,37]. A comprehensive description of these patient characteristics can be found in Supplementary Table S1.
Written consent to data collection in a clinical and pathological database was obtained from all patients prior to treatment. As this is a retrospective study, all data, including biomarkers, were already fully collected at the beginning of this study. This study was performed in accordance with the Declaration of Helsinki and approved by the Institutional Review Board (or Ethics Committee) of the University of Cologne (16-230, 9 September 2016).
2.2. Models
In this study, supervised learning techniques for binary classification included two Machine Learning (ML) methods, Random Forest and XG-Boost, as well as two Deep Learning (DL) algorithms, Artificial Neural Networks and TabNet. Logistic Regression (LR) served as the classical and state-of-the-art statistical method. The scikit learn package was utilized for constructing the models unless otherwise specified [38].
Random Forests (RFs) belong to ensemble ML algorithms, relying on multiple decision trees to classify the target. A key concept in RFs is bootstrap aggregation, commonly known as bagging. This involves creating subsamples of the training data with distinct sets of features (decision trees) to enhance model performance [39]. Besides easy implementation, RFs are robust against overfitting even in the presence of high-dimensional data, as seen in our dataset [40].
Extreme Gradient Boosting (XG-Boost, XG) is an additional decision tree-based ensemble method used for supervised learning of tabular data. Besides bagging, XG-Boost places an emphasis on sequentially boosting correctly classified subsamples, thereby enhancing predictions for subsequent learners. Additionally, XG Boost demonstrates the capability to handle missing values [41], proving beneficial for our dataset with a notable proportion of missing values.
Artificial Neural Networks (ANNs) are constructed as a feed-forward network of different nodes (input-, hidden-, output-layers) to finally interpret the information (dataset) by improving the weights during training known as backpropagation [42]. Neural networks are not as frequently used for tabular data as ML methods. Nevertheless, ANNs were selected for this study given their ability to handle complex patterns [42] such as those present in medical datasets. In this study, the fast.ai library was utilized to create a feed-forward ANN for classifying the 5-year OS [43]. The ANN architecture included a maximum of two layers and up to 140 nodes, depending on hyperparameter search.
TabNet (TN) is the latest method used in this study to include another deep architecture model alongside ANNs. It was first introduced in 2019 by a research team of Google Cloud with the objective of bridging the gap between DL techniques and tabular datasets, which had predominantly been utilized for training ML models. TN’s architecture processes, transforms, and selects the features in sequential, nonlinear decision steps (Feature/Attentive Transformer) for final classification [44]. In this study, a PyTorch implementation of TN was used [45].
Logistic Regression (LR) is a well-known statistical approach using the logistic function for dichotomous classification [46]. LR without regularization was selected as the state-of-the-art model to benchmark the performance of the ML and DL approaches.
2.3. Labeling, Data Splitting, and Data Preprocessing
The original dataset was labeled into two groups based on the 5-year OS after surgical treatment. Short-term survival was defined as an OS greater than 90 days but less than five years with recorded death (Label 0). Long-term survival was designated when the OS was equal to or greater than five years (Label 1). This yielded a fairly balanced dataset (Label 0: 596 patients, 59.5%; Label 1: 406 patients, 40.5%).
An independent hold-out set was created and consistently utilized as a test set for all subsequent models (n = 100). The final training set comprised 902 patients. Validation sets were derived from the training dataset using stratified sampling, with the stratification being based on the two cohorts (n = 91). This was performed particularly for architectures like ANN, TN, and XG and for AI-driven feature selection.
The features comprised 14 continuous variables and 96 categorical variables. Continuous data were first normalized, and then missing data were imputed with scikit learn’s k-Nearest Neighbor imputer (n-neighbors = 10) [38], except in the XG model, which can handle missing continuous data [41], and in the ANN model, where the median was imputed utilizing the FillMissing method [43]. For the ML methods (RF, XG) and LR, categorical data were transformed into dummy variables through one-hot encoding, resulting in a total of 301 features. One-hot encoding involves converting a categorial variable into its categories, thus creating new variables. DL architectures (ANN, TN) used embeddings for categorical variables. Missing data points in the categorical features were treated as their own category.
2.4. Hyperparameter Search and Feature Selection via Permutation Feature Importance
Hyperparameter optimization was performed using scikit learn’s Randomized and Grid Search Cross Validation (CV) with a stratified 10-fold approach for RF and XG [38]. Optimum hyperparameter values for ANN and TN were determined using Optuna, an open-source optimization framework based on pruning and sampling with a custom-defined number of trials (n = 100) [47]. Optimization was conducted for each computational experiment. An outline of optimized hyperparameters is provided in Supplementary Table S2.
Permutation feature importance (PFI) was utilized to rank the importance of features for model performance. This method involves randomly shuffling the features (n = 100) and evaluating the reduction in model performance [48]. PFI was applied to the validation set in this study to identify the important features. PFI was conducted using the scikit learn library for RF, TN, and XG, while a modified code was used for fast.ai’s ANN [38,49].
2.5. Study Design
The study is structured as follows (Figure 1):
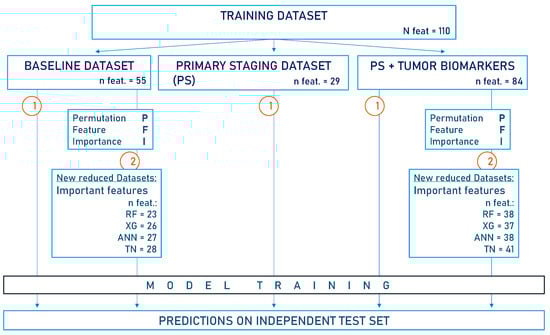
Figure 1.
Flow diagram of the study design. The baseline dataset (BL) contains all available clinical data, including pathological TNM but excluding immunohistochemical biomarker analysis. In the primary staging dataset (PS), information collected after the initial diagnosis was omitted. Another PS dataset was created, this time incorporating tumor biomarkers. Notably, the pathological TNM is not included in the PS datasets. This study proceeded in the following two steps: 1. Models were trained on the respective data subsets (n = 902) to predict 5-year survival status. 2. Feature selection via PFI was performed on both the BL dataset and the PS dataset containing biomarkers. The important features identified were utilized to create reduced datasets on which models were retrained for survival predictions. Predictions were always made on the independent test set (n = 100). XG = Extreme Gradient Boosting, RF = Random Forest, ANN = Artificial Neural Network, TN = TabNet, n feat = number of features in datasets.
- We created three predefined data subsets from the training set for model training as follows:
- (a)
- Baseline dataset (BL): All clinical data, including information collected pre-, intra-, and postoperatively, as well as the pathological TNM status (n features = 55).
- (b)
- Two preoperative data subsets for model training to assess predictive performance as follows:
- -
- Primary staging dataset (PS dataset, n features = 29): This included only variables collected during primary staging until the time of the tumor board conference. It did not involve histopathological assessment.
- -
- PS dataset plus tumor biomarkers (PS dataset + biomarkers, n features = 84). As there was no histopathological assessment available from the initial tumor biopsy, biomarkers from the tumor sample after surgical treatment were used.
- We performed feature selection via PFI based on the BL dataset or the PS dataset with biomarkers. The important variables identified were used to create reduced datasets for model retraining (BL: n features = 23/26/27/28; PS + biomarkers: n features = 38/37/38/41 for RF/XG/ANN/TN, respectively).
- After model training on the distinct data subsets, predictions were always made on the independent test set.
2.6. Statistical Analysis
Data analysis was performed with Python (version 3.8.8) using the pandas (Version 1.4.3) [50], NumPy (version 1.21.5) [51], matplotlib (version 3.5.1) [52], and scikit learn (version 1.0.2) [38] packages. Model performance was evaluated in a two-fold manner. First, 10-fold cross-validation was performed on the whole training set to obtain a measure of how well the models generalize. The cross-validation score (CV-score) represents the mean of the 10-fold accuracies and is presented along with its standard deviation (SD) in this study. Second, the trained models were tested on the independent test set. Therefore, accuracy (ACC) with its 95% confidence intervals (95% CI) and receiver operating characteristic curves (ROC) with their corresponding area under the curve (AUC) were calculated.
3. Results
3.1. AI Models Effectively Predict 5-Year Survival Using Clinical Data and Pathological TNM
The initial model training was carried out on the baseline dataset (BL) to predict long-term survival exceeding five years (Figure 2, Table 2). This predefined data subset included all available clinical data and the pathological TNM status. The clinical data consisted of preoperative data such as the medical history and staging, intraoperative data, and postoperative data such as complications and the neoadjuvant treatment, if applicable.
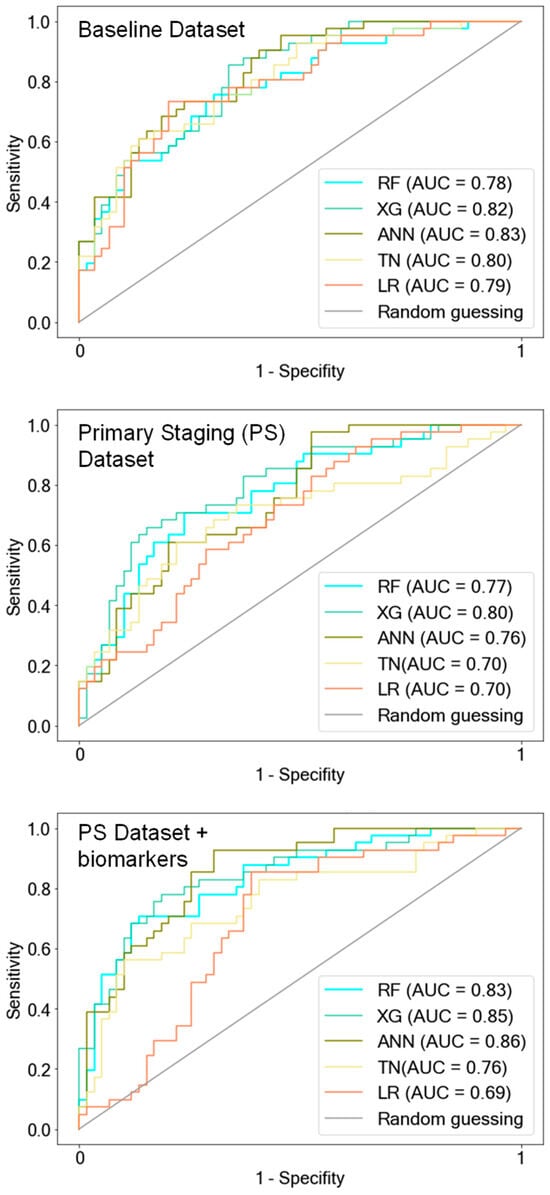
Figure 2.
ROC curves of AI models. The models were trained on the following three predefined data subsets: the baseline dataset (BL) that included all available clinical features with pathological TNM status (pTNM) but excluded tumor biomarkers, the primary staging dataset (PS) with information available during the initial diagnosis, and the PS dataset containing tumor biomarkers. Notably, the AI models exhibited a decline in predictive performance when trained exclusively with clinical information during the primary staging (PS dataset). However, the addition of tumor biomarkers to the PS dataset led to improved predictions, aligning with the performance observed when the AI models were trained on the BL dataset, which includes pTNM. LR was outperformed by the AI models when trained on the PS datasets. RF = Random Forest, XG = Extreme Gradient Boosting, ANN = Artificial Neural Network, TN = TabNet, LR = Logistic Regression.
Table 2.
Predictions on the test set (ACC, AUC) and cross-validation accuracy on the distinct training subsets (CV-score), namely, the baseline dataset (BL), the primary staging dataset (PS), and the PS dataset including tumor biomarkers (PS + biomarkers). The BL dataset contains all available clinical data including the pathological TNM status but not the tumor biomarkers. The PS dataset contains clinical data available at the primary diagnosis workup (= primary staging). RF = Random Forest, XG = Extreme Gradient Boosting, ANN = Artificial Neural Network, TN = TabNet, LR = Logistic Regression.
RF, XG, and ANN showed the best predictive performance (ACC: 0.73/0.74/0.76, AUC: 0.78/0.82/0.83 RF/XG/ANN, respectively) and the highest generalizability, as depicted by the 10-fold cross-validation accuracy (CV-score [SD]: 0.78 [0.04]/0.77 [0.04]/0.73 [0.02].
TN demonstrated similar predictive performance on the test set (ACC: 0.75, AUC: 0.8) but exhibited reduced generalizability compared with the other AI models (CV-score [SD]: 0.66 [0.03]). LR showed results similar to the better-performing AI models (ACC: 0.73; AUC: 0.79; CV-score [SD]: 0.73 [0.05]).
3.2. Including Biomarkers into Early Clinical Data Demonstrates Similar Model Performance Compared to Comprehensive Clinical Data including the TNM Status
We proceeded to assess whether the known clinical and diagnostic features until the primary staging work-up, with or without the inclusion of tumor biomarkers, are sufficient for classifying long-term versus short-term OS (Figure 2, Table 2). The predictive performance of all models decreased notably when trained on the PS dataset excluding the histopathological and clinical parameters after primary staging. Particularly noteworthy is the drop in generalizability for all models except ANN, with CV scores ranging between 0.65 and 0.67 for RF, XG, and TN.
Surprisingly, when the tumor biomarkers were integrated into the PS dataset for model training, predictions improved. Accuracies demonstrated improvements, rising from 0.7 to 0.77 for RF, from 0.73 to 0.79 for XG, from 0.71 to 0.75 for ANN, and from 0.69 to 0.72 for TN (see Table 2: PS dataset vs. PS dataset + biomarkers).
ANN not only displayed enhanced predictive performance on the test set but also exhibited good generalizability when trained with the PS dataset with biomarkers (ACC: 0.75, AUC: 0.86, CV-score ± SD: 0.76 ± 0.03). XG and RF exhibited enhanced predictive performance on the test set, achieving accuracies of 0.79 and 0.77, respectively, when biomarkers were included in the PS dataset. However, although their generalizability improved, it did not reach the level observed when trained on the BL dataset, as indicated by their CV scores of 0.69 and 0.68, respectively. LR exhibited the least accurate predictions when trained on the PS dataset (AUC: 0.7), and unlike the AI models, it did not demonstrate improvement when tumor markers were incorporated into the PS dataset (AUC: 0.69).
It is noteworthy that the predictive accuracy of the AI models subsequent to the incorporation of the biomarkers into the PS dataset became similar again to the model performance after training on the BL dataset, which included the pathological TNM status (see Table 2: PS dataset + biomarkers vs. BL dataset).
3.3. Models Trained on AI-Driven Data Subsets with Important Features Achieve Constant Predictive Performance
We conducted feature selection using PFI on both the BL dataset and the PS dataset containing biomarkers. The important features identified differ for each model after training on the respective predefined data subsets. The derived important features for both data subsets encompass a combination of clinical and histopathological data and are presented in detail in Figure 3 and Figure 4. A detailed description of all included features can be found in Supplementary Table S1.
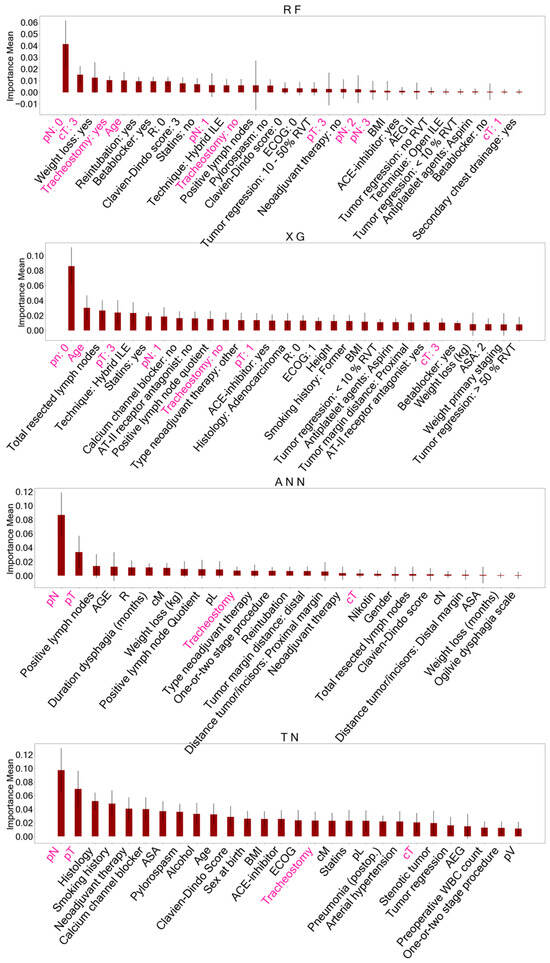
Figure 3.
Important features identified with permutation feature importance (PFI) after training AI models on the baseline dataset. These features identified for each model accounted for reduced datasets to classify overall survival. Features of ensemble models (RF, XG) are presented as dummy variables. Shared important features between all models are marked in pink. A detailed description of the other features displayed can be found in Supplementary Table S1. RF = Random Forest, XG = Extreme Gradient Boosting, ANN = Artificial Neural Network, TN = TabNet, pN = histopathological lymph node status, pT = histopathological tumor size, cT = clinical tumor size.
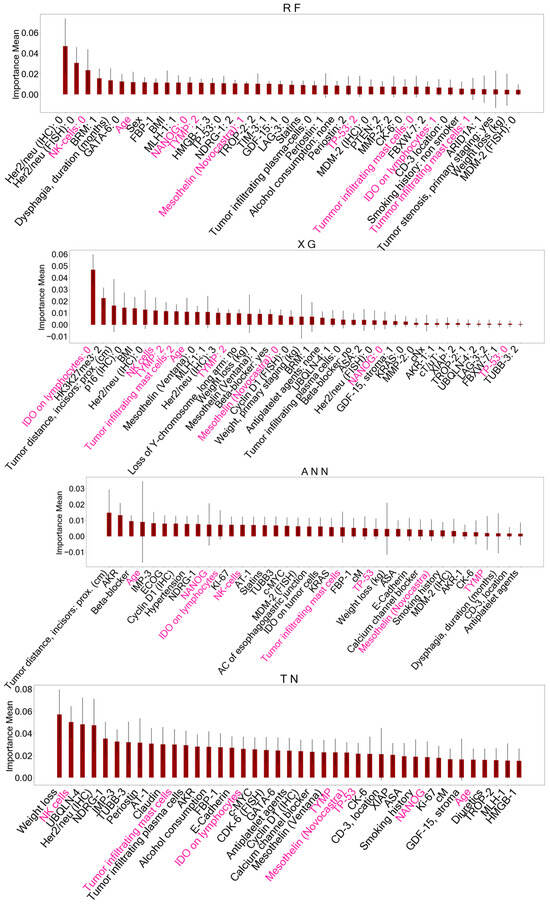
Figure 4.
Important features identified with permutation feature importance (PFI) after training AI models on the primary staging dataset including biomarkers. These variables served as reduced datasets for model training to predict survival status. Features marked in pink represent shared important features between all models. A detailed description of the other features displayed can be found in Supplementary Table S1. RF = Random Forest, XG = Extreme Gradient Boosting, ANN = Artificial Neural Network, TN = TabNet, NK cells = Natural Killer cells, NANOG = NANOG homebox protein expression, TYMP = thymidine phosphorylase expression, TP-53 = TP-53 gene expression, IDO = indoleamine 2,3-dioxygenase expressed on tumor-infiltrating lymphocytes.
With AI-driven feature selection, we identified important features for each AI model (RF/XG/ANN/TN) to create new subsets from the BL dataset and the PS dataset with biomarkers. The original BL dataset, initially consisting of 55 features, was reduced to 23/26/27/28 features, and the PS dataset with biomarkers was reduced from 84 to 38/37/38/41 features for RF/XG/ANN/TN, respectively. The model performances after training on the respective AI-driven data subsets did not decline (Table 3, Figure 5) in comparison to using all available features from the original data subsets. The accuracies of the AI models ranged between 0.73 and 0.76 when trained on the entire BL dataset and between 0.7 and 0.76 when trained on the respective AI-driven data subsets. Similarly, accuracies of the AI models ranged between 0.72 and 0.79 when trained on the entire PS dataset with biomarkers, and between 0.74 and 0.78 after training with the respective AI-driven data subset.
Table 3.
Predictions on the independent test set (ACC, AUC) and cross-validation accuracy on the respective training sets (CV-score) using the AI-driven reduced datasets after feature selection. Feature selection via permutation feature importance was performed on the baseline dataset (BL) and the primary staging dataset including tumor biomarkers (PS + biomarkers). RF = Random Forest, XG = Extreme Gradient Boosting, ANN = Artificial Neural Network, TN = TabNet.
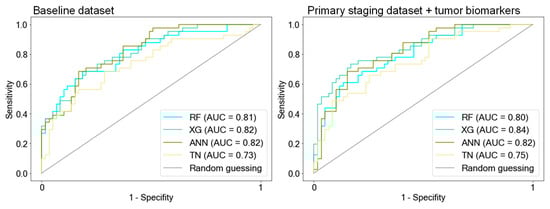
Figure 5.
ROC curves of AI models after training on AI-driven data subsets. Feature selection was performed on both the baseline dataset and the primary staging dataset, which included biomarkers. The important features identified were then used to create reduced subsets for retraining the models. Notably, the model performance after training with these AI-driven data subsets remained consistent compared to when trained on the respective original data subsets. RF = Random Forest, XG = Extreme Gradient Boosting, ANN = Artificial Neural Network, TN = TabNet.
When comparing the AI-driven important features after PFI, five features were consistently identified in all models trained on the BL dataset: histopathological lymph node status (pN), histopathological tumor size (pT), clinical tumor size (cT), age at the time of surgery, and postoperative tracheostomy. Feature selection on the PS dataset with biomarkers yielded eight shared features in all models including the following: age at the time of surgery, TP-53 gene mutation, Mesothelin expression, thymidine phosphorylase (TYMP) expression, NANOG homebox protein expression, and indoleamine 2,3-dioxygenase (IDO) expressed on tumor-infiltrating lymphocytes, as well as tumor-infiltrating Mast- and Natural killer cells (NK cells).
4. Discussion
This study analyzed the potential of AI techniques in predicting the long-term survival of EC patients. Moreover, we aimed to elucidate the relevance of biomarkers derived from tissue microarray analysis of post-surgical tumor specimens in predicting survival outcomes. We hypothesize that these biomarkers have the same predictive power as the pathological TNM status.
In our study, we demonstrate that the 5-year survival status can be predicted at a satisfactory and comparable level with an accuracy exceeding 0.73 and an AUC exceeding 0.78 using AI models such as RF, XG, ANN, and TN. The cross-validation accuracies (CV-score) of the distinct models closely aligned with the accuracies on the test set, indicating robust generalizability of the models.
These results are in accordance with previous studies by two Asian research groups. Gong et al. [3] achieved an AUC of 0.85, 0.84, and 0.83 for 5-year survival prediction using XG, ANN, and RF, respectively, with reported cross-validation accuracies higher than our study, ranging between 0.86 and 0.87. This disparity could be attributed to their notably larger dataset including more than 10,000 patients. However, our study encompassed 113 features with over half of them being biomarkers. In contrast, the referenced study group incorporated only 21 features from a database predominantly centered on some clinical data and basic histopathological information, lacking biomarkers.
Similarly, Sato et al. [5] reported an AUC of 0.88 for an ANN in predicting the 5-year survival of EC patients. This study group focused on neural networks with different architectures and did not explore other AI methods. To our knowledge, TN has never been utilized for predicting the survival status of EC. However, TN showed the least predictive capability among all AI methods tested in this study.
Although we utilized a dataset with a high missing rate, we still observed the constant and satisfactory predictive ability of the AI models. Not only predictions on the test set but also constant CV accuracies reflect the models’ ability to generalize the data even when certain information is missing. Notably, XG Boost is known to handle missing continuous values effectively. Contrarily, the other models required imputation of the continuous variables, posing the risk of introducing biases such as skewing the data towards outliers or not reflecting the true values [53]. This concern warrants caution, particularly if new diagnostic approaches are to be based on biased findings.
AI has not yet become an integral part of routine medical treatment and decision-making. Nevertheless, in recent years, numerous studies have aimed to demonstrate the advantages of these techniques, particularly in providing personalized predictions for individual patients [54,55]. Still, medical guidelines rely on studies based on statistical tests. Classic statistical tests help to understand the relationship between a data sample and a population but are less effective in making personalized predictions [56]. In this study, LR, chosen as the classical statistical approach for comparison, demonstrated inferior performance when trained on data representing the early stage of oncological treatment. Other previous studies have also shown that statistical tests, such as linear discriminant analysis for survival status [5] or traditional Cox regression models for survival prediction [4,57] in patients with EC, were outperformed by ML and DL methods.
However, AI methods also pose potential sources of bias, with overfitting being a notable concern. Overfitting occurs when models learn the training data too well, lacking the ability to generalize effectively to new data. A high-dimensional dataset, like ours, may increase the risk of overfitting. To address this bias, we utilized specific techniques. Firstly, we selected models such as RF or XG, which are less susceptible to overfitting [40,41], or deeper models such as ANN or TN that utilize an additional validation set. Secondly, we used hyperparameter optimization through Randomized or Grid Search Cross for the ML models [38] and an automated hyperparameter tuning tool (Optuna) [47] for the DL models. Additionally, we assessed cross-validation accuracy on the training set to evaluate the models’ generalization capability and compared it to their performance on the test set, as discussed later.
The robust predictive efficacy of all models, observed when trained with pre-, intra-, and postoperative data, can be attributed to the inclusion of the pathological TNM classification. In all AI models, both the pT and pN features were identified as crucial for predictions after feature selection. However, the pathological TNM status alone is insufficient for accurately classifying long-term survival status with AI, as demonstrated in the study by Sato et al. [5]. The authors found significantly poorer predictions when using ANNs trained only with the pathological TNM status compared with networks that incorporated additional data, such as pre- or postoperative clinical information.
The tumor board’s recommendation following the primary staging work-up plays a pivotal role in determining the subsequent treatment for EC [14]. Estimating survival probabilities at this early stage of oncological therapy without relying on TNM staging would be of significant interest. Thus, we asked if data available up to the time of the tumor board (results of the initial CT scan or endoscopy, tumor size in endoscopy next to the medical history, and patient baseline characteristics) is sufficient for predicting long-term survival. As previously mentioned, the predefined primary staging datasets did not include pathological TNM.
All models trained exclusively with known clinical features at the time of primary staging showed a decline in performance. However, when we incorporated tumor biomarkers into the primary staging dataset, predictive performance improved. RF, XG, and ANN demonstrated similarly robust predictions on the test set. Among them, ANN additionally exhibited good generalizability, as indicated by consistent cross-validation accuracy in contrast to the other models that exhibited inferior CV accuracies, suggesting overfitting. Model training on the baseline dataset, including pathological TNM information but not tumor biomarkers, and training on the primary staging dataset with the addition of tumor biomarkers produced similar results. This suggests that biomarkers have the potential to replace TNM for survival predictions.
The results of this study indicate that postoperative information about the tumor tissue is crucial for predicting survival status, whether in terms of TNM or tumor biomarkers. It is important to note that the tumor biomarkers used in this study were not assessed from the initial histology through endoscopic biopsy but from the tumor specimen after surgery, often following neoadjuvant therapy. As a result, biomarker expression may have changed, reflecting the impact of neoadjuvant therapy on tumor biology. In the case of the tumor response to neoadjuvant therapy, the tumor tissue undergoes changes, potentially altering the expression of biomarkers, which subsequently may differ from those observed in the primary biopsy.
Nevertheless, our experiments demonstrate that biomarkers alongside early clinical data hold comparable predictive value as the well-established TNM status combined with pre-, intra-, and postoperative clinical data. To predict survival at the time of the primary diagnosis, we propose analyzing the important tumor biomarkers identified in this study in future primary biopsies. We anticipate that biomarker analysis at this early time point will offer similar predictive value as those obtained from the final tumor specimen. Nevertheless, this hypothesis warrants confirmation.
To explore the most influential variables for survival prediction, we used permutation feature importance on the validation sets. The features identified by each model were then used to create AI-driven feature subsets, and the model’s performance was assessed on the independent test set. Interestingly, the predictive performance of the models remained consistent with the AI-driven data subsets, suggesting that the predictive performance of AI models is not highly dependent on the quantity of features. Other investigators reported similar findings with either comparable [4] or even improved performance [5] using AI-driven reduced datasets. However, the specific features that are crucial for predictions may not be evident from the outset of model training. Therefore, a two-step process, initially including all available data and then identifying important features, is recommended.
The feature selection method utilized in this study was PFI. It is important to acknowledge the pitfalls associated with this method. PFI operates under the assumption that individual features are independent and uncorrelated [58]. In the context of a medical dataset, this assumption does not reflect reality and may result in the omission of actual important information. Hence, various feature selection methods need to be compared before integrating them into a diagnostic workflow.
The comparison of important features across the models revealed five shared features in the BL dataset (pN, pT, cT, patient age at surgery, postoperative tracheostomy) and eight common features in the PS dataset including tumor biomarkers (patient age, TP-53 mutation, Mesothelin expression, TYMP expression, NANOG expression, IDO expressed on tumor-infiltrating lymphocytes, tumor-infiltrating mast and NK cells).
Lymph node involvement (pN) indicates an advanced tumor stage and has been documented as a predictive factor for the survival of patients with EC [59,60,61,62], a finding consistent with our study. Besides nodal and distant metastasis, tumor infiltration (pT) determines tumor stage, which reflects survival probabilities [11]. The clinical T (cT) status plays a significant role in determining therapy strategies, yet survival predictions based on cT remain uncertain [11].
Furthermore, age has been recognized as an important variable by other researchers who utilized ML models for survival predictions in EC patients [3,4,5]. Postoperative tracheostomy, indicative of major postoperative complications and stays in the intensive care unit, aligns with findings by Jung et al. [4], who identified those two features as important AI-driven predictors for survival in patients with upper gastrointestinal cancer. Our findings suggest that tracheostomy is an early determinant for late outcomes and that surgical complications may affect OS.
In this study, we placed particular emphasis on exploring the predictive significance of an extensive set of specified biomarkers in conjunction with other patient data for long-term survival. This aspect distinguishes our study from others that also have utilized AI methods to investigate the survival of patients with EC.
Previous in vitro studies primarily examined individual biomarkers concerning OS in patients with EC. However, the strength of AI techniques lies in its capacity to analyze all available biomarkers in combination with clinical data, enabling it to identify complex patterns and relationships that may not be apparent through traditional methods.
The expression of IDO on tumor-infiltrating lymphocytes was found to have a positive impact on OS in patients with esophageal AC [22]. High expression of NANOG, a transcription factor physiologically associated with pluripotency [63], and TYMP, a promotor of tumor angiogenesis, [64] in SCC are related to poor OS. The mentioned biomarkers were detected following AI-driven feature selection in all models. These findings emphasize the potential clinical relevance of these biomarkers in the context of predicting survival outcomes.
While previous studies did not find a correlation between TP53 mutation [31] and mesothelin expression in either SCC or ACC [26] with OS, this study revealed that TP53 mutation and mesothelin expression were important features in predicting 5-year survival status in all models. This may suggest that these biomarkers, while not individually predictive, become relevant when considered in combination with other markers, as presented in the datasets of this study.
A positive correlation between tumor-infiltrating NK cell density [65] as well as an inverse correlation between mast cell density [66,67] in esophageal SCC and OS was reported. In this study, all models trained on the PS dataset including the tumor biomarkers identified mast and NK cells in the tumor microenvironment as important variables for classifying 5-year survival. Nevertheless, this study does not provide a deeper understanding of the interaction and activation status of these immune cells in EC.
These biomarkers, derived from the final tumor sample and evaluated in reduced datasets, could potentially serve as a basis for future examination in primary biopsies. The assessment of multiple tumor markers on primary biopsies is constrained compared to the final tumor specimen, which evidently provides a larger tissue volume for analysis. Nevertheless, our study provides the opportunity to concentrate on the identified important biomarkers and investigate them in a primary biopsy. Additionally, consideration of the entire tumor sample, including the surrounding healthy tissue, and transition zone, enables a comprehensive understanding of the tumor environment. Therefore, biomarkers related to the surrounding tumor microenvironment, like IDO on tumor-infiltrating lymphocytes [22], should be considered in primary biopsies, involving targeted sampling in healthy, surrounding tissue.
In summary, the findings of this study indicate that early survival prediction in cancer treatment is feasible when additional histopathological information about the tumor is taken into account. The strength of this study lies in the integration of clinical patient data with biomarkers for analysis with AI methods. The biomarkers utilized in this study, in conjunction with early clinical data, exhibited similar predictive capability for long-term survival when compared with comprehensive data from various time points of oncological treatment combined with the pathological TNM status. This offers an opportunity to further explore their predictive value, which may become a valuable tool for personalized medicine in the future.
5. Limitations
This study intentionally incorporated features with a substantial percentage of missing values of clinical relevance. In the field of data science, there are no established guidelines concerning an acceptable threshold for missing values in a dataset, which thus remains a field of empirical testing. Preliminary studies revealed that models trained with fewer missing values, but consequently, fewer input features declined in performance. To address the issue of missing data and prevent bias, missing values in categorical variables were handled by considering them as a distinct category during the training process.
Permutation feature importance (PFI) was utilized as a tool for feature selection in this study. It is important to note that PFI may be less suitable for models trained on correlated features, as it can introduce a bias by distributing importance among correlated features.
In the case of ML models, one-hot encoding, which involves converting a categorical variable into its individual categories, offers a better understanding of the importance of each individual category of a feature. However, it does not provide insights into whether the presence (TRUE) or absence (FALSE) of a dummy variable is responsible for the prediction. Making statements about the importance of specific categories becomes even more challenging with DL methods, as these models preserve the structure of categorical variables and represent their categories using embeddings, making it difficult to directly assess category importance.
The biomarkers investigated in this study were derived from post-surgical tumor specimens, often after neoadjuvant therapy, rather than from the initial endoscopic biopsy. Future research should prioritize the analysis of biomarkers from early tumor biopsies to investigate survival predictions based on tumor characteristics.
This study represents an initial effort to integrate clinical data with an extensive array of biomarkers for the purpose of AI-guided survival prediction. Some of the identified important biomarkers have been analyzed before by study groups of our clinic regarding their prognostic value in EC [22,26,31]. Our study did not delve deeply into providing a comprehensive explanation for the selection of specific biomarkers as crucial predictors of overall survival (OS) in patients with EC. This limitation is partly associated with the chosen method, namely PFI, for feature selection. PFI does not specify the aspects of the feature space that may be important for survival prognostication. Addressing this issue is a relevant objective for future investigations, with the aim of improving the model’s comprehensibility.
Additionally, while the AI models were validated using an independent test dataset, it is important to acknowledge that this dataset is of retrospective nature and was sourced from the same hospital as the training data, potentially introducing sampling bias.
6. Conclusions
In conclusion, this study illustrates the potential of AI models in predicting long-term survival for patients with EC. By combining early clinical data and histopathological biomarkers, these models demonstrated strong predictive performance, outperforming traditional statistical methods. The differences in performance between AI models were minimal.
Furthermore, AI-driven feature selection helped to identify important variables for survival prediction, leading to the development of AI-driven data subsets. The models trained with these essential features maintained their performance at a level similar to those trained on the respective original datasets.
Notably, the results suggest that classification of long-term OS in patients with EC is feasible in the early course of cancer treatment when detailed histopathological information about the tumor is considered. The use of biomarkers in combination with early clinical data prior to oncological treatment showed promise in potentially substituting extensive clinical data collected at various stages of oncological treatment with the necessity for postoperative assessment of the pathological TNM status for survival predictions. However, further research is needed to validate the significance of these tumor biomarkers in primary biopsies and to explore their predictive value.
Guidelines for the appropriate utilization of AI necessitate development when integrating these methods into medical workflows. This entails establishing thresholds for acceptable levels of missing values in real-world medical datasets, implementing methods for feature selection, and defining robust and interpretable models tailored for medical applications.
Supplementary Materials
The following supporting information can be downloaded at: https://www.mdpi.com/article/10.3390/make6010032/s1, Supplementary Table S1: Original dataset containing 1002 patients with esophageal cancer that underwent surgical therapy, Supplementary Table S2: Hyperparameters for each model after optimization. Randomized and Grid Search Cross Validation was used for Random Forest (RF), XG-Boost (XG) and Logistig Regression (LR), Supplementary references.
Author Contributions
Methodology, L.L., J.P., K.B. and F.P.; Validation, F.P.; Formal analysis, L.L.; Investigation, L.L.; Data curation, L.L., N.W., A.D., F.G., A.Q. and F.P.; Writing—original draft, L.L.; Writing—review & editing, L.L., J.P., N.W., J.-O.J., K.K., R.D., W.S., F.G., T.S., K.B., C.B. and F.P.; Visualization, L.L.; Supervision, K.B. and F.P. All authors have read and agreed to the published version of the manuscript.
Funding
This research received no external funding.
Data Availability Statement
The data presented in this study are available on request from the corresponding author.
Conflicts of Interest
The authors declare no conflict of interest.
References
- Topol, E.J. High-performance medicine: The convergence of human and artificial intelligence. Nat. Med. 2019, 25, 44–56. [Google Scholar] [CrossRef] [PubMed]
- Janiesch, C.; Zschech, P.; Heinrich, K. Machine learning and deep learning. Electron. Mark. 2021, 31, 685–695. [Google Scholar] [CrossRef]
- Gong, X.; Zheng, B.; Xu, G.; Chen, H.; Chen, C. Application of machine learning approaches to predict the 5-year survival status of patients with esophageal cancer. J. Thorac. Dis. 2021, 13, 6240–6251. [Google Scholar] [CrossRef] [PubMed]
- Jung, J.O.; Crnovrsanin, N.; Wirsik, N.M.; Nienhüser, H.; Peters, L.; Popp, F.; Schulze, A.; Wagner, M.; Müller-Stich, B.P.; Büchler, M.W.; et al. Machine learning for optimized individual survival prediction in resectable upper gastrointestinal cancer. J. Cancer Res. Clin. Oncol. 2022, 149, 1691–1702. [Google Scholar] [CrossRef]
- Sato, F.; Shimada, Y.; Selaru, F.M.; Shibata, D.; Maeda, M.; Watanabe, G.; Mori, Y.; Stass, S.A.; Imamura, M.; Meltzer, S.J. Prediction of survival in patients with esophageal carcinoma using artificial neural networks. Cancer 2005, 103, 1596–1605. [Google Scholar] [CrossRef]
- Alaskar, H.; Saba, T. Machine Learning and Deep Learning: A Comparative Review; Springer: Singapore, 2021. [Google Scholar] [CrossRef]
- Korteling, J.E.; van de Boer-Visschedijk, G.C.; Blankendaal, R.A.M.; Boonekamp, R.C.; Eikelboom, A.R. Human- versus Artificial Intelligence. Front. Artif. Intell. 2021, 4, 622364. [Google Scholar] [CrossRef]
- Bolger, J.C.; Donohoe, C.L.; Lowery, M.; Reynolds, J.V. Advances in the curative management of oesophageal cancer. Br. J. Cancer 2022, 126, 706–717. [Google Scholar] [CrossRef]
- Al-Batran, S.E.; Homann, N.; Pauligk, C.; Goetze, T.O.; Meiler, J.; Kasper, S.; Kopp, H.G.; Mayer, F.; Haag, G.M.; Luley, K.; et al. Perioperative chemotherapy with fluorouracil plus leucovorin, oxaliplatin, and docetaxel versus fluorouracil or capecitabine plus cisplatin and epirubicin for locally advanced, resectable gastric or gastro-oesophageal junction adenocarcinoma (FLOT4): A randomised, phase 2/3 trial. Lancet 2019, 393, 1948–1957. [Google Scholar] [CrossRef]
- Eyck, B.M.; Lanschot, J.J.B.v.; Hulshof, M.C.C.M.; Wilk, B.J.v.d.; Shapiro, J.; Hagen, P.v.; Henegouwen, M.I.v.B.; Wijnhoven, B.P.L.; Laarhoven, H.W.M.v.; Nieuwenhuijzen, G.A.P.; et al. Ten-Year Outcome of Neoadjuvant Chemoradiotherapy Plus Surgery for Esophageal Cancer: The Randomized Controlled CROSS Trial. J. Clin. Oncol. 2021, 39, 1995–2004. [Google Scholar] [CrossRef]
- Rice, T.W.; Patil, D.T.; Blackstone, E.H. 8th edition AJCC/UICC staging of cancers of the esophagus and esophagogastric junction: Application to clinical practice. Ann. Cardiothorac. Surg. 2017, 6, 119–130. [Google Scholar] [CrossRef]
- Robert Koch Institute; The Association of Population-Based Cancer Registries in Germany (Eds.) Cancer in Germany 2017/2018; Robert Koch Institute: Berlin, Germany, 2022; pp. 36–39. [Google Scholar]
- Siegel, R.L.; Miller, K.D.; Fuchs, H.E.; Jemal, A. Cancer statistics, 2022. CA A Cancer J. Clin. 2022, 72, 7–33. [Google Scholar] [CrossRef] [PubMed]
- Leitlinienprogramm Onkologie (Deutsche Krebsgesellschaft, D.K., AWMF). Diagnostik und Therapie der Plattenepithelkarzinome und Adenokarzinome des Ösophagus, Langversion 4.0. AWMF-Registernummer: 021-023OL 2023. Available online: https://www.leitlinienprogramm-onkologie.de/leitlinien/oesophaguskarzinom/ (accessed on 14 March 2024).
- Boniface, M.M.; Wani, S.B.; Schefter, T.E.; Koo, P.J.; Meguid, C.; Leong, S.; Kaplan, J.B.; Wingrove, L.J.; McCarter, M.D. Multidisciplinary management for esophageal and gastric cancer. Cancer Manag. Res. 2016, 8, 39–44. [Google Scholar] [CrossRef]
- Sun, J.-M.; Shen, L.; Shah, M.A.; Enzinger, P.; Adenis, A.; Doi, T.; Kojima, T.; Metges, J.-P.; Li, Z.; Kim, S.-B.; et al. Pembrolizumab plus chemotherapy versus chemotherapy alone for first-line treatment of advanced oesophageal cancer (KEYNOTE-590): A randomised, placebo-controlled, phase 3 study. Lancet 2021, 398, 759–771. [Google Scholar] [CrossRef]
- Shapiro, J.; van Lanschot, J.J.B.; Hulshof, M.; van Hagen, P.; van Berge Henegouwen, M.I.; Wijnhoven, B.P.L.; van Laarhoven, H.W.M.; Nieuwenhuijzen, G.A.P.; Hospers, G.A.P.; Bonenkamp, J.J.; et al. Neoadjuvant chemoradiotherapy plus surgery versus surgery alone for oesophageal or junctional cancer (CROSS): Long-term results of a randomised controlled trial. Lancet Oncol. 2015, 16, 1090–1098. [Google Scholar] [CrossRef] [PubMed]
- Damanakis, A.; Plum, P.S.; Gebauer, F.; Schröder, W.; Büttner, R.; Zander, T.; Bruns, C.J.; Quaas, A. Fructose-1,6-bisphosphatase 1 (FBP1) is an independent biomarker associated with a favorable prognosis in esophageal adenocarcinoma. J. Cancer Res. Clin. Oncol. 2022, 148, 2287–2293. [Google Scholar] [CrossRef] [PubMed]
- Essakly, A.; Loeser, H.; Kraemer, M.; Alakus, H.; Chon, S.H.; Zander, T.; Buettner, R.; Hillmer, A.M.; Bruns, C.J.; Schroeder, W.; et al. PIK3CA and KRAS Amplification in Esophageal Adenocarcinoma and their Impact on the Inflammatory Tumor Microenvironment and Prognosis. Transl. Oncol. 2020, 13, 157–164. [Google Scholar] [CrossRef]
- Gebauer, F.; Krämer, M.; Bruns, C.; Schlößer, H.A.; Thelen, M.; Lohneis, P.; Schröder, W.; Zander, T.; Alakus, H.; Buettner, R.; et al. Lymphocyte activation gene-3 (LAG3) mRNA and protein expression on tumour infiltrating lymphocytes (TILs) in oesophageal adenocarcinoma. J. Cancer Res. Clin. Oncol. 2020, 146, 2319–2327. [Google Scholar] [CrossRef] [PubMed]
- Hoppe, S.; Meder, L.; Gebauer, F.; Ullrich, R.T.; Zander, T.; Hillmer, A.M.; Buettner, R.; Plum, P.; Puppe, J.; Malter, W.; et al. Trophoblast Cell Surface Antigen 2 (TROP2) as a Predictive Bio-Marker for the Therapeutic Efficacy of Sacituzumab Govitecan in Adenocarcinoma of the Esophagus. Cancers 2022, 14, 4789. [Google Scholar] [CrossRef]
- Loeser, H.; Kraemer, M.; Gebauer, F.; Bruns, C.; Schröder, W.; Zander, T.; Alakus, H.; Hoelscher, A.; Buettner, R.; Lohneis, P.; et al. Indoleamine 2,3-Dioxygenase (IDO) Expression Is an Independent Prognostic Marker in Esophageal Adenocarcinoma. J. Immunol. Res. 2020, 2020, 2862647. [Google Scholar] [CrossRef]
- Loeser, H.; Schallenberg, S.; von Winterfeld, M.; Tharun, L.; Alakus, H.; Hölscher, A.; Bollschweiler, E.; Buettner, R.; Zander, T.; Quaas, A. High protein and mRNA expression levels of TUBB3 (class III ß-tubulin) are associated with aggressive tumor features in esophageal adenocarcinomas. Oncotarget 2017, 8, 115179–115189. [Google Scholar] [CrossRef][Green Version]
- Loeser, H.; Scholz, M.; Fuchs, H.; Essakly, A.; Damanakis, A.I.; Zander, T.; Büttner, R.; Schröder, W.; Bruns, C.; Quaas, A.; et al. Integrin alpha V (ITGAV) expression in esophageal adenocarcinoma is associated with shortened overall-survival. Sci. Rep. 2020, 10, 18411. [Google Scholar] [CrossRef] [PubMed]
- Loeser, H.; Wölwer, C.B.; Alakus, H.; Chon, S.H.; Zander, T.; Buettner, R.; Hillmer, A.M.; Bruns, C.J.; Schroeder, W.; Gebauer, F.; et al. Y Chromosome Loss is a Frequent Event in Barrett’s Adenocarcinoma and Associated with Poor Outcome. Cancers 2020, 12, 1743. [Google Scholar] [CrossRef] [PubMed]
- Moentenich, V.; Comut, E.; Gebauer, F.; Tuchscherer, A.; Bruns, C.; Schroeder, W.; Buettner, R.; Alakus, H.; Loeser, H.; Zander, T.; et al. Mesothelin expression in esophageal adenocarcinoma and squamous cell carcinoma and its possible impact on future treatment strategies. Ther. Adv. Med. Oncol. 2020, 12, 1758835920917571. [Google Scholar] [CrossRef]
- Moentenich, V.; Gebauer, F.; Comut, E.; Tuchscherer, A.; Bruns, C.; Schroeder, W.; Buettner, R.; Alakus, H.; Loeser, H.; Zander, T.; et al. Claudin 18.2 expression in esophageal adenocarcinoma and its potential impact on future treatment strategies. Oncol. Lett. 2020, 19, 3665–3670. [Google Scholar] [CrossRef]
- Plum, P.S.; Gebauer, F.; Krämer, M.; Alakus, H.; Berlth, F.; Chon, S.H.; Schiffmann, L.; Zander, T.; Büttner, R.; Hölscher, A.H.; et al. HER2/neu (ERBB2) expression and gene amplification correlates with better survival in esophageal adenocarcinoma. BMC Cancer 2019, 19, 38. [Google Scholar] [CrossRef]
- Plum, P.S.; Löser, H.; Zander, T.; Essakly, A.; Bruns, C.J.; Hillmer, A.M.; Alakus, H.; Schröder, W.; Büttner, R.; Gebauer, F.; et al. GATA binding protein 6 (GATA6) is co-amplified with PIK3CA in patients with esophageal adenocarcinoma and is linked to neoadjuvant therapy. J. Cancer Res. Clin. Oncol. 2021, 147, 1031–1040. [Google Scholar] [CrossRef]
- Plum, P.S.; Ulase, D.; Bollschweiler, E.; Chon, S.H.; Berlth, F.; Zander, T.; Alakus, H.; Hölscher, A.H.; Bruns, C.J.; Schallenberg, S.; et al. Upregulation of insulin-like growth factor II mRNA-binding protein 3 (IMP3) has negative prognostic impact on early invasive (pT1) adenocarcinoma of the esophagus. J. Cancer Res. Clin. Oncol. 2018, 144, 1731–1739. [Google Scholar] [CrossRef] [PubMed]
- Quaas, A.; Heydt, C.; Gebauer, F.; Alakus, H.; Loeser, H.; Buettner, R.; Hillmer, A.; Bruns, C.; Merkelbach-Bruse, S.; Zander, T.; et al. Genomic Characterization of TP53-Wild-Type Esophageal Carcinoma. Transl. Oncol. 2019, 12, 154–161. [Google Scholar] [CrossRef]
- Quaas, A.; Pamuk, A.; Klein, S.; Quantius, J.; Rehkaemper, J.; Barutcu, A.G.; Rueschoff, J.; Zander, T.; Gebauer, F.; Hillmer, A.; et al. Sex-specific prognostic effect of CD66b-positive tumor-infiltrating neutrophils (TANs) in gastric and esophageal adenocarcinoma. Gastric Cancer 2021, 24, 1213–1226. [Google Scholar] [CrossRef]
- Quaas, A.; Rehkaemper, J.; Rueschoff, J.; Pamuk, A.; Zander, T.; Hillmer, A.; Siemanowski, J.; Wittig, J.; Buettner, R.; Plum, P.; et al. Occurrence of High Microsatellite-Instability/Mismatch Repair Deficiency in Nearly 2,000 Human Adenocarcinomas of the Gastrointestinal Tract, Pancreas, and Bile Ducts: A Study From a Large German Comprehensive Cancer Center. Front. Oncol. 2021, 11, 569475. [Google Scholar] [CrossRef]
- Schallenberg, S.; Bork, J.; Essakly, A.; Alakus, H.; Buettner, R.; Hillmer, A.M.; Bruns, C.; Schroeder, W.; Zander, T.; Loeser, H.; et al. Loss of the SWI/SNF-ATPase subunit members SMARCF1 (ARID1A), SMARCA2 (BRM), SMARCA4 (BRG1) and SMARCB1 (INI1) in oesophageal adenocarcinoma. BMC Cancer 2020, 20, 12. [Google Scholar] [CrossRef]
- Schiffmann, L.M.; Göbel, H.; Löser, H.; Schorn, F.; Werthenbach, J.P.; Fuchs, H.F.; Plum, P.S.; Bludau, M.; Zander, T.; Schröder, W.; et al. Elevated X-linked inhibitor of apoptosis protein (XIAP) expression uncovers detrimental prognosis in subgroups of neoadjuvant treated and T-cell rich esophageal adenocarcinoma. BMC Cancer 2019, 19, 531. [Google Scholar] [CrossRef]
- Schoemig-Markiefka, B.; Eschbach, J.; Scheel, A.H.; Pamuk, A.; Rueschoff, J.; Zander, T.; Buettner, R.; Schroeder, W.; Bruns, C.J.; Loeser, H.; et al. Optimized PD-L1 scoring of gastric cancer. Gastric Cancer 2021, 24, 1115–1122. [Google Scholar] [CrossRef] [PubMed]
- Schoemmel, M.; Loeser, H.; Kraemer, M.; Wagener-Ryczek, S.; Hillmer, A.; Bruns, C.; Thelen, M.; Schröder, W.; Zander, T.; Lechner, A.; et al. Distribution of tumor-infiltrating-T-lymphocytes and possible tumor-escape mechanisms avoiding immune cell attack in locally advanced adenocarcinomas of the esophagus. Clin. Transl. Oncol. 2021, 23, 1601–1610. [Google Scholar] [CrossRef] [PubMed]
- Pedregosa, F.; Varoquaux, G.; Gramfort, A.; Michel, V.; Thirion, B.; Grisel, O.; Blondel, M.; Prettenhofer, P.; Weiss, R.; Dubourg, V. Scikit-learn: Machine Learning in Python. J. Mach. Learn. Res. 2011, 12, 2825–2830. [Google Scholar] [CrossRef]
- Breiman, L. Random forests. Mach. Learn. 2001, 45, 5–32. [Google Scholar] [CrossRef]
- Biau, G. Analysis of a random forests model. J. Mach. Learn. Res. 2012, 13, 1063–1095. [Google Scholar] [CrossRef]
- Chen, T.; Guestrin, C. XGBoost: A Scalable Tree Boosting System. In Proceedings of the 22nd ACM SIGKDD International Conference on Knowledge Discovery and Data Mining, San Francisco, CA, USA, 13–17 August 2016; pp. 785–794. [Google Scholar] [CrossRef]
- Walczak, S.; Cerpa, N. Artificial Neural Networks. In Encyclopedia of Physical Science and Technology, 3rd ed.; Meyers, R.A., Ed.; Academic Press: New York, NY, USA, 2003; pp. 631–645. [Google Scholar] [CrossRef]
- Howard, J.; Gugger, S. Fastai: A Layered API for Deep Dearning. Information 2020, 11, 108. [Google Scholar] [CrossRef]
- Arik, S.Ö.; Pfister, T. TabNet: Attentive Interpretable Tabular Learning. In Proceedings of the AAAI Conference on Artificial Intelligence, Online, 2–9 February 2021. [Google Scholar] [CrossRef]
- Dreamquark. Pytorch_Tabnet. 2019. Available online: https://dreamquark-ai.github.io/tabnet/index.html (accessed on 21 October 2022).
- Kleinbaum, D.G. Introduction to Logistic Regression. In Logistic Regression: A Self-Learning Text; Springer: New York, NY, USA, 1994; pp. 1–38. [Google Scholar] [CrossRef]
- Akiba, T.; Sano, S.; Yanase, T.; Ohta, T.; Koyama, M. Optuna: A next-generation hyperparameter optimization framework. In Proceedings of the 25th ACM SIGKDD International Conference on Knowledge Discovery & Data Mining, Anchorage, AK, USA, 4–8 August 2019. [Google Scholar] [CrossRef]
- Altmann, A.; Toloşi, L.; Sander, O.; Lengauer, T. Permutation importance: A corrected feature importance measure. Bioinformatics 2010, 26, 1340–1347. [Google Scholar] [CrossRef] [PubMed]
- Mueller, Z. Walkwithfastai. 2020. Available online: https://walkwithfastai.com/Regression_and_Permutation_Importance (accessed on 3 November 2022).
- McKinney, W. Data structures for statistical computing in python. In Proceedings of the 9th Python in Science Conference, Austin, TX, USA, 28–30 June 2010. [Google Scholar]
- Harris, C.R.; Millman, K.J.; Van Der Walt, S.J.; Gommers, R.; Virtanen, P.; Cournapeau, D.; Wieser, E.; Taylor, J.; Berg, S.; Smith, N.J. Array programming with NumPy. Nature 2020, 585, 357–362. [Google Scholar] [CrossRef]
- Hunter, J.D. Matplotlib: A 2D graphics environment. Comput. Sci. Eng. 2007, 9, 90–95. [Google Scholar] [CrossRef]
- Donders, A.R.T.; van der Heijden, G.J.M.G.; Stijnen, T.; Moons, K.G.M. Review: A gentle introduction to imputation of missing values. J. Clin. Epidemiol. 2006, 59, 1087–1091. [Google Scholar] [CrossRef] [PubMed]
- Hashimoto, D.A.; Rosman, G.; Rus, D.; Meireles, O.R. Artificial Intelligence in Surgery: Promises and Perils. Ann. Surg. 2018, 268, 70–76. [Google Scholar] [CrossRef] [PubMed]
- Visaggi, P.; Barberio, B.; Gregori, D.; Azzolina, D.; Martinato, M.; Hassan, C.; Sharma, P.; Savarino, E.; de Bortoli, N. Systematic review with meta-analysis: Artificial intelligence in the diagnosis of oesophageal diseases. Aliment. Pharmacol. Ther. 2022, 55, 528–540. [Google Scholar] [CrossRef] [PubMed]
- Bzdok, D.; Altman, N.; Krzywinski, M. Statistics versus machine learning. Nat. Methods 2018, 15, 233–234. [Google Scholar] [CrossRef] [PubMed]
- Rahman, S.A.; Walker, R.C.; Maynard, N.; Trudgill, N.; Crosby, T.; Cromwell, D.A.; Underwood, T.J. The AUGIS Survival Predictor: Prediction of Long-term and Conditional Survival after Esophagectomy Using Random Survival Forests. Ann. Surg. 2021, 277, 267–274. [Google Scholar] [CrossRef]
- Molnar, C.; König, G.; Herbinger, J.; Freiesleben, T.; Dandl, S.; Scholbeck, C.A.; Casalicchio, G.; Grosse-Wentrup, M.; Bischl, B. General pitfalls of model-agnostic interpretation methods for machine learning models. In International Workshop on Extending Explainable AI beyond Deep Models and Classifiers; Springer: Berlin/Heidelberg, Germany, 2020. [Google Scholar] [CrossRef]
- Hosch, S.B.; Stoecklein, N.H.; Pichlmeier, U.; Rehders, A.; Scheunemann, P.; Niendorf, A.; Knoefel, W.T.; Izbicki, J.R. Esophageal cancer: The mode of lymphatic tumor cell spread and its prognostic significance. J. Clin. Oncol. 2001, 19, 1970–1975. [Google Scholar] [CrossRef]
- Mariette, C.; Piessen, G.; Briez, N.; Triboulet, J.P. The number of metastatic lymph nodes and the ratio between metastatic and examined lymph nodes are independent prognostic factors in esophageal cancer regardless of neoadjuvant chemoradiation or lymphadenectomy extent. Ann. Surg. 2008, 247, 365–371. [Google Scholar] [CrossRef]
- Swanson, S.J.; Batirel, H.F.; Bueno, R.; Jaklitsch, M.T.; Lukanich, J.M.; Allred, E.; Mentzer, S.J.; Sugarbaker, D.J. Transthoracic esophagectomy with radical mediastinal and abdominal lymph node dissection and cervical esophagogastrostomy for esophageal carcinoma. Ann. Thorac. Surg. 2001, 72, 1918–1924; discussion 1924–1915. [Google Scholar] [CrossRef]
- Damanakis, A.I.; Gebauer, F.; Stapper, A.; Schlößer, H.A.; Ghadimi, M.; Schmidt, T.; Schiffmann, L.M.; Fuchs, H.; Zander, T.; Quaas, A.; et al. Combined regression score predicts outcome after neoadjuvant treatment of oesophageal cancer. Br. J. Cancer 2023, 128, 2025–2035. [Google Scholar] [CrossRef]
- Narusaka, T.; Ohara, T.; Noma, K.; Nishiwaki, N.; Katsura, Y.; Kato, T.; Sato, H.; Tomono, Y.; Kikuchi, S.; Tazawa, H.; et al. Nanog is a promising chemoresistant stemness marker and therapeutic target by iron chelators for esophageal cancer. Int. J. Cancer 2021, 149, 347–357. [Google Scholar] [CrossRef] [PubMed]
- Shimada, H.; Takeda, A.; Shiratori, T.; Nabeya, Y.; Okazumi, S.-i.; Matsubara, H.; Funami, Y.; Hayashi, H.; Gunji, Y.; Kobayashi, S.; et al. Prognostic significance of serum thymidine phosphorylase concentration in esophageal squamous cell carcinoma. Cancer 2002, 94, 1947–1954. [Google Scholar] [CrossRef]
- Lv, L.; Pan, K.; Li, X.D.; She, K.L.; Zhao, J.J.; Wang, W.; Chen, J.G.; Chen, Y.B.; Yun, J.P.; Xia, J.C. The accumulation and prognosis value of tumor infiltrating IL-17 producing cells in esophageal squamous cell carcinoma. PLoS ONE 2011, 6, e18219. [Google Scholar] [CrossRef]
- Elpek, G.O.; Gelen, T.; Aksoy, N.H.; Erdoğan, A.; Dertsiz, L.; Demircan, A.; Keleş, N. The prognostic relevance of angiogenesis and mast cells in squamous cell carcinoma of the oesophagus. J. Clin. Pathol. 2001, 54, 940–944. [Google Scholar] [CrossRef] [PubMed]
- Fakhrjou, A.; Niroumand-Oscoei, S.M.; Somi, M.H.; Ghojazadeh, M.; Naghashi, S.; Samankan, S. Prognostic value of tumor-infiltrating mast cells in outcome of patients with esophagus squamous cell carcinoma. J. Gastrointest. Cancer 2014, 45, 48–53. [Google Scholar] [CrossRef] [PubMed]


Disclaimer/Publisher’s Note: The statements, opinions and data contained in all publications are solely those of the individual author(s) and contributor(s) and not of MDPI and/or the editor(s). MDPI and/or the editor(s) disclaim responsibility for any injury to people or property resulting from any ideas, methods, instructions or products referred to in the content. |
© 2024 by the authors. Licensee MDPI, Basel, Switzerland. This article is an open access article distributed under the terms and conditions of the Creative Commons Attribution (CC BY) license (https://creativecommons.org/licenses/by/4.0/).