Review

A Review of Orebody Knowledge Enhancement Using Machine Learning on Open-Pit Mine Measure-While-Drilling Data

by
Daniel M. Goldstein
*,
Chris Aldrich
and
Louisa O’Connor
Western Australian School of Mines: Minerals, Energy and Chemical Engineering, Curtin University, GPO Box U1987, Perth, WA 6845, Australia
*
Author to whom correspondence should be addressed.
Mach. Learn. Knowl. Extr. 2024, 6(2), 1343-1360; https://doi.org/10.3390/make6020063
Submission received: 22 February 2024 / Revised: 1 June 2024 / Accepted: 5 June 2024 / Published: 18 June 2024
(This article belongs to the Topic Big Data Intelligence: Methodologies and Applications)

Abstract

:
Measure while drilling (MWD) refers to the acquisition of real-time data associated with the drilling process, including information related to the geological characteristics encountered in hard-rock mining. The availability of large quantities of low-cost MWD data from blast holes compared to expensive and sparsely collected orebody knowledge (OBK) data from exploration drill holes make the former more desirable for characterizing pre-excavation subsurface conditions. Machine learning (ML) plays a critical role in the real-time or near-real-time analysis of MWD data to enable timely enhancement of OBK for operational purposes. Applications can be categorized into three areas, focused on the mechanical properties of the rock mass, the lithology of the rock, as well as, related to that, the estimation of the geochemical species in the rock mass. From a review of the open literature, the following can be concluded: (i) The most important MWD metrics are the rate of penetration (rop), torque (tor), weight on bit (wob), bit air pressure (bap), and drill rotation speed (rpm). (ii) Multilayer perceptron analysis has mostly been used, followed by Gaussian processes and other methods, mainly to identify rock types. (iii) Recent advances in deep learning methods designed to deal with unstructured data, such as borehole images and vibrational signals, have not yet been fully exploited, although this is an emerging trend. (iv) Significant recent developments in explainable artificial intelligence could also be used to better advantage in understanding the association between MWD metrics and the mechanical and geochemical structure and properties of drilled rock.

1. Introduction

Measurement while drilling (MWD) originated from Schlumberger’s downhole electrical logging system in 1911, which was exclusively successful within the oil industry [1]. They described MWD as a system of sensors collecting performance data during rock drilling of open-pit mining production blast holes that can be correlated with pre-excavation subsurface conditions. Using MWD as a characterization system is desirable due to the low cost and high resolution of blast holes. On the other hand, exploration drill holes are expensive and are rarely collected in comparison.
While MWD was introduced to the open-pit mining environment in the 1970s, its use to characterize the subsurface was limited due to the high volume of analogue data to manually analyse. To address this limitation, computerized data acquisition of MWD variables to broadly determine lithological boundaries in open-pit mining was introduced around the 1980s [2,3,4,5,6,7]. Evolving from this initial use of computerized MWD rock recognition, this literature review focuses on the progression of advancing analytics, including machine learning (ML) algorithms, in MWD data to determine the geotechnical, geological, and geochemical subsurface characteristics before open-pit mining.
To perform the above correlations, multiple MWD metrics are collected by researchers. Depending on the manufacturer system setup, MWD datapoints are generated as time series or depth series in blast holes ranging from 10 m deep in surface iron ore mines to over 60 m in open-pit coal mines [8]. The most common variables acquired in open-pit mining MWD systems are time, depth, rate of penetration (rop), torque or rotational pressure (tor), bit air pressure (bap; also called flushing air pressure), weight on bit (wob; also called weight on rods, thrust, or feed pressure), and rotary speed or revolutions per minute (rpm) [9]. Other less commonly collected variables are the drilling acoustic changes and vibrations of the drill rods [10].
Due to the continuous nature of drill and blast cycles for excavation in open-pit operations, enormous quantities of MWD datapoints are collected. Due to this sheer volume of data to analyse, researchers have recently begun applying artificial intelligence to MWD datasets to understand nonlinear trends between drill responses and subsurface composition. For instance, a single productive rig at an open-pit iron ore mine may drill around one hundred 10–12 m blast holes per day, generating a minimum of 10,000 MWD observations with several responses per observation, including rop, tor, wob, bap, and rpm [11]. Many major iron ore mines employ around a dozen simultaneously operating blast drills. Despite the abundance of data, as shown in Section 2 most studies have focused on broad classification of rock types or hardness using rop to denote lithological boundaries rather than detailed characterization of each rock type. In industry, mine technical services professionals are not necessarily appropriately skilled to analyse large volumes of data in the brief time period between drilling blast holes and loading of explosives.
The objective of this study is to present a systematic and thorough examination of the existing body of research pertaining to the utilization of ML algorithms in the analysis of MWD data for the purpose of characterizing rock in mining operations. Furthermore, this study incorporates a comprehensive analysis of algorithms employed for assessing the significance of each metric related to the MWD technique, in relation to variations in the subsurface, such as rock strength, fracture frequency, elemental composition, and density. Additionally, it explores the potential of ML algorithms and their prospective utilization in forthcoming applications. Figure 1 presents a flowchart that describes the research framework of this study. Section 2 presents a concise summary of the dissemination of scholarly literature through journals and the prevailing patterns in publications. Section 3 details the development of ML models from MWD data. In Section 4, this study presents the pragmatic implementations of data analysis derived from MWD techniques in the domains of geology identification using density; gamma; magnetic susceptibility and resistivity responses; assessment of rock mass characteristics, including rock strength, fracture frequency and rock mass classification scores; and geochemical composition, such as iron percentage as well as primary and secondary contaminants. These applications are expounded upon in Section 4.1, Section 4.2 and Section 4.3, respectively. Section 5 presents an exposition on the challenges and potential associated with the application of ML techniques for rock characterization utilizing MWD data. The concluding remarks are presented in Section 6.

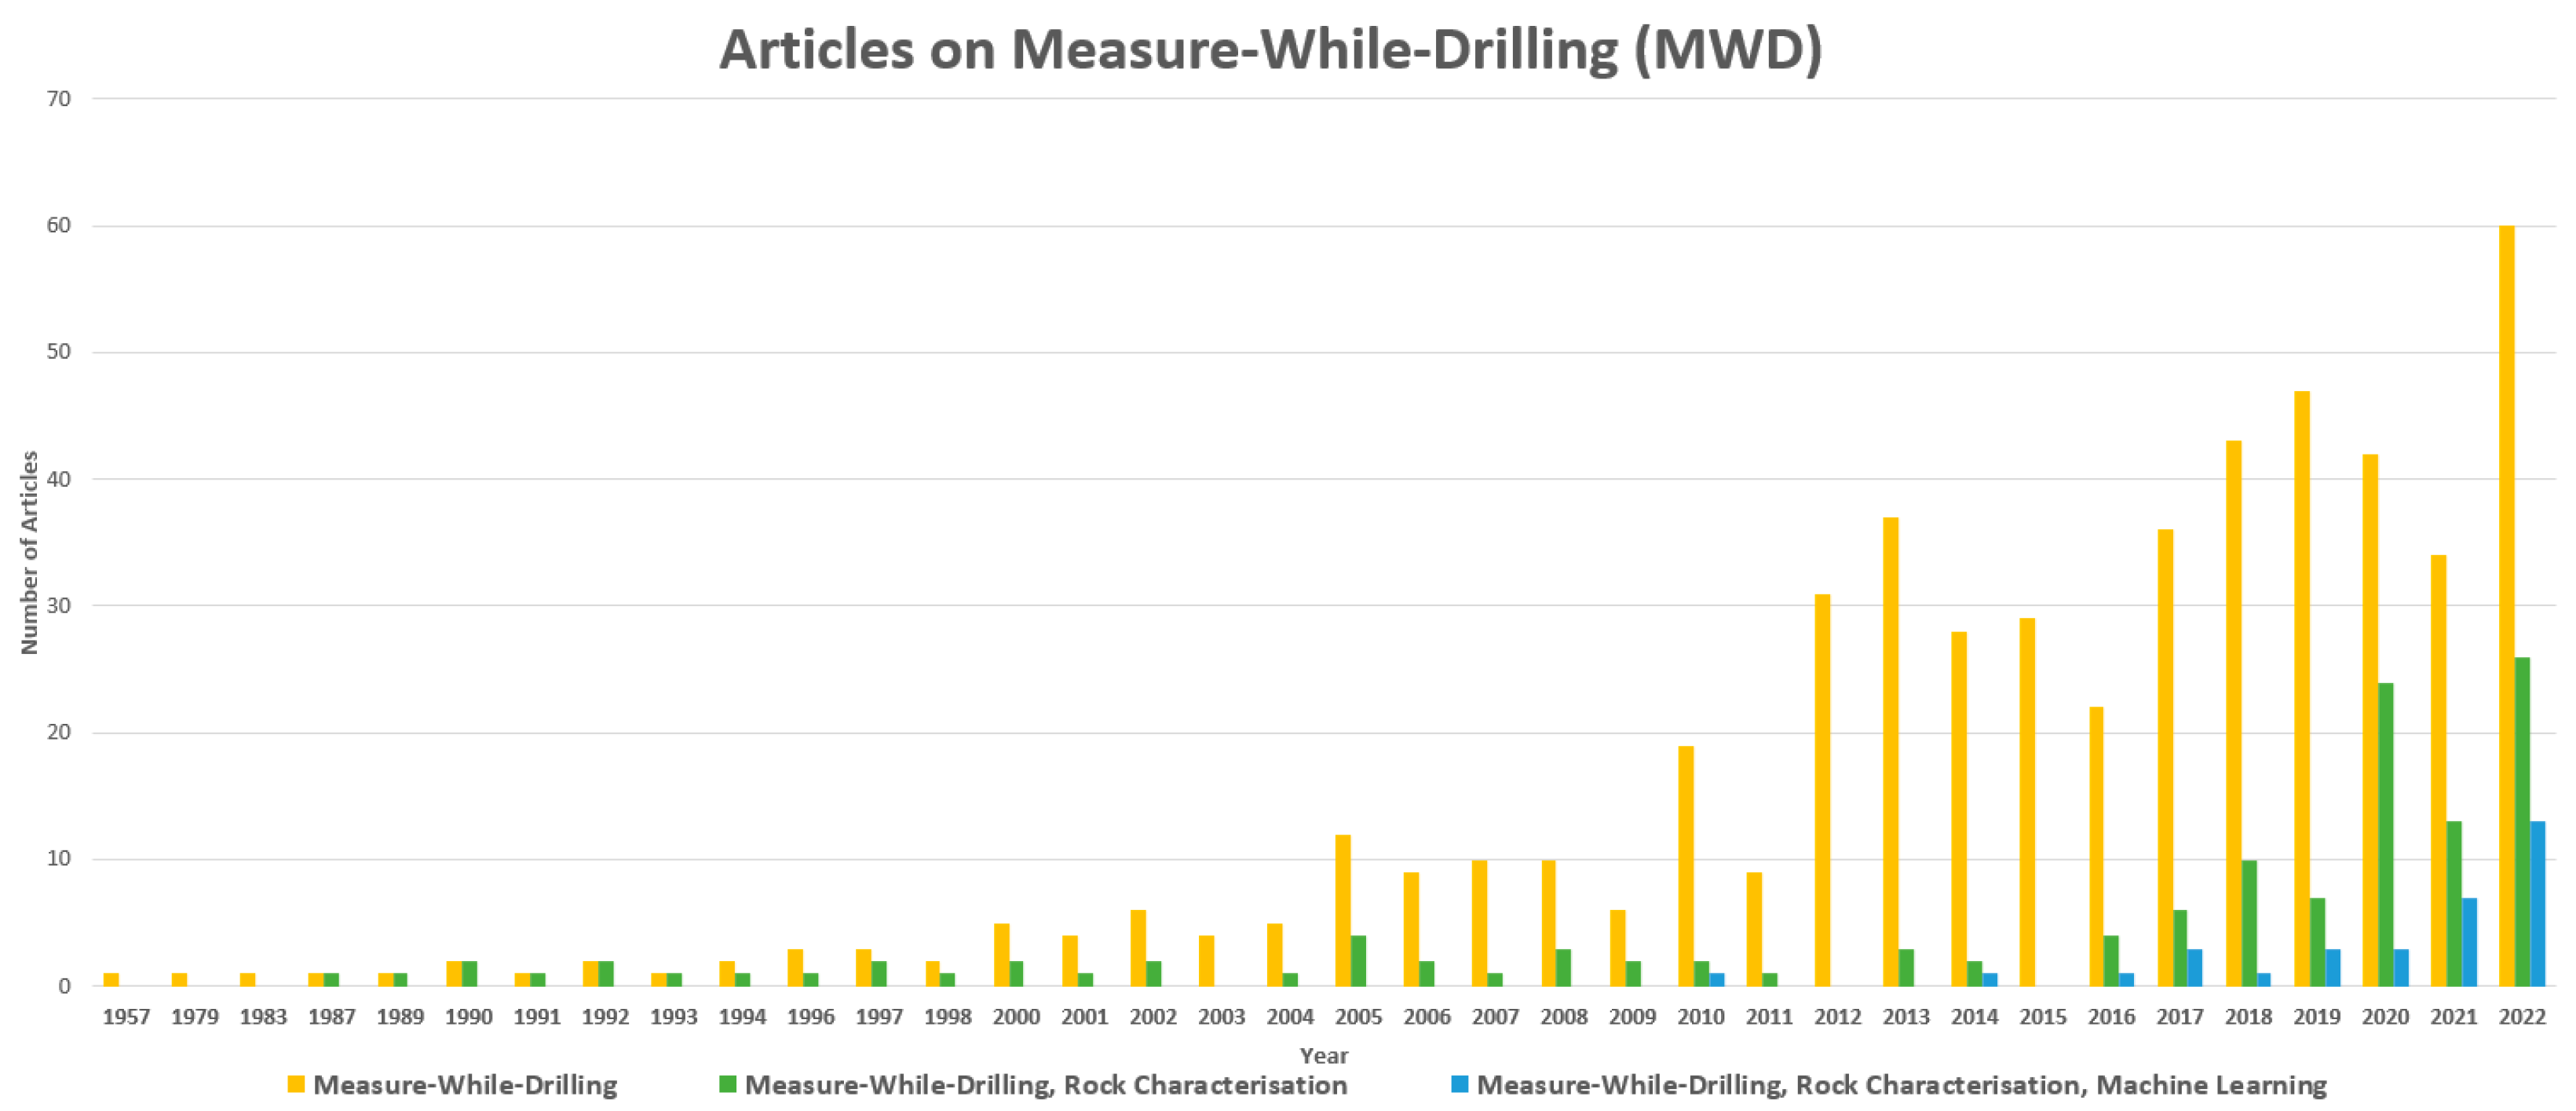
2. Literature Sources and Dissemination

As indicated by the literature review process, the publication of papers on this topic spans around thirty years. A total of 537 research articles mentioning “Measure-While-Drilling” or “Measurement-While-Drilling” have been indexed in Google Scholar (GS) from the late 1980s to the present, as shown in Figure 2’s yellow bars. Nonetheless, when the search results are filtered to studies employing MWD to strictly characterize the rock being drilled, there are just 129 publications. The 129 articles are organized according to the year of publication, as shown in Figure 2’s green bars. Indeed, the use of MWD data for rock characterization is limited in the first decade of the twenty-first century, whereas the number of papers has expanded dramatically in the last decade, with twenty-six publications expected in 2022. When the search parameters are restricted to using MWD to strictly characterize the rock being drilled using ML approaches, there are just 32 publications with a rapid employment of ML algorithms since 2016, shown in blue in Figure 2.
To address readers’ academic interests in characterizing rock types using ML techniques on MWD data in open-pit mining, more journal articles than conference papers have been published. While master’s and doctorate dissertations were not featured on GS, a few of them have been published [12,13,14,15,16,17]. The leading journals are Mathematical Geosciences and Minerals, which have published over 22% of the discoveries concentrating on the use of ML on MWD data for open-pit mining rock characterization. Each of the remaining journals has published one paper.
Several ML techniques were applied to characterize rock conditions using MWD data in the reports identified with the GS search parameters. There are generally two types of ML techniques used in those findings: neural networks (NNs) [12,16,18,19,20] and Gaussian process (GP) [8,11,21]. Other approaches, including support vector machines (SVMs), random forests (RFs), boosting, self-organizing maps (SOMs), and fuzzy logic, have been compared to NNs in various studies [19,20]. Generally, the selection of any particular ML model would depend on its predictive power, its interpretability, and, to some extent, also the complexity of the data to be processed. Relevant studies to ML analysis of open-pit mining MWD data is presented in Table 1.
For example, while linear models or simple decision trees may not have the same predictive power as multilayer perceptrons or support vector machines, it may be easier to interpret the results generated by these models. Likewise, deep learning models, such as convolutional neural networks or vision transformers may be better able to analyse more complex signals and images than traditional multilayer perceptrons or random forests and can also be coupled with explanatory models, where required. Further investigations of these trade-offs could yield significant advances in the field.

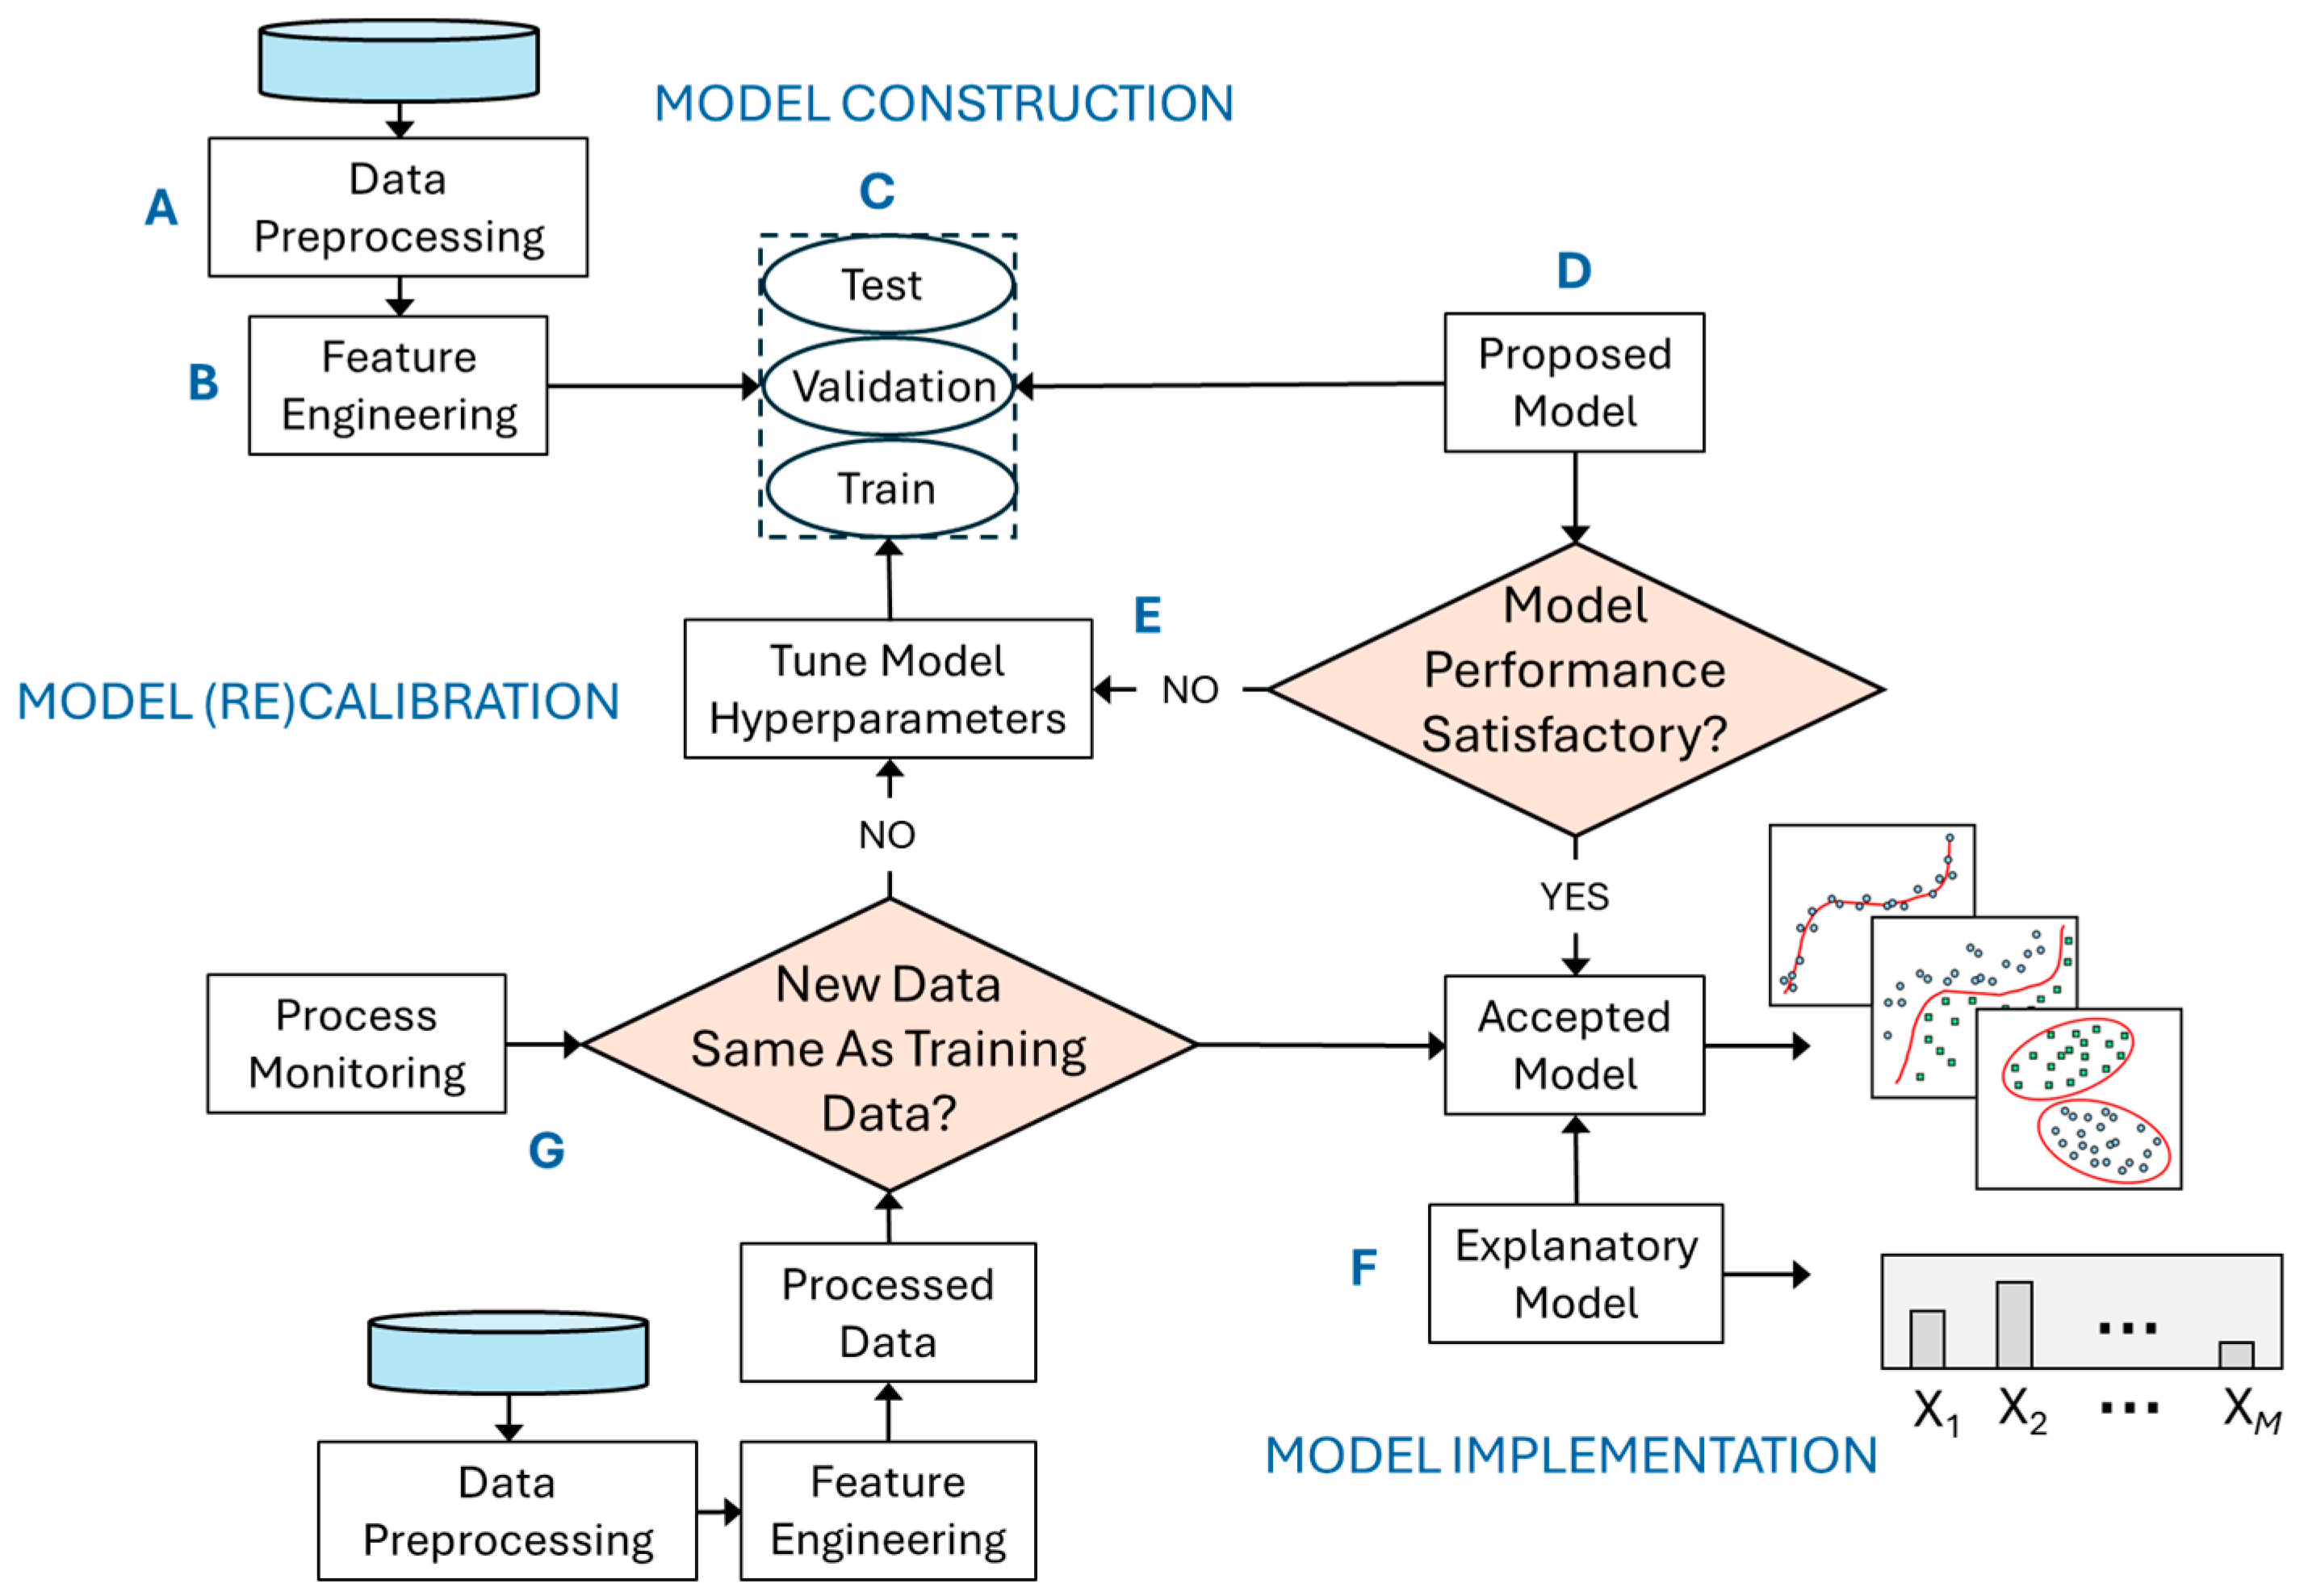
3. Development of Machine Learning Models from MWD Data

The development of machine learning models comprises multiple discrete stages, depicted in Figure 3. The process begins with data in its unrefined state, a phase commonly known as data preprocessing (Figure 3A). Here, the focus is on improving the consistency and integrity of the data. In the case of sequential data, such as time-series data, it is often necessary to adjust or eliminate identifiable patterns and trends. Furthermore, to provide a cohesive basis for the following stages, any discrepancies resulting from different intervals of data recording are reconciled.
Feature engineering is the segment that follows preprocessing. In this phase, data is transformed into a form that computer algorithms can easily understand (Figure 3B). When confronted with complex data types, such as images or sound signals, it is necessary to perform transformations to convert them into a structured format. Depending on the ML model, a crucial aspect of this stage could entail reducing redundancy by replacing groups of interconnected variables with a more succinct set that encompasses most of the initial information. After suitably structuring the data, it is segregated into distinct subsets known as training, validation, and test datasets (Figure 3C). The training data functions as the fundamental dataset upon which the model is initially constructed. The utilisation of a validation set facilitates the process of refining the model, whilst the test set is specifically put aside to act as a benchmark for assessing the model’s performance in real-world situations.
After data partitioning, the focus shifts to the training of the model itself (Figure 3D). There is a wide array of models available for this purpose, encompassing neural networks, decision trees, and support vector machines. The selection of a model is primarily contingent upon the characteristics of the data and the goals of the research. If the proposed model’s performance is not acceptable, then the model’s hyperparameters can be tuned (Figure 3E), then trained, validated, and tested (Figure 3C) before acceptable predictions can be made. In situations where it is necessary to explain the reasoning behind a model’s decisions, particularly in diagnostic contexts, an additional explanatory model can be developed (Figure 3F). Nevertheless, if the decisions made by the primary model possess intrinsic transparency, this step may be deemed unnecessary.
Ultimately, when novel datasets are introduced, they undergo identical preliminary phases of preprocessing and feature engineering as the initial training data (Figure 3G). An essential component of this phase involves determining the statistical similarity between the newly acquired data and the first training dataset, although this is not necessarily always done in practice. Several analytical techniques, such as principal component analysis and t-stochastic neighbour approaches, offer valuable insights into this congruence. If a noticeable discrepancy exists between the datasets, it may be necessary to recalibrate the model.

4. Practical Applications

4.1. Geology Recognition from MWD

This part pertains to the utilization of ML techniques on MWD data to understand the intricate relationships between drilling metrics and forecast subsurface geological conditions before commencing mining operations. For example, a banded iron formation (BIF) deposit might have classification zones of shale and BIF. These broad categorization of geological zones from MWD data are useful for identifying the contacts between highly contrasting material types to update a deposit-scale model and increase its accuracy within localized areas [8]. This increased accuracy leads to improved blasting outcomes, in terms of achieving fragmentation around geological boundaries. However, these nongranular assortments do not necessarily provide resolution within each lithological unit that are required to optimize mining operations downstream of the drill and blast process, including excavation, haulage, and beneficiation.
First, an overview of the various types of geological deposits in which MWD data have been used to identify geology in open-pit mining operations is presented. The next section critically reviews the types of analysis performed by researchers to understand which MWD metrics are important to describe changing subsurface conditions from a data science perspective, including lithology, density, rock strength, and weathering or fracture intensity. Several authors have used principal component analysis (PCA) to interpret feature importance [12,16,25]. However, it is worth noting that PCA is generally not an effective approach for rating the significance of input variables. The final section details the application of ML to categorize rock types from MWD data. The classification methods employed by previous studies can be improved upon gaining a granular comprehension of the changing subsurface geological conditions.

4.1.1. Mined Commodities
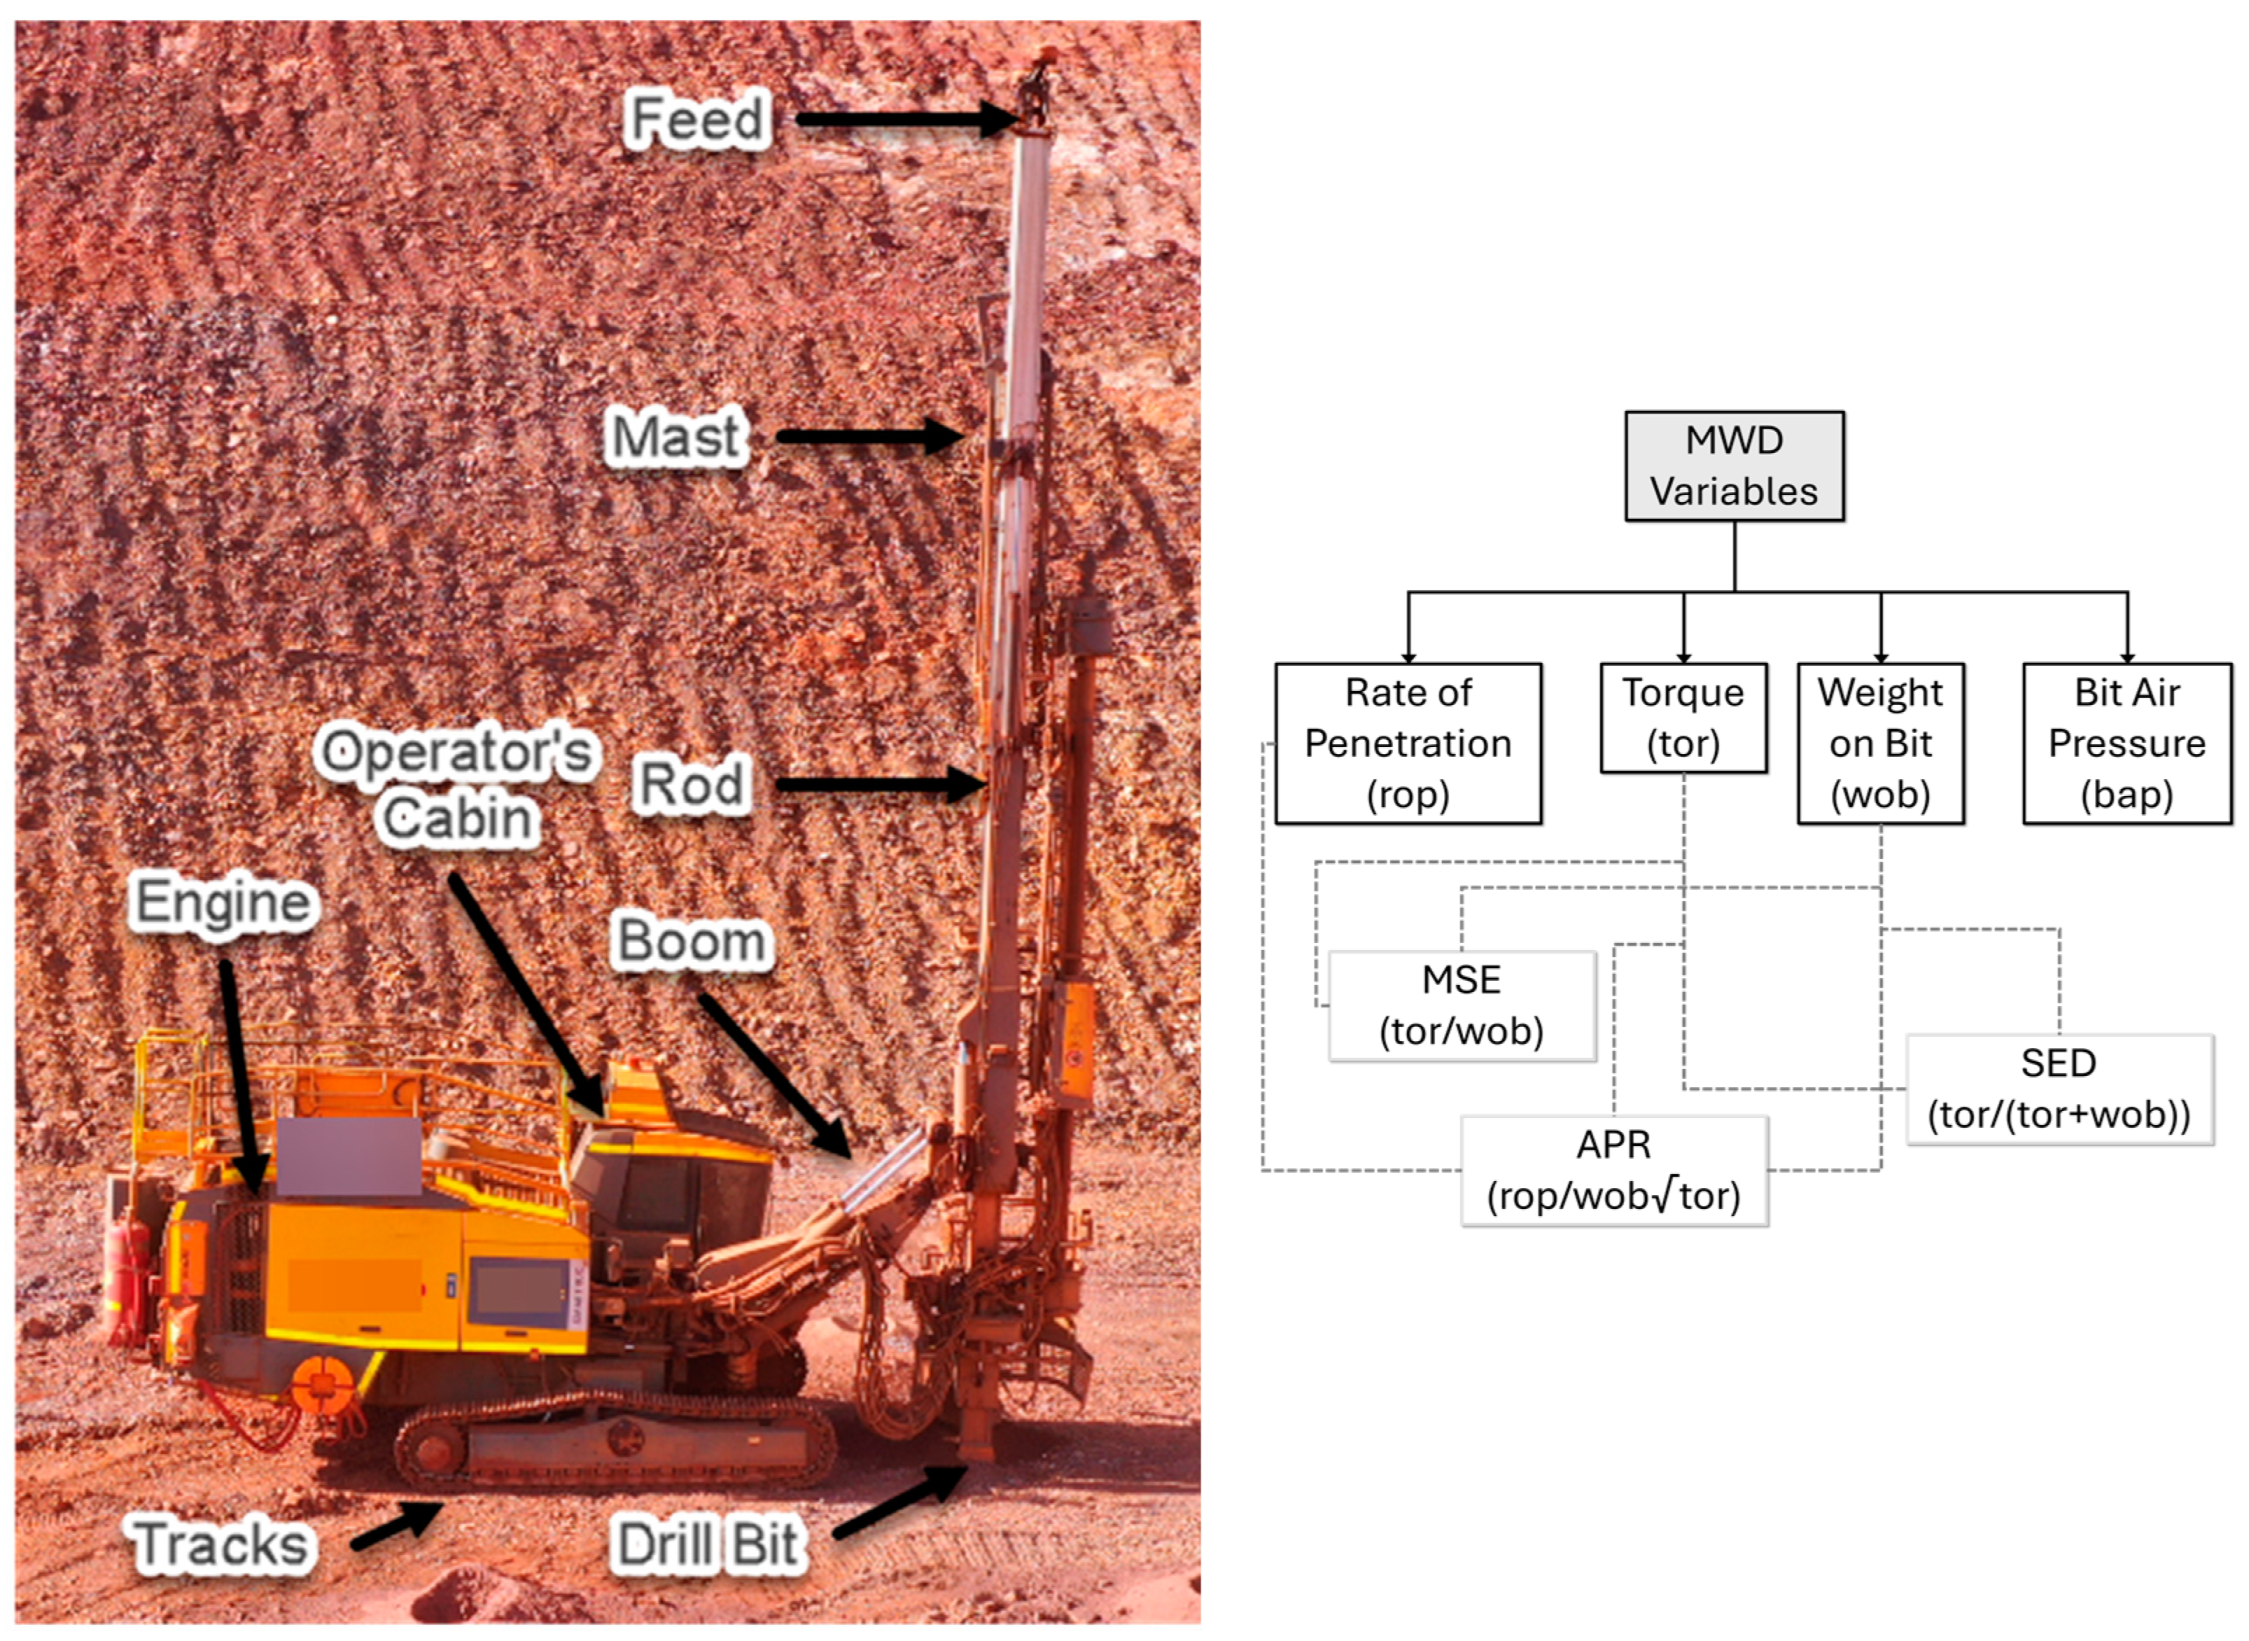
Most researchers delineating lithologies from MWD data in open-pit mining have focused on sedimentary commodities, predominantly iron ore and coal. In these deposits, the resource geology has been reasonably defined by exploration drilling at hole spacings of 50 m grids in iron ore and 100–200 m grids in coal. The use of MWD data attempts to add local accuracies in between the exploration drillholes through blast holes located at approximately 5 m burden and spacing. Most of the research to recognize subsurface geology from drilling metrics has taken place in Canada [7,12,16] and Australia [8,11,18,20,21,22,27]. These countries have had strong research collaboration between the mining industry and universities.
The initial findings to link six open-pit blast hole drilling responses with the subsurface geology via the use of downhole geophysical responses was the basis for later work [7]. Nearly 20 years later, postgraduate research applied NN for open-pit geological classification from MWD datasets in coal and iron ore mining blast holes [12,16]. Since these earlier Canadian-based studies, research on open-pit classification of geology has been entirely within Australian coal and iron ore deposits. The research in coal geology recognition aimed to accurately predict coal roof locations to prevent blast damage in open-pit mining with several reports presenting the results of various ML classification methods on the same MWD dataset from 35 blast holes in the Australian Hunter Valley coal region [18,22,27]. A few years later, coal seams in six gas wells were identified with 96% accuracy from the Surat Basin using five categorization algorithms [19]. In the iron ore industry, various classification methods were used on datasets of 28 holes and approximately 120 holes were utilized [20,21]. Both studies successfully distinguished BIF rock from shale in the Pilbara region to improve fragmentation by tailoring explosive loading for each rock unit. Nearly a decade later, multiple findings from the University of Sydney presented successful classification of BIF and shale units from a significantly larger dataset of several thousand blast holes [8,11].
While the majority of rock type recognition has occurred in open-pit mining in Canada and Australia, examples from civil engineering, tunnelling, oil and gas, and other mining industries have also been investigated. MWD data were used to distinguish geological zones in an urban construction project from Hong Kong. In the tunnelling industry, MWD data were also used to predict geology ahead of blasting in the Norwegian Loren, Swedish Stockholm Bypass, and the Chinese Jiuding Shan projects [30,31,32]. The use of MWD data within the oil and gas sector has demonstrated their efficacy in the classification of lithology within narrow targets [33,34,35,36]. This classification aids to attain precise directional drilling, hence optimizing the selection of well locations. In the underground coal mining industry, linear correlation and ML algorithms were applied to MWD data from roof support drills to determine geological zones and adjust locations and spacings of rock bolts and cable bolts to improve ground support [37,38,39,40]. In the open-pit quarry industry, successful use of MWD metrics to observe sill and marble boundaries was reported in four blast holes and altered explosive loading practices to achieve optimal fragmentation, which prevented unnecessary rock breaking off boulders from under-blasting [29]. More recently, six classes of marble qualities were predicted using Logistical Regression and RF [23]. All the above examples establish the wider applicability of determining geology from MWD data outside of open-pit mining of sedimentary deposits.

4.1.2. MWD Metrics

MWD metrics (rop, tor, fob, wob, rpm, etc.) have shown varying levels of feature importance when correlated with subsurface geological conditions [41]. Feature importance refers to methods that calculate a score for each of the MWD metrics in a particular model. The resulting scores represent the contribution of each feature in the prediction of the target variable.
A high score indicates that the characteristic will have a greater influence on the model used to forecast a particular subsurface geological variable. Initial manual attempts to interpret the feature importance of open-pit mining MWD variables with wireline gamma responses identified local minimum and maximum variations; the changes in rop, tor, wob, and SED parameters were associated with different lithological factors [7]. They also reported that rpm did not significantly correlate with any rock type, due to being controlled by the operator at a relatively constant rate. However, these univariate experiments each focused on an isolated, individual drilling parameter. Indeed, all other drilling metrics were required to be maintained near constant in these studies, which is unrealistic for common production blast hole drilling. An example of a surface blast hole drill rig is presented in Figure 4 (left), together with the typical MWD variables collected (Figure 4, right).
Early attempts to manually interpret the feature importance for each MWD input metric on rock type recognition models have given way to more advanced analytical methods, primarily principal component analysis (PCA). PCA aims to show patterns in multivariate data by reducing the dimensionality of these datasets and creating new variables, called principal components [42]. The principal components are a set of orthogonal vectors that are linear combinations of the input variables and best describe which of these inputs represent the most variation to the data. The rop and tor were identified as the MWD metrics that were most closely linked with subsurface geological conditions, while rpm was the least significant [12,16]. Both researchers identified feature importance by using the loading plots that detailed the most variation (the first and second principal components), although this may not necessarily account for most of the variation in the target variable. PCA has also been applied to determine coal vs. non-coal rock types by including gamma response and hole diameter as inputs along with the MWD metrics of rop, wob, and tor [19]. This work also applied a fit-for-purpose feature importance algorithm based on random forests and determined that the rate of penetration was the single most important MWD metric to classify coal vs. non-coal rock types in the investigated holes. The wob, tor, and rpm were presented as relatively insignificant compared to rop [19].
Several studies introduced derived drilling metrics calculated from the collected MWD variables to determine if derived features were more important than the raw drilling metrics. Modulated specific energy (MSE) takes advantage of the variations in the ratio of tor to wob to identify rock type in coal blast holes [18]. SEM is calculated by modifying the specific energy of drilling (SED) with a rotational work fraction, which is determined by dividing the tor by the sum of the tor and the wob. They reported SEM as an important feature from the drilling metrics to detect boundaries of multiple coal seams amongst predominantly sandstone units. A second novel drilling parameter called adjusted penetrate rate (APR) was developed to account for variations between drilling operators in manually operated rigs as well as between manual and autonomous drilling rigs in iron ore blast holes [21]. APR is calculated by dividing the rop by the product of the wob the square root of tor. Their finding reported APR was a more important feature than SED for the categorization of iron ore rock types of BIF waste, mineralized BIF and shale. rule-based labelling of geology from multiple drilling metrics outperformed the univariate APR method of rock type recognition [8]. However, not all variables are consistently collected in open-pit iron ore production drilling conditions due to sensor faults or breakdowns [8]. As a result, the missing data have resulted in up to 90% of blast hole observations not being able to be used for APR and SED.
Determination of feature importance reveals which variables are essential to collect for accurate prediction of rock type. Conversely, feature importance should identify which features may be discarded during selection of variables to include for subsequent analysis using ML algorithms. As mentioned previously, the use of PCA on MWD data for the selection of features with the highest variation as the most important predictors may not be effective. In contrast, developments in interpretable and explainable AI have opened significantly more advanced approaches for this purpose. This could include Shapley value regression, permutation analysis, interpretation of model structures, kernel SHAP, LIME, etc., and in the case of deep learning models, also even direct interpretation of image or signal data, where applicable [43,44,45].

4.1.3. Machine Learning Classification

Classification of geology using ML methods on open-pit blast hole MWD data has been demonstrated on mostly small datasets of a few dozen holes. Feature engineering has consistently been applied to clean noisy MWD data, including filtering, smoothing, normalizing, and removing outliers to prepare the raw data for ML analysis. Although a range of different ML models have been used, multilayer perceptrons and Gaussian process regression have featured prominently in recent studies, as discussed in Section 2.
NN algorithms have demonstrated the probability of geological recognition in both iron ore and coal deposits. The classification accuracy for five rock types reached 95% using back propagation neural network (BPNN) algorithms on 17 blast holes from a Canadian coal mine [16]. The classification accuracy for three rock types in an iron ore deposit averaged 57% based on 33 blast holes in the United States [12]. One study used NN as an assessment tool to determine if the SEM metric was superior to APR to identify lithologies, while another study demonstrated a prediction accuracy of 96% using NN to classify coal and non-coal rock types [18,19]. A multilayer perceptron NN algorithm classified four BIF rock types at 78% accuracy [20].
GPs have been exclusively used at the Pilbara BIF iron ore mines to classify geology. GP clustering of hardness values (approximated by regression modelling of APR) was used to categorize three types of iron ore units (waste BIF, mineralized ore, and shale) [21]. The figures presented are two-dimensional, indicating the researchers used an average MWD value for each hole to classify geology. This two-dimensional method provides a singular rock type, and thus, a limited perspective for mine planning. In a novel three-dimensional method, MWD datapoints were labelled with categorized units from downhole gamma responses [11]. The GP approximations resulted in a thresholding strategy that classified two BIF units in the Dales Gorge Member in three blast patterns at 87%, 84%, and 81% accuracy, respectively. GP-derived results were reported as only 62% accurate to classify two rock types (unmineralized shale and mineralized iron ore) [8]. They attributed this poor performance to noisy data requiring further data cleaning.
The use of NN and GP algorithms on MWD metrics has been largely successful in classifying rock types. Several findings reported other ML algorithms, including fuzzy inference systems (FISs), SVM, random forest (RF), and boosting to compare results with NNs, but none demonstrated significantly better performance to NNs [19,20]. Despite ML classification accuracy being greater than 90%, the prediction of a handful of broad geological categories does not adequately capture subtle differences within each geological unit. An increased resolution of rock type (including subcategories, such as massive, fractured, or deformed rock) is required for informed and effective mine planning.

4.2. Rock Mass Properties from MWD

Rock mass quality has been correlated with drilling response data [41]. As with determining geological zones, the geotechnical properties are categorized rather than predicted from discrete values using ML analytical techniques. The main rock mass properties under investigation are rock strength, discontinuities or fractures, and rock mass categorization scores, such as, rock mass rating (RMR), the geological strength index (GSI), Q-system, and rock quality designation (RQD) [46,47,48,49]. These geotechnical conditions are traditionally determined by logging and laboratory testing of diamond drill cores from holes that are spaced hundreds of meters apart without any regular pattern. Rock mass characterization data collection from exploration drilling is sparse due to the expense of drilling. This low-resolution data capture requires interpolation and broad geotechnical domaining to classify a rock mass with significant uncertainty between holes. Surface mine ML applications on MWD data were generally focused on geotechnical characterization to improve fragmentation, or rock breakage from blasting [1,6,25,50]. The focus of understanding rock mass properties from MWD data in underground mining- and tunnelling-based research is to reduce strata failure by adjusting the spacing and locations of ground support equipment [13,51,52,53,54,55,56,57,58,59].
First, an overview of the various environments and mined commodities in which MWD data have been used to identify rock mass properties is presented. Next, the types of feature importance analysis conducted by researchers to understand which MWD metrics are useful to describe changing geotechnical conditions, such as strength and fracture state, are critically reviewed from a data science perspective. Finally, the application of ML in characterizing rock mass zones from MWD data is surveyed. As with the geology-based findings in the previous section, these broad rock mass zone classifications are useful but do not accurately predict the complex fabric of a rock mass.

4.2.1. Commodities

As discussed in Section 2, there are considerably fewer studies on the ML classification of MWD data for rock mass characteristics in open-pit mining than for geological types. However, the use of ML algorithms on MWD data to characterize a rock mass has been demonstrated in other industries. These include tunnelling [51,53,54] and underground mining [52,57,58,59,60], which employ drilling prior to excavation. Exploration and laboratory-based activities [61,62,63] have also correlated rock mass properties with drilling metrics
In a series of classic studies, Schunnesson’ (1990, 1996, 1997, 1998) drill monitoring was used in underground Scandinavian iron ore and copper mines to distinguish changing conditions in each investigated rock mass [57,58,59,60]. More than two decades later, potential blasting issues in the underground Swedish Malmberget iron ore mine were predicted by assessing trends in MWD data [52]. In the tunnelling space, rock mass classification zones, including RMR and rock mass quality, were predicted from intelligent MWD data analysis to improve ground support patterns [51,53,54].
Exploration drilling, and laboratory experiments also support the use of ML methods to predict geotechnical properties from drilling metrics. Rock strength could be predicted from an exploration drill rig’s MWD data in the seven holes of diamond core in Turkey [61]. In laboratory experiments involving drilling through prepared samples, it was demonstrated that rock properties, including density, porosity, P-wave velocity, Schmidt hardness, UCS, tensile strength, and elasticity modulus, could be successfully predicted from acoustics produced during the drilling of laboratory samples [62]. On the other hand, in the tunnelling space, simulated fractures were detected in the rock mass from MWD data trends during the excavation of a 20 m wide tunnel [53]. More recently, several Chinese tunnel excavations have used regression- and classification-based methods to determine rock properties from MWD data. NNs were used to predict rock strength values, including UCS, elasticity modulus, and Poisson’s ratio, from MWD data [64]. In terms of a classification approach, a bi-directional long short-term memory NN was used to predict trimodal rock mass classes [65].
However, few studies have attempted to characterize rock mass conditions from MWD data in the open-pit mining environment utilizing thresholding or simple correlation. It was observed that high and low rop correlated with weak and strong rock strength zones in 1267 blast holes from the Aitik copper mine in Sweden [66]. To determine fracture locations from MWD data, downhole geophysical televiewer logs were interpreted to correlate fracture locations in eight blast holes from the Canadian Highland Valley copper mine [50]. Also using televiewer logs to calibrate their findings, two novel rock description indexes were developed based exclusively on MWD data from 302 production blast holes at the Erzberg mine [25]. These systems categorized rock mass zones for structural condition and strength properties and were corroborated by highwall mapping via photogrammetrically generated models. However, no studies were identified that used ML analytical methods on MWD data to characterize subsurface geotechnical properties in open-pit operations.

4.2.2. Feature Importance

As with the determination of geological zones from MWD data, research has attempted to identify the feature importance that each MWD metric has in predicting subsurface geotechnical conditions. Determination of feature importance using advanced analytical methods has almost entirely taken place within underground mining and tunnelling operations [51,52,57]. Multiple studies have utilized manual correlation in open-pit mining to identify feature importance for drillability or blastability. These are outside the scope of this review due to their focus on other aspects that are not directly related to subsurface geotechnical conditions [1,6,14,55,66,67,68] (Ghosh et al., 2014; Khorzoughi, 2011; Liu and Yin, 2001; Manzoor et al., 2019; Navarro et al., 2018; Scoble and Peck 1987; Segui and Higgins, 2001). PCA has only been used on open-pit mining MWD data to determine feature importance for a novel MWD-based rock mass classification system (drilling rock factor—DRF) [25].
PCA has been used to determine the feature importance of MWD metrics for geotechnical properties in underground mining and tunnelling projects. Specifically, the features ranking highly on the first principal component have generally been interpreted to be the most important. As discussed, the variables with the most variation are not necessarily the most important (Section 4.1). Schunnesson determined that the rop was most important from PCA loading plots showing rop as low in higher rock strength zones and, conversely, the rop was observed to be higher in weaker rock strength zones [57]. A later study focusing on the link between rock mass conditions and chargeability issues in underground blast holes employed PCA to identify ropS, torS, rop, and tor highly in terms of the first principal component, accounting for 62% of data variability [52]. Using a combination of PCA and ordered weighted average (OWA), Galende-Hernández et al. determined the top three features to select for predictive analysis were wob, damper pressure, and tor [51]. The inconsistent feature importance results between these two findings may be attributed to discrepancies with data collection, data cleaning equipment, or geological settings. It is also likely that the results do not support one another because PCA is not a statistically appropriate method for feature selection.
PCA has also been used on an open-pit mining MWD dataset from 286 blast holes at the Erzberg Mine in central Europe to interpret the feature importance of drilling metrics for input to their DRF [25]. The DRF rock mass classification system is composed of a structural factor and strength-grade factors. The structural factor consists of huge, fractured, and extensively fractured zones, while the strength-grade factor has soft-waste, hard-waste, transition zone, and hard-ore categories. Navarro et al. reported that the metrics rop, ropS, and torS ranked highly on PC1, the first principal component, for the structural factor evaluation, while tor dominated the positive side of PC2, the second principal component [25]. The first two main components of the structural factor explain a combined 66.02% of the entire variation, with PC1 contributing 47.47% and PC2 contributing 18.55%. In contrast, for the strength-grade factor, rop and wob dominated the positive sides of PC1 and PC2, respectively. The results of the study demonstrate that the strength-grade PC1 outcomes can differentiate between two distinct regions characterized by varying rock strength. Specifically, the schisted sandstone exhibits a uniaxial compressive strength (UCS) value of 30 MPa, while the limestone displays a UCS value of 125 MPa [25]. These results correlate well with digital photogrammetry reconstructions of the pit walls after blasting and excavation [25]. However, the DRF results are heavily dependent on calibration with manually interpreted televiewer logs. In addition, since the rock factor zones are also based on the local iron ore geology of the Erzberg Mine, adapting DRF to different mineral deposits would require intensive re-calibration. A deposit-agnostic approach without manual calibration would be more readily adopted to determine geotechnical properties from open-pit mining MWD data.

4.2.3. Machine Learning Classification

Classification of rock mass properties using ML methods on open-pit blast hole MWD data has not been demonstrated, despite an exhaustive search. It was discovered that while many reports claim to characterize rock mass conditions using ML on MWD data, what was reported was often rock type, with an assumption of strong vs. weak UCS values for contrasting rock types. The results of these are discussed in Section 4. No studies were found that attempted to predict geotechnical properties using ML methods in the open-pit mining, underground mining, or construction industries.

4.3. Geochemical Properties from MWD

Very few studies attempt to predict geochemical properties from MWD data [24,25,57]. Commonly reported geochemical properties of ore included aluminium oxide (Al2O3), calcium oxide (CaO), iron (Fe), total loss of ignition (LOI), magnesium oxide (MgO), manganese (Mn), phosphorus (P), sulfur (S), silica oxide (SiO2), and titanium oxide (TiO2). All findings reporting geochemical properties from mining MWD data were located within an iron ore deposit and listed grade or iron ore percentage.
Fe was reported as the only ore quality investigated [25,57]. Partial least squares (PLS) analysis was applied on MWD data from an underground mine and closely predicted iron content against assays of drill cuttings in areas of high and low phosphorus geology [57]. The ore grade prediction of Navarro et al. was split into two simple categories of (1) waste consisting of less than 20% iron and (2) ore consisting of greater than 20% iron [25]. These waste and ore class results appear equivalent to the DRF results. However, there is no explicit mention of the ore grade prediction accuracy, which suggests it is probable that no validation of results was conducted against laboratory assays.
Only one study reported the use of ML classification for geochemical properties from MWD and drill cutting assay data from two Australian iron ore mines [24]. Unlike previous studies that only reported the investigated ore properties were Al2O3, CaO, Fe, LOI, MgO, Mn, P, S, SiO2, and TiO2. Fe was predicted with acceptable R2 values of 0.79, 0.79, and 0.78 in the first mine and 0.64, 0.64, and 0.63 in the second mine for the GP, SVM, and RF algorithms, respectively. The datasets were combined to predict P and S. Acceptable R2 values for P were 0.79, 0.78, and 0.81, and S were 0.91, 0.90, and 0.92 for the GP, SVM, and RF algorithms, respectively. The report also identified that several of the geochemical properties correlated with each other. Based on this, cross-assay predictive models showed improved results for the remaining ore properties. For example, the R2 value for Al2O3 of 0.65 on MWD data alone in an RF model was improved to 0.90 and 0.85 when adding the cross-assay results for Fe and SiO2, respectively. The primary benefit of this result is that if one assay can be directly measured with a sensor or strongly predicted from a model, these measurements can be utilized to enhance estimates for other geochemical properties.

5. Discussion

5.1. Current Challenges

This summary makes it clear that the motivation behind these findings is to circumvent the limitations of conventional subsurface characterization prior to excavation. NNs and GPs are the two primary categories of ML algorithms utilized with MWD data for rock categorization. While some artificial intelligence algorithms have been applied to the same datasets, different ML architectures produced different outcomes [18,22,27]. Thus, no model has been proposed as optimal for characterizing geological, geotechnical, and geochemical features from MWD data, as model selection depends on underlying aims, scientific objectives, and model restrictions. Notably, some ML approaches are more attractive (NN and RF) than others (GP) due to their computational efficiency [19]. In addition to there being no accepted, optimal ML modelling algorithm to characterize subsurface conditions from MWD data, there is no uniformly consistent approach to MWD data collection and processing.
There are still some challenges in data collection and processing that must be overcome. First, most of the investigated projects featured limited amounts of data from blast holes, making it difficult to extensively analyse and interpret the subsurface. Second, the quality of the output is dependent not just on the model but also on the condition of the gathered data. Quality assurance and quality control processes are not commonplace with open-pit MWD data acquisition. During the development of predictive models, the robustness of the model may be affected due to the existence of missing values or outliers within the dataset. In addition, the feature importance among MWD variables may also affect the modelling robustness. Existing studies [16,25,52] disagree as to which metrics should be utilized to characterize rock properties under different environmental situations, as they vary based on deposit-specific conditions. To identify the feature importance of drilling variables, PCA has been used to choose input variables from the MWD data. A statistically suitable strategy for determining feature relevance should enhance feature selection to improve computational precision and speed. In conclusion, the subsurface characterization applications of ML techniques applied to MWD data are in an escalating stage of development.
In summary, the relative frequencies of machine learning methods used in the analysis of MWD data reported are shown in Figure 5. The analysis is based on a keyword search of the Scopus database. Interestingly, convolutional neural networks (tied with SVM at 16%) are comparatively high up the list, despite being a relative new approach focused on image analysis.

5.2. Future Developments

Even though non-traditional approaches to comprehend mining subsurface conditions require further development, they are gaining popularity. ML methods can be utilized as a supplement to conventional theory [8,25]. They have the potential to extract insights about a vast array of spatial data, which can then be narrowed down to investigate areas of interest in greater detail. However, despite the widespread use of ML classification algorithms for categorizing geology in MWD data, ML analytical methods have seldom been applied. A common assumption has been that it is far more crucial to understand the boundaries between dissimilar rock types than the variation within each rock type [11,18,25]. As a result, the categorization of ‘strong’ and ‘weak’ rock types, such as BIF and shale, respectively, has dominated projects by investigating univariate relationships, mainly rop and tor [69]. In contrast, existing multivariate ML regression algorithms have significant prospects for solving the complicated challenge of variance within each rock type.
To interpret subsurface properties using MWD data, supervised [8,18,22,25] and unsupervised learning [12,16] techniques have been implemented. Supervised learning can use all available information to make predictions and classifications, while unsupervised learning may identify potential relationships and extract features from a substantial volume of unlabelled data. In the context of both supervised and unsupervised learning applications, it is essential to employ suitable data preprocessing approaches. These techniques encompass the removal of noise, outliers, and false attributes. This necessity arises from the considerable geographic variability observed in measurements while considering the data related to MWD and subsurface conditions [70].
Existing techniques of MWD data processing and analysis rely heavily on manual interpretation, such as determining the most critical rock-property-dependent metrics [31]. Consequently, it is difficult to repeatedly process data from new sources and places. A pertinent aim of applied research is therefore to design an automated workflow in which ML methods and available input data, connected with specific conditions, can correlate, process, and select drilling variables for subsequent estimation of rock properties. In the interim, the gathering of a training dataset during algorithm execution could facilitate data collecting for future applications operating under comparable conditions.
The implementation of ML techniques is dependent on the training data set accurately representing the connection between the input datasets, MWD, and subsurface properties, respectively. It is crucial to select attributes for the training set that accurately represent the population. As a result, ML training progress is impeded by the challenges of overfitting, extended training time, and a notable inclination to become trapped in local minima [12]. As demonstrated in the tunnelling sector, these obstacles may be overcome with optimization algorithms, including genetic algorithms, particle swarm optimization and imperialist competition algorithms [54]. Due to their ability to rapidly analyse massive and complex MWD datasets, ML methods provide an effective solution to provide accurate and relevant predictions of subsurface properties in open cut mining operations.
Interpretation of MWD features can benefit considerably from recent advances in explainable artificial intelligence, as discussed among other by Saranya and Subshini [71] and Lundberg and Lee [72]. Moreover, although having emerged only recently, deep learning models have significant potential in the analysis and interpretation of measure-while-drilling (MWD) data in hard-rock mining [73,74]. These models are particularly well suited to deal with complex data, such as associated with panoramic borehole imaging, for example [73,75,76], or vibrational data [77]. In addition, they could also better support the processing of MWD metrics when considered as time series data [78].

6. Conclusions

The mining industry is increasingly using methods of artificial intelligence to overcome the uncertainty associated with data on geological objects. ML algorithms have been applied on mining MWD datasets to understand pre-excavation subsurface conditions. Numerous studies have been conducted on the collection, processing, analysis, and application of MWD variables for the characterization of rock type, rock mass, and ore properties.
From this review of the literature, the following conclusions can be made:
  • The most commonly measured MWD variables measured together with the depth of drilling in open-pit mines are rate of penetration (rop), torque or rotational pressure (tor), bit air pressure (bap), weight on bit (wob), and rotary speed or revolutions per minute (rpm).
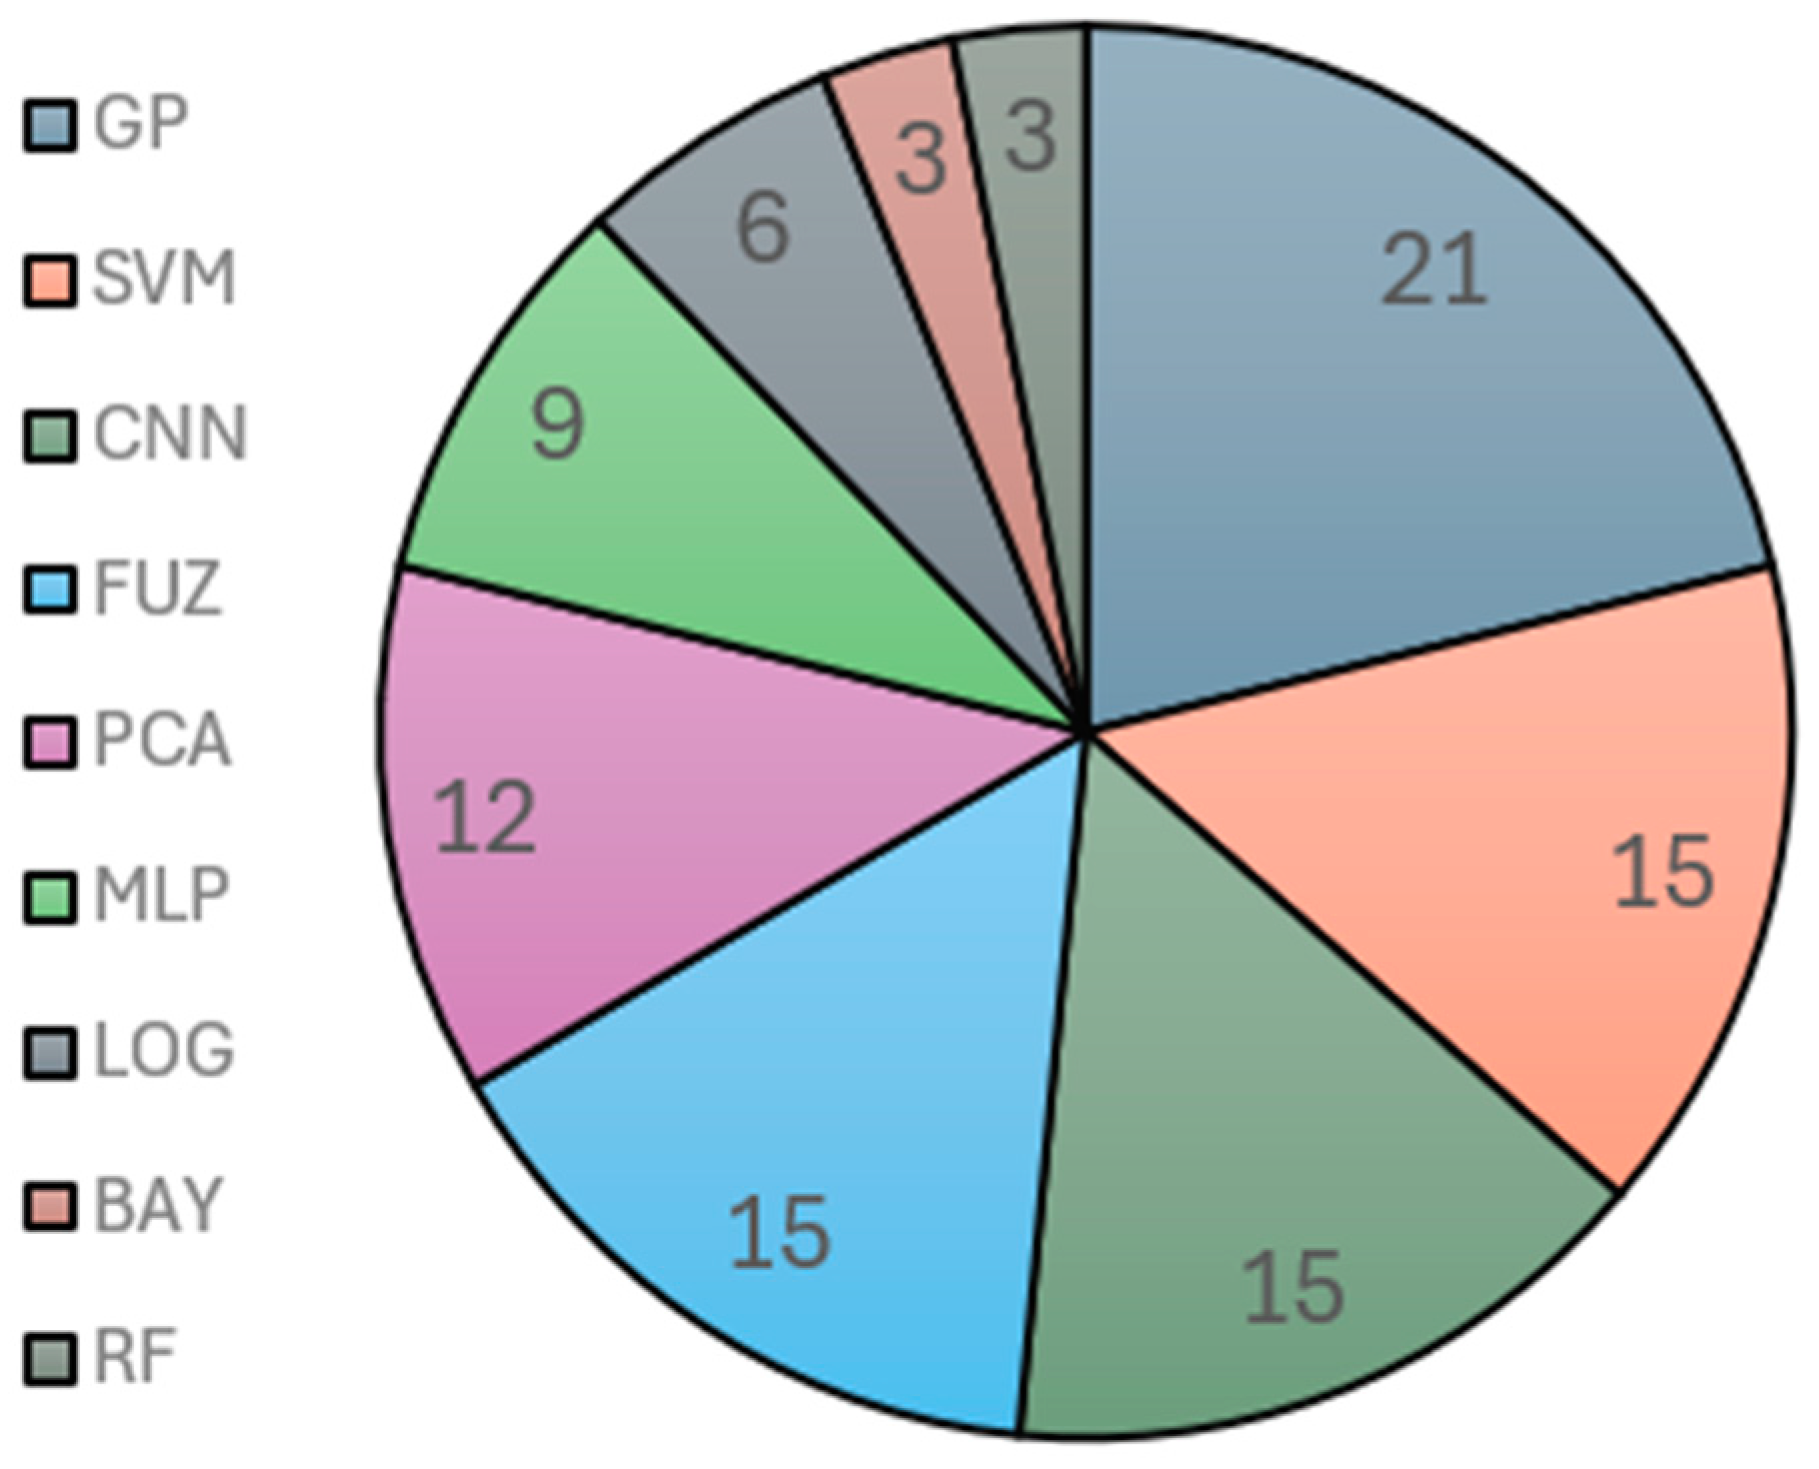
  • Several studies have analysed the relative importance of each of these variables related to the identification of rock types and characteristics with mixed results. This is an emerging area that can benefit from recent significant advances in machine learning, where models are interpreted or explained. This would particularly be the case where other MWD variables, such as image, vibrational or acoustic signals are included in models.
  • In most studies, ML models could successfully categorize geological zones or rock types from MWD data, but further work is required to capture more subtle differences within geological units.
  • Classification of discrete rock mass properties, including rock strength and fracture count, using ML methods on open-pit blast hole MWD data does not appear to have been demonstrated yet. Instead, rock type is typically identified as a proxy for rock strength based on assumptions associated with each type.
  • Only one study considered the prediction of geochemical properties using ML classification on MWD and drill cutting assay datasets. ML analytical methods applied to MWD data resulting in discrete values for geotechnical, geological, and geochemical will enable a low-cost, high-resolution comprehension of subsurface conditions beyond simple rock type classification.
  • Overall, these studies have not yet taken full advantage of recent developments in deep learning and, as more data are collected, these ML approaches are likely to play a more important role in MWD data analysis for enhanced comprehension of geology, rock mass characteristics, and ore attributes for enhanced sustainability, efficiency, and safety of mining operations.

Author Contributions

Conceptualization, D.M.G.; methodology, D.M.G.; software, D.M.G.; validation, D.M.G.; formal analysis, D.M.G.; investigation, D.M.G.; resources, D.M.G.; data curation, D.M.G.; writing—original draft preparation, D.M.G.; writing—review and editing, D.M.G., C.A. and L.O.; visualization, D.M.G. and C.A.; supervision, C.A. and L.O.; project administration, D.M.G.; funding acquisition, D.M.G. All authors have read and agreed to the published version of the manuscript.

Funding

This research was funded by the MRIWA Postgraduate Research Scholarship and the Australasian Institute of Mining and Metallurgy Education Endowment Fund Postgraduate Scholarship.

Acknowledgments

The research was supported by the advanced computing resources provided by the Pawsey Supercomputing Research Centre in Perth, Australia.

Conflicts of Interest

The authors declare no conflicts of interest.

References

  1. Segui, J.B.; Higgins, M. Blast Design Using Measurement While Drilling Parameters; Australasian Institute of Mining and Metallurgy: Melbourne, Australia, 2001; pp. 28–31. [Google Scholar]
  2. Barr, M.V. Instrumented Horizontal Drilling for Tunnelling Site Investigation. Ph.D. Thesis, University of London: Imperial College of Science and Technology, London, UK, 1984. [Google Scholar]
  3. Barr, M.V.; Brown, E.T. A Site Exploration Trial Using Instrumented Horizontal Drilling. In Proceedings of the 5th ISRM Congress, Melbourne, Australia, 10–15 April 1983; International Soceity of Rock Mechanics: Lisbon, Portugal, 1983; pp. 51–58. [Google Scholar]
  4. Brown, E.T.; Barr, M.V. Instrumented Drilling as an Aid to Site Investigations. In Proceedings of the 3rd International Congress of the International Association of Engineering Geology, Madrid, Spain, 4–8 September 1978; pp. 21–28. [Google Scholar]
  5. Leighton, J.C. Development of a Correlation between Rotary Drill Performance and Controlled Blasting Powder Factors. Master’s Thesis, University of British Columbia, Vancouver, BC, Canada, 1982. [Google Scholar]
  6. Scoble, M.J.; Peck, J. A Technique for Ground Characterization Using Automated Production Drill Monitoring. Int. J. Surf. Min. Reclam. Environ. 1987, 1, 41–54. [Google Scholar] [CrossRef]
  7. Scoble, M.J.; Peck, J.; Hendricks, C. Correlation between Rotary Drill Performance Parameters and Borehole Geophysical Logging. Min. Sci. Technol. 1989, 8, 301–312. [Google Scholar] [CrossRef]
  8. Silversides, K.L.; Melkumyan, A. Boundary Identification and Surface Updates Using MWD. Math. Geosci. 2020, 53, 1047–1071. [Google Scholar] [CrossRef]
  9. Basarir, H.; Wesseloo, J.; Karrech, A.; Pasternak, E.; Dyskin, A. The Use of Soft Computing Methods for the Prediction of Rock Properties Based on Measurement While Drilling Data. In Deep Mining 2017: Proceedings of the Eighth International Conference on Deep and High Stress Mining; Australian Centre for Geomechanics: Perth, Australia, 2017; pp. 537–551. [Google Scholar] [CrossRef]
  10. Lucifora, D.J.; Rafezi, H. State of the Art Review: Monitoring-While-Drilling for Mining Applications. In Proceedings of the World Mining Congress (WMC), Montreal, QC, Canada, 11–15 August 2013; Volume 4. [Google Scholar]
  11. Silversides, K.L.; Ball, A.; Melkumyan, A. BIF-Hosted Deposit Unit Differentiation Using Multivariate Gaussian Processes on Measure While Drilling Data. Appl. Earth Sci. 2020, 129, 164–175. [Google Scholar] [CrossRef]
  12. Beattie, N. Monitoring-While-Drilling for Open-Pit Mining in a Hard Rock Environment. Master’s Thesis, Queen’s University, Kingston, ON, Canada, 2009. [Google Scholar]
  13. Ghosh, R. Assessment of Rock Mass Quality and Its Effects on Chargeability Using Drill Monitoring Technique. Ph.D. Thesis, Lulea University of Technology, Luleå, Sweden, 2017. [Google Scholar]
  14. Khorzoughi, M.B. Use of Measurement While Drilling Techniques for Improved Rock Mass Characterization in Open-Pit Mines. Master’s Thesis, University of British Columbia, Vancouver, BC, Canada, 2011. [Google Scholar]
  15. Liu, J. Study on Intelligent Prediction Models of Geological Conditions ahead of Tunnel Face Using Measurement-While-Drilling Data. Ph.D. Thesis, Nagasaki University, Nagasaki, Japan, 2021. [Google Scholar]
  16. Martin, J. Application of Pattern Recognition Techniques to Monitoring-While-Drilling on a Rotary Electric Blasthole Drill at an Open-Pit Coal Mine. Master’s Thesis, Queen’s University, Kingston, ON, Canada, 2007. [Google Scholar]
  17. Navarro Miguel, J. The Use of Measure While Drilling for Rock Mass Characterization and Damage Assessment in Blasting. Ph.D. Thesis, Universidad Politechnica de Madrid, Madrid, Spain, 2018. [Google Scholar]
  18. Leung, R.; Scheding, S. Automated Coal Seam Detection Using a Modulated Specific Energy Measure in a Monitor-While-Drilling Context. Int. J. Rock Mech. Min. Sci. 2015, 75, 196–209. [Google Scholar] [CrossRef]
  19. Zhong, R.; Johnson, R.L.; Chen, Z. Using Machine Learning Methods to Identify Coals from Drilling and Logging-While-Drilling LWD Data. In Asia Pacific Unconventional Resources Technology Conference, Brisbane, Australia, 18–19 November 2019; Society of Petroleum Engineers: Richardson, TX, USA, 2019. [Google Scholar] [CrossRef]
  20. Kadkhodaie-Ilkhchi, A.; Monteiro, S.T.; Ramos, F.; Hatherly, P. Rock Recognition from MWD Data: A Comparative Study of Boosting, Neural Networks, and Fuzzy Logic. IEEE Geosci. Remote Sens. Lett. 2010, 7, 680–684. [Google Scholar] [CrossRef]
  21. Zhou, H.; Hatherly, P.; Monteiro, S.T.; Ramos, F.; Oppolzer, F.; Nettleton, E.; Scheding, S. Automatic Rock Recognition from Drilling Performance Data. In Proceedings of the 2012 IEEE International Conference on Robotics and Automation, Saint Paul, MN, USA, 14–18 May 2012; pp. 3407–3412. [Google Scholar] [CrossRef]
  22. Hatherly, P.; Leung, R.; Scheding, S.; Robinson, D. Drill Monitoring Results Reveal Geological Conditions in Blasthole Drilling. Int. J. Rock Mech. Min. Sci. 2015, 78, 144–154. [Google Scholar] [CrossRef]
  23. Akyildiz, O.; Basarir, H.; Vezhapparambu, V.S.; Ellefmo, S. MWD Data-Based Marble Quality Class Prediction Models Using ML Algorithms. Math. Geosci. 2023, 55, 1059–1074. [Google Scholar] [CrossRef]
  24. Khushaba, R.N.; Melkumyan, A.; Hill, A.J. A Machine Learning Approach for Material Type Logging and Chemical Assaying from Autonomous Measure-While-Drilling (MWD) Data. Math. Geosci. 2021, 54, 285–315. [Google Scholar] [CrossRef]
  25. Navarro, J.; Seidl, T.; Hartlieb, P.; Sanchidrián, J.A.; Segarra, P.; Couceiro, P.; Schimek, P.; Godoy, C. Blastability and Ore Grade Assessment from Drill Monitoring for Open Pit Applications. Rock Mech. Rock Eng. 2021, 54, 3209–3228. [Google Scholar] [CrossRef]
  26. Vezhapparambu, V.S.; Eidsvik, J.; Ellefmo, S.L. Rock Classification Using Multivariate Analysis of Measurement While Drilling Data: Towards a Better Sampling Strategy. Minerals 2018, 8, 384. [Google Scholar] [CrossRef]
  27. Ahsan, N.; Scheding, S.; Monteiro, S.T.; Leung, R.; McHugh, C.; Robinson, D. Adaptive Sampling Applied to Blast-Hole Drilling in Surface Mining. Int. J. Rock Mech. Min. Sci. 2015, 75, 244–255. [Google Scholar] [CrossRef]
  28. Liaghat, S.; Gustafson, A.; Johansson, D.; Schunnesson, H. Ore Grade Prediction Using Informative Features of MWD Data. In Mining Goes Digital, Proceedings of the 39th International Symposium on Application of Computers and Operations Research in the Mineral Industry, APCOM 2019, Wroclaw, Poland, 4–6 June 2019; CRC Press: London, UK, 2019; pp. 226–234. [Google Scholar] [CrossRef]
  29. Vezhapparambu, V.S.; Ellefmo, S.L. Estimating the Blast Sill Thickness Using Changepoint Analysis of MWD Data. Int. J. Rock Mech. Min. Sci. 2020, 134, 104443. [Google Scholar] [CrossRef]
  30. Fang, Y.; Wu, Z.; Sheng, Q.; Tang, H.; Liang, D. Tunnel Geology Prediction Using a Neural Network Based on Instrumented Drilling Test. Appl. Sci. 2020, 11, 217. [Google Scholar] [CrossRef]
  31. van Eldert, J.; Schunnesson, H.; Saiang, D.; Funehag, J. Improved Filtering and Normalizing of Measurement-While-Drilling (MWD) Data in Tunnel Excavation. Tunn. Undergr. Space Technol. 2020, 103, 103467. [Google Scholar] [CrossRef]
  32. Hjelme, J.G. Drill Parameter Analysis in the Løren Tunnel. Master’s Thesis, University of Oslo: Faculty of Mathematics and Natural Sciences, Oslo, Norway, 2010. [Google Scholar]
  33. Gupta, I.; Tran, N.; Devegowda, D.; Jayaram, V.; Rai, C.; Sondergeld, C.; Karami, H. Looking Ahead of the Bit Using Surface Drilling and Petrophysical Data: Machine-Learning-Based Real-Time Geosteering in Volve Field. SPE J. 2020, 25, 990–1006. [Google Scholar] [CrossRef]
  34. Klyuchnikov, N.; Zaytsev, A.; Gruzdev, A.; Ovchinnikov, G.; Antipova, K.; Ismailova, L.; Muravleva, E.; Burnaev, E.; Semenikhin, A.; Cherepanov, A.; et al. Data-Driven Model for the Identification of the Rock Type at a Drilling Bit. J. Pet. Sci. Eng. 2019, 178, 506–516. [Google Scholar] [CrossRef]
  35. Litvinenko, V.S.; Dvoinikov, M.V. Justification of the Technological Parameters Choice for Well Drilling by Rotary Steerable Systems. PMI 2019, 235, 24–29. [Google Scholar] [CrossRef]
  36. Romanenkova, E.; Zaytsev, A.; Klyuchnikov, N.; Gruzdev, A.; Antipova, K.; Ismailova, L.; Burnaev, E.; Semenikhin, A.; Koryabkin, V.; Simon, I.; et al. Real-Time Data-Driven Detection of the Rock-Type Alteration During a Directional Drilling. IEEE Geosci. Remote Sens. Lett. 2020, 17, 1861–1865. [Google Scholar] [CrossRef]
  37. Finfinger, G.; Peng, S.; Gu, Q.; Wilson, G.; Thomas, B. An Approach to Identifying Geological Properties from Roof Bolter Drilling Parameters. In Proceedings of the 19th International Conference on Ground Control in Mining, Morgantown, WV, USA, 8–10 August 2000; pp. 1–12. [Google Scholar]
  38. Kahraman, S.; Rostami, J.; Naeimipour, A. Review of Ground Characterization by Using Instrumented Drills for Underground Mining and Construction. Rock Mech. Rock Eng. 2016, 49, 585–602. [Google Scholar] [CrossRef]
  39. Rostami, J.; Kahraman, S.; Naeimipour, A.; Collins, C. Rock Characterization While Drilling and Application of Roof Bolter Drilling Data for Evaluation of Ground Conditions. J. Rock Mech. Geotech. Eng. 2015, 7, 273–281. [Google Scholar] [CrossRef]
  40. Utt, W.K. Neural Network Technology for Strata Strength Characterization. In Proceedings of the IJCNN’99. International Joint Conference on Neural Networks. Proceedings (Cat. No.99CH36339), Washington, DC, USA, 10–16 July 1999; IEEE: Washington, DC, USA, 1999; Volume 6, pp. 3806–3809. [Google Scholar]
  41. Teale, R. The Concept of Specific Energy in Rock Drilling. Int. J. Rock Mech. Min. Sci. 1965, 2, 57–73. [Google Scholar] [CrossRef]
  42. Wold, S.; Esbensen, K.; Geladi, P. Principal Component Analysis. Chemom. Intell. Lab. Syst. 1987, 2, 37–52. [Google Scholar] [CrossRef]
  43. Herwig, N.; Borghesani, P. Explaining Deep Neural Networks Processing Raw Diagnostic Signals. Mech. Syst. Signal Process. 2023, 200, 110584. [Google Scholar] [CrossRef]
  44. Loh, W.-Y.; Zhou, P. Variable Importance Scores. J. Data Sci. 2021, 19, 569–592. [Google Scholar] [CrossRef]
  45. Wei, P.; Lu, Z.; Song, J. Variable Importance Analysis: A Comprehensive Review. Reliab. Eng. Syst. Saf. 2015, 142, 399–432. [Google Scholar] [CrossRef]
  46. Barton, N.; Lien, R.; Lunde, J. Engineering Classification of Rock Masses for the Design of Tunnel Support. Rock Mech. 1974, 6, 189–236. [Google Scholar] [CrossRef]
  47. Bieniawski, Z.T. Geomechanics Classification (Rock Mass Rating System). In Engineering Rock Mass Classifications: A Complete Manual for Engineers and Geologists in Mining, Civil, and Petroleum Engineering; Wiley-Interscience: New York, NY, USA, 1989. [Google Scholar]
  48. Deere, D.U. Technical Description of Rock Cores. Rock Mech. Eng. Geol. 1963, 1, 18–22. [Google Scholar]
  49. Hoek, E.; Brown, E.T. Practical Estimates of Rock Mass Strength. Int. J. Rock Mech. Min. Sci. 1997, 34, 1165–1186. [Google Scholar] [CrossRef]
  50. Khorzoughi, M.B.; Hall, R.; Apel, D. Rock Fracture Density Characterization Using Measurement While Drilling (MWD) Techniques. Int. J. Min. Sci. Technol. 2018, 28, 859–864. [Google Scholar] [CrossRef]
  51. Galende-Hernández, M.; Menéndez, M.; Fuente, M.J.; Sainz-Palmero, G.I. Monitor-While-Drilling-Based Estimation of Rock Mass Rating with Computational Intelligence: The Case of Tunnel Excavation Front. Autom. Constr. 2018, 93, 325–338. [Google Scholar] [CrossRef]
  52. Ghosh, R.; Gustafson, A.; Schunnesson, H. Development of a Geological Model for Chargeability Assessment of Borehole Using Drill Monitoring Technique. Int. J. Rock Mech. Min. Sci. 2018, 109, 9–18. [Google Scholar] [CrossRef]
  53. Liu, J.; Jiang, Y.; Ishizu, S.; Sakaguchi, O. Estimation of Tunnel Support Pattern Selection Using Artificial Neural Network. Arab. J. Geosci. 2020, 13, 321. [Google Scholar] [CrossRef]
  54. Liu, J.; Jiang, Y.; Han, W.; Sakaguchi, O. Optimized ANN Model for Predicting Rock Mass Quality Ahead of Tunnel Face Using Measure-While-Drilling Data. Bull. Eng. Geol. Environ. 2021, 80, 2283–2305. [Google Scholar] [CrossRef]
  55. Navarro, J.; Sanchidrián, J.A.; Segarra, P.; Castedo, R.; Costamagna, E.; López, L.M. Detection of Potential Overbreak Zones in Tunnel Blasting from MWD Data. Tunn. Undergr. Space Technol. 2018, 82, 504–516. [Google Scholar] [CrossRef]
  56. Navarro, J.; Segarra, P.; Sanchidrián, J.A.; Castedo, R.; López, L.M. Assessment of Drilling Deviations in Underground Operations. Tunn. Undergr. Space Technol. 2019, 83, 254–261. [Google Scholar] [CrossRef]
  57. Schunnesson, H. Drill Process Monitoring in Percussive Drilling: A Multivariate Approach for Data Analysis. Licentiate Thesis, Lulea University of Technology, Lulea, Sweden, 1990. [Google Scholar]
  58. Schunnesson, H. RQD Predictions Based on Drill Performance Parameters. Tunn. Undergr. Space Technol. 1996, 11, 345–351. [Google Scholar] [CrossRef]
  59. Schunnesson, H. Rock Characterization Using Percussive Drilling. Int. J. Rock Mech. Min. Sci. 1998, 35, 711–725. [Google Scholar] [CrossRef]
  60. Schunnesson, H. Drill Process Monitoring in Percussive Drilling for Location of Structural Features, Lithological Boundaries and Rock Properties, and for Drill Productivity Evaluation. Ph.D. Thesis, Lulea University of Technology, Lulea, Sweden, 1997. [Google Scholar]
  61. Basarir, H.; Karpuz, C. Preliminary Estimation of Rock Mass Strength Using Diamond Bit Drilling Operational Parameters. Int. J. Min. Reclam. Environ. 2016, 30, 145–164. [Google Scholar] [CrossRef]
  62. Rajesh Kumar, B.; Vardhan, H.; Govindaraj, M.; Vijay, G.S. Regression Analysis and ANN Models to Predict Rock Properties from Sound Levels Produced during Drilling. Int. J. Rock Mech. Min. Sci. 2013, 58, 61–72. [Google Scholar] [CrossRef]
  63. Liu, W.; Rostami, J.; Ray, A.; Elsworth, D. Statistical Analysis of the Capabilities of Various Pattern Recognition Algorithms for Fracture Detection Based on Monitoring Drilling Parameters. Rock Mech. Rock Eng. 2020, 53, 2265–2278. [Google Scholar] [CrossRef]
  64. Zhao, R.; Shi, S.; Li, S.; Guo, W.; Zhang, T.; Li, X.; Lu, J. Deep Learning for Intelligent Prediction of Rock Strength by Adopting Measurement While Drilling Data. Int. J. Geomech. 2023, 23, 04023028. [Google Scholar] [CrossRef]
  65. Cheng, X.; Tang, H.; Wu, Z.; Liang, D.; Xie, Y. BILSTM-Based Deep Neural Network for Rock-Mass Classification Prediction Using Depth-Sequence MWD Data: A Case Study of a Tunnel in Yunnan, China. Appl. Sci. 2023, 13, 6050. [Google Scholar] [CrossRef]
  66. Ghosh, R.; Schunnesson, H.; Kumar, U. Evaluation of Rock Mass Characteriztics Using Measurement While Drilling in Boliden Minerals Aitik Copper Mine, Sweden. In Mine Planning and Equipment Selection; Drebenstedt, C., Singhal, R., Eds.; Springer International Publishing: Cham, Switzerland, 2014; pp. 81–91. ISBN 978-3-319-02677-0. [Google Scholar]
  67. Liu, H.; Yin, K.K. Analysis and Interpretation of Monitored Rotary Blasthole Drill Data. Int. J. Surf. Min. Reclam. Environ. 2001, 15, 177–203. [Google Scholar] [CrossRef]
  68. Manzoor, S.; Liaghat, S.; Gustafson, A.; Johansson, D.; Schunnesson, H. Rock Mass Characterization Using MWD Data and Photogrammetry. In Mining Goes Digital, Proceedings of the 39th International Symposium on Application of Computers and Operations Research in the Mineral Industry, APCOM 2019, Wroclaw, Poland, 4–6 June 2019; CRC Press: London, UK, 2019; pp. 217–225. [Google Scholar] [CrossRef]
  69. Rai, P.; Schunesson, H.; Lindqvist, P.A.; Kumar, U. An Overview on Measurement-While-Drilling Technique and Its Scope in Excavation Industry. J. Inst. Eng. India Ser. D 2015, 96, 57–66. [Google Scholar] [CrossRef]
  70. Khorzoughi, B.M.; Hall, R. Processing of Measurement While Drilling Data for Rock Mass Characterization. Int. J. Min. Sci. Technol. 2016, 26, 989–994. [Google Scholar] [CrossRef]
  71. Saranya, A.; Subhashini, R. A systematic review of Explainable Artificial Intelligence models and applications: Recent developments and future trends. Decis. Anal. J. 2023, 7, 100230. [Google Scholar] [CrossRef]
  72. Lundberg, S.; Lee, S.-I. A Unified Approach to Interpreting Model Predictions. arXiv 2017, arXiv:1705.07874. [Google Scholar] [CrossRef]
  73. Liu, X.; Zhang, X.; Wang, L.; Qu, F.; Shao, A.; Zhao, L.; Wang, H.; Yue, X.; Li, Y.; Yan, W.; et al. Research Progress and Prospects of Intelligent Technology in Underground Mining of Hard Rock Mines. Green Smart Min. Eng. 2024, 1, 12–26. [Google Scholar] [CrossRef]
  74. Su, R.; Zhao, Q.; Zheng, T.; Han, G.; Jiang, J.; Hu, J. A Framework for RQD Calculation Based on Deep Learning. Min. Metall. Explor. 2023, 40, 1567–1583. [Google Scholar] [CrossRef]
  75. Wang, C.Y.; Wang, Y.T.; Zou, X.J.; Han, Z.Q.; Zhong, S. Study of a Borehole Panoramic Stereopair Imaging System. Int. J. Rock Mech. Min. Sci. 2018, 104, 174–181. [Google Scholar] [CrossRef]
  76. Jin, C.Y.; Wang, K.; Han, T.; Lu, Y.; Liu, A.X.; Liu, D. Segmentation of Ore and Waste Rocks in Borehole Images using the Multi-Module Densely Connected U-net. Comput. Geosci. 2022, 159, 105018. [Google Scholar] [CrossRef]
  77. Chen, G.; Chen, M.; Hong, G.; Lu, Y.; Zhou, B.; Gao, Y. A New Method of Lithology Classification Based on Convolutional Neural Network Algorithm by Utilizing Drilling String Vibration Data. Energies 2020, 13, 888. [Google Scholar] [CrossRef]
  78. Yang, M.; Hu, Y.; Liu, B.; Wang, L.; Zhou, Z.; Jia, M. Application of Artificial Neural Networks for Identification of Lithofacies by Processing of Core Drilling Data. Appl. Sci. 2023, 13, 11934. [Google Scholar] [CrossRef]
Figure 1. Research framework for review of machine learning (ML) of mining MWD data.
Make 06 00063 g001
Figure 2. Annual distribution of published journal papers mentioning MWD for rock characterization in all excavation types using ML from 1997 to 2022.
Make 06 00063 g002
Figure 3. A general methodology for the building of ML models for the interpretation of data, including data preprocessing (A), feature engineering (B), structuring of training, validation and test sets (C) model validation (D), model optimisation (E), construction of a complementary explanatory model (F) validation of new data (G) prior to implementation of the model.
Make 06 00063 g003
Figure 4. Typical layout of a surface mining blast drill rig (Type: Epiroc D65) (left) and MWD variables (right).
Make 06 00063 g004
Figure 5. Relative frequency of machine learning methods reported in the in the analysis of MWD data in the Scopus database (GP—Gaussian processes, SVM—support vector machines, CNN—convolutional neural networks, FUZ—fuzzy systems, PCA—principal component analysis, MLP—multilayer perceptron, LOG—logistic regression, BAY—Bayes modelling, RF—random forest).
Make 06 00063 g005
Table 1. Summary of ML applications on MWD data for open-pit mining rock characterization.
ApproachApplicationModel *CommodityHolesTargetComment **References
SupervisedClassificationHOPCoal35Rock TypeInput of full-waveform sonic velocity[22]
LBIron Ore28Rock Type2D analysis; drill data averaged per hole[20]
FISIron Ore28Rock Type2D analysis; drill data averaged per hole[20]
GPIron Ore31Rock TypeLabels exclusive of 1 m from contact[8]
Iron OreN/ARock TypeBIF and shale in Brockman Formation[11]
Iron OreN/ARock TypeCWT preprocessing of MWD data[8]
LoRMarble204Grade6 classes of marble quality tested[23]
NNCoal17Rock TypeBackpropagation[16]
Iron Ore33Rock TypeFeedforward and Backpropagation[12]
Iron Ore28Rock Type2D analysis; drill data averaged per hole[20]
Coal35Rock TypeANN compares thresholding of SEM[18]
RFMarble204Grade6 classes of marble quality tested[23]
RegressionGPIron Ore7000GradeIron percentage, Phosphorous, Sulphur, Aluminum Oxide, Silicon Dioxide[24]
RF
SVM
UnsupervisedFeature ImportancePCACoal17Rock TypeUsed as validation of 3 input features[16]
Iron Ore33Rock TypeTo investigate specific fracture energy[12]
Iron ore302Rock TypeUsed for individual index calculation[25]
Change DetectionPCAMarble4Rock TypeIntrusion detection of marble[26]
ClusteringASCoal35Rock TypeSeam roof detection to cease drilling[27]
KMCCoal17Rock Type4 class clusters identified[16]
GPIron Ore138Rock Type2D analysis; drill data averaged per hole[21]
Iron Ore14,340GradeGaussian kernel[28]
HMMMarble3Rock TypeSudden material type transition[29]
NNIron Ore33Rock TypeSimple competitive learning[12]
SOMCoal17Rock Type3, 4 and 5 class maps for rock types[16]
Iron Ore33Rock Type3 class maps for 3 major rock types[12]
SVMIron Ore14,340Grade2D analysis; drill data averaged per hole[28]
* HOP: higher order polynomial, LB: LogitBoost, FIS: fuzzy inference system, GP: Gaussian process, LoR: logistic regression, NN: neural network, RF: random forest, SVM: support vector machines, PCA: principal component analysis, AS: adaptive sampling, KMC: K-means clustering, HMM: hidden Markov model and SOM: self-organizing maps. ** BIF: banded iron formation and CWT: continuous wavelet transformation.
Disclaimer/Publisher’s Note: The statements, opinions and data contained in all publications are solely those of the individual author(s) and contributor(s) and not of MDPI and/or the editor(s). MDPI and/or the editor(s) disclaim responsibility for any injury to people or property resulting from any ideas, methods, instructions or products referred to in the content.

