3.1. Comparing GRN Using Different Pooling Methods
A comparison of three pooling methods, MinCutPool, DiffPool, and SAGPool, has been carried out regarding their AUROC and AUPR performance. These methods were integrated into a graph convolution network to classify subgraphs extracted based on a Spearman correlation and mutual information.
Table 2 presents a comprehensive performance comparison among MicutPooling, DiffPooling, and SAGPool within the framework of a graph convolutional network, focusing on their efficacy in analyzing the in silico dataset. Among these, the SAGPooling layer distinguishes itself by demonstrating superior performance. Specifically, when leveraging a subgraph based on a Spearman correlation, SAGPooling achieves notable results with an AUROC of 0.834 and an AUPR of 0.623. Further, employing a mutual information-based subgraph attains an AUROC of 0.793 and an AUPR of 0.476. A combined analysis of both skeleton types further elevates its performance, yielding an impressive AUROC of 0.835 and an AUPR of 0.612.
The methodological insights extend across different pooling methods. For DiffPool, the Spearman correlation (SP) struggles with class differentiation, as evidenced by its lower AUROC and AUPR scores (0.600 and 0.287, respectively). On the other hand, mutual information (MI) significantly outperforms SP, with scores of 0.834 in AUROC and 0.556 in AUPR, indicating superior predictive accuracy. The ensemble approach, blending SP and MI, though slightly behind MI’s solo performance, still posts commendable scores of 0.807 in AUROC and 0.500 in AUPR, showcasing its effective adaptability. MinCutPool observations reveal a similar trend, with MI outperforming SP and the ensemble approach closely trailing MI, suggesting that integrating SP and MI offers enhanced performance levels. In the case of SAGPool, SP’s performance in certain metrics either rivals or surpasses the ensemble, pointing to instances where SP alone may be more effective. Although MI’s performance is slightly lower than SP and the ensemble, it varies depending on the context, indicating its nuanced impact.
Across various pooling methods and metrics, the ensemble strategy (SP + MI) consistently delivers robust performances, illustrating its balanced and resilient nature. This synergy likely benefits from the combined strengths of SP and MI, minimizing the risk of specific scenario underperformance and enhancing the model’s overall reliability and applicability. The analysis highlights the ensemble approach’s effectiveness in merging SP and MI to achieve a consistently strong and balanced performance. Despite MI often outperforming SP directly, the combined strategy effectively enhances the model’s efficacy, particularly in achieving an optimal balance between classification accuracy (AUROC) and positive class precision (AUPR). The ensemble method’s adaptability and reliability across different pooling methods and metrics underscore its potential to refine predictive modeling, especially within complex in silico datasets.
In
Table 3, our analysis extends to the
S. cerevisiae dataset, highlighting the effectiveness of various pooling techniques, with a particular focus on the SAGPooling layer’s performance across different evaluation metrics. The table contrasts the performances of three pooling methods—DiffPool, MinCutPool, and SAGPool—utilizing a Spearman correlation, mutual information, and an ensemble approach that combines both the Spearman correlation and mutual information. This comparison is grounded in two key performance indicators: the Area Under the Receiver Operating Characteristic curve (AUROC) and the Area Under the Precision–Recall curve (AUPR).
Integrating a Spearman correlation and mutual information, the ensemble approach consistently demonstrates superior efficacy, offering compelling evidence of its advantage. For instance, within the SAGPooling analysis, employing Spearman correlation alone yields an AUROC of 0.834 and an AUPR of 0.818. Meanwhile, utilizing mutual information as a standalone measure results in closely matched AUROC and AUPR scores of 0.807. The integration of these two methodologies—Spearman correlation and mutual information—enhances performance, achieving an AUROC of 0.854 and maintaining an AUPR of 0.807.
Our comprehensive assessment underscores that while individual metrics like a Spearman correlation or mutual information offer valuable insights, combined use through an ensemble strategy markedly improves performance. This is particularly evident in the MinCutPool and SAGPool analyses, where the ensemble method outstrips the individual performances of the Spearman correlation and mutual information, delivering the highest AUROC and AUPR scores. Such outcomes firmly establish the ensemble approach as a robust method that leverages the strengths of both Spearman correlation and mutual information, culminating in enhanced predictive accuracy and reliability across different pooling methods.
This synthesis of results from
Table 3 clearly illustrates the ensemble method’s superior performance over the singular use of a Spearman correlation or mutual information. It effectively harnesses each method’s unique advantages, leading to more effective and generally superior performance across diverse pooling methods and evaluation metrics. Therefore, the ensemble approach emerges as a more beneficial strategy for analyzing complex datasets, especially when aiming for the highest performance accuracy and reliability levels.
Table 4 provides a detailed comparative analysis of various pooling methods applied to the
E. coli dataset, specifically focusing on their performance metrics, AUROC and AUPR. This analysis evaluates three pooling methods, DiffPool, MinCutPool, and SAGPool, across three different data representation approaches: a Spearman correlation (SP), mutual information (MI), and an ensemble approach that synergizes SP and MI. The table meticulously reports the AUROC and AUPR values for each method and approach, with superior scores distinctly highlighted. The ensemble approach, combining SP and MI, emerges as a robust performer, often outmatching or closely rivaling the individual performances of SP or MI in terms of AUPR. This pattern underscores the ensemble’s efficacy in drawing upon the strengths of both SP and MI to yield enhanced or equivalent outcomes compared to the best-performing individual method.
The ensemble approach’s relative superiority, particularly noted in the context of AUPR, is significant for applications where precision and recall are paramount, such as in imbalanced datasets. This advantage stems from the ensemble’s balanced and comprehensive data representation, marrying the rank sensitivity of Spearman correlation with the non-linear dependency detection afforded by mutual information. This blend addresses the limitations inherent in each approach and capitalizes on their collective strengths to boost overall model performance.
The analysis presented in
Table 4 underscores the ensemble approach’s (SP + MI) distinct advantage in handling the
E. coli dataset across varied pooling methods. Although the ensemble might not always lead in AUROC, its consistent uplift or competitive parity in AUPR across all pooling methods solidifies its value. The ensemble’s ability to outperform or match the best individual methods’ performances highlights its potential as the preferred choice for scenarios where precision and recall are critical, effectively leveraging the integrated strengths of SP and MI to optimize model performance.
Upon confirming that the combined use of a Spearman correlation and mutual information (SP + MI) as an ensemble method leads to superior outcomes, we conducted a detailed comparison of different pooling layers—namely DiffPool, MinCutPool, and SAGPool—across several datasets, as outlined in
Table 5. This comparison reveals the impact of implementing the ensemble strategy within various pooling layers for datasets such as in silico,
S. cerevisiae, and
E. coli, with a focus on two critical metrics: the Area Under the Receiver Operating Characteristic curve (AUROC) and the Area Under the Precision–Recall curve (AUPR). These metrics illustrate the ensemble method’s performance in each pooling layer.
The patterns observed in
Table 5 are striking, showing that SAGPool, when paired with the SP + MI ensemble approach, consistently exceeds the performance of other pooling layers across all datasets examined. For example, within the in silico dataset, SAGPool achieves AUROC and AUPR scores of 0.835 and 0.612, respectively, outperforming the scores obtained by both DiffPool and MinCutPool using the same ensemble method. This trend of SAGPool’s dominance continues across the
S. cerevisiae and
E. coli datasets, where it secures the highest AUROC and AUPR scores, solidifying its lead.
These results highlight SAGPool’s exceptional ability to leverage the combined strengths of a Spearman correlation and mutual information effectively. This pooling layer demonstrates superior adaptability to the nuances of different datasets and enhances the predictive accuracy and reliability of the models. SAGPool’s consistently superior performance across a variety of datasets underscores its robustness and efficiency in processing complex biological data, making it the preferred choice for researchers seeking the highest quality in computational analysis.
In summary,
Table 5 convincingly demonstrates that using the SAGPool layer in conjunction with the SP + MI ensemble approach significantly surpasses other pooling layers in various datasets. This is evidenced by the highest AUROC and AUPR scores, signifying SAGPool’s superior capability in making accurate and reliable predictions. Therefore, our study conclusively positions the ensemble method with SAGPool as the most effective approach for analyzing complex datasets, emphasizing its importance in the evolution of computational research methodologies.
In addition to performance evaluation, we also compared the execution times of MinCutPool, DiffPool, and SAGPool on the
E. coli datasets (
Table 6). The findings revealed that SAGPool was faster in execution time than the other methods.
Several reasons can explain the superior performance of SAGPooling over Diffpool and MinCutPool, for instance,
- -
Selective pooling: SAGPooling employs a self-attention mechanism to selectively pool a subset of nodes pertinent to the graph’s overall properties. This ability can sometimes lead to improved performance by capturing significant structural features of the graph more effectively than other methods.
- -
Adaptability: SAGPooling demonstrates superior adaptability to various graph structures. In contrast to DiffPool and MinCut Pooling, it does not require clustering the graph into a predetermined number of clusters or partitioning it into non-overlapping clusters, affording it greater flexibility.
- -
Computational efficiency: SAGPooling is often more computationally efficient than methods like DiffPool or MinCut Pooling, particularly for larger graphs. This efficiency can facilitate the development of more complex or deeper graph convolutional networks (GCNs), potentially enhancing performance.
- -
Less information loss: SAGPooling retains the most informative nodes and their connections, reducing information loss during the pooling process compared to other methods. This characteristic may lead to improved representation learning, thereby enhancing performance.
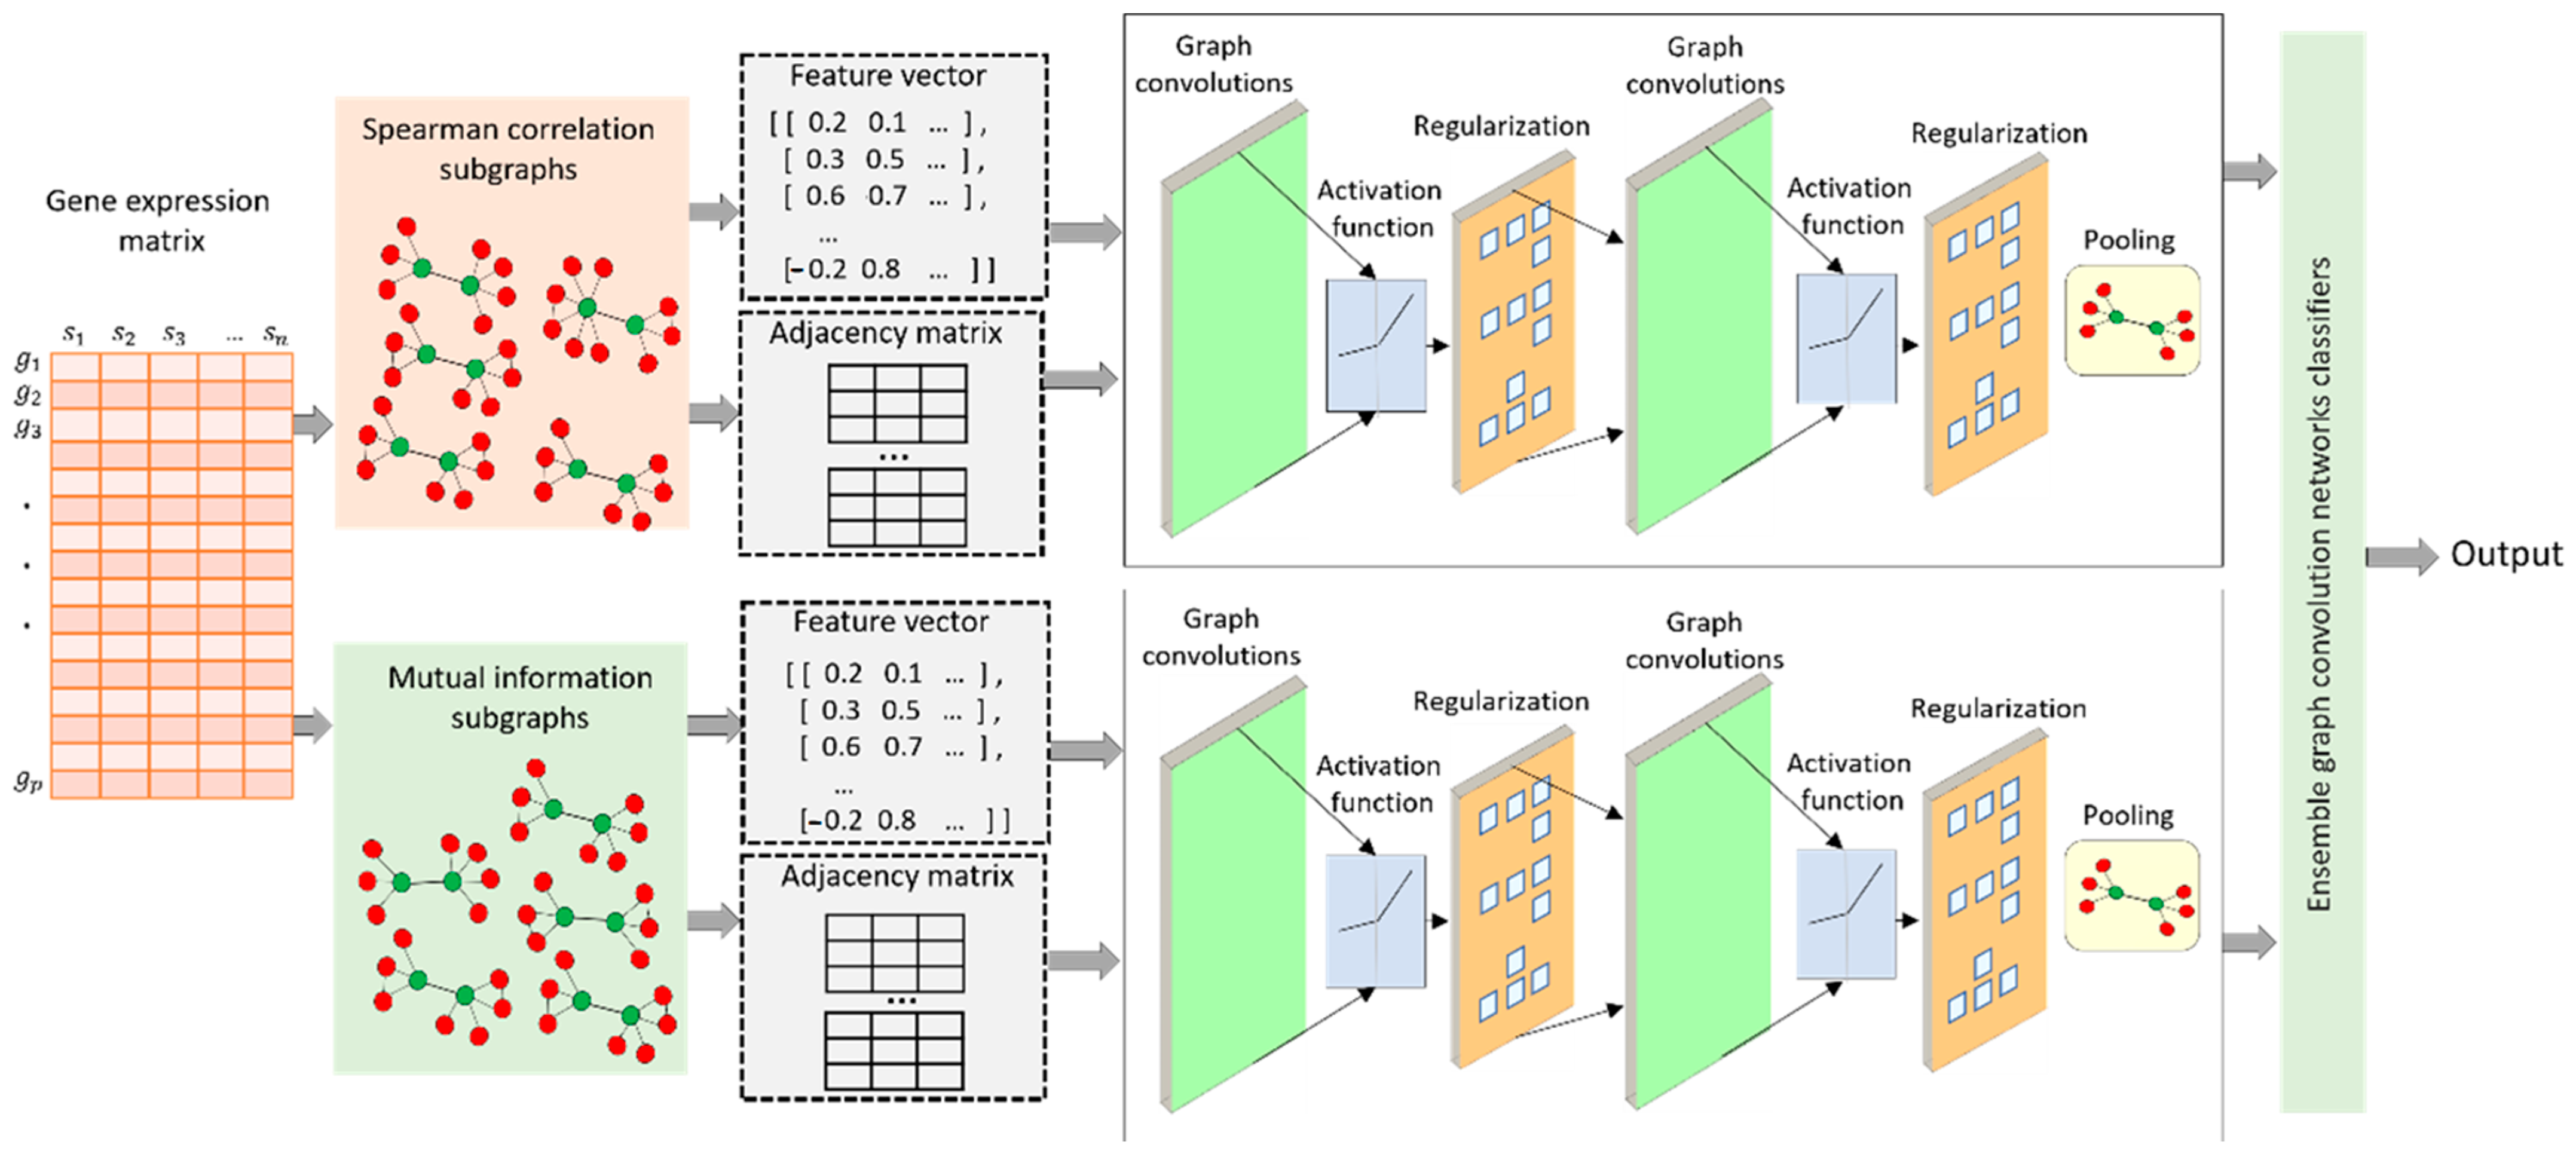
After selecting the best pooling method (SAGPool), we combined the results from Spearman’s correlation network and the mutual information network, which produces useful information for our proposed model. In the subsequent sections, we assess the performance of EGRC in comparison to other similar methods, including LEAP, GENIE3, GRNBoost2, PIDC, and PPCOR.
3.2. Analytical Comparison with Existing Approaches
To evaluate the effectiveness of EGRC, we replicated five benchmarking techniques stated in Pratapa et al., 2020—specifically, LEAP [
44], GENIE3 [
45], GRNBOOST2 [
46], PIDC [
47], and PPCOR [
48] —utilizing three datasets from DREAM5 [
43] in silico,
S. cerevisiae, and
E. coli. The benchmarking methods chosen for comparison with EGRC on the DREAM5 dataset have been carefully selected to encompass diverse approaches to gene regulatory network inference. Each method offers unique strengths and perspectives, making them suitable for comprehensive evaluation.
LEAP constructs gene co-expression networks from single-cell RNA-sequencing data by leveraging pseudo-time ordering to capture dynamic changes in gene expression over time. This approach is particularly valuable for understanding temporal dynamics in gene regulation, which aligns well with the goals of the EGRC method. We can assess how well EGRC captures temporal gene expression patterns by comparing it with LEAP. LEAP effectively captures dynamic co-expression patterns over time, providing insights into the temporal progression of cellular states. GENIE3 infers gene regulatory networks using ensemble methods of tree-based regression, where each gene’s expression is predicted from the expression of all other genes. This method is known for its robustness and ability to identify regulatory relationships based on feature importance scores. Comparing EGRC with GENIE3 allows us to evaluate the efficacy of EGRC in capturing regulatory relationships in a robust manner. Ensemble methods in GENIE3 enhance the accuracy and robustness of inferred regulatory networks.
GRNBoost2 employs gradient-boosting machines to predict regulatory interactions, offering an efficient and scalable approach. Its iterative decision tree-building process is designed to handle large datasets effectively. By including GRNBoost2 in the comparison, we can assess the scalability and efficiency of EGRC in inferring gene regulatory networks. GRNBoost2 is highly efficient and scalable, making it suitable for large datasets. PIDC infers gene networks by quantifying multivariate information measures, focusing on identifying non-linear dependencies and direct interactions between genes. This method’s ability to capture non-linear relationships is crucial for a comprehensive evaluation of EGRC, which aims to uncover complex regulatory interactions. PIDC’s strength lies in its ability to capture non-linear dependencies and direct interactions, providing a nuanced view of gene regulatory networks, while PPCOR calculates partial correlation coefficients to infer gene regulatory networks by controlling for the effects of other variables. This method provides a direct measure of the relationships between genes, making it a valuable benchmark for assessing the precision of EGRC in identifying direct regulatory interactions. PPCOR’s strength is in directly measuring relationships by controlling other variables, ensuring an accurate identification of the regulatory interactions.
Regarding the datasets chosen for comparison, in silico datasets offer controlled complexity, allowing researchers to design varying levels of complexity from simple linear interactions to highly complex non-linear dependencies, with the ability to control the number of genes, interaction density, and relationship types. Noise can be systematically introduced and controlled to simulate different experimental conditions, enabling the testing of inference methods’ robustness. Being synthetic, these datasets may lack the biological variability and unexpected patterns found in real-world data, but they benefit from known ground truth, making accuracy evaluation straightforward.
In contrast, S. cerevisiae, a model organism in genetics, presents a highly complex gene regulatory network with numerous well-studied pathways and interactions, high dimensionality, and non-linear dependencies, contributing to the complexity of network inference. These datasets also contain biological noise and experimental variability. Similarly, E. coli has a moderately complex gene regulatory network with well-annotated interactions, influenced by interactions among many genes and regulatory elements, and is subject to biological noise and variability from experimental conditions and genetic diversity. The presence of direct and indirect gene interactions further complicates network inference, and although there is substantial knowledge of E. coli’s gene network, it remains incomplete with potential unknown interactions.
By selecting these methods and using these datasets, we ensure a comprehensive and rigorous benchmarking process, allowing us to evaluate the performance of EGRC from multiple perspectives. This includes link predictive accuracy, robustness, and resilience. This holistic approach provides a thorough comparison, highlighting the strengths and potential areas for improvement of the EGRC method.
Figure 3 and
Figure 4 illustrate the AUROC and AUPRC performance of the assessed techniques across these three simulated DREAM5 datasets. Notably, EGRC consistently surpasses the other methods on all three datasets.
Figure 3a shows a distinct trend while evaluating the in silico dataset. The initial AUROC value is relatively low but exhibits gradual improvement over time. To assess the proposed method on the in silico dataset, we utilized the
E. coli dataset as the training dataset. The
E. coli dataset comprises real data, whereas the in silico dataset is generated synthetically.
Figure 3a highlights the initial difficulty our model faced in comprehending the relevant features within the data. However, as the training process advanced, the model successfully learned to extract more meaningful and informative features from the input data, improving its predictive performance. This feature learning process significantly contributed to the rapid enhancement of the AUROC score.
Figure 4 presents the comparative Precision–Recall curves for various GRN prediction algorithms across three DREAM5 datasets: (a) in silico, (b)
E. coli, and (c)
S. cerevisiae. EGRC consistently outperforms other methods, maintaining high precision and recall, especially in real-world datasets like
E. coli and
S. cerevisiae, demonstrating its robustness in handling complex gene regulatory networks with significant noise. GENIE3 and GRNBoost2 also show strong performance with balanced precision and recall, though they are slightly less effective in noisy environments. LEAP, PPCOR, and PIDC exhibit more variable performance, particularly with real-world datasets due to lower precision and recall. Overall, EGRC’s superior performance highlights its capability to accurately detect true regulatory links with minimal false positives across diverse datasets.
Our observations highlight an enhancement compared to five other methods, namely LEAP [
44], GENIE3 [
45], GRNBOOST2 [
46], PIDC [
47], and PPCOR [
48]. EGRC exhibited superior performance assessed to the commonly utilized technique, GENIE3.
In addition, we compared the performance of five benchmark methods—LEAP, GENIE3, GRNBoost2, PIDC, and PPCOR—against EGRC using three criteria: link predictive accuracy, robustness, and resilience.
Link predictive accuracy evaluates a method’s ability to correctly predict the presence or absence of regulatory links between genes. This is critical for identifying regulatory relationships and is measured using standard performance metrics such as the Area Under the Receiver Operating Characteristic curve (AUROC) and the Precision–Recall Curve (AUPR). The comparative analysis shows LEAP performs well in E. coli and S. cerevisiae datasets but less effectively in in silico datasets. GENIE3 demonstrates high accuracy, while GRNBoost2 exhibits medium to high accuracy due to its ensemble learning approach. PIDC achieves good accuracy, excelling in identifying non-linear dependencies in the in silico dataset, and PPCOR also shows good accuracy, relying on partial correlations in the in silico dataset.
Robustness refers to a method’s ability to maintain performance across different datasets and conditions, ensuring consistent performance across diverse datasets. This was assessed by testing each method on multiple datasets with different characteristics, including in silico, E. coli, and S. cerevisiae. LEAP’s reliance on pseudo-time ordering makes it less robust across different dataset types. GENIE3 is highly robust and performs well across diverse datasets. GRNBoost2 is moderately robust, with performance varying depending on dataset characteristics. PIDC’s robustness is low and influenced by data complexity, while PPCOR also exhibits low robustness and struggles with larger networks.
Resilience measures a method’s ability to handle errors, missing data, or unexpected variations in the data. This criterion was evaluated by introducing noise (perturbations) into the datasets, simulating real-world conditions such as those found in the E. coli dataset, where experimental data often contain noise and variability. The results indicate that LEAP is moderately effective in noise mitigation, performing well in specific scenarios but lacking comprehensiveness. GENIE3 shows low noise mitigation, with significant performance drops in noisy data. GRNBoost2 manages noise better than some methods but maintains only medium effectiveness. PIDC excels in noise mitigation due to its use of multivariate measures, while PPCOR handles noise moderately well but is less effective compared to others.
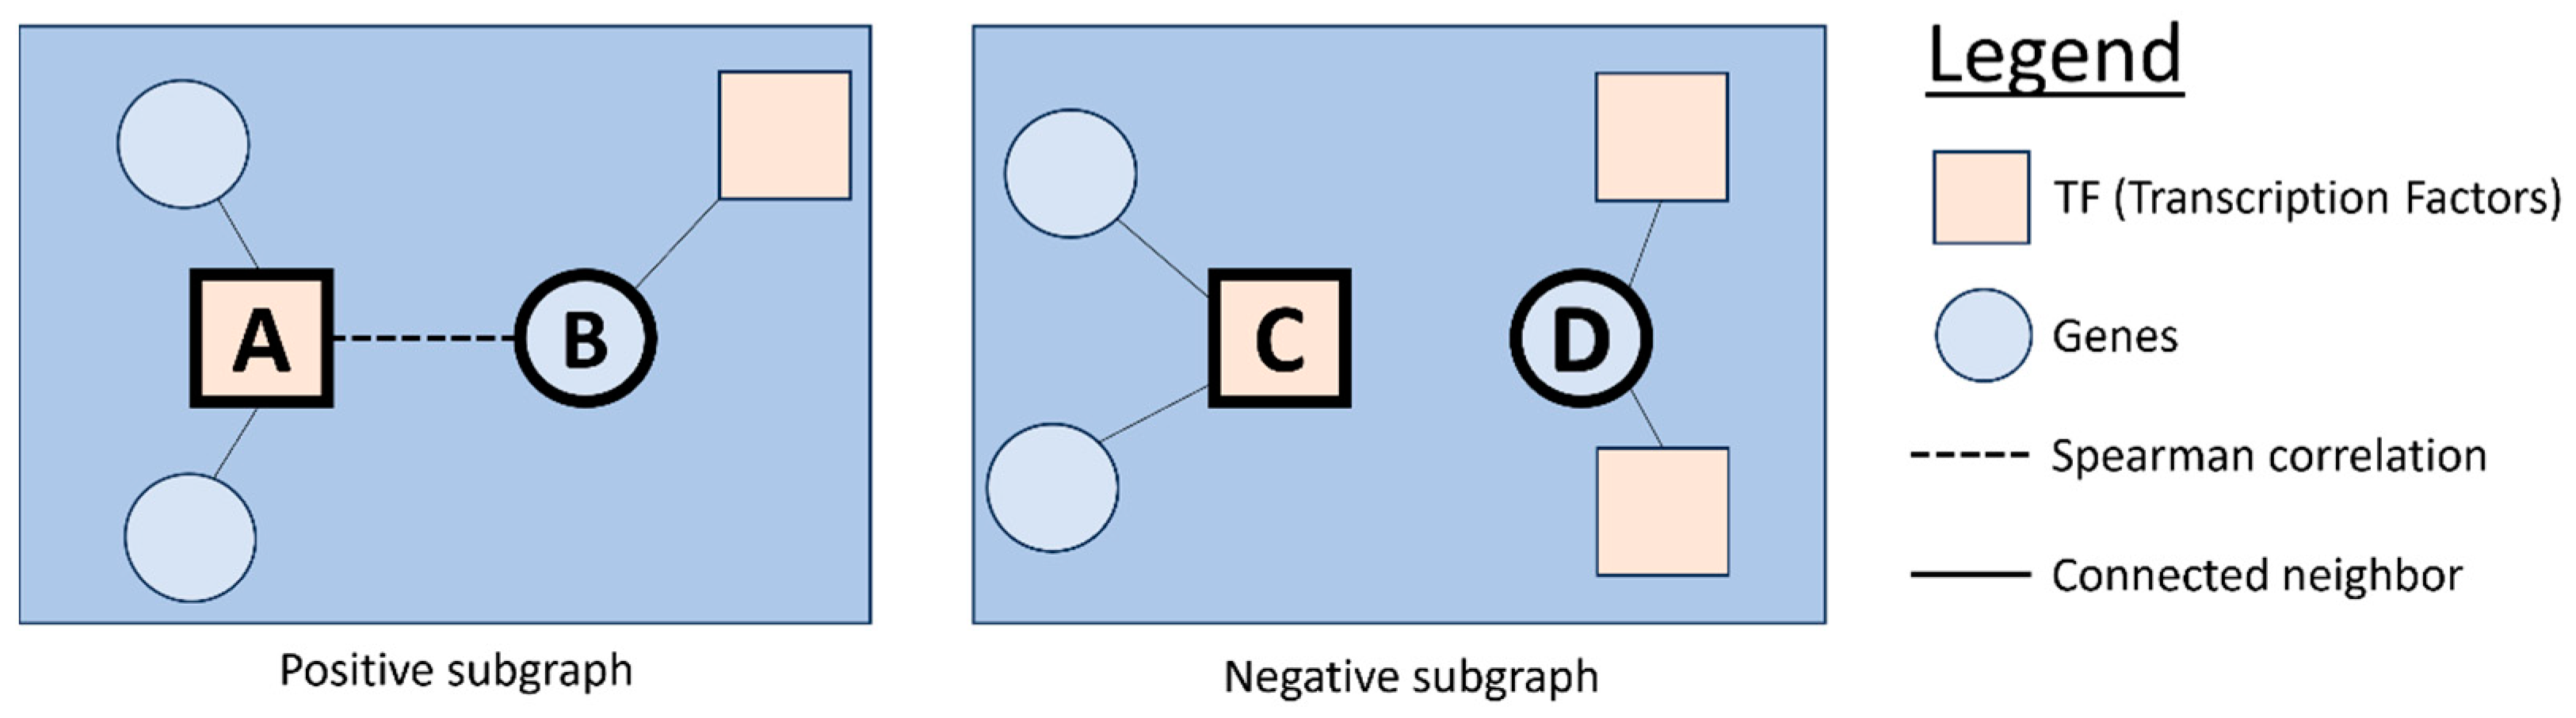
Conversely, EGRC demonstrates superior performance across all three criteria. Its innovative use of Graph Convolution with Self-Attention Graph Pooling enhances link predictive accuracy by capturing complex patterns in gene regulation. Additionally, dual GCN models improve robustness and resilience by effectively classifying ‘Positive’ and ‘Negative’ subgraphs. The combination of Spearman’s correlation and mutual information provides superior noise mitigation by capturing a broader spectrum of gene interactions, making EGRC highly effective even in noisy datasets like E. coli.


