Article

Accuracy Improvement of Debonding Damage Detection Technology in Composite Blade Joints for 20 kW Class Wind Turbine

1
The Innovation Research Center for Giant Wind Turbine System, Kunsan National University, Gunsan-si 54150, Republic of Korea
2
Department of Mechanical Engineering, Kunsan National University, Gunsan-si 54150, Republic of Korea
*
Author to whom correspondence should be addressed.
Mach. Learn. Knowl. Extr. 2024, 6(3), 1857-1870; https://doi.org/10.3390/make6030091
Submission received: 13 May 2024 / Revised: 19 June 2024 / Accepted: 26 June 2024 / Published: 7 August 2024
(This article belongs to the Section Network)

Abstract

:
Securing the structural safety of blades has become crucial, owing to the increasing size and weight of blades resulting from the recent development of large wind turbines. Composites are primarily used for blade manufacturing because of their high specific strength and specific stiffness. However, in composite blades, joints may experience fractures from the loads generated during wind turbine operation, leading to deformation caused by changes in structural stiffness. In this study, 7132 debonding damage data, classified by damage type, position, and size, were selected to predict debonding damage based on natural frequency. The change in the natural frequency caused by debonding damage was acquired through finite element (FE) modeling and modal analysis. Synchronization between the FE analysis model and manufactured blades was achieved through modal testing and data analysis. Finally, the relationship between debonding damage and the change in natural frequency was examined using artificial neural network techniques.

1. Introduction

Owing to recent problems, such as environmental pollution, there is a growing interest in wind power, an eco-friendly energy source. The size of wind turbines has been increasing annually for larger annual energy production (AEP) in limited land. Because this increases the length and weight of the components, blades are manufactured using composites with high specific strength and specific stiffness [1,2,3,4]. In addition, the cost of producing a wind turbine blade is 15% to 20% of the total cost of producing a wind turbine. Its blade design cost is less than the total production cost, that is, the initial investment cost. Numerical modeling and optimization are required to reduce the LCOE (Levelized Cost of Electricity) through better composition models, the use of composite materials, and better manufacturing techniques [5]. Composite blades may suffer debonding damage that separates the spar cap–shear web joints and the joints of the leading and trailing edges owing to problems in the manufacturing process, drag and centrifugal force during operation, and external factors. Because debonding damage is caused to wind turbine blades, technology to detect debonding damage is required to secure structural safety and power generation efficiency [6,7,8]. Damage detection techniques that are currently available include visual inspection, ultrasonic waves, thermal image cameras, and machine vision [9,10,11,12]. Du et al. [13] introduced damage detection techniques for wind turbine blades using thermal imaging cameras or acoustic emission techniques. Kim et al. [14] introduced damage detection techniques for blades using image detection and tracking techniques. However, these studies could only detect external damage to blades, and damage detection through internal sensors could not be applied to the wind turbine blades already installed. To address these problems, research has been conducted using vibration to detect the changes in stiffness caused by internal damage through changes in the natural frequency [15]. Joshuva et al. [16] acquired vibration response data by attaching acceleration sensors to a 50 W-class wind turbine model and compared and presented the vibration data caused by blade damage. Awadallah and El-Sinawi [17] acquired vibration response data by attaching acceleration sensors to 400 W blades and classified different vibration characteristics depending on damage through machine learning. These studies, however, were conducted on ultra-small wind turbine models, which had structural differences from large wind turbine blades (e.g., shear web and spar cap), and they only considered external damage to ultra-small wind turbine blades. In general, it is difficult to analyze the vibration data of large blades because they vary in a complex manner depending on various damage factors, such as the size, position, and number of internal debonding damages. Therefore, studies have been conducted to address data or problems that are difficult to analyze using machine learning. Kim et al. [18] predicted damage, using machine learning models to diagnose defects in a rotating body. Adrian et al. [19] explained the learning model coordination method according to the characteristics of the data to be used. It is practically difficult to apply these two studies to damage detection for composite blades because the objects are structurally different. Thus, a previous study [20] proposed a damage prediction algorithm based on the change in the natural frequency caused by debonding damage to a 5 MW blade. From that study, the possibility of predicting debonding damage through natural frequency was determined; however, it was difficult to consider the vibration characteristics that vary depending on the complex damage factors of the blades. Therefore, research on the improvement of the accuracy of machine learning algorithms by securing more detailed damage information and natural frequency data is required to consider complex factors.
This study aims to predict debonding damage to composite blades for 20 kW-class wind turbines considering the internal structure of the blades using the artificial neural network (ANN) technique based on natural frequency characteristics according to stiffness change. To this end, joints subjected to damage, the damage position, and the damage size were defined first, and 7132 debonding damage data for composite blades were modeled using ABAQUS 2022 [21], a finite element analysis (FEA) software program. A modal test was conducted by manufacturing a blade in the same way as the FEA model, and the model was improved through the acquired natural frequency data. To predict debonding damage by acquiring natural frequency data according to the debonding damage of the model, the debonding damage accuracy for composite blades was improved by designing and reinforcing the ANN model of MATLAB 2020a [22], a numerical analysis software program.

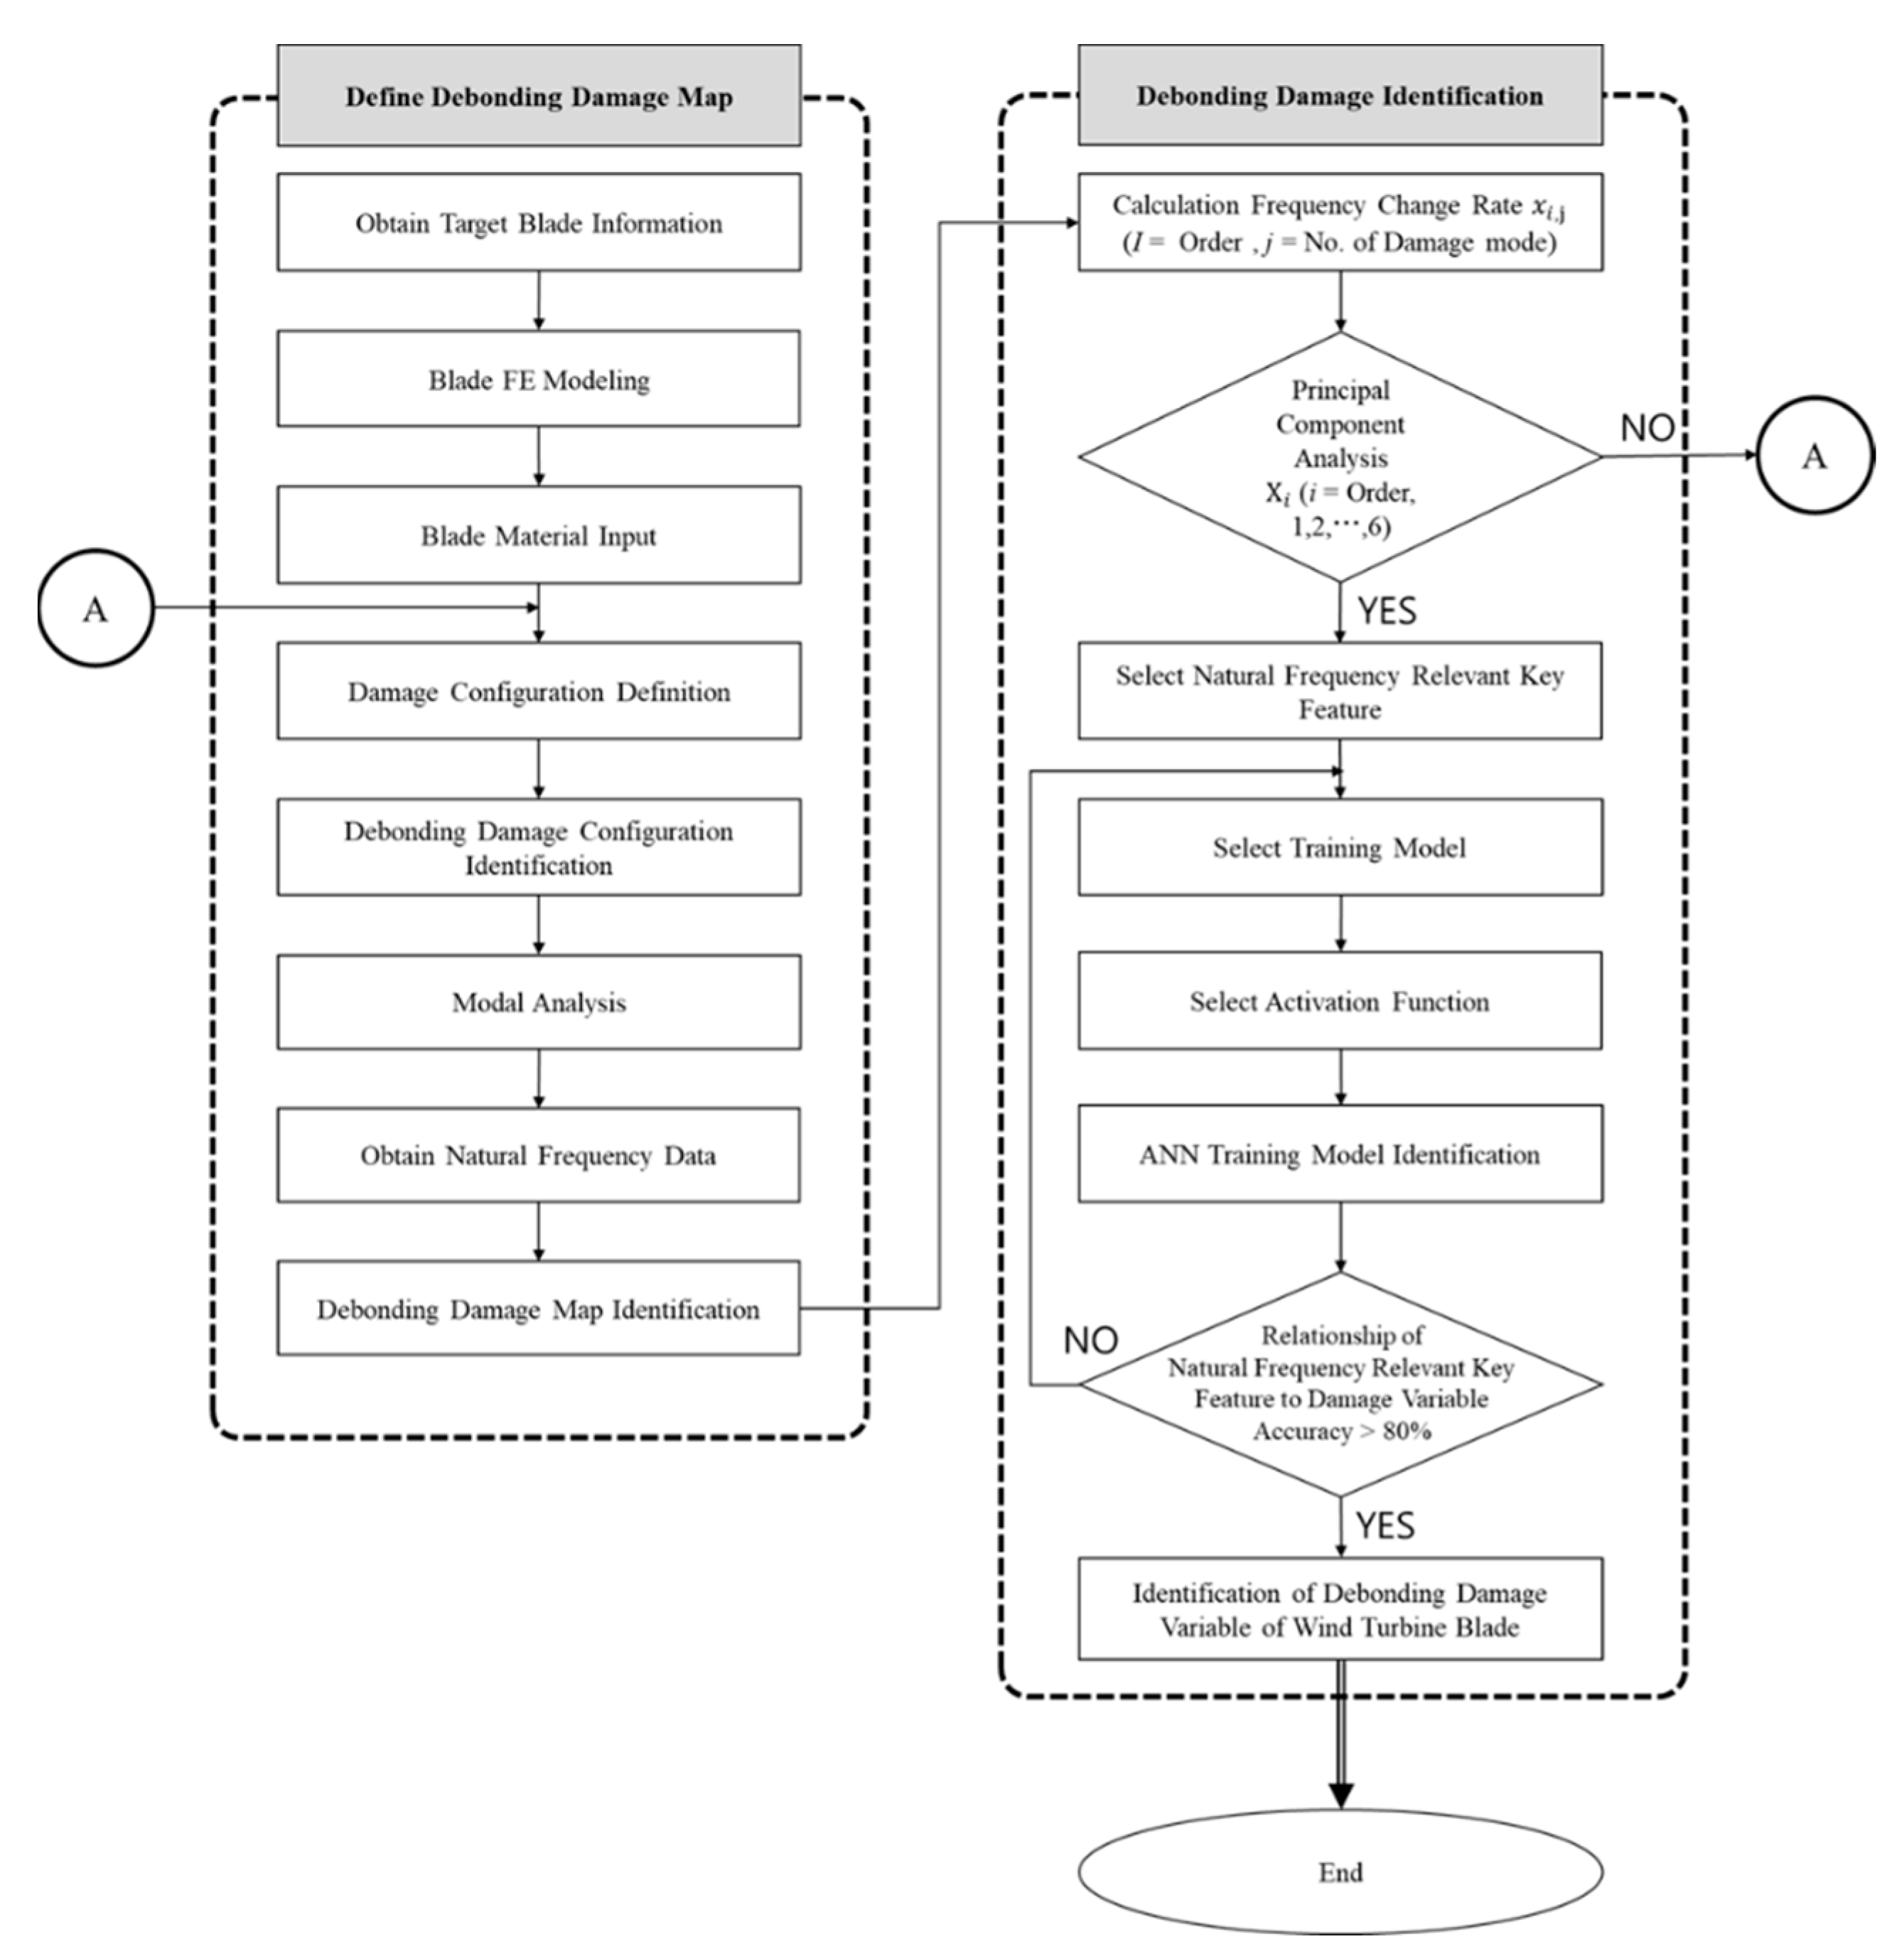
2. Damage Prediction Model Development

The blade used to predict debonding damage was the blade model for 20 kW-class wind turbines developed in Kunsan National University, featuring a spar cap and shear web, which are the structural characteristics of large composite blades [23]. This modeling method is shown in Figure 1, and the specifications are listed in Table 1. And as shown in Figure 1, the modeling method implemented the bonding and debonding conditions by applying multi-point bonding conditions.

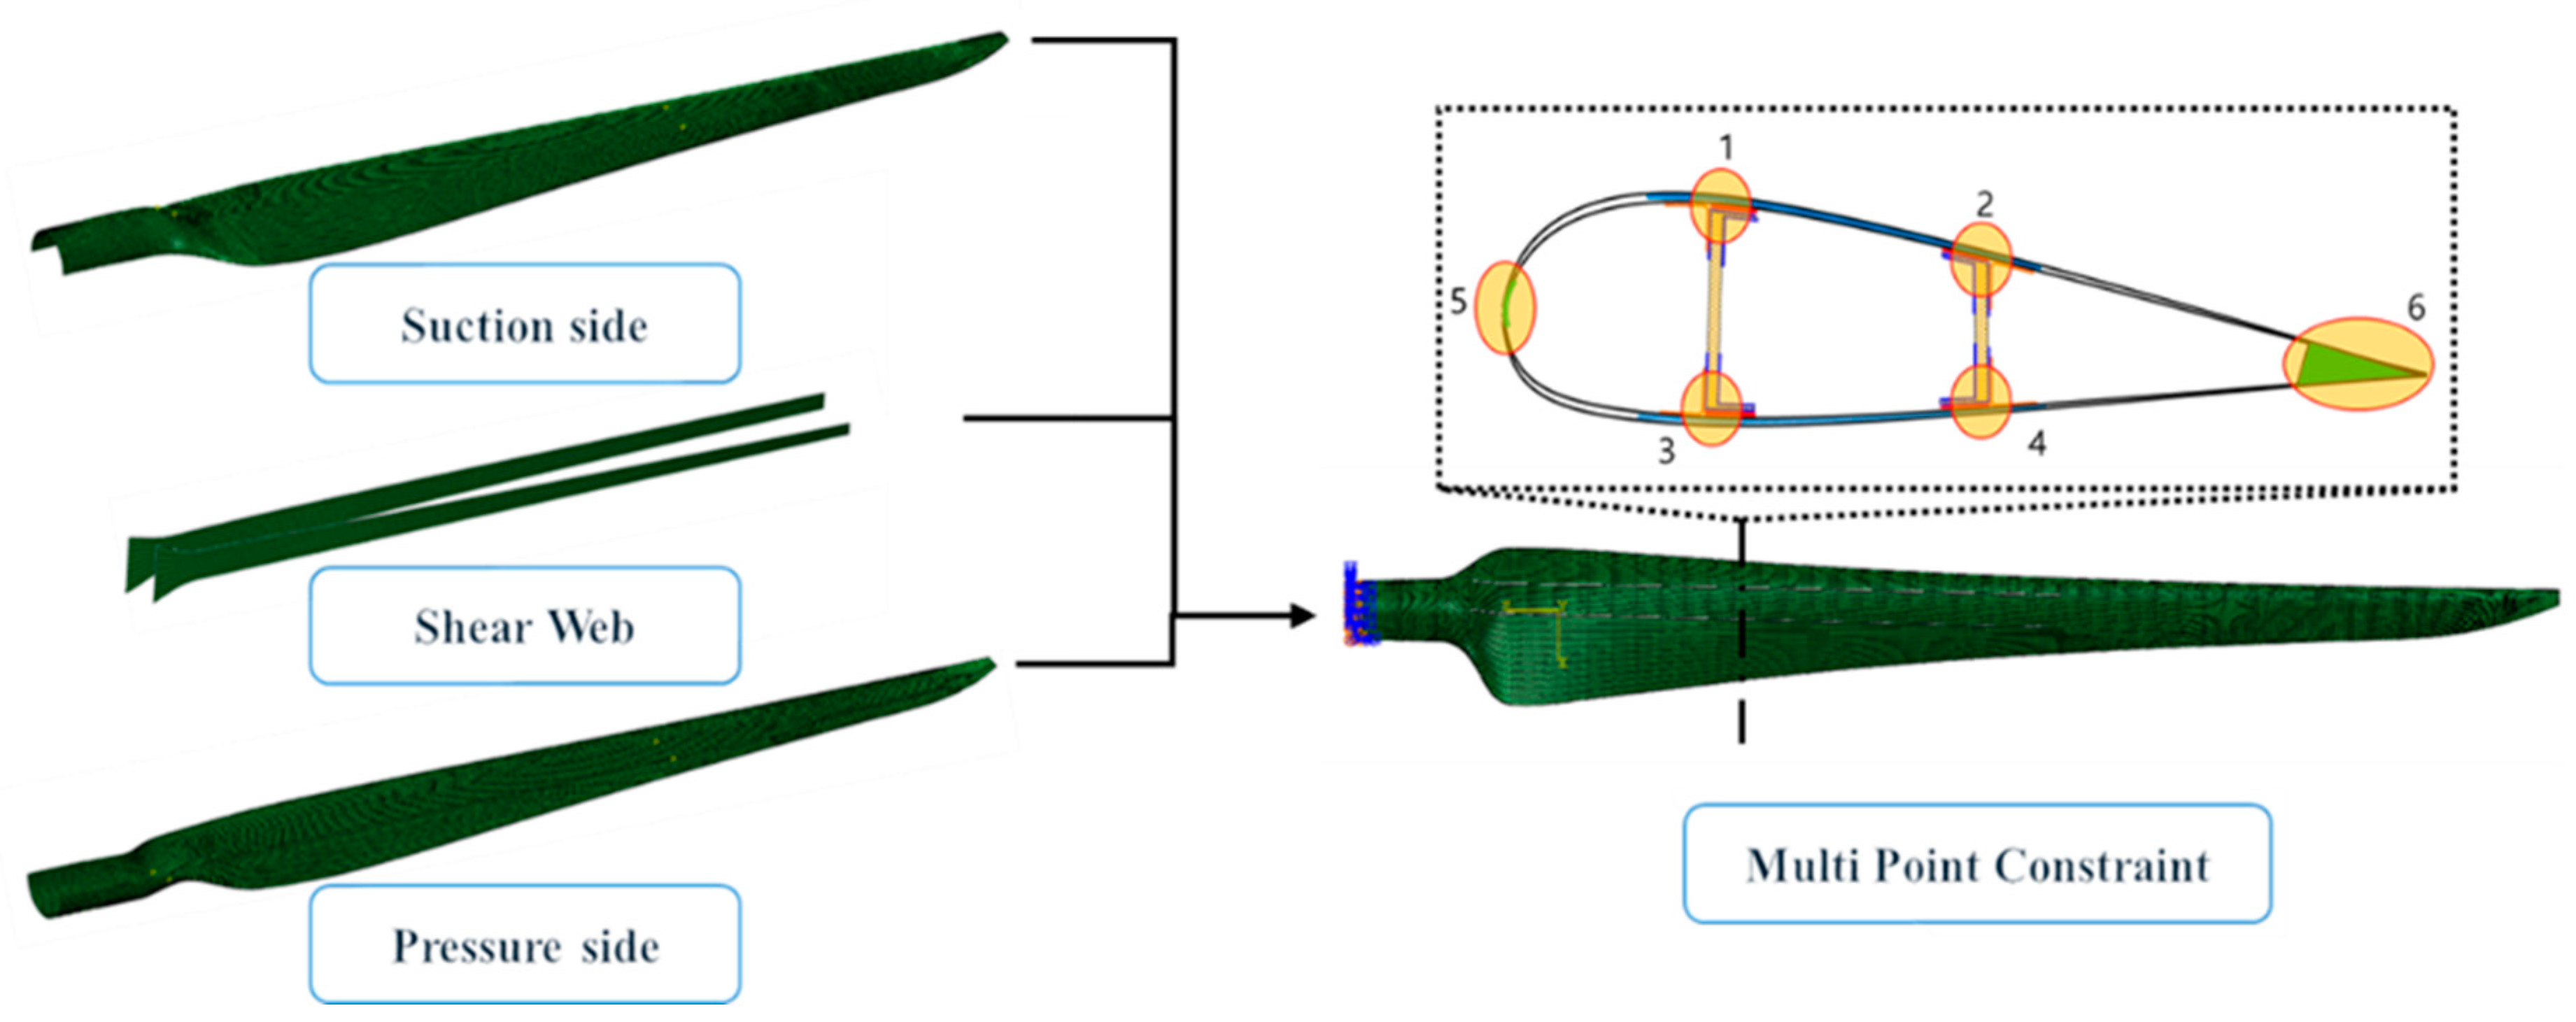
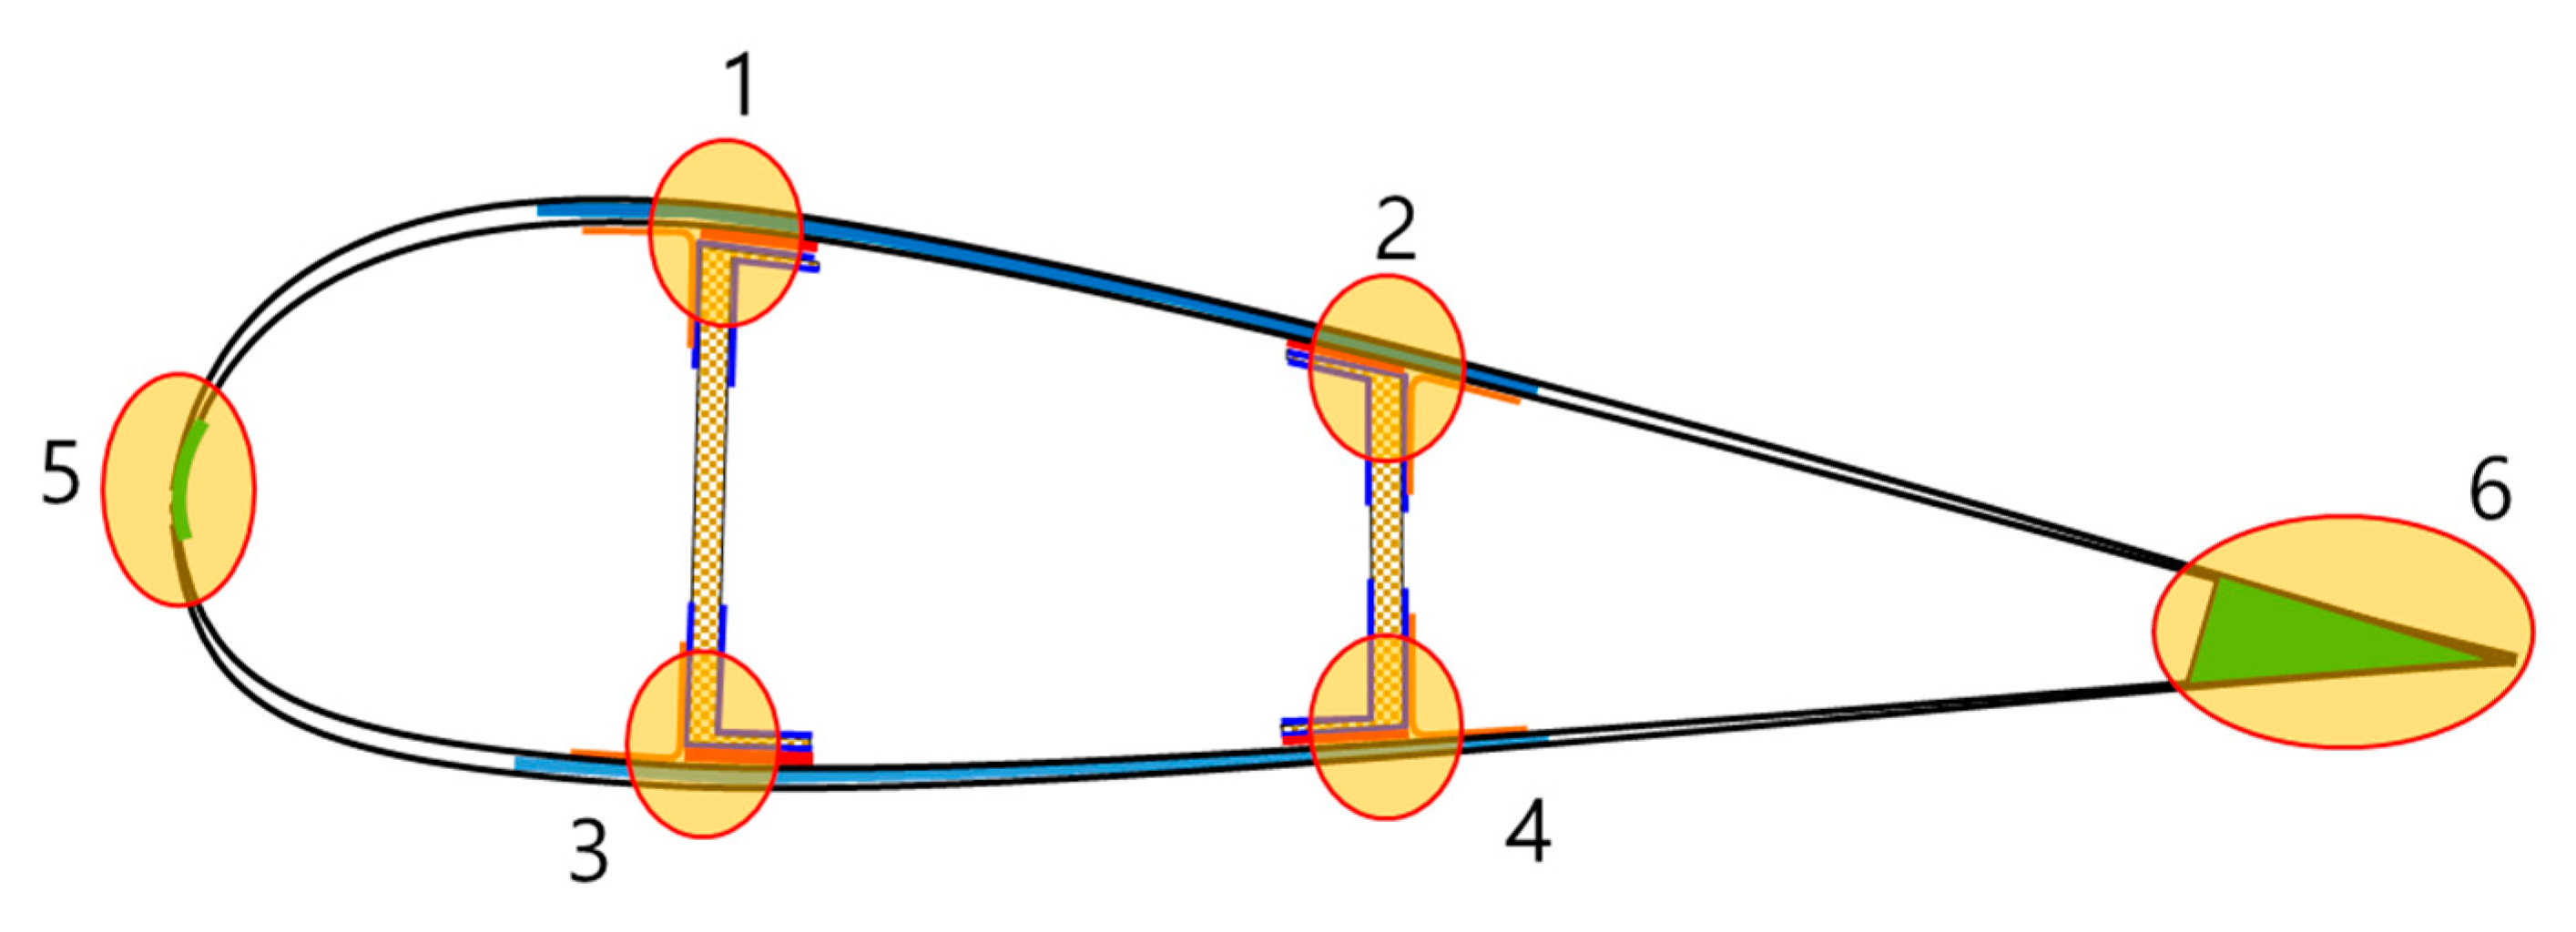
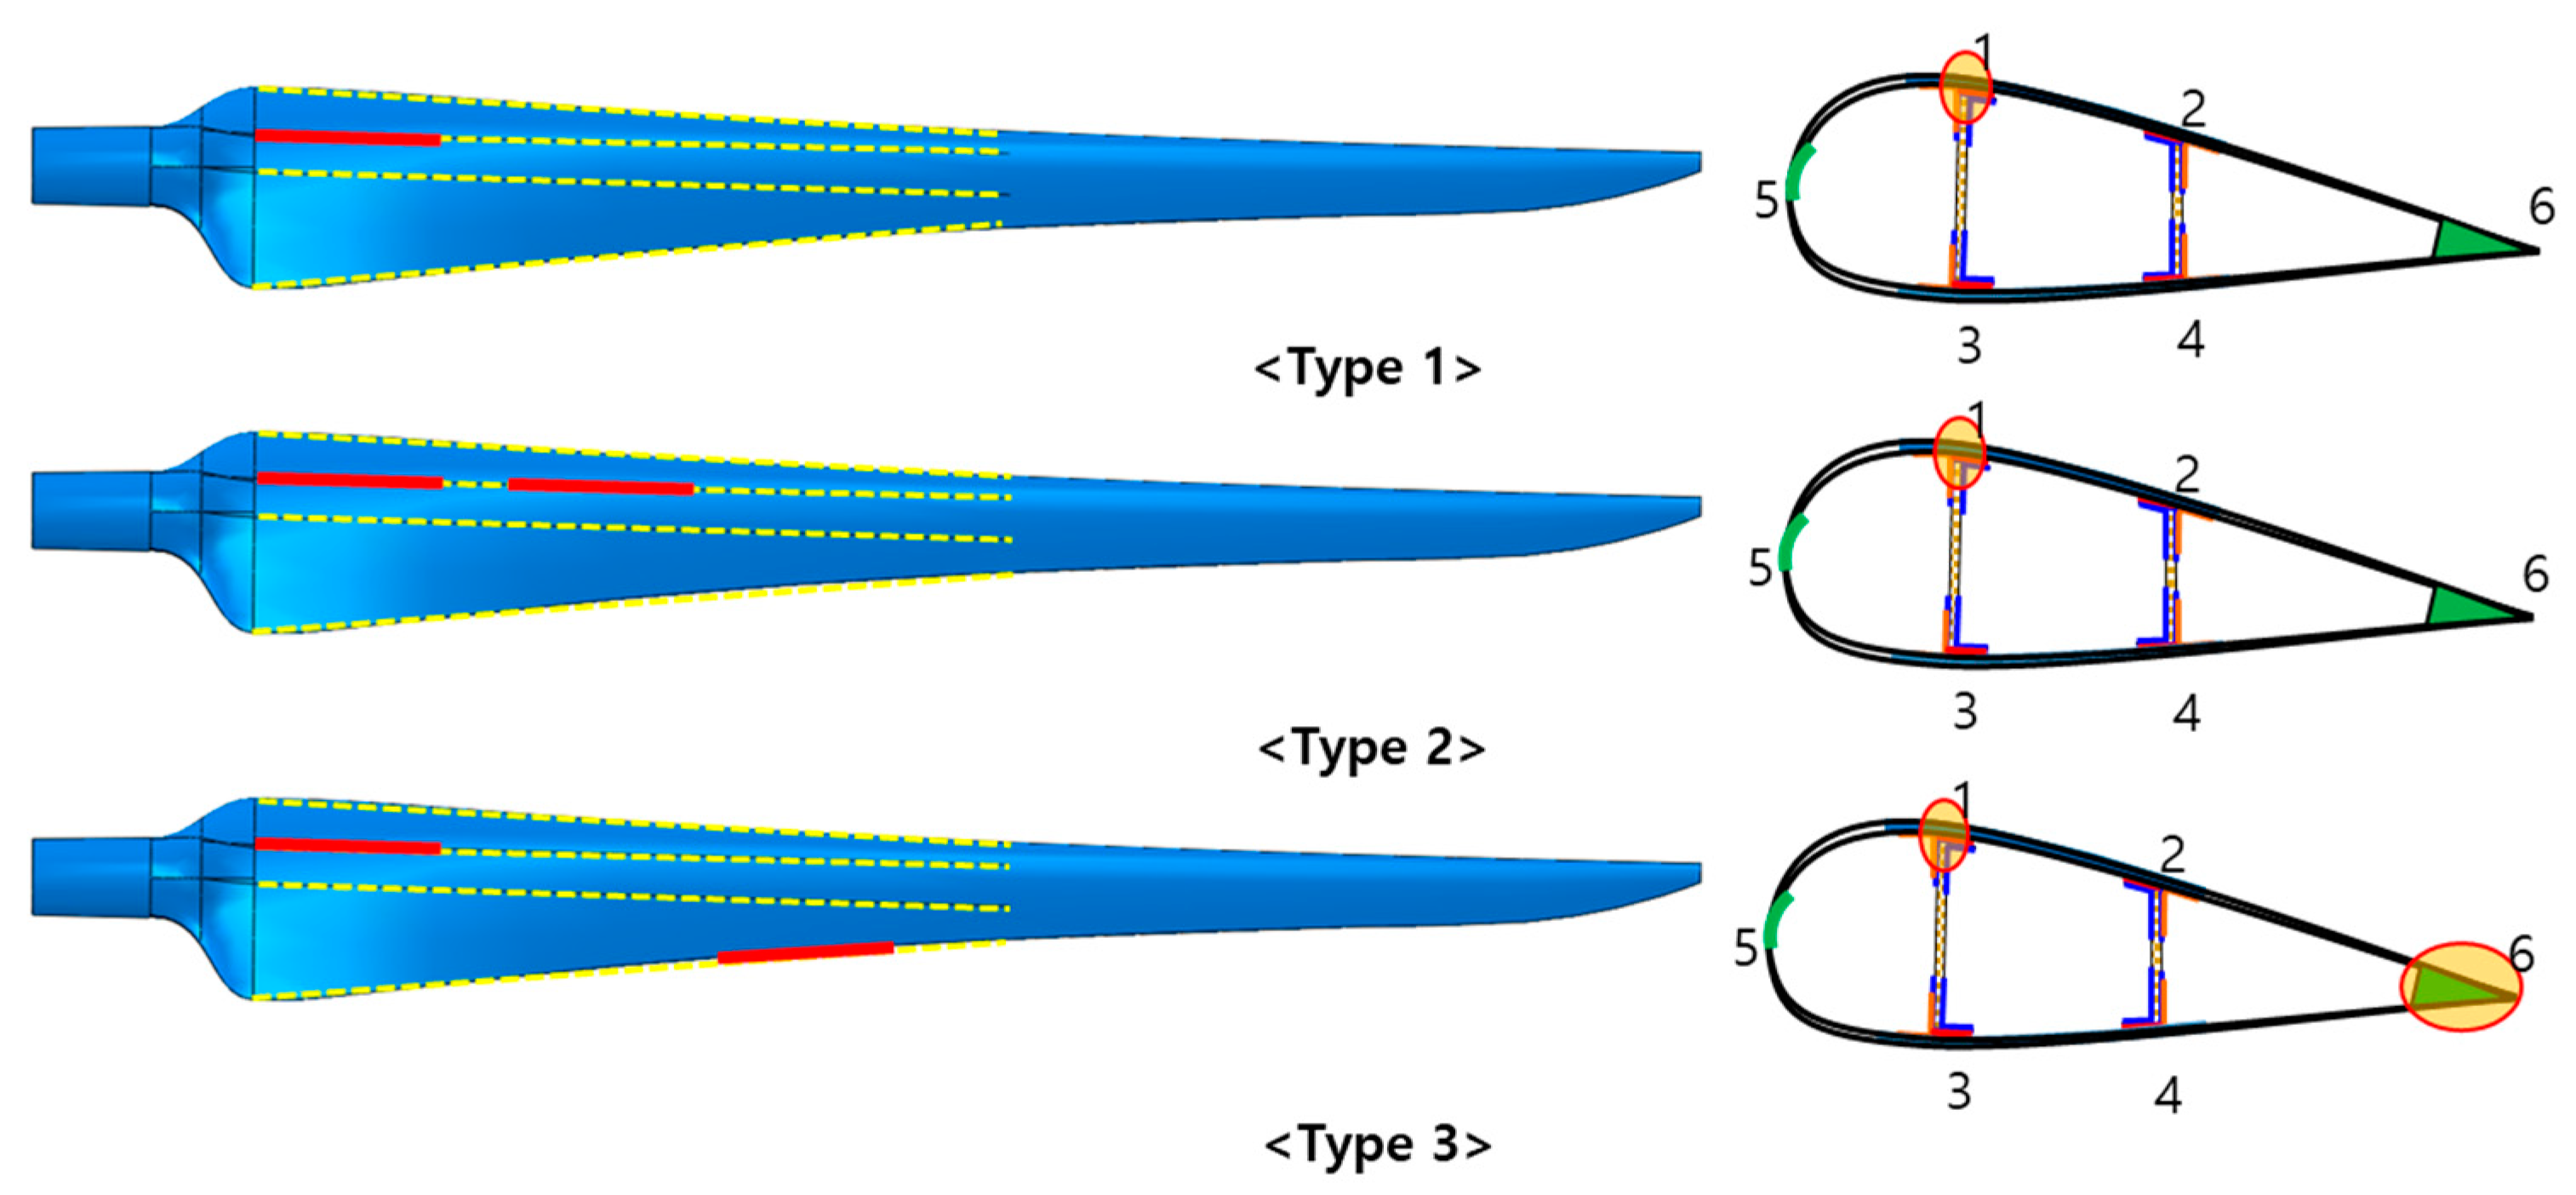
2.1. Damage Selection

This study developed and demonstrated a procedure for identifying debonding damage using an ANN on the changes in the natural frequency characteristics of a wind turbine blade, as shown in Figure 2. The procedure consists of (1) selecting the target blade and constructing a corresponding FE model, (2) defining the debonding damage configuration through selecting proper debonding damage variables, (3) constructing a debonding damage map using the natural frequency changes obtained through modal analysis, (4) selecting important key features using a preprocessing technique such as PCA, and (5) identifying debonding damage using an ANN. In this study, the authors employed the blades of the 5-MW class Sandia offshore wind turbine [24].
In this study, the debonding damage that can occur at six blade joints (Figure 3) was classified based on the damage type, damage start position, and damage size, and 7132 damage data were selected. First, as shown in Figure 4, the damage type was classified into three types. Type 1 has one instance of damage in a single web, while type 2 has two instances of damages in a single web. Type 3 has one instance of damage in each of the two webs. The damage start position includes points that are 18% away from the root of the blade, where debonding damage has the greatest impact on the safety of the blade, and the points 0.5 m, 1.3 m, and 2.1 m away from the root were selected to consider all the shear web–spar cap joints. The damage size was selected differently depending on the type to examine changes in the natural frequency for the entire range of damaged joints, as shown in Figure 5a–c. For type 1, 0.2 m sized damage began at the damage start point of the joint and increased by 0.2 m to 1.8 m. For type 2, 0.1 m sized damage began at the damage start point and increased by 0.1 m to 0.5 m. In type 3, the maximum damage size was selected differently depending on the damage start point to express the occurrence of one instance of debonding damage at each of the two joints. At the 0.5 m point from the root, 0.2 m sized damage began and increased by 0.2 m to 1.8 m. At the 1.3 m point from the root, 0.2 m sized damage began and increased by 0.2 m to 1.6 m. Finally, at the 2.1 m point from the root, 0.2 m sized damage began and increased by 0.2 m to 0.8 m.

2.2. Acquisition of Unique Characteristics

Modal analysis and/or natural frequency analysis identify the natural frequency of a structure and its geometric deformation according to the natural frequency of each mode. They are used to predict the resonance of a structure or its geometric deformation by vibration. In this study, a modal analysis of debonding damage was conducted using ABAQUS, an FEA software program. As shown in Table 2, the FE model used S4R shell elements, and the numbers of the elements and nodes were 40,153 and 41,736, respectively. A blade model without damage was constructed by bonding the spar cap–shear web joints and the joints of the leading and trailing edges using the multi-point constraint (MPC) technique. Subsequently, 7132 damage models were constructed by removing the bonds of the debonding damage occurrence points according to the damage selection criteria in Section 2.1. Modal analysis was conducted by restraining the degrees of freedom of the root of the model in the X, Y, and Z axes as initial constraints. Based on this, the first to sixth natural frequency data were acquired for 7132 debonding damage models.

2.3. Prediction Model Construction

The ANN technique, a type of supervised learning, was used to analyze changes in the natural frequency data for each damage model according to the damage selection criteria in Section 2.1. The ANN technique is mainly used to solve problems in certain areas without clear definitions, such as images, voice recognition, inference, and association, because it facilitates fast calculations through patterns trained with various types of input/output data and can express a number of input/output relationships with multiple hidden layers. It is necessary to prevent overfitting, which cannot properly perform the prediction of other data learning models, owing to excessive fitting to one learning model during the learning process. To this end, the data required for machine learning were classified into data for training, testing, and validation. In addition, a cross-validation technique that re-selects new training datasets and repeats training was used to minimize data redundancy. In addition to this, 70% (4992) of the debonding damage configurations were used as training data, 15% (1070) were used as testing, and 15% (1070) were used as validation data.

3. Modal Test for Model Synchronization

3.1. Blade Manufacturing
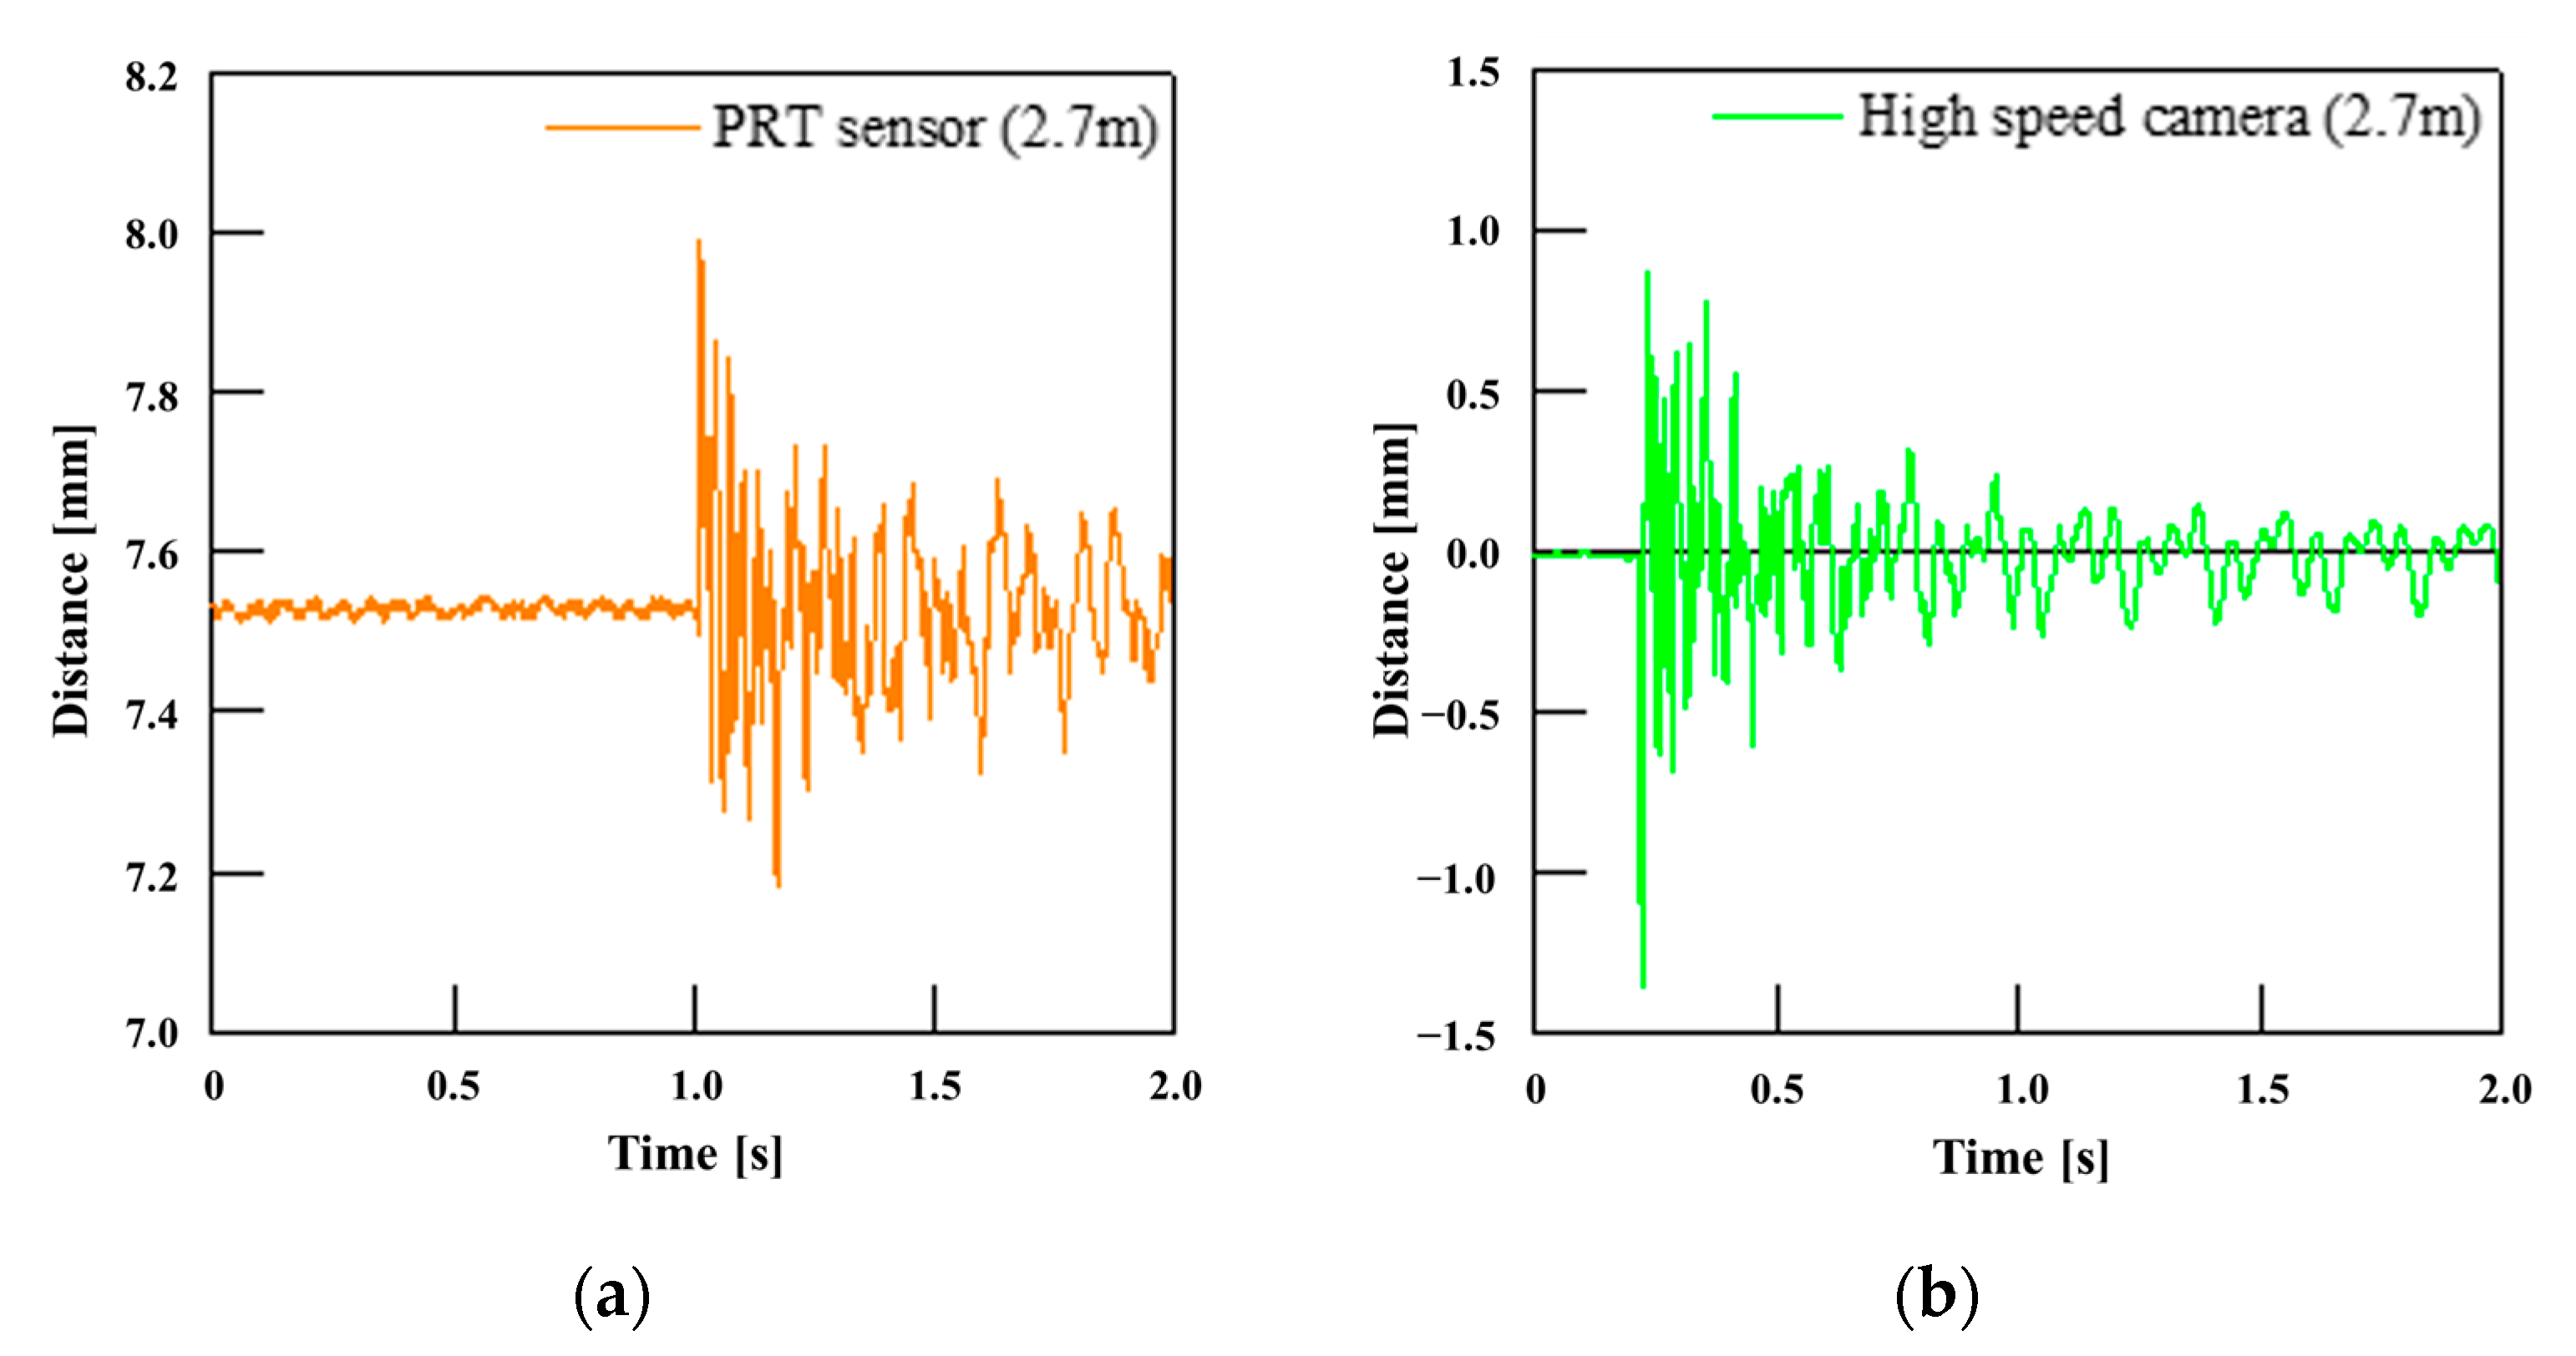
In this study, composite blades for 20 kW-class wind turbines were manufactured for the validation of the blade debonding damage prediction algorithm in Section 2. The weight difference from the FEA model was less than 5%. The specifications of the blades are listed in Table 3. A modal test was conducted to improve the FEA model through the acquisition and analysis of vibration characteristics. In addition, four blades with debonding damage were manufactured for validation of the algorithm.

3.2. Modal Test

To acquire and analyze the vibration characteristics of the composite blades, a fixing jig and a blade were combined, and an impact was applied to the blade using an impact hammer. Vibration response and natural frequency data were then acquired using a non-contact sensor. Table 4 lists the specifications of the PRT sensor and high-speed camera used for measurement. Vibration response data were measured at a distance 2.7 m away from the root because of the measurement range limit of the sensor. The related contents are shown in Figure 6, Figure 7 and Figure 8. And As shown in Figure 6, composite blades for a 20 kW wind power generator manufactured using GFRP (Glass Fiber Reinforcement Plastic) and CFRP (Carbon Fiber Reinforcement Plastic) materials were fixed. A test was conducted by hitting these blades with an impact hammer at a 4.5 m point. In particular, the position measured through the PRT sensor was measured at a point of 2.7 m, as shown in Figure 7. The reason for this selection is that it is the location where the most common data can be obtained as a result of testing several locations.

4. Results and Discussion

4.1. Blade Model Synchronization

Natural frequency data were acquired by conducting the test described in Section 3.2 and constructing a model without damage. Figure 9 shows the vibration response data and natural frequency data, while Table 5 lists the modal test results.

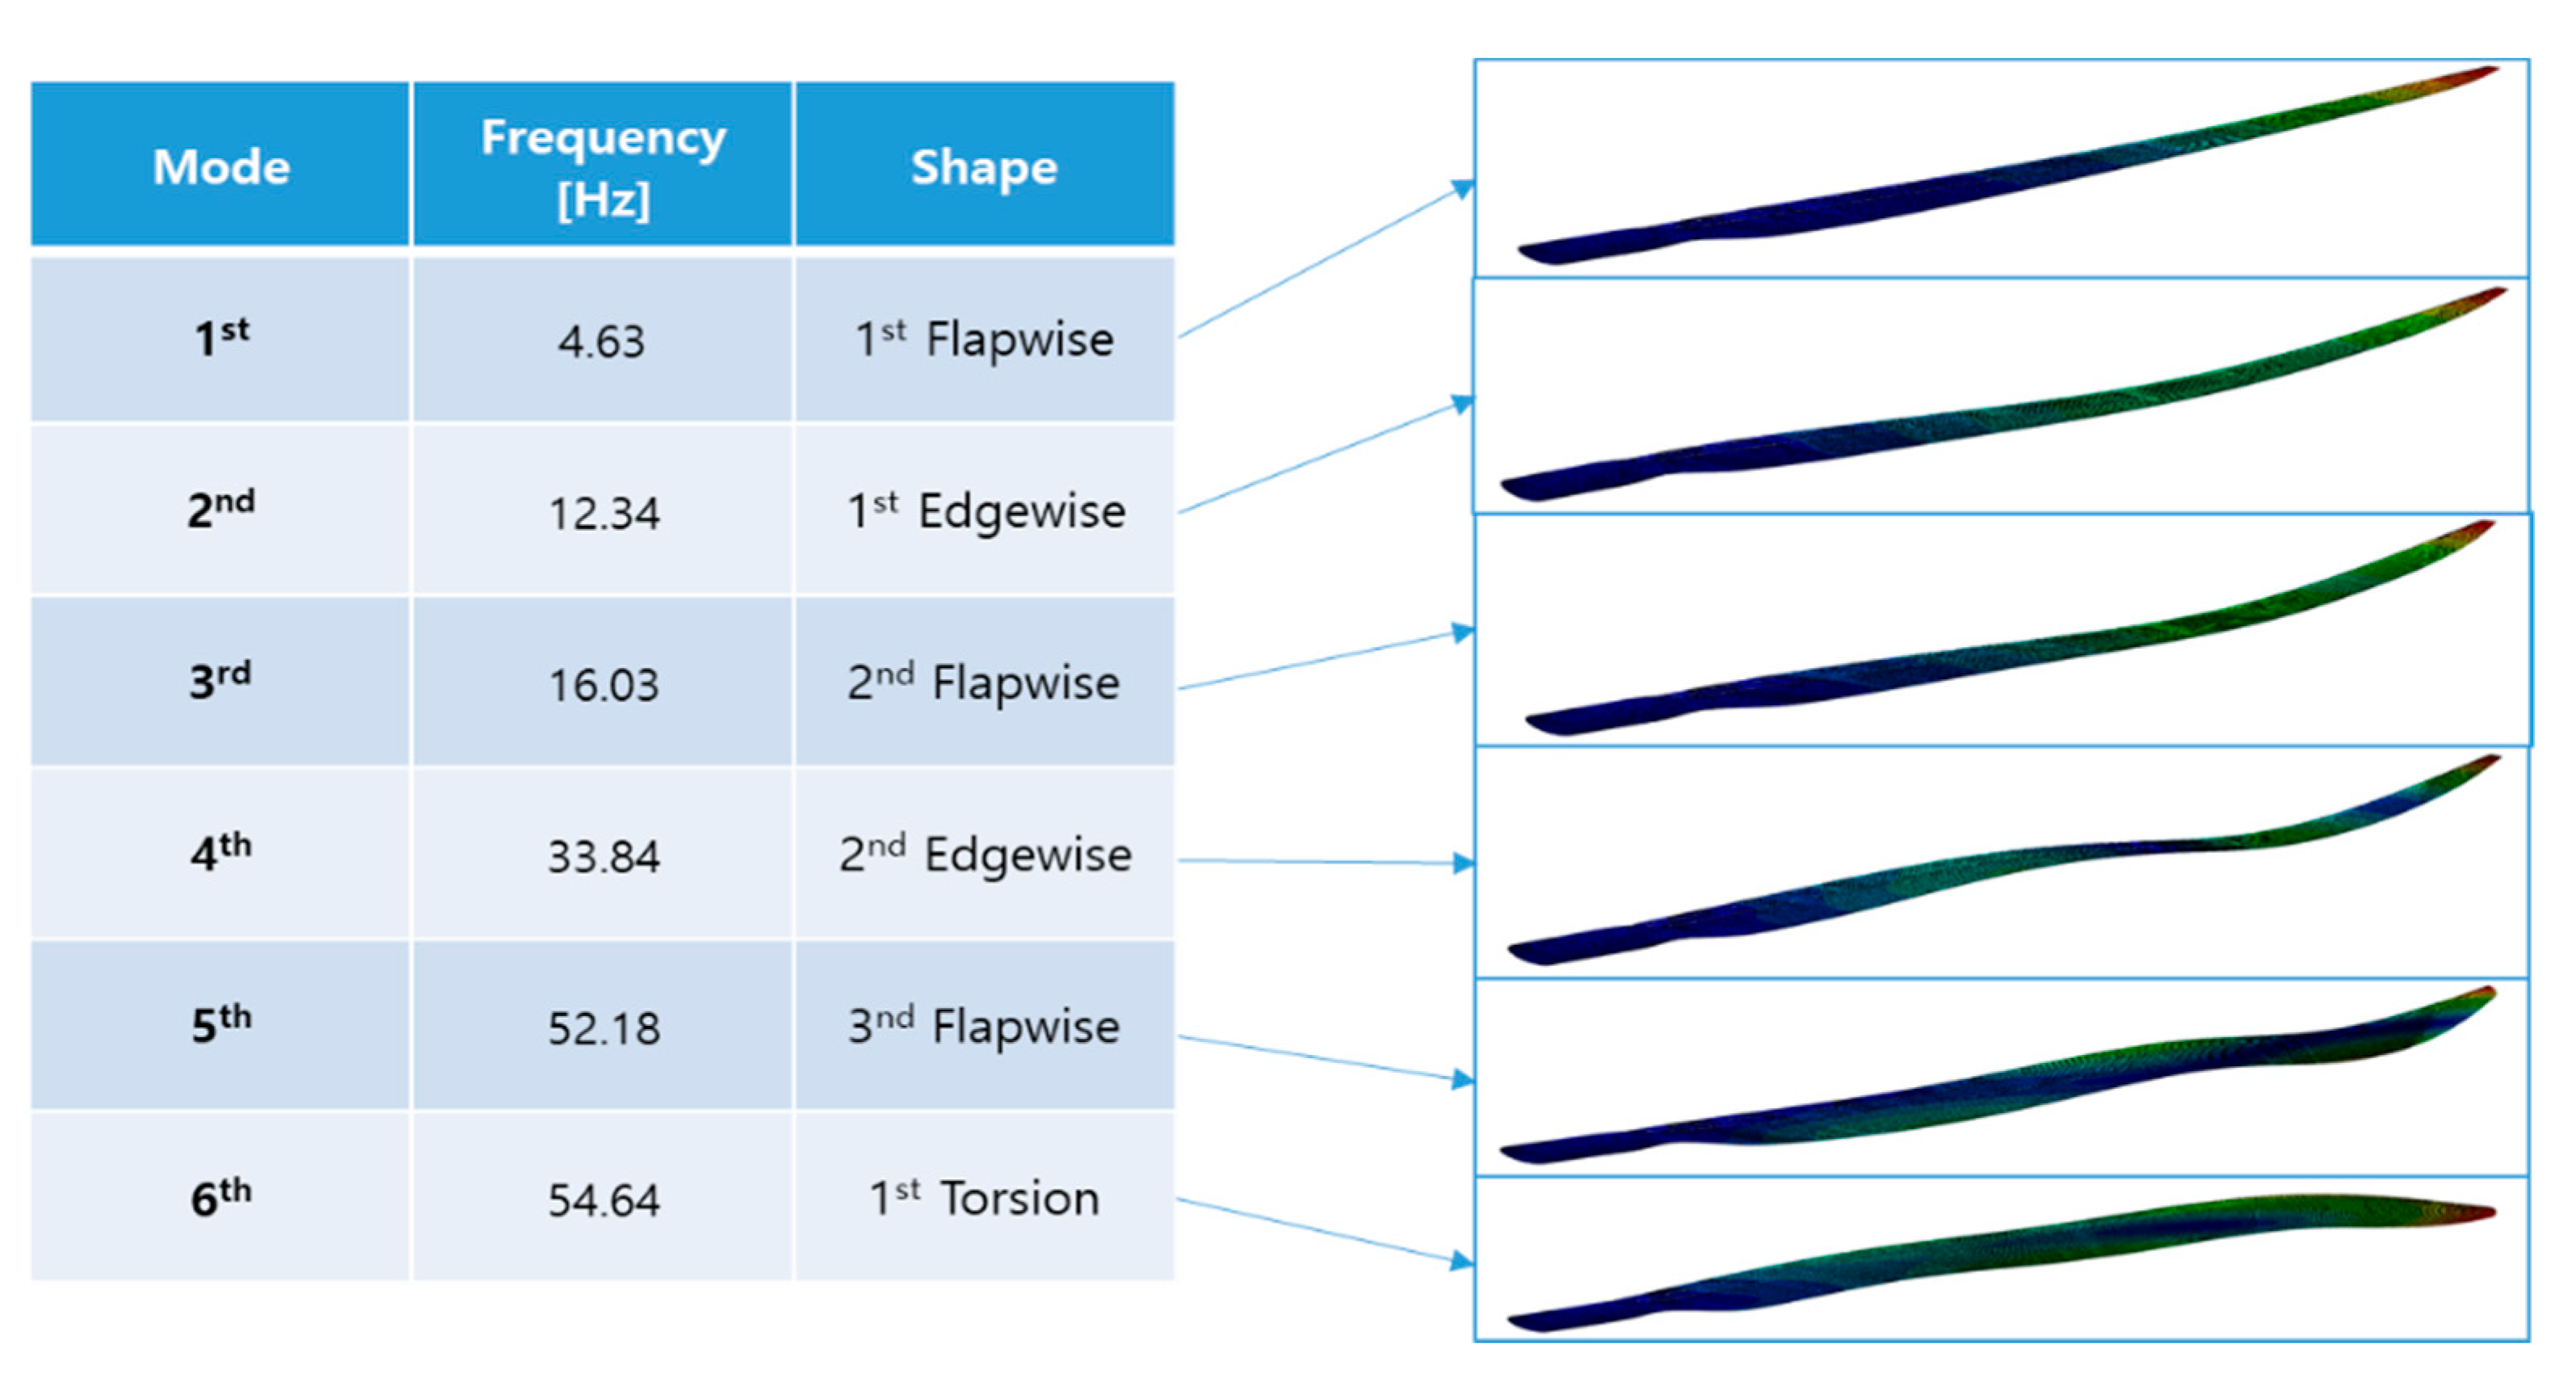
4.2. Natural Frequency Analysis

The blade model was synchronized so that the error from the results in Table 5 could be less than 5%. A modal analysis of 7132 blade damage models was then conducted using the method described in Section 2.2. Figure 10 shows the first to sixth natural frequency results of the blade without damage and the corresponding behavior.

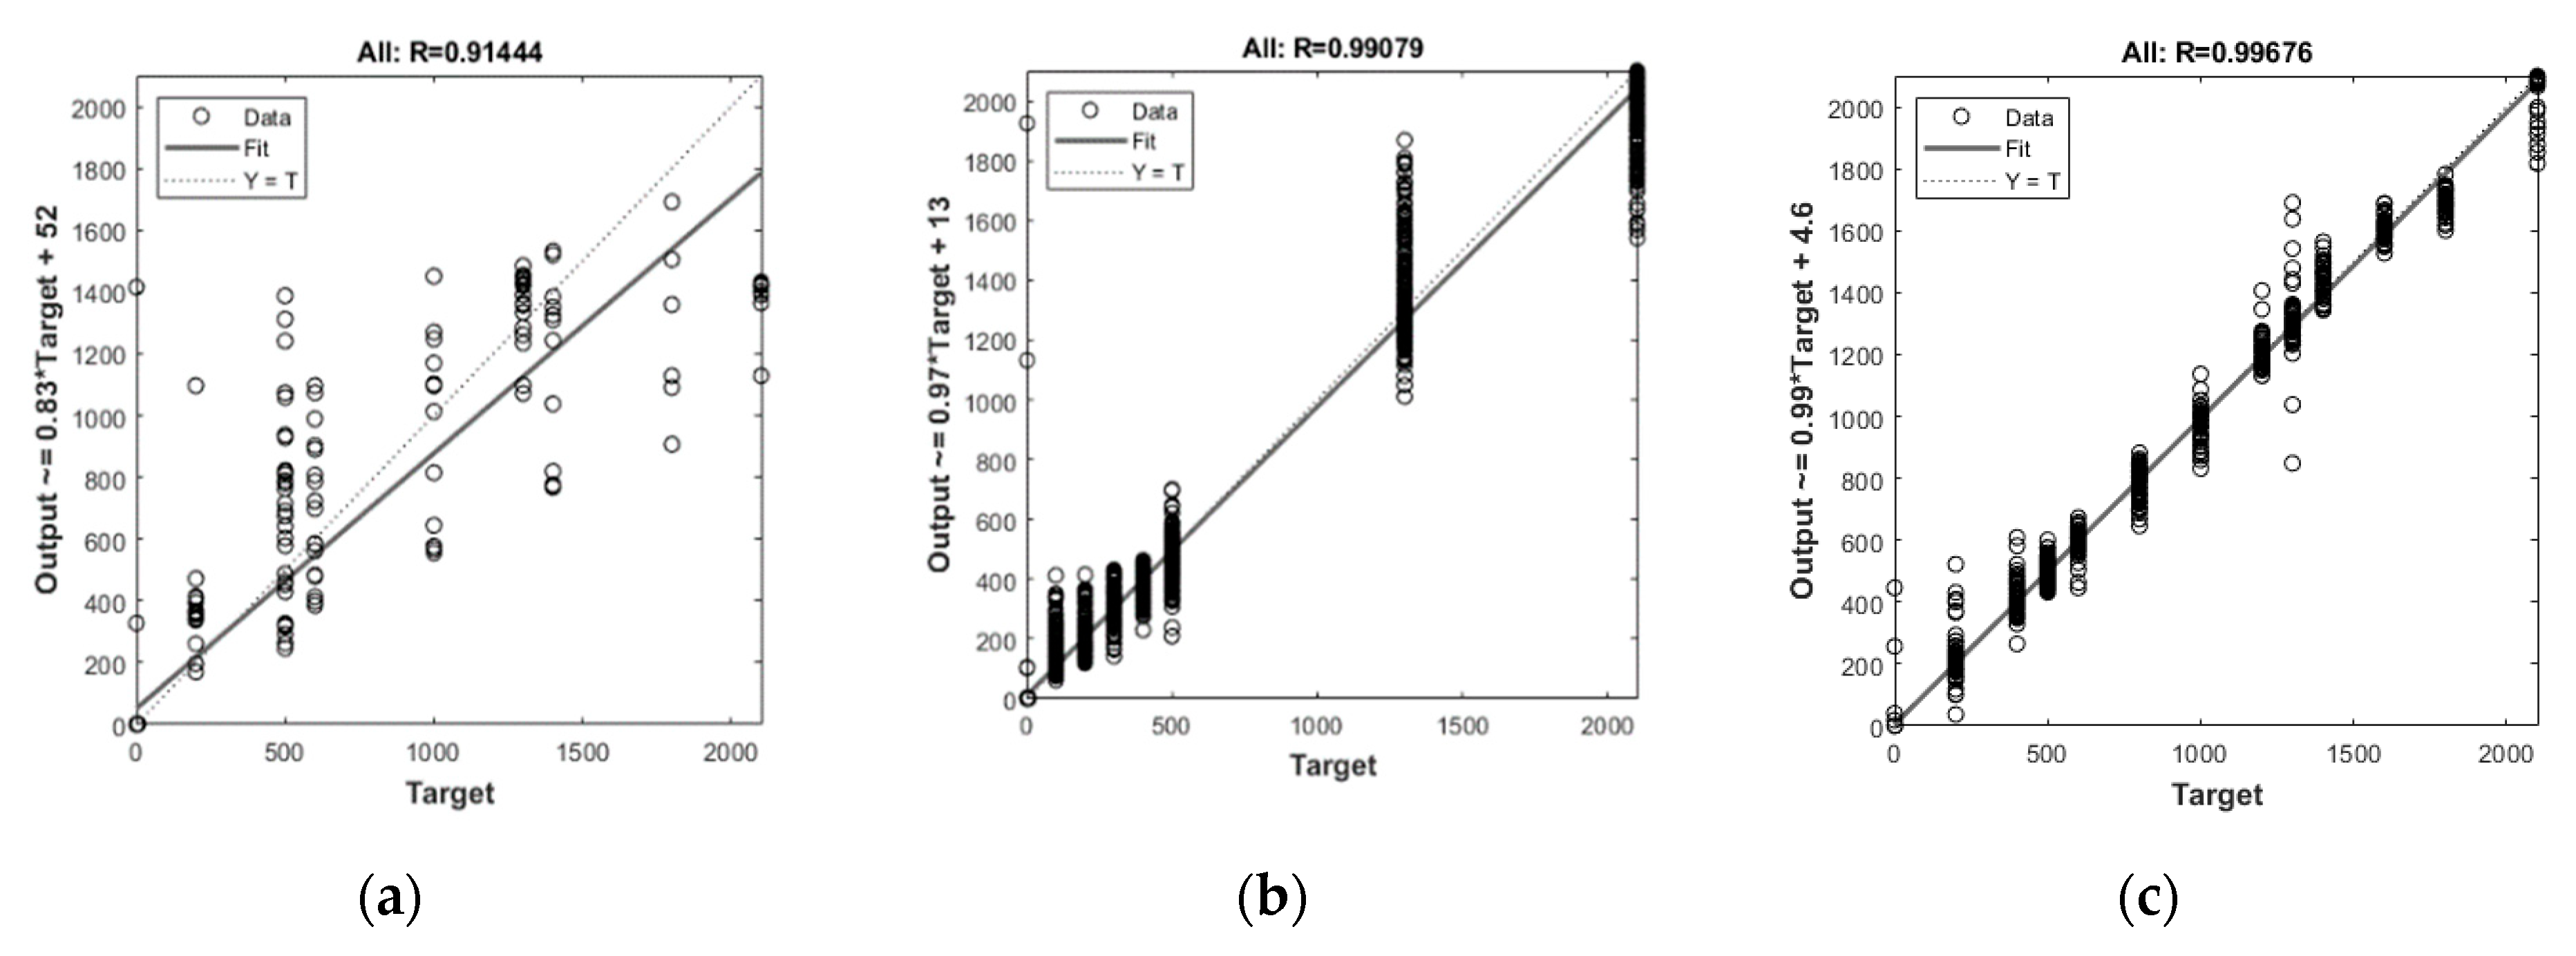
4.3. Damage Prediction Model Results

Prediction accuracy was examined for the debonding damage prediction model using the ANN technique and based on the natural frequency data acquired through modal analysis, as shown in Figure 11. The input data were the first to sixth natural frequency data, and the target data were set to predict joints subjected to the debonding damage, damage start position, and damage size. Table 6 and Table 7 list information on the input and target data. The number of hidden layers was set to two considering the forms and numbers of the input and target data, as well as the learning time. Each hidden layer contained 100 neurons. Figure 12 shows the damage prediction results by type. The x-axis represents the target damage information to be predicted, while the y-axis indicates the damage information predicted through machine learning. As shown in Figure 12a, the damage prediction accuracy of type 1 was found to be 97%, whereas the damage size from 200 to 1800 mm was not completely distinguished. Figure 12b shows that the damage prediction accuracy of type 2 was 86%. Unlike type 1, 1800 mm damage was predicted even though the maximum damage size was set to 500 mm. Finally, as shown in Figure 12c, the damage prediction accuracy of type 3 was 86%, and it was found that the damage size was not completely predicted owing to the large difference from the diagonal values obtained using a regression equation caused by complex changes in the natural frequency depending on the damage.

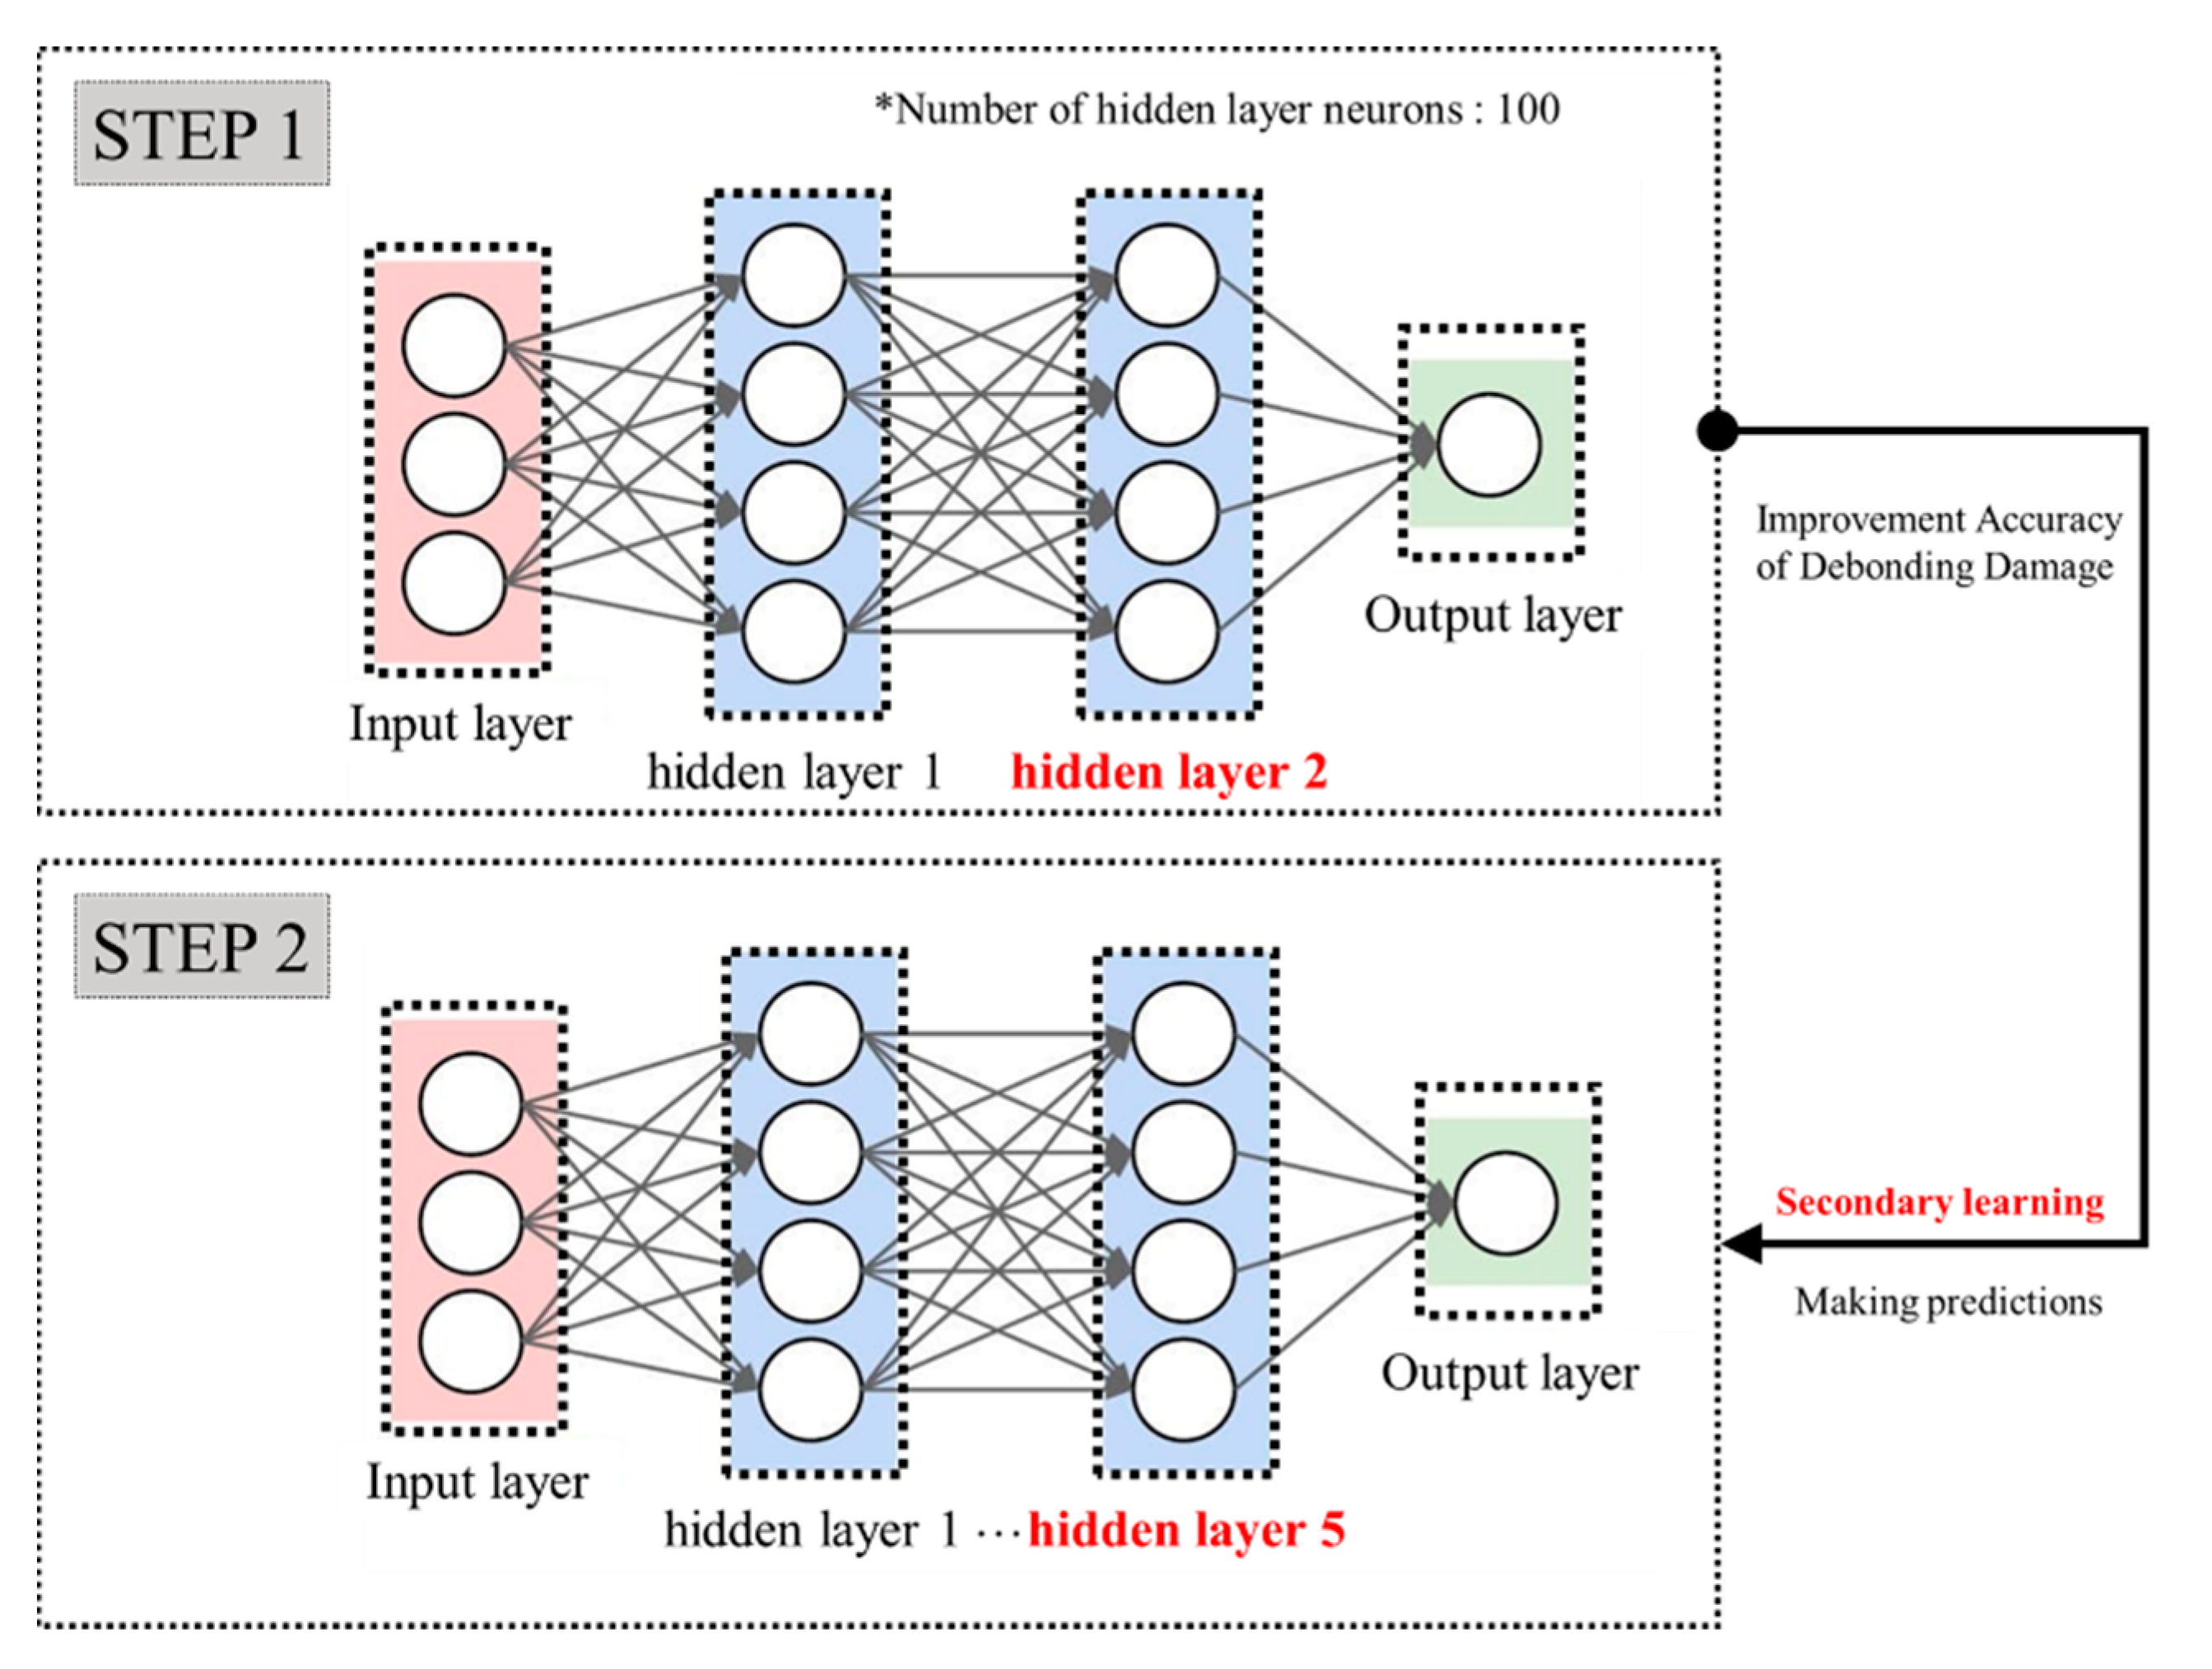
4.4. Learning Model Improvement for Higher Accuracy

To supplement the results that failed to accurately predict damage information from the complex changes in the natural frequency caused by changes in the damage factors, a secondary learning model was established. This model was established by raising the weight of the first to third natural frequencies, which exhibited larger changes in the event of debonding damage, and increasing the number of hidden layers to five for more complex forms of data prediction despite the increased learning time. The prediction accuracy of the model was examined. As shown in Figure 13a, the damage prediction accuracy of type 1 was found to be 91%, and damage size from 200 to 1800 mm was predicted, unlike the prediction results before the improvement. As shown in Figure 13b, type 2 damage prediction accuracy was improved to 99%, and the damage start position and damage size were predicted within the selected range. Finally, Figure 13c shows that the damage prediction accuracy of type 3 was improved to 99%, and predictions were performed within the selected range. For all the types, the damage prediction results were distributed according to the damage selection criteria and compared to the results before the improvement. These results confirmed the accuracy improvement of the debonding damage prediction model based on the natural frequency of composite blades.

4.5. Composite Blade Damage Detection Performance Verification

To verify the performance of the improved algorithm, the natural frequency data of the blades with debonding damage were measured, and the ability of machine learning to obtain debonding damage information was examined. Figure 14 shows the damage detection accuracy of the manufactured blades. The damage prediction accuracy was found to be 67%, but no damage prediction tendency was observed. This appears to be because there was a difference between the damage prediction algorithm based on the modal analysis results and the damage characteristics of the manufactured blades. To address this problem, the algorithm was improved by examining the detailed damage information of the manufactured blades and performing further training with 1000 sets of similar damage characteristics. Figure 15 shows the accuracy of the improved algorithm based on the manufactured blade data. The damage prediction accuracy was found to be 86%, and a damage prediction tendency was observed, unlike in the initial model. This indicates that the damage prediction algorithm for composite blades requires the development of a learning model using a dataset based on the FEA of the target blade and the improvement of learning using a dataset based on the actual environment.

5. Conclusions

In this study, the accuracy of a damage prediction algorithm was analyzed by acquiring data on the change in the natural frequency caused by debonding damage to the inside of composite blades, and the following results were obtained:
(1)
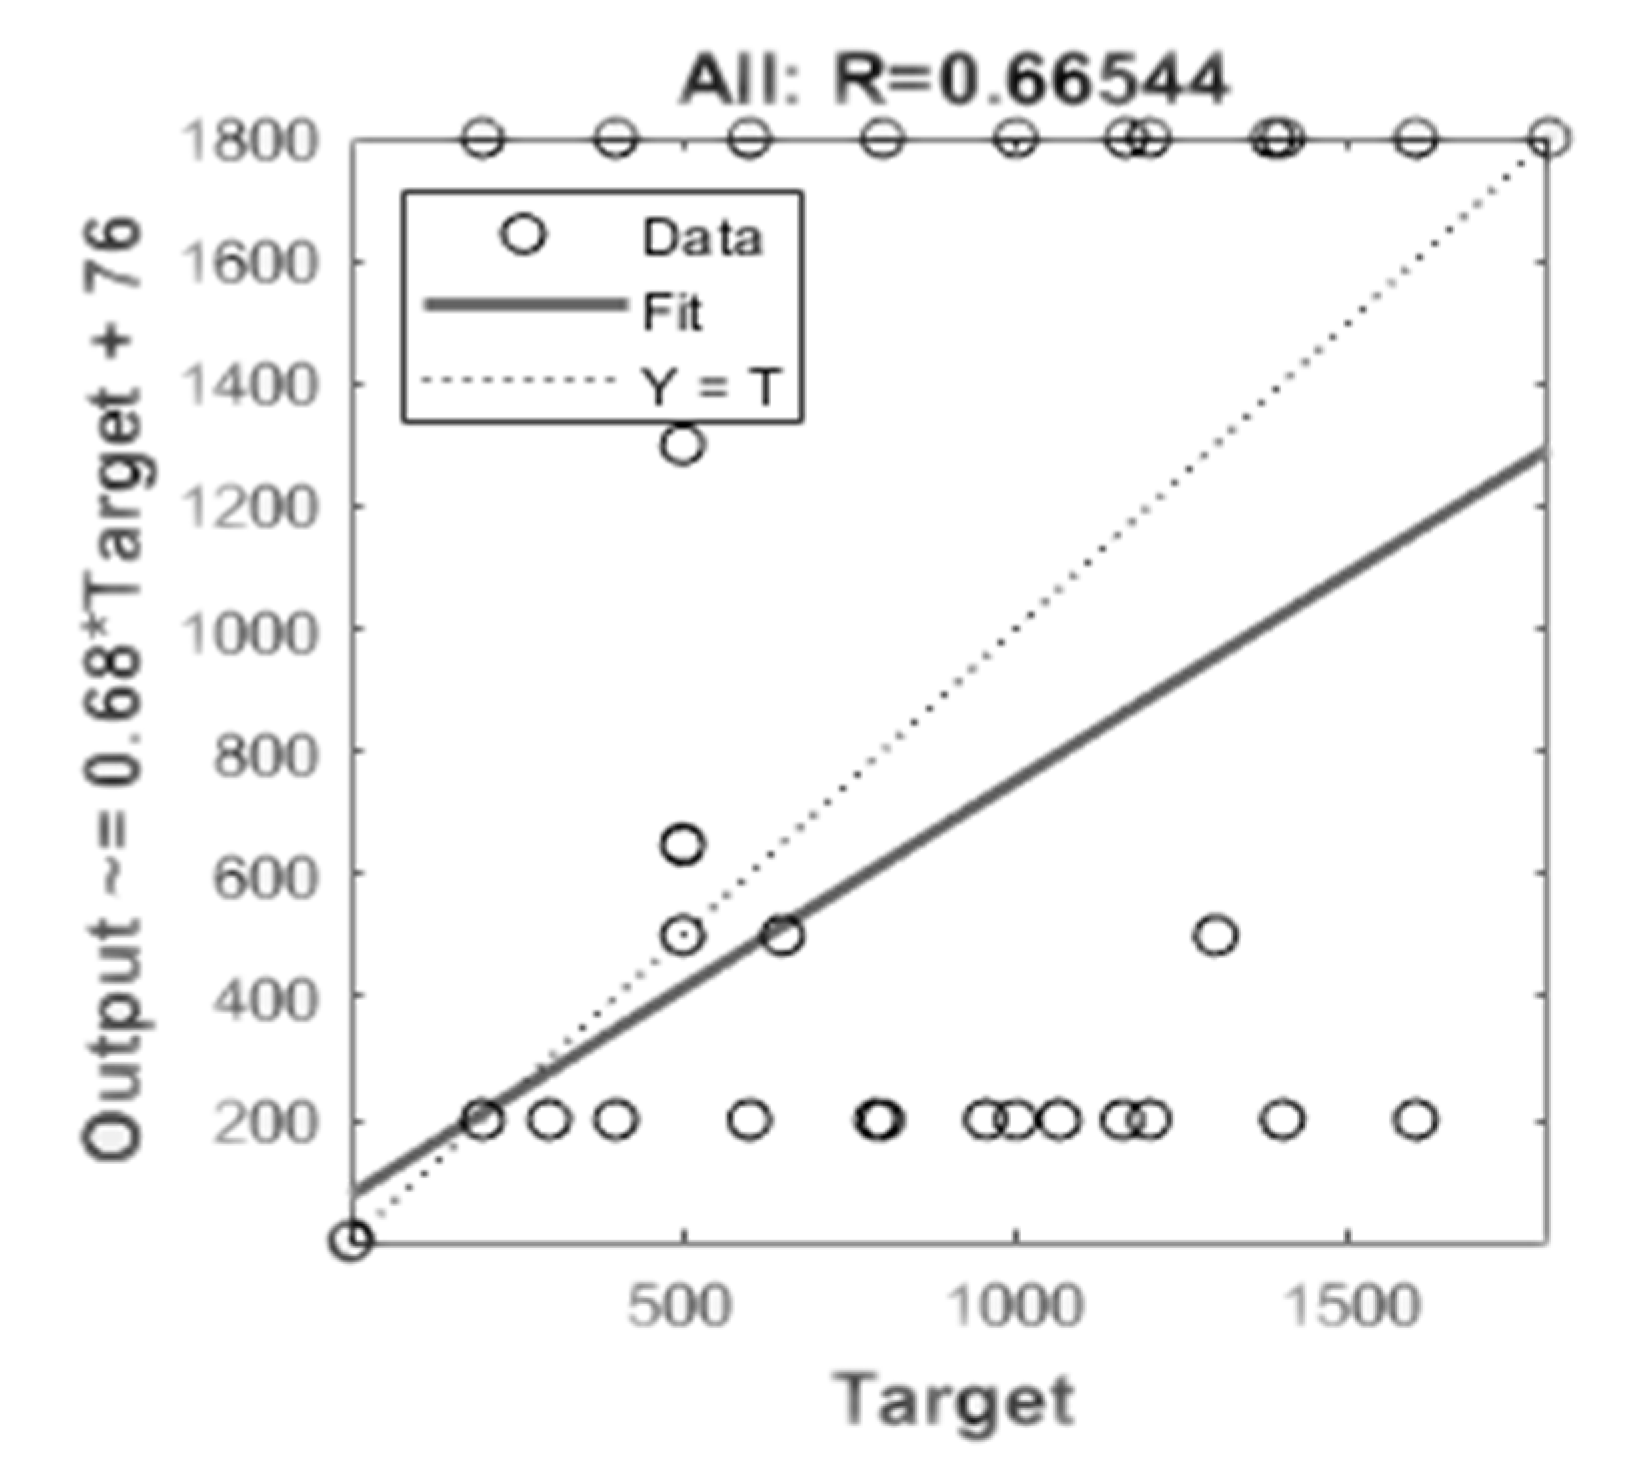
Initially, the prediction accuracy was confirmed for each type of debonding damage, and the prediction result was reviewed with a damage detection accuracy of 67%, but a damage prediction trend did not appear.
(2)
It was found that there was a difference between the damage prediction algorithm based on the results of the modal analysis of the FEM and the damage characteristics of the actual manufactured blade.
(3)
For the initial model, we reviewed algorithms that improved damage estimation accuracy through the addition and segmentation of hidden layers for the type of debonding damage.
(4)
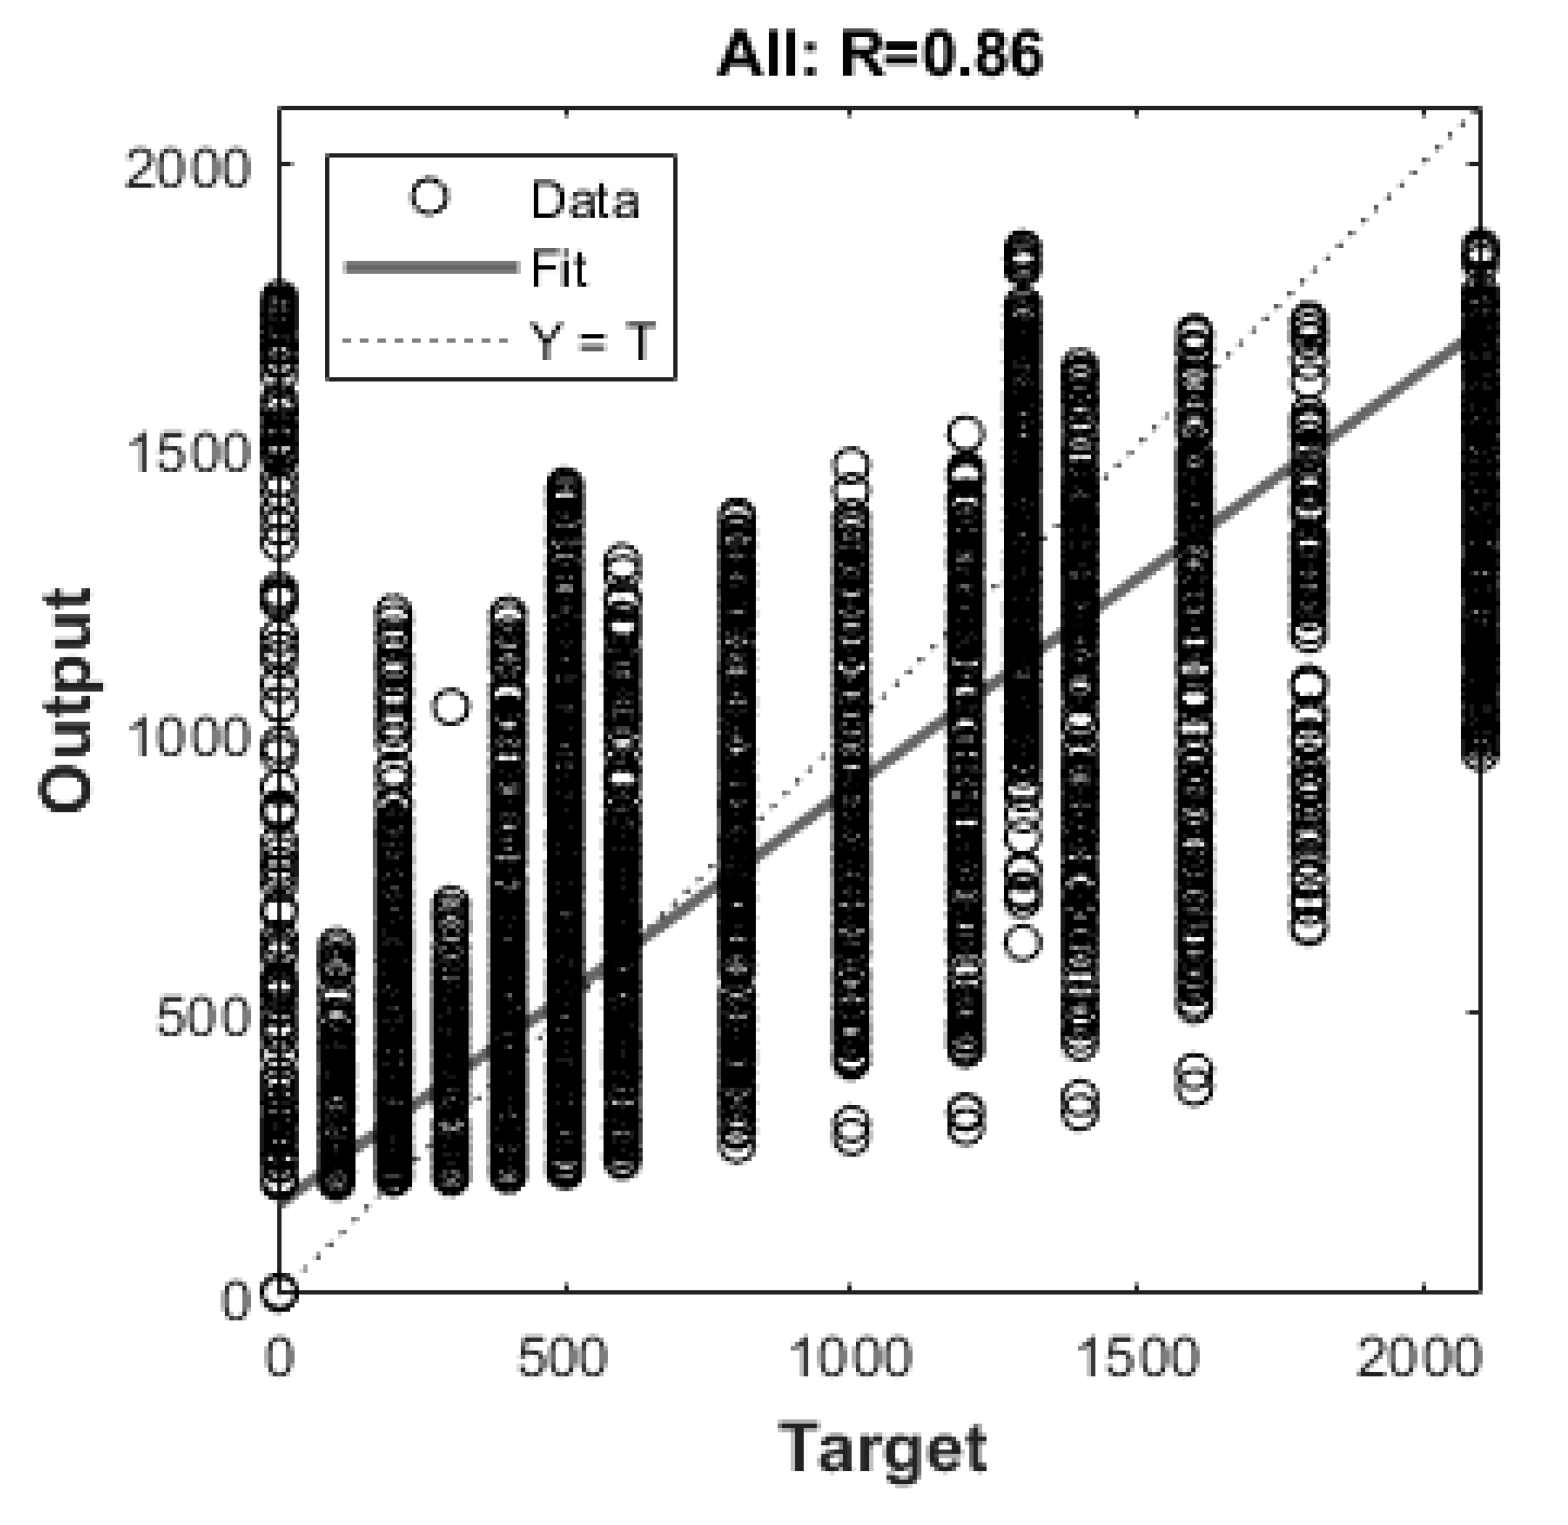
We improved the learning model to reflect complex damage factor characteristics by training it with 1000 additional training data, improving its prediction accuracy according to damage classification to 86%.
(5)
In order to apply the damage prediction algorithm in the operation stage, it was judged that it is necessary to increase the accuracy of the algorithm through field data and periodic measurement data.
(6)
In the future, research is needed to improve the accuracy of machine learning algorithms and verify practical effectiveness through securing detailed damage information and unique frequency data.

Author Contributions

Conceptualization, H.K. (Hakgeun Kim); validation, H.K. (Hyeonjin Kim); project administration, K.K. All authors have read and agreed to the published version of the manuscript.

Funding

This work was partly supported by Korea Institute of Energy Technology Evaluation and Planning (KETEP) grant funded by the Korea government (MOTIE) (20224000000040, 20213030020120).

Data Availability Statement

The original contributions presented in the study are included in the article, further inquiries can be directed to the corresponding author.

Conflicts of Interest

The authors declare no conflicts of interest.

References

  1. Kim, H.-K.; Kim, T.-S.; Lee, J.-H.; Moon, B.-Y.; Kang, K.-W. Full Scale Structural Testing of Small Wind Turbine Composite Blade. Trans. Korean Soc. Mech. Eng. A 2011, 35, 1407–1413. [Google Scholar] [CrossRef]
  2. Park, S.-H.; Han, K.-S. Structural Analysis and Proof Test of Composite Rotor Blades for Wind Turbine. New Renew. Energy 2008, 4, 45–50. [Google Scholar]
  3. Lee, C.-H.; Park, J.-M.; Kim, T.-W.; Park, J.-S. Structural design and analysis of a composite wind turbine blade. J. Korean Soc. Manuf. Technol. Eng. 2010, 19. Available online: https://www.researchgate.net/publication/263627649_Structural_Design_and_Analysis_for_Small_Wind_Turbine_Blade (accessed on 13 May 2024).
  4. Yun, D.; Lim, H.-C. Study of the Damage Monitoring System on Wind Turbine Blades. In Proceedings of the 2013 World Congress on Advances in Structural Engineering and Mechanics (ASEM13), Jeju, Republic of Korea, 8–12 September 2013; pp. 3549–3565. [Google Scholar]
  5. Karić, D. Increasing Wind Turbine Efficiency Using Software Packages. Adv. Eng. Lett. 2022, 1, 35–39. [Google Scholar] [CrossRef]
  6. Ciang, C.C.; Lee, J.-R.; Bang, H.-J. Structural health monitoring for a wind turbine system: A review of damage detection methods. Mead. Sci. Technol. 2008, 19, 20. [Google Scholar] [CrossRef]
  7. Rafiee, R.; Hashemi-Taheri, M.R. Failure analysis of a composite wind turbine blade at the adhesive joint of the trailing edge. Eng. Fail. Anal. 2021, 121, 105148. [Google Scholar] [CrossRef]
  8. Yang, J.; Peng, C.; Xiao, J.; Zeng, J.; Xing, S.; Jing, J.; Deng, H. Structural investigation of composite wind turbine blade considering structural collapse in full-scale static tests. Compos. Struct. 2013, 97, 15–29. [Google Scholar] [CrossRef]
  9. Kang, B.W.; Nam, M.H.; Lim, I.S. A Study on Reliability Validation by Infrared Thermography of Composite Material Blade for Wind Turbine Generator. J. Appl. Reliab. 2016, 14, 176–181. [Google Scholar]
  10. Xiao, C. Fractographic analysis of sandwich panels in a composite wind turbine blade using optical microscopy and X-ray computed tomography. Eng. Fail. Anal. 2020, 111, 104475. [Google Scholar]
  11. Christopher, N.; Peter, A.; Julie, C. Inspection and monitoring of wind turbine blade-embedded wave defects during fatigue testing. Struct. Health Monit. 2014, 13, 629–643. [Google Scholar]
  12. Chi, S.C.; Cho, B.J.; Nam, M.H.; Lim, S. Delamination Detection in Composite Wind Blade by Phased Array Ultrasonic Technology. J. Korean Soc. Nondestruc. Test. 2017, 37, 183–191. [Google Scholar] [CrossRef]
  13. Du, Y.; Zhou, S.; Jing, X.; Peng, Y.; Wu, H.; Kwok, N. Damage Detection Techniques for Wind Turbine Blades: A Review. Mech. Syst. Signal Process. 2020, 141, 106445. [Google Scholar] [CrossRef]
  14. Kim, B.J.; Cheon, S.P.; Kang, S.J. Motion Estimation and Machine Learning-based Wind Turbine Monitoring System. Trans. Korean Inst. Electr. Eng. 2017, 66, 1516–1522. [Google Scholar]
  15. Kim, H.-G.; Kim, H.; Kang, K. Evaluation of Frequency Response Characteristics according to the Debonding Damage of Composite Blade for Wind Turbine. Master’s Thesis, Graduate School of Kunsan National University, Gunsan-si, Republic of Korea, 2018. [Google Scholar]
  16. Joshuva, A.; Sugumaran, V. A Lazy Learning Approach for Condition Monitoring of Wind Turbine Blade using Vibration Signals and Histogram Features. Measurement 2021, 152, 107295. [Google Scholar] [CrossRef]
  17. Awadallah, M.; El-Sinawi, A. Effect and Detection of Cracks on Small Wind Turbine Blade Vibration using Special Kriging Analysis of Spectral Shifts. Measurement 2020, 151, 107076. [Google Scholar] [CrossRef]
  18. Kim, J.-S.; Choi, C.-K.; Yoo, H.-H. Application of Excitation Moment for Enhancing Fault Diagnosis Probability of Rotating Blade. Trans. Korean Soc. Mech. Eng. A 2014, 38, 205–210. [Google Scholar] [CrossRef]
  19. Stetco, A.; Dinmohammadi, F.; Zhao, X.; Robu, V.; Flynn, D.; Barnes, M.; Keane, J.; Nenadic, G. Machine learning methods for wind turbine condition monitoring: A review. Renew. Energy 2019, 133, 620–635. [Google Scholar] [CrossRef]
  20. Jang, Y.-J.; Kim, H.-J.; Kim, H.-G.; Kang, K.-W. Identification of Debonding Damage at Spar Cap-Shear Web Joints by Artificial Neural Network Using Natural Frequency Relevant Key Features of Composite Wind Turbine Blades. Appl. Sci. 2021, 11, 5327. [Google Scholar] [CrossRef]
  21. ABAQUS CAE 2022; Dassault Systems Simulia, Inc.: Johnston, RI, USA, 2022.
  22. MATLAB 2020a; MathWorks, Inc.: Natick, MA, USA, 2020.
  23. Kang, S.-K.; Park, S.-S.; Lee, S.-I.; Lee, J.-H. An Analysis of the Drag Effect on the Thrust and Rotational Torque of Wind Turbine Blades with Original Airfoil KA2. J. Wind. Energy 2021, 12, 19–25. [Google Scholar]
  24. Regan, T.; Beale, C.; Inalpolat, M. Wind turbine blade damage detection using supervised machine learning algorithms. J. Vibr. Acoust.-Trans. ASME 2017, 139, 061010. [Google Scholar] [CrossRef]
Figure 1. Modeling method of wind turbine blade.
Make 06 00091 g001
Figure 2. Analysis process of damage prediction for wind turbine blade.
Make 06 00091 g002
Figure 3. Location of damages on blade cross section.
Make 06 00091 g003
Figure 4. Blade damage type.
Make 06 00091 g004
Figure 5. Damage selection criteria by type.
Make 06 00091 g005
Figure 6. Schematic diagram of modal test.
Make 06 00091 g006
Figure 7. Position of PRT sensor and high-speed camera.
Make 06 00091 g007
Figure 8. Modal test of composite blade.
Make 06 00091 g008
Figure 9. Vibration response data using (a) PRT sensor and (b) high-speed camera.
Make 06 00091 g009
Figure 10. Results of modal analysis of the blade and its motion.
Make 06 00091 g010
Figure 11. Damage prediction accuracy method based on the ANN.
Make 06 00091 g011
Figure 12. Damage prediction accuracy by type. (a) Type 1 (97%). (b) Type 2 (86%). (c) Type 3 (86%).
Make 06 00091 g012
Figure 13. Damage prediction accuracy by type through learning model improvement. (a) Type 1 (91%). (b) Type 2 (99%). (c) Type 3 (99%).
Make 06 00091 g013
Figure 14. Damage prediction accuracy of manufactured blades.
Make 06 00091 g014
Figure 15. Accuracy improvement of damage prediction model.
Make 06 00091 g015
Table 1. Specification of wind turbine blade.
Rated power20 kW
Cut-in wind speed3 m/s
Rated wind speed11 m/s
Cut-out wind speed24 m/s
Number of blades3
Blade length4.95 m
Inertia location to root2 m
Number of shear web2
Table 2. Conditions and datasets for blade FEM.
Number of nodes41,736Total number of data sets7132
Number of elements40,153Number of training data4992
Natural frequency order6Number of testing data1070
Bonding contact methodMPCsNumber of validation data1070
Table 3. Blade specifications.
PropertiesGFRP
(Glass-Fiber-Reinforced Plastic)
CFRP
(Carbon-Fiber-Reinforced Plastic)
Uni-Directional [0°]Two-Axial
[±45°]
Tri-Axial
[0°, ±45°]
UD
Long. Elastic modulus [GPa]40,10012,00030,500133,000
Trans. Elastic modulus [GPa]12,30012,00015,1009000
Shear modulus [GPa]340011,00071004400
Long. Poisson’s ratio 0.260.550.430.34
Layer thickness [mm]0.910.590.910.1
Table 4. Sensor specifications.
PropertiesPRT SensorHigh-Speed CameraData Logger
ModelILD 1700-100Photron Fastcam MiniGTDL-360
Maximum measurement rate [Hz]100 kHz2 kHz1 kHz
Table 5. Modal test results.
ModeFrequency (PRT) [Hz]Frequency (Camera) [Hz]
14.814.82
211.7611.76
316.4116.40
432.9132.9
550.5350.5
656.356.28
Table 6. Input data.
Input
data
Natural frequency (Hz)
No.1st2nd3rd4th5th6th
14.6312.3416.0333.8452.1854.64
24.571215.8433.5852.0654.33
34.5411.9515.7833.455254.16
44.5311.9315.7733.3351.9454.09
71294.6312.3115.9833.7451.6554.43
71304.6212.3015.9633.7351.5454.42
71314.6212.2815.9333.6751.3954.42
71324.6212.2715.9033.5351.0954.33
Table 7. Target data.
Target
data
No.joint 1location 1
(mm)
length 1
(mm)
joint 2location 2
(mm)
length 2
(mm)
1000000
21500200000
31500600000
415001000000
71295210080062100200
71305210080062100400
71315210080062100600
71325210080062100800
Disclaimer/Publisher’s Note: The statements, opinions and data contained in all publications are solely those of the individual author(s) and contributor(s) and not of MDPI and/or the editor(s). MDPI and/or the editor(s) disclaim responsibility for any injury to people or property resulting from any ideas, methods, instructions or products referred to in the content.

