Abstract
Previous reviews have investigated machine learning (ML) models used to predict the risk of developing preeclampsia. However, they have not addressed the intended deployment of these models throughout pregnancy, nor have they detailed feature performance. This study aims to provide an overview of existing ML models and their intended deployment patterns and performance, along with identified features of high importance. This review followed the Preferred Reporting Items for Systematic Reviews and Meta-Analyses (PRISMA) 2020 guidelines. The search was performed in January and February 2024. It included all papers published before March 2024 obtained from the scientific databases: PubMed, Engineering Village, the Association for Computing Machinery, Scopus, and Web of Science. Of a total of 198 identified studies, 18 met the inclusion criteria. Among these, 11 showed the intent to use the ML model as a single-use tool, two intended a dual-use, and two intended multiple-use. Ten studies listed the features of the highest importance, with systolic and diastolic blood pressure, mean arterial pressure, and hypertension frequently mentioned as critical predictors. Notably, three of the four studies proposing dual or multiple-use models were conducted in 2023 and 2024, while the remaining study is from 2009. No single ML model emerged as superior across the subgroups of PE. Incorporating body mass index alongside hypertension and either mean arterial pressure, diastolic blood pressure, or systolic blood pressure as features may enhance performance. The deployment patterns mainly focused on single use during gestational weeks 11+0 to 14+1.
1. Introduction
Preeclampsia (PE) is a pregnancy-related disorder that affects 2–8% of all pregnancies worldwide, contributing to severe morbidity for both the women and the baby. Together with eclampsia, it is responsible for 10–15% of maternal deaths in low- and middle-income countries [1]. When diagnosed, the only cure is delivery of the baby and placenta [2]. In women with an increased risk of PE, early administration of aspirin has shown promise in reducing preterm PE (onset before gestational week 37) by up to 62% when the treatment is initiated before gestational week 16 [3]. Consequently, there is considerable interest in risk assessment of PE before week 16 of gestation to minimize the incidence of preterm PE and thereby the severe morbidity and mortality rates.
The Fetal Medicine Foundation (FMF) has developed a competing risk model for PE [4], which is widespread as a decision support tool for first-trimester screening for PE [2,5]. The competing risk model combines maternal factors, mean arterial pressure (MAP), pulsatility index of the blood flow in the uterine arteries (UtA-PI), placental growth factor (PlGF), and pregnancy-associated plasma protein A (PAPP-A) [4]. While typically used as a one-step model, FMF can also be used as a two-step model. The first step involves maternal factors and MAP with a 50% screen-positive rate (SPR), followed by the second step involving UtA-PI and PlGF. Completing the first-trimester screening in two steps with 50% of the pregnant population included in the second step yielded comparable results [6]. This approach reduces the number of women in need of UtA-PI and PlGF measurements. Given the need to measure UtA-PI and PlGF, specialized equipment and specially trained healthcare professionals are required [6]. Reducing the number of pregnant women in need of UtA-PI and PlGF measurements will reduce the expenses associated with the prediction of PE, which will be beneficial to low- and middle-income countries.
A further development is to investigate the use of machine learning (ML), given its increasing utilization in healthcare, including obstetrics [7]. As highlighted in recent reviews conducted by Hackelöer et al. and Ranjbar et al., the use of ML has been investigated in relation to the prediction of PE risk [5,7]. Multiple models have been tested along with different feature selections, where the features of maternal factors (ethnicity, age, obstetric history, hypertension, family history, diabetes, systemic lupus erythematosus, antiphospholipid syndrome, conception method, and body mass index (BMI) or weight and height), PAPP-A, PlGF, and UtA-PI are emerging as the standardized feature set that researchers develop upon [8]. Bertini et al.’s review identified the features with important value in risk assessment of PE listed among their included studies, though only one study’s features were mentioned [9].
To our knowledge, existing reviews have not explored how the existing ML models are intended to be deployed during pregnancy. Furthermore, no reviews investigated whether the ML models are intended to be of single use or multiple use. The features identified by the ML models to be of important predictive value in the PE risk assessment have likewise not been detected in more than one systematic review by Bertini et al.
This review aims to address these gaps by investigating the existing ML models of PE risk assessment and their intended deployment pattern and performance. In this context, the review wants to clarify if the ML models were intended to be deployed as single use, dual use, or multiple use during pregnancy, as this will provide insight into personalized healthcare. Additionally, identify if any studies have investigated reusing their ML model in the PE risk assessment later in the pregnancy in order to minimize the false positive. Additionally, this review seeks to provide an overview of which features included in the ML models have proven to be of high predictive importance to that exact model.
The review questions:
- Which ML models have been included in the prediction of PE?
- Which ML model demonstrates the highest predictive capability?
- Which features are integrated into the individual ML models?
- Which features did the individual ML model identify to be of high predictive value?
- When are the individual ML models intended to be used during pregnancy?
- How frequently are the individual ML models intended to be deployed throughout pregnancy?
2. Materials and Methods
2.1. Study Design
This review adheres to the Preferred Reporting Items for Systematic Reviews and Meta-Analyses (PRISMA) 2020 guidelines [10].
2.2. Eligibility Criteria
Inclusion criteria encompassed records written in English, with full-text accessibility, and utilizing ML for PE risk assessment. Records unrelated to the topic, such as those focusing on pathology or postpartum applications of ML, were excluded. Similarly, records lacking ML testing, non-transparent feature selection for ML training, or using ML to detect the presence of PE were excluded. Records using extensive blood tests in predicting PE were excluded from this review based on the increased expenses associated with blood tests. Reviews were likewise excluded.
2.3. Search Strategy
A comprehensive search strategy was implemented using truncation and the Boolean operator “OR” to identify relevant articles utilizing a combination of MeSH and non-MeSH terms. The search was refined using the Boolean operator “AND” to focus on the review’s topic. The combination of search terms was as follows:
(pregn* OR obstetrics) AND (early OR surveillance OR monitor*) AND (detect* OR program OR predict* OR intervention OR screen*) AND (Artificial intelligence OR AI OR machine learning OR deep learning) AND (first trimester OR intelligent OR automat*) AND (preeclampsia [Title/Abstract])
The search was performed in January and February 2024 by two reviewers on five scientific databases: PubMed, Engineering Village, Association for Computing Machinery (ACM), Web of Science, and Scopus. The selection process is documented in a PRISMA flow diagram. No restrictions were imposed regarding the year of publication or country. Additionally, no filters or limits were used within the search databases regarding the eligibility criteria. The ACM database was set to search for records within “The ACM Guide to Computing Literature” to include as many records as possible.
2.4. Selection Process
The screening of identified records was conducted by two reviewers, who independently assessed relevant records based on headline and abstract content. Subsequently, a thorough eligibility screening was conducted, wherein the reviewers went through the full text to exclude records not meeting the predefined eligibility criteria and scope of this review. When facing disagreements about a record’s inclusion or exclusion, the reviewers discussed the record and its suitability for the scope of the review to obtain consensus.
2.5. Data Collection
Data extraction was carried out by two reviewers who worked independently at two separate organisations. Extracted data were listed using a customized form, which included the following categories:
- Study characteristics: Study type, year of publication, and country.
- Dataset and participant information: Type and quality of the dataset. Number of participants and the incidence of PE cases used for training, validation, and test sets in the ML models.
- Features: Variables used for training the ML model.
- ML models employed in the study.
- Best performance: Identifying the best-performing ML model and its prediction of PE subgroups. For those studies, where the prediction of PE has not been specified other than predicting PE, it has been denoted as predicting “All PE” within this review to compare across studies. The performance is evaluated using performance metrics (Area Under the Curve (AUC), Receiver Operating Characteristic (ROC), accuracy, average accuracy, sensitivity, recall, specificity, precision, F1-score, Brier score, negative prediction value (NPV), positive prediction value (PPV), kappa, Matthew’s correlation coefficient, G-mean, screen-positive rate (SPR), true positive (TP), true-positive rate (TPR), detection rate (DR), false detection rate (FDR), false-negative rate (FNR), false positive (FP), and false-positive rate (FPR)). Among the listed terms, sensitivity, recall, and TPR refer to the same metric value, describing the prediction of positive cases from all the positive cases within the dataset [11].
- Top predictive features: The five most important features identified by the individual ML model for predicting PE among its included features.
- The intended use of the ML model: Is either reported or interpreted from the study. Including the number of times the ML model is intended to be used and which gestational week within the pregnancy, if this has been denoted by the authors.
- ML deployment details: Patterns and strategies for deployment, configuration within deployment environments, ecosystems integration, monitoring, maintenance, security and protection of data, scalability, load balancing, resource management, versioning, and tracking ML models.
2.6. Risk of Bias
A standardized methodology for evaluating the risk of bias in the included studies and for addressing missing information was employed using the Prediction Model Risk Of Bias Assessment Tool (PROBAST), developed to evaluate studies concerning prediction models [12].
3. Results
The search strategy resulted in 198 records. A total of 32 records was included in the full-text eligibility screening after removing duplicates and screening titles and abstracts. As illustrated in Figure 1, a total of 18 studies met the inclusion criteria and were included in the review.
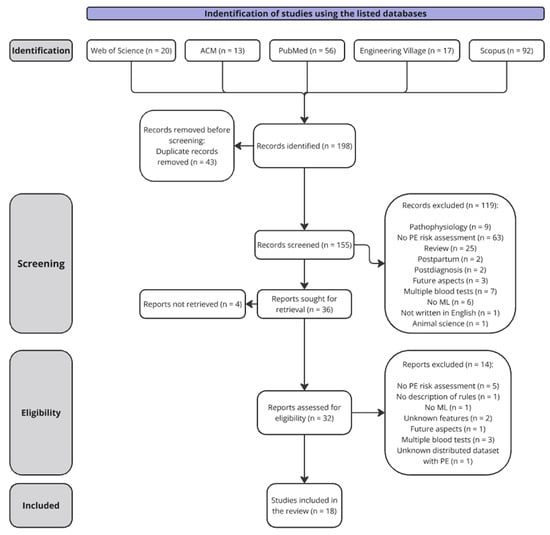
Figure 1.
Prisma flow diagram describing the data collection. Abbreviations used: Preeclampsia (PE) and machine learning (ML).
A summary of the extracted data from the included studies is presented in Table 1, followed by the PROBAST evaluation of the included studies risk of bias in Table 2.

Table 1.
This table summarizes the studies included in the review, detailing the study type, developed machine learning (ML) models, best performing model specified with Area Under the Curve (AUC) and recall on validation/test set, key features identified as highly important, and the intended deployment of the ML models with provided prediction time. The complete feature sets used for training the different ML models are provided in Appendix A. Information concerning the datasets used within the included studies are available in Appendix B. A comprehensive table listing all data extracted from the studies is available in the Supplementary Materials (Table S1). All performance metrics used within the studies and their performances are listed in the Supplementary Materials (Table S2). The following abbreviations were used: Random forest (RF), adaptive boosting classification trees (AdaBoost CT), neural networks (NN), support vector machines (SVM), stochastic gradient boosting (Stoch. GBoost), extreme gradient boost (XGBoost), K-nearest neighbors (KNN), decision tree (DT), cost-sensitive deep neural network with weighted cross-entropy (CSDNNWCE), cost-sensitive deep neural network focal loss (CSDNNFL), receiver operating characteristic curve (ROC), area under the receiver operating characteristic curve (AUC), false-positive rate (FPR), detection rate (DR), true-positive rate (TPR), screen-positive rate (SPR), false detection rate (FDR), false-negative rate (FNR), positive predictive value (PPV), negative predictive value (NPV), SHapley Additive exPlanations (SHAP), multiples of median (MoM), placental growth factor (PlGF), mean arterial pressure (MAP), uterine artery pulsatility index (UtA-PI), pregnancy-associated plasma protein A (PAPP-A), antiphospholipid syndrome (APS), blood pressure (BP), and body mass index (BMI). The color coding in the “Best performing ML model” column indicates performance levels across the included studies when compared on the AUC and recall: green for high performance (AUC: >0.85, recall: >80%), yellow for medium performance (AUC: 0.75–0.85, recall: 55–80%), and red for low performance (AUC: <0.75, recall: <55%).
Table 2.
Risk of bias assessment on the included studies using PROBAST. The evaluation is defined utilizing “+”, ”−“, “+/−“, and “?”, where “+” illustrates low risk, “−“ illustrates high risk, “+/−“ illustrates moderate risk, and “?” illustrates unclear risk.
The included studies did not report the same performance metrics. A complete list of all performance metrics used across the studies and their performances are listed in the Supplementary Materials (Table S2). Figure 2 provides an overview of the three most common parameters across the studies within a Venn Diagram.
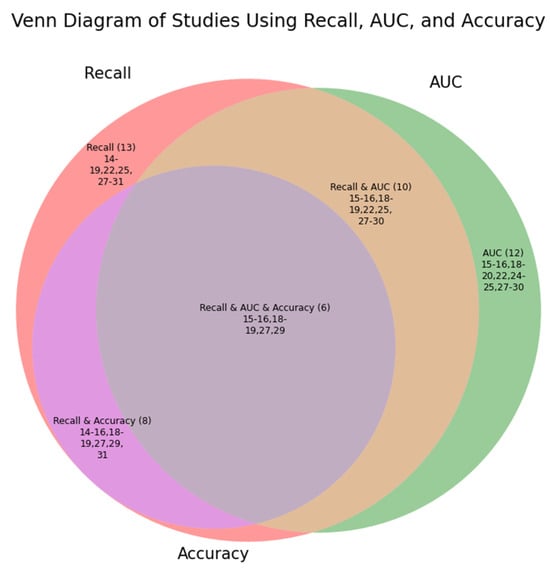
Figure 2.
Given that sensitivity, recall, and true positive rate refer to the same calculated value, these are merged within “Recall”. The three most common performance metrics used within the studies were recall, area under the curve (AUC), and accuracy. This Venn diagram illustrates the number of studies reporting the metric value in parentheses followed by which studies included the metric values using the reference.
Figure 3 illustrates the intended use of the ML models tested within the included studies. With Neocleous et al., Jhee et al., and Sufriyana et al. not specifying when the ML models were intended to be used, these were listed as “not reported”. The remaining studies’ ML models were categorized according to their deployment patterns: single-use, dual-use, or multiple-use prediction models. This classification was performed based on the information provided within the respective studies.
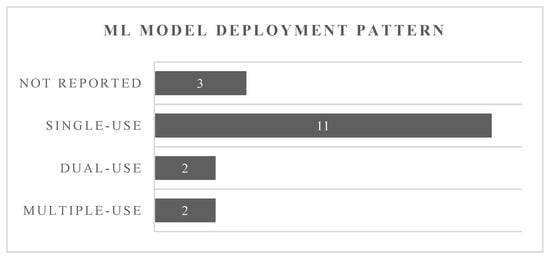
Figure 3.
Illustration of the intended use of the prediction models as given in the studies or interpreted by the reviewers.
Performance of Machine Learning Models
Figure 4 displays the ML models used within the included studies, whereas Figure 5 illustrates those that exhibited the highest performance within them. It is observed in Table 1 that certain ML models excelled in predicting different subgroups of PE, thus reflecting their best performances in Figure 4 across all included subgroups in the studies.
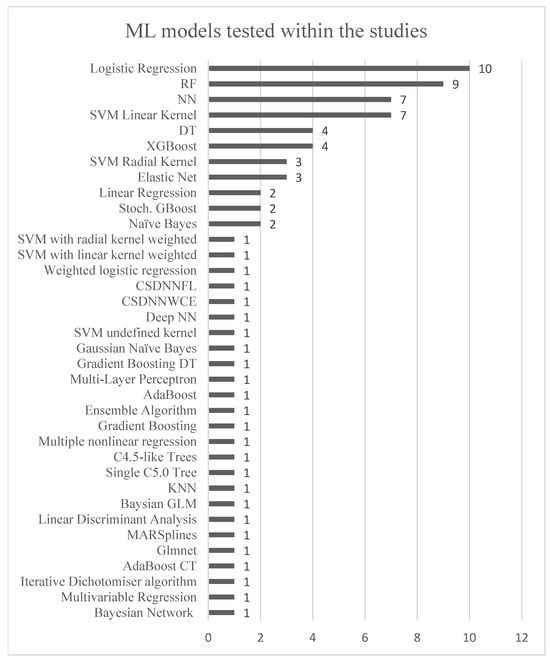
Figure 4.
The figure illustrates the use of different ML models in the included studies. The y-axis represents the diversity of ML models, while the x-axis shows the number of studies utilizing each model. The following abbreviations are used: random forest (RF), adaptive boosting classification trees (AdaBoost CT), neural networks (NN), support vector machines (SVM), stochastic gradient boosting (Stoch. GBoost), extreme gradient boost (XGBoost), K-nearest neighbors (KNN), decision tree (DT), cost-sensitive deep neural network with weighted cross-entropy (CSDNNWCE), cost-sensitive deep neural network focal loss (CSDNNFL).
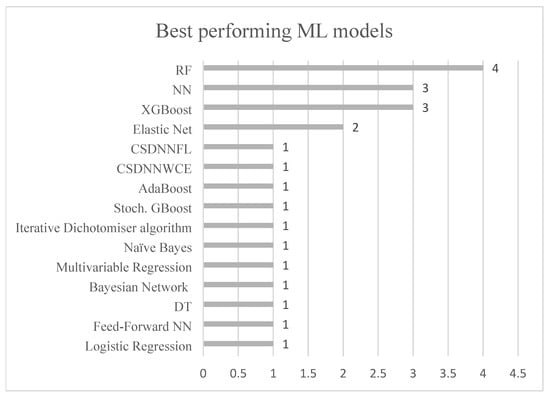
Figure 5.
The figure illustrates the best-performing ML models across the included studies. The y-axis represents the various ML models that achieved the highest performance, while the x-axis shows the number of studies or PE subgroups in which each model was identified as achieving the best performance.
AUC and recall values emerged across 12 and 13 out of 18 studies, respectively, leading to the most used performance metrics. Considering these two metric values, Torres-Torres et al. achieved the highest AUC of 0.96 as well as a DR of 88% at an FPR of 10% in predicting early-onset PE (<34 weeks of gestation), utilizing elastic net regression [24]. Torres-Torres et al. did not report a recall value; hence, the highest recall value for early-onset PE was achieved by Gil et al. at 84%. For preterm PE (<37 weeks of gestation), Gil et al. attained the highest AUC of 0.91 and the highest recall value of 78% at a SPR of 10% [25], incorporating a feed-forward NN [26]. As Gil et al. refer to their DR to be the same as recall, this is included in this performance comparison [25,26]. Melinte-Popescu et al. reported the highest AUC value of 0.84 and recall value of 93% for late-onset PE (>34 weeks of gestation) using RF [27]. Furthermore, in predicting all cases of PE, Melinte-Popescu et al. attained the highest AUC of 0.98 along with the second highest recall value of 96% using naïve Bayes. For term PE (>37 weeks of gestation), Sandström et al. obtained an AUC of 0.67 and recall of 28% at an FPR of 10%, deploying a backward selection model on multivariable logistic regression [30].
Figure 6 illustrates the features that were listed to be of high predictive importance within the included studies.
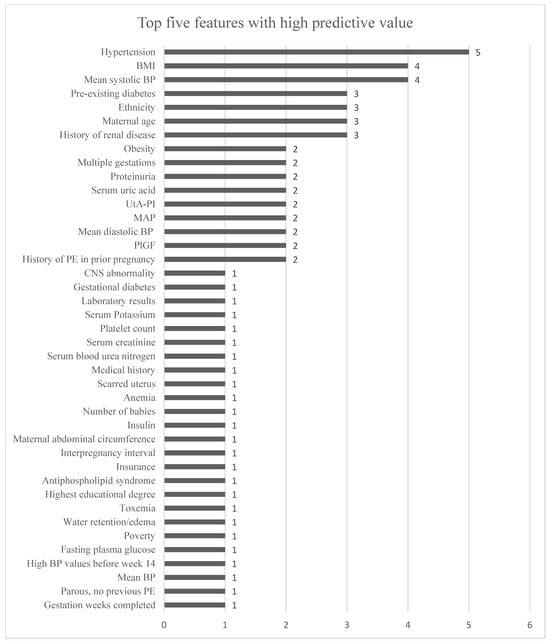
Figure 6.
This figure shows the features identified as among the top five in terms of importance for various ML models across different studies. “Hypertension” encompasses both chronic hypertension and gestational hypertension. Features that were repeated for different subgroups in the same study were not included. Bennett et al.’s features for each dataset were included. The x-axis represents the number of times each feature is cited as having high predictive value for an ML model, as detailed in Table 1.
4. Discussion
4.1. Best-Performing Machine Learning Model
The most used ML models were RF, logistic regression, NN, SVM with a linear kernel, DT, XGBoost, elastic net, and SVM with a radial kernel. When considering the AUC and recall values, no single type of ML model emerged as superior across the different subgroups of PE (early-onset PE, late-onset PE, preterm PE, term PE, and all PE). Especially concerning the same dataset, Melinte-Popescu et al. achieved the highest AUC for LO-PE and all PE using two different types of ML models. Despite RF and logistic regression being the predominant models, only four out of nine and one out of ten studies identified RF and logistic regression as the best-performing models, respectively. XGBoost, on the other hand, demonstrated the best performance in three out of four studies, outperforming RF in two. However, XGBoost did not achieve the highest AUC in any of the studies. RF and logistic regression had the highest AUC for LO-PE and term PE, respectively.
4.2. Datasets Used
Based on the results of the best ML models, we could hypothesize that using multiple models for identifying subgroups of PE could be beneficial. However, the compared models use different features and datasets of varying sizes and quality. Dataset quality is critical in ML because the performance and reliability of ML models heavily depend on the accuracy, consistency, and representativeness of the data they are trained on. High-quality datasets enable models to learn patterns effectively, leading to better generalization and predictive power. Poor-quality data, such as noisy, incomplete, or biased datasets, can result in inaccurate predictions, overfitting, or biased outcomes, compromising the model’s reliability in real-world applications. Ensuring data quality through preprocessing, cleaning, and validation steps is essential for building robust, fair, and trustworthy ML systems [32]. Datasets should also be open, allowing independent research groups to test the performance claims in reported papers.
By inspecting the included studies (Appendix B), only 12 out of 18 studies highlighted their actions to ensure data quality, such as replacing or removing missing data to maintain a complete dataset. A total of 18 different training datasets were reported in the included studies, ranging in size from 70 to 360,943. Notably, 13 studies did not report the handling of class imbalance within their training dataset, whereas only Melinte-Popescu et al. had a balanced set. The rate of PE cases in the different datasets ranges from 1.3% to 56% among the included studies’ datasets. However, the studies reporting a test set with a PE rate of 56% only contained a total of nine women, which is a small set on which to base the performance. All 18 studies reported the percentage of PE within their total population, though Torres-Torres et al. did not specify the rate used within their test datasets as provided by the remaining studies using test sets or external validation sets. The lack of PE rate within a test and external validation set provides a limitation to the ML model’s performance, as it is not transparent how these rates might influence the outcomes.
A total of nine studies used a test set rather than a validation set to evaluate the ML model’s performance. In identifying the models with the highest performance within the different subgroups of PE, it is noteworthy that only Torres-Torres et al. and Gil et al. were based on a test set rather than a validation set. In fact, the performances reported by Melinte-Popescu et al. and Sandström et al. are based on cross-validation. Torres-Torres et al. reported 21 early-onset PE cases within their total population of 3050. However, as mentioned previously, they did not clarify how the PE rate was divided into their three datasets or the subgroup of PE. This lack of transparency affects the performance and interpretation of the results, as it is unclear how the 21 cases were distributed and how the ML model identified those within the validation set. Without this information, it is challenging to assess the model’s true performance and reliability.
Gil et al. reported an early-onset PE rate of 0.32% within their dataset, where they achieved the highest recall value for early-onset PE across the studies. This low rate indicates a rare occurrence of early-onset PE in their population, which can be challenging for model training and evaluation due to the limited number of positive cases. The fact that Ansbacher-Feldman et al., who trained the model, did not clarify the rate of early-onset PE cases as their main outcomes were preterm PE and term PE. Despite this, achieving high performance in such a scenario suggests the model’s robustness in identifying rare cases.
Sandström et al. had 2276 term-PE cases out of 62,562 in the subgroup of PE where they outperformed others, though their results are based on cross-validation. This larger number of cases provides a more substantial dataset for training and validation, potentially leading to more reliable performance metrics. Cross-validation helps in assessing the model’s generalizability by using different subsets of the data for training and validation, but it may not fully replicate the performance on an independent test set.
Melinte-Popescu et al. had 94 late-onset PE cases out of 233 in the subgroup where they outperformed other studies, also based on cross-validation. The relatively high incidence rate (50%) in a small dataset can lead to overfitting, where the model performs well on the training data but may not generalize to new, unseen data. Cross-validation mitigates this risk to some extent by ensuring the model is evaluated on multiple subsets of the data.
Nonetheless, identifying the ML model’s performance metrics, the rate of PE cases does not seem to influence their performance results. In fact, Melinte-Popescu et al. had the highest incidence of PE cases at 50% across the studies using the performance metrics and achieved the highest performance for late-onset PE and all PE. Yet, Li Y-X et al. had an incidence of 5% PE in their population of 3759 and achieved an AUC of 0.96 and a recall of 79%. This is 0.02 less in the AUC and 20% less in recall than Melinte-Popescu et al. Notably, Li Y-X. et al. used a test set and applied weight assignment to handle class imbalance, which seems to have positively affected the ML model’s performance.
With 11 studies (excluding Melinte-Popescu et al.) reporting the performance metrics for all PE and having a rate of PE cases in between 1.3% and 50%, these studies all had AUC values less than Li Y-X et al. for all PE. Only Kovacheva et al. and Li Z. et al. reported a higher recall value compared to Li X-Y. et al. However, Kovacheva et al. did not report actions to address the class imbalance and, similarly to Melinte-Popescu et al., based their performance on cross-validation, making this comparison difficult. Li Z. et al. did not report if they handled the class imbalance within their training set, but the model outperformed Li X-Y. et al. using weighted averages, which can be used for imbalanced datasets. This indicates that there is no clear correlation between the rate of PE cases and the performance of the ML model within the included studies. Yet, the models are based on different features and different-sized datasets, which might be the factors influencing the performance outcome. The population sizes in the included studies vary from 233 to 360,943, which influences their ML models’ performances. Especially when comparing the ML model’s performances across the studies, the different validation, test, and external validation sets on which the performances are based can affect the results. Yet, neither Melinte-Popescu nor Torres-Torres et al. reported the rate of PE cases within their individual datasets, making it unclear how reliable the performances are.
These variations in dataset sizes and PE rates highlight the challenges in comparing ML model performances across studies. The use of cross-validation in Melinte-Popescu et al. and Sandström et al. provides a more comprehensive evaluation of the model’s performance but may still differ from results obtained using independent test sets. The differences in dataset characteristics, such as the rate of PE cases and the total population size, can significantly influence the reported performance metrics, making direct comparisons difficult.
Selecting one model that will perform with high prediction on different datasets is, according to James et al., challenging as there is no ML model that outperforms others on every single dataset, even though the datasets are similar [33]. This makes Gil et al.’s performance noteworthy, as their model was originally developed by Ansbacher-Feldman et al. on another population employing raw input data like that used in the FMF algorithm [26].
Furthermore, none of the included studies used the same dataset, making it difficult to compare the efficiency of the individual approaches. Out of 18 studies, the datasets used for their ML models were only available online for two studies, whereas five other studies reported that they could be made available if contacted. The authors of the five studies have been approached to attain access to their dataset to replicate their results. Out of these five studies, none replied. Three studies reported that access could be gained by getting approval or contacting other parts than the authors. The remaining eight studies did not report anything on the dataset’s accessibility.
We would like to encourage future studies to include detailed information on the origin and quality of the dataset used, to provide the data for third-party quality control, and to use a common standardized dataset. In that regard, we propose establishing a common leaderboard competition [34,35], accompanied by a standardized dataset for gestation weeks 11+0 to 14+1, to foster collaboration in the development and comparison of ML models with minimal bias. By utilizing common performance metrics such as AUC, accuracy, recall, and F1-score, researchers can more effectively assess and benchmark model performance, ensuring consistent and meaningful evaluation across studies. The leaderboard competition could also include standardized reporting on whether the model was developed retrospectively or prospectively as part of a clinical trial. Furthermore, the leaderboard could include information on XAI and deployment strategies. This approach would enable a thorough inspection of feature selection processes, helping to identify key features for PE risk assessment.
4.3. Feature Selection
Among the studies listing features of importance, Torres-Torres et al., Gil et al., and Melinte-Popescu et al. used features like FMF (such as maternal age, MAP, UtA-PI, PLGF, and PAPP-A) (Appendix A). Notably, neither Melinte-Popescu et al. nor Torres-Torres et al. included racial origin as a feature, unlike Gil et al., who rated it as the fourth-highest predictive feature. Gil et al.’s ML model incorporated the use of aspirin and raw input data instead of MoM values. In contrast, Melinte-Popescu et al. and Torres-Torres et al. added more diverse features from FMF and used BMI instead of weight and height. Torres-Torres et al. rated BMI to be the fourth-highest predictive feature of their ML model. Since BMI is calculated based on weight and height, including all three features can potentially cause correlation. Collinearity makes it challenging to identify the individual features’ effect on the outcome and impacts the development of the model [36]. Therefore, the choice of features needs to take this factor into account.
Among the 18 included studies, 10 of them highlighted features of high predictive importance. Within eight of the ten studies, BP measurements (systolic BP, diastolic BP, and MAP) were listed in the top five. As visualized in Figure 6, systolic BP occurred two times more frequently than MAP and diastolic BP. MAP is calculated based on both diastolic and systolic BP, with diastolic being the primary contributor. Regardless of whether it is systolic BP, diastolic BP, or MAP, all pressure-related parameters show significance in PE risk assessment. However, a systematic review conducted by Bertini et al. highlighted systolic BP to be of particularly high importance to the ML models [9]. Yet, the best-performing ML models identified within this review all used MAP instead of systolic and diastolic BP. No study was identified to compare the ML model’s performance regarding MAP versus systolic and diastolic BP. Therefore, we have no basis for asserting which method of BP measurement is superior. However, such a comparison could be beneficial in the future development of ML models. Additionally, among the ten studies reporting the features of high importance to their ML models, 41 different features were identified. Hypertension (chronic and gestational) was the most frequently repeated feature, as visualized in Figure 6, appearing in four out of ten studies, with Bennett et al.’s study identifying it as important for two different datasets. However, this feature was not included in all ML models from the included studies.
Li Y-x et al. and Wang et al. identified that a questionnaire involving features such as maternal age, BMI, and medical conditions (Appendix A) can achieve an AUC of 0.84 (Table S1) and 0.80 for all PE, respectively [19]. Utilizing an ML model based on a questionnaire is arguably more cost-efficient and less intrusive compared to models that use several blood tests and involve healthcare professionals for ultrasound and blood pressure measurements. Across the 10 studies listing their top five predictive features, 19 features were identified to be suitable for a questionnaire. These include BMI, maternal abdominal circumference, insulin, chronic hypertension, racial origin, antiphospholipid syndrome, water retention/edema, history of PE in a prior pregnancy, number of babies, interpregnancy interval, poverty, highest education, insurance, maternal age, medical history, obesity, parous with no previous PE, pre-existing diabetes, and renal disease. Concerning maternal abdominal circumference, the expecting mother will be able to answer this if provided with a measuring tape. Yet, including this measurement alongside BMI or obesity needs to be done with caution. These features might be collinear, as they all depend on the person’s weight and height. With collinear features, the model’s performance can potentially be affected. These features are not all currently included in the FMF algorithm, nor has the combination of these features been tested within a single ML model along with the FMF algorithm’s maternal characteristics. However, incorporating these features into a questionnaire for the expecting mother appears relevant to clarify the potential of an ML model based on a questionnaire in PE risk assessment as a preliminary step or first use of an ML model.
Sufriyana et al. is the only study using features from the expecting mother’s health insurance record dated months before the development of PE. These features are derived from recorded diagnoses within the patient’s health insurance records and are coded according to the International Classification of Diseases 10th Revision (Appendix A) [20]. The proposed approach achieved the highest AUC when using data collected 9–<12 months before the onset of PE, with an AUC of approximately 0.88 (geographical split) and 0.86 (temporal split) using only these data. This period is defined by Sufriyana et al. to correspond to endometrial maturation [20]. This result indicates a potential for using patient health record data as part of a prediction model for PE. Additionally, using available record data in an ML model is a cost-effective approach, though the records might be diverse among hospitals, leading to potential bias.
4.4. Key Features Used
Identifying the key features perceived as useful is crucial for advancing research in this domain. However, individual studies often lack a comparative ranking of feature importance, making cross-study comparisons challenging. Figure 6 presents the top five features highlighted by ten different studies. It is important to interpret these rankings with caution, as the relevance of certain features may vary across different datasets. Notably, the top five features are not consistently utilized across all 18 studies reviewed. We recommend that future research adopt a standardized methodology for assessing feature importance. Therefore, this review cannot provide a definitive conclusion of the key features of any given ML model in the risk assessment of PE. Instead, this review provides an overview of the features identified as being influential in previous studies, which may assist in identifying new potential combinations of features for future ML research.
4.5. Machine Learning Deployment Pattern
In 11 out of 18 studies, ML models were utilized as a single-use application, indicating their prevalent usage and testing. Nevertheless, Figure 3 suggests a growing interest in implementing ML models for multiple uses, with proposed strategies by Eberhard et al. and Li Z. et al., both conducted in 2023. As identified in Table 1, three out of four studies intending to use the ML model more than once were conducted in 2023 and 2024, whereas the remaining study is from 2011. The included studies span from 2009 to 2024. Velikova et al. was the sole study from 2011 to 2023 investigating the multiple uses of an ML model in the PE risk assessment at different gestational weeks. Yet, they only provided the risk prediction for week 12 and week 16 within their study. Additionally, Velikova et al. aimed to create a model that could be used as a decision support tool for home monitoring, though this was not tested within this study. However, three out of seven studies conducted from 2023 to 2024 used the ML model more than once or created a model for each time point. This indicates a potential shift in the research field of PE risk assessment using ML models. Yet, none of the included studies have investigated the proposed adaptive ML model as mentioned in Hackelöer et al.’s review, which aims to monitor the development of PE. The BP progression along with gestation weeks was investigated by Lazdam et al. and Macdonald-Wallis et al. [37,38]. They identified differences in the progression of diastolic and systolic BP within pregnant women developing PE as early as weeks 12 to 21 of gestation [37,38]. Eberhard et al. likewise indicate in their study that BP’s importance to the ML model increases as gestation age progresses [16]. This suggests that an adaptive and multiple-use ML model including the BP progression will be beneficial in the PE risk assessment and PE development from week 12 of gestation. Home monitoring, as suggested by Velikova et al., would be a valued contribution, as the associated problems from BP changes appear only days later [13]. This use could potentially enhance predictive accuracy by reducing the number of false positives and lead to more personal care within obstetrics concerning PE treatment. An adaptive and multiple-used ML model will therefore both predict the risk of developing PE before gestational week 16 as well as help detect the development of PE at an early stage.
Five of the 18 studies do not indicate when the model is intended to be used, whereas the remaining indicates the first time to be either “first prenatal visit”, “week 16 of gestation”, “early second trimester”, or “first trimester”. Compared to the FMF algorithm the earliest predictive algorithm is to be used at gestation week 11+0 to 14+1, where the first prenatal visit usually takes place. The first trimester ends by gestation week 12, so the first prenatal visit can likewise be in the early stages of the second trimester. Hence, the different definitions of the first intended use are within the same period, except Marić et al.’s study being utilized at week 16 of gestation. Yet, according to Van Doorn et al., the aspirin treatment should be initiated before week 16 [3], making the prediction at week 16 of gestation the last time point possible for this initiation.
Concerning using the ML model later in the pregnancy, only two studies specified the exact gestation weeks where it is intended to be used. These are week 16 of gestation in Velikova et al.’s study, and weeks 20, 24, 28, 32, 36, 39, and on admission in Eberhard et al.’s study. The remaining two studies either did not specify any information or used the definition of “before the delivery admission”, resulting in no similar frequency of use within these studies. The use of an ML model more than once has been identified as a new and growing part of the research area of PE risk assessment, reflecting the lack of a common frequency of usage patterns.
4.6. Machine Learning Deployment, Monitoring, and Maintenance
4.6.1. Patterns and Strategies of ML Deployment
Deploying machine learning (ML) models in production environments requires strategic planning and careful execution to ensure the models will perform efficiently and securely, and remain adaptable to changes in data and user requirements over time. Also, production environments need to be maintainable over time, given changing equipment and software components. Key considerations for ML deployment include configuration within deployment environments, integration into ecosystems, monitoring and maintenance, security, scalability, and model versioning [39]. Each of these factors plays a relevant role in ensuring the long-term success of an ML model in real-world clinical settings. In the following, we shall elaborate on this and discuss to what degree the included studies address these.
4.6.2. Configuration Within Deployment Environments
ML models must be configured within deployment environments to align with infrastructure and application needs. The configuration process involves selecting the appropriate hardware platform, establishing suitable memory allocations, and defining the necessary libraries and software dependencies for the model to function effectively. Deployment patterns, such as containerization using Kubernetes, Docker, and other virtualization tools, provide portability and consistency across different environments [39]. Additionally, configuration management tools may help enable the automation of deployment tasks, ensuring reproducibility and minimizing human error during deployment [40]. None of the included studies provide any standardized reporting on the choice of hardware or software platform. We recommend that future studies report these elements in a structured manner.
4.6.3. Ecosystem Integration
ML models often need to be integrated into existing IT ecosystems and workflows, including in the clinical setting of an obstetric department. This requires seamless interfacing with other systems, including clinical databases, APIs, and services that contribute to the data pipeline. Microservice architecture is a common approach that facilitates this integration, allowing ML models to function as independent services that interact with various components via REST APIs, message queues, and other relevant distribution mechanisms [41]. Integration also involves ensuring compatibility with data preprocessing pipelines, which are critical for feeding real-time or batch data into models during operation [42]. Furthermore, data transformation processes must be synchronized to ensure the input to the ML models remains consistent with the format used during training. None of the included studies discuss integration within the ecosystem. We recommend that future studies report these elements in a structured manner.
4.6.4. Monitoring of ML Models
Monitoring ML models after deployment is essential for tracking their performance and ensuring they are making accurate predictions over time. Drift detection is a key aspect of monitoring, as models can degrade in performance when the underlying data distribution changes (data drift) or when the model’s internal representations no longer generalize well, also known as concept drift [43]. Real-time dashboards can be set up to monitor key performance indicators (KPIs) such as prediction accuracy, latency, throughput, and resource utilization. In production environments, including in the clinical setting, automated alert systems could notify teams when models exhibit abnormal behavior, allowing for quick intervention to mitigate performance drops [39]. None of the included studies discuss integration within the ecosystem, nor how efficient monitoring has been planned or implemented. We recommend that future studies report these elements in a structured manner.
4.6.5. Maintenance of ML Models
Model maintenance involves the retraining, updating, or replacing of ML models when performance begins to decline or when new data become available which could lead to performance improvement. This could be the case when moving from one population to a new population with differences in ethnicity, health status, and lifestyle. Continuous integration and continuous deployment pipelines are used to automate the retraining and redeployment processes of ML models [44]. Model retraining can be triggered by scheduled intervals, in the advent of new data availability, or when significant performance degradation is detected by the monitoring system if present [43]. To facilitate efficient maintenance, version control and dependency management tools could be used to ensure that different model versions, along with their respective data and code, can be traced and reproduced [45]. This is also highly relevant for the reproduction of scientific results from published studies. None of the included studies discuss the maintenance of the models nor any type of tracking of performance over time. We recommend that future studies report these elements in a structured manner.
4.6.6. Security and Data Protection
Security concerns in ML model deployment revolve around safeguarding both the model and the data. Models, especially if trained on open datasets, are vulnerable to adversarial attacks, where malevolent inputs are designed to deceive the model into making incorrect or deviant predictions. Techniques such as differential privacy, adversarial training, and secure multi-party computation can be used to mitigate such risk factors [46]. None of the included studies discuss such model-based security or security measures focusing on challenges related to potential malevolent inputs. We recommend that future studies report these elements in a structured manner.
Data protection is another critical aspect, particularly when dealing with sensitive information such as healthcare data or personally identifiable information. Data encryption, fine-grained access control, and anonymization techniques should be integrated into the ecosystem to ensure compliance with regulations such as GDPR (Europe) or HIPAA (US), thus protecting user privacy and data security [47]. None of the included studies discuss data protection issues, nor any regulatory issues, including GDPR, HIPAA, and MDR. We recommend that future studies report these elements in a structured manner.
4.6.7. Scalability, Load Balancing, and Resource Management
Scaling ML models to meet high user demand or manage large datasets is a common challenge. Horizontal scaling, which involves adding more instances of a model, is often managed using load balancing techniques, which are well-known concepts in distributed systems engineering, to distribute incoming requests evenly across one or multiple model services [48]. Cloud platforms offer auto-scaling features to automatically adjust the number of computing resources in response to real-time traffic, but cloud computing can be problematic with regard to privacy and other regulations [49]. Resource management strategies, such as the dynamic allocation of memory and computational resources, are relevant for optimizing performance and reducing hardware resource costs [50]. Orchestration tools like Kubernetes can automate these tasks by dynamically allocating resources based on model usage patterns, ensuring high availability and efficient resource utilization [41]. However, the models typically used for PE do not require such elaborate instruments, as the feature list reported in the included studies is not resource-demanding for the model technologies employed, which could also explain why this is not addressed in any of the reported studies. Still, we would recommend future studies in the area to refer to this.
4.6.8. Versioning and Tracking of ML Models
ML model versioning can be used for tracking the evolution of models over time and ensuring the reproducibility of results [45]. Tools such as DVC, MLflow, and Kubeflow provide infrastructure for versioning models, datasets, and associated code. These tools enable data scientists to track changes made during the training process and allow for a seamless rollback to previous versions if new versions underperform [42]. In addition to versioning, model lineage tracking is relevant for compliance and audit purposes, especially in the highly regulated healthcare sector [47]. Version tracking also facilitates model comparison and benchmarking, helping researchers to evaluate different models under identical conditions and select the best-performing one for production [51]. None of the included studies discuss the versioning and tracking of the models. Nor has it been considered how to deliver relevant benchmarking of performance. We recommend that future studies report these elements in a structured manner.
In conclusion, the included studies mainly focus on ML models in a limited retrospective research set up, rather than in clinical practice as part of an existing clinical workflow and technical ecosystem. This suggests that more work is needed in the area, as strategic planning and careful execution are arguably relevant to ensuring that the models perform efficiently, securely, and remain adaptable to changes in data and user requirements. Key considerations for future studies should be to report on configuration within deployment environments, integration into ecosystems, monitoring and maintenance, security, scalability, and model versioning. Also, it would be relevant to differentiate between retrospective studies and studies reporting on actual working systems as part of a clinical and technical ecosystem.
4.7. Explainability
The adoption of machine learning models in healthcare settings, particularly for PE risk assessment, requires not only high predictive performance but also decision interpretability. Clinicians or patients need to understand the underlying drivers of the model’s predictions to have confidence in the reliability of the results. Oprescu et al. emphasize the importance of transparency in model decisions to ensure trustworthiness and utility for end users [52]. Transparency is one of the key elements in the Ethics Guidelines for Trustworthy AI [53]. Despite this, our review found that only 10 of 18 studies applied advanced techniques to explain their model’s decisions. Six of the studies utilized the inherent interpretability offered by simpler prediction models, such as feature importance scores based on their best-performing ML model. Four studies, however, did employ the SHAP (SHapley Additive exPlanations) method to provide more granular insights into their model’s decision-making process.
Wang et al. and Eberhard et al. used SHAP to investigate both global (for the model) and local (for individual patients) explainability of the models, examining the relationships between predictive variables. In both cases, chronic hypertension consistently exhibited the highest SHAP values. Eberhard et al. further analyzed the SHAP values across different stages of pregnancy, discovering that the trajectory of systolic and diastolic blood pressure becomes more important as pregnancy progresses. However, none of the studies addressed ethical considerations regarding how the model’s decisions should be communicated to end users. Oprescu et al. noted that only 35 out of 156 studies in their review developed a graphical user interface (GUI) for clinical use [54]. This might be explained by the need to establish a reliable ML model before investing in GUI development. In fact, Clement et al. identified in their meta-review, that using explainability in practical solutions in the real world is not well established compared to the development of methods for explainability [55]. Nevertheless, before an ML model is validated and ready for clinical implementation, it should be tested on diverse populations, raising ethical concerns about patients’ rights to understand their health status and their role in the study. Mohammad Amini et al.’s review similarly underscores the need for enhanced transparency in the decision-making process in healthcare [56]. Thus, developing a GUI should be a priority before the validation phase. Gil et al. was the only study in this review to conduct a validation of an ML model on a new population, yet it neither communicated the model’s decisions to participants or clinicians nor proposed a GUI for clinical use.
4.8. Practical Considerations
Implementing an ML model involves addressing various practical considerations. Mohammad Amini et al.’s review highlights some of these practical considerations, involving the rights of the data owners and ensuring that the end users possess the necessary skills to operate the system [56]. Protecting data owner rights, securing patient privacy, and ensuring data security are highlighted as key elements in the Ethics Guidelines for Trustworthy AI [53]. However, Oprescu et al. found that only 7% of the studies they reviewed considered IT-related data security aspects [54]. Similarly, none of the 18 studies in this review addressed data security for the ML models. Additionally, Chiaburu et al. point out that privacy also concerns the ML models’ explanations, as they should not provide information that was used in their training or other sensitive data [57]. This is a critical factor to consider before clinical implementation, alongside the ongoing maintenance of the model. Future studies should prioritize these factors.
The ML models that performed best for the different PE subgroups in this review were developed using diverse datasets and ML techniques. Implementing such a diverse array of ML models while ensuring decision transparency might be challenging when multiple ML models are deployed simultaneously, potentially undermining the trust and reliability of the risk assessment system if the models’ outputs overlap.
The implementation of single-use, dual-use, and multiple-use models presents distinct challenges. A single-use ML model needs to be highly reliable to accurately identify true positives in the PE risk assessment while minimizing false positives. One approach to enhance sensitivity and specificity is to use models later in the pregnancy, potentially reducing unnecessary anxiety from early screening results by providing clarification later. However, repeated screenings during pregnancy could introduce bias, especially if conducted during daily activities when conditions may not be ideal. This needs to be investigated further in future studies. Implementing a multiple-use ML model in a clinical setting could hinder its adoption due to the additional time required from clinical staff. A preferred solution would involve developing automated technologies to collect data without increasing the workload for healthcare providers. While some features, such as blood tests, require a healthcare professional, others, like BP monitoring, can be self-administrated by the pregnant woman if the right technologies are available. Further research is needed to determine the feasibility of implementing automated technologies for PE risk assessment in a clinical setting.
4.9. Necessary Steps to Establish the Use of ML in Real Clinical Practice
None of the 18 studies in this review address the practical steps required to implement ML models in clinical practice. This gap highlights an important area for future research, as translating ML from research to clinical settings involves navigating regulatory, legal, and logistical challenges.
Integrating ML into clinical practice varies by country and requires engagement with multiple stakeholders. In some regions, policymakers must update national health guidelines, while intellectual property (IP) rights must be established. For instance, in Europe, compliance with regulations such as the General Data Protection Regulation (GDPR), the Medical Device Regulation (MDR), and the AI Act is crucial. However, interpretations of these regulations can vary between countries, adding complexity to the implementation process, even within Europe. This regulatory landscape often requires coordination with hospital legal teams as well as public and private system vendors.
Additionally, ML models must seamlessly integrate with existing clinical systems. In Denmark, for example, clinicians rely on the Astraia GmbH system, a widely used GUI in obstetrics, to access relevant information, including decision support tools. Since systems like Astraia only accommodate CE-approved algorithms, incorporating the latest research findings into such platforms presents challenges, making it difficult to adopt cutting-edge ML models in clinical practice.
While these practical considerations were beyond the scope of the studies reviewed, we believe future research should address these essential aspects. A structured approach to ML implementation—focusing on policy engagement, regulatory compliance, and system integration—will be critical for ML models to reach their full potential in clinical settings.
4.10. Limitations
Discrepancies in PE subgroups and the absence of common performance metrics limited the ability to conduct a comprehensive comparative analysis of performance across the included studies. As shown in Table 1 and Figure 2, the performance metrics varied significantly, with no single metric being consistently applied across all studies. This inconsistency hindered our ability to identify the top-performing ML model across the analyses. It would be advantageous for future research to incorporate commonly used performance metrics in the reporting to ensure their results are comparable.
Comparing the performances of different ML models that are all trained and tested on diverse datasets, populations, and feature sets poses a limitation of this review. Such a comparison could have introduced bias as different feature combinations, sizes of datasets, and population groups, could have resulted in different outcomes. Furthermore, in five out of 18 studies, only one ML type was tested, which inherently biases the review’s findings concerning the best-performing ML model within each study. With only one ML model listed within a study, this automatically becomes the best-performing model without any comparison.
4.11. Future Research
The ML models within this review were trained and tested on the collected data, being either retrospective or prospective. Five out of 18 studies were prospective studies, leaving 13 studies being retrospective. Performing retrospective studies means that the data can include some missing values, which Sandström et al. experienced. This could potentially have affected the development of the ML models, as they had to use mean values for the missing elements. Similarly, retrospective studies do not make it possible to investigate different features that were not collected at that time, thus hindering potential feature selection. Yet, four of the studies using prospective data were not tested on new prospectively collected data, in the sense of predicting the risk with the developed ML model at the time of data collection. Only Gil et al. performed the risk assessment at the time of data collection, yet the clinicians and participants were not informed about the outcome. Prospective validation of the models would be of high importance in the context of implementing them in practice, as Torres-Torres et al. likewise point out [24]. As an ML model is intended to be a decision support tool in the PE risk assessment just as the FMF algorithm is today, future research would benefit from testing the ML model on prospective data with an unknown outcome at the prediction time. This will highlight and validate the model’s performance in the intended use in a clinical setting and ensure that the model is applicable in a clinical setting.
5. Conclusions
This review reveals a diverse landscape of ML models and parameters utilized for PE risk assessment. Commonly used models include RF, logistic regression, NN, and SVM, with AUC and recall being common performance metrics. No single ML model proved consistently superior across different subgroups of PE, nor even within the same studies. Instead, using different ML models has shown potential in the prediction of early-onset PE, preterm PE, late-onset PE, term PE, and all PE.
BP emerged as the most predictive feature in the risk assessment of PE, highlighting the importance of diastolic and systolic BP measurements alongside MAP. However, which BP parameter will benefit the ML model’s performance the most remains unclear. Hypertension emerged as the most important feature in four different studies, but its overall importance cannot be conclusively determined since not all studies utilized it. Similarly, BMI and obesity were identified as predictive features; their inclusion alongside weight and height could potentially introduce correlations that might affect the ML model’s performance.
Recent studies have shown increased interest in deploying ML models for dual- or multiple-use models throughout pregnancy, though the majority (11 studies) still focused on single-use models. Furthermore, no consistent frequency in the dual- or multiple-use models was identified among the studies. Incorporating features such as BP progression throughout gestation may enhance the predictive accuracy of ML models for PE risk assessment and limit the number of women being falsely predicted to be at high risk of developing PE. Among the studies specifying when their ML models were intended to be deployed for the first time, only one focused on gestation week 16. The remaining studies aimed to use the models within the gestation period of weeks 11+0 to 14+1, which aligns with the optimal window for initiating aspirin treatment.
Implementing an ML model for PE risk assessment involves ethical and practical considerations. Yet, none of the included studies addressed the development of a GUI to explain the PE risk assessment to the end users, nor did they discuss plans for data security—both of which are crucial for clinical implementation to make it useful and trustworthy for the end users. Implementing an ML model intended to be used more than once in a clinical setting might be hindered by the widespread lack of staff capacity in clinical settings. Automated screening techniques could be pursued to mitigate this.
Limitations of this review include comparing studies that are trained and tested on diverse datasets, population groups, and feature selection schemes. Additionally, the absence of common performance metrics, the rate of PE cases, and the fact that five studies only tested a single ML model limit the ability to draw definitive conclusions about model performance across different PE subgroups. As a result, not all studies could be directly compared or fully considered in this review.
Supplementary Materials
The following supporting information can be downloaded at: https://www.mdpi.com/article/10.3390/make6040123/s1, Table S1: Comprehensive Summary of Included Studies; Table S2: Summary of Machine Learning Model Performances.
Author Contributions
Conceptualization, L.P. and S.W.; methodology, L.P. and M.M.-M.; formal analysis, L.P.; investigation, L.P. and M.M.-M.; writing—original draft preparation, L.P.; writing—review and editing, M.M.-M., S.W. and J.R.; visualization, L.P.; supervision, S.W. and J.R.; funding acquisition, S.W. and J.R. All authors have read and agreed to the published version of the manuscript.
Funding
This review was funded by Innovation Fund Denmark (IFD), UEFISCDI Romania, and NCBR Poland in the framework of the ERA PerMed (EU Grant 779282), JTC 2021, project WODIA—Personalized Medicine Screening and Monitoring Programme for Pregnant Women Suffering from Preeclampsia and Gestational Hypertension.
Institutional Review Board Statement
Not applicable.
Informed Consent Statement
Not applicable.
Data Availability Statement
Not applicable.
Conflicts of Interest
The authors declare no conflicts of interest. The funders had no role in the design of the study; in the collection, analyses, or interpretation of data; in the writing of the manuscript; or in the decision to publish the results.
Appendix A
This appendix contains the features used to train the machine learning models in the different studies included in this review. The features were identified from each study manuscript, or from the supplemental documents provided with the study. The intent is to get a clear understanding of the different features used to train machine learning models along with their performances illustrated in Table A1.
Table A1.
Features used to train the individual machine learning models within each of the included studies. The following abbreviations were used: mean arterial pressure (MAP), placental growth factor (PlGF), Uterine artery pulsatility index (UtA-PI), pregnancy-associated plasma protein A (PAPP-A), blood pressure (BP), and body mass index (BMI), multiples of the median (MoM), and preeclampsia (PE).
| Study | Features Used in the Machine Learning Model |
|---|---|
| A predictive Bayesian network model for home management of preeclampsia [13] | Values taken at each of the following gestational week: 12, 16, 20, 24, 28, 32, 36, 38, 40, and 42: Age Smoking Obese Chronic hypertension Parity-history PE Treatment Systolic BP Diastolic BP Hemoglobin Creatinine Protein/creatinine |
| Machine learning approach for preeclampsia risk factors association [14] | Duration of completed pregnancy in weeks. Toxemia Education (completed years of schooling) Highest completed year school or degree Pregnancy outcome Labor force status Poverty Water retention/edema Race Anemia Sex Birth order Birth weight One-minute and five-minute APGAR scores Month of pregnancy when prenatal care began Number of prenatal visits Weight gained during pregnancy Medical risk factors for the pregnancy Obstetric procedures performed Delivery complications Congenital anomalies and abnormalities Mother’s marital status Number of live births now living The parents’ age Hispanic origin State/country of birth |
| Preeclampsia Prediction Using machine learning and Polygenic Risk Scores From Clinical and Genetic Risk Factors in Early and Late Pregnancies [15] | Maternal age at delivery Self-reported race Relf-reported ethnicity (Hispanic or non-Hispanic) Hospital (tertiary or community) Gravidity Parity Gestational age at delivery Gestational age at preeclampsia diagnosis Last BMI before pregnancy BMI at delivery Maximal diastolic BP during pregnancy Maximal systolic BP during pregnancy Family history of chronic hypertension Family history of preeclampsia Interpregnancy interval In vitro fertilization Multiple gestation Smoking before pregnancy Drugs of abuse before pregnancy Drugs of abuse during pregnancy Alcohol use before pregnancy High-risk pregnancy Maximal BMI before pregnancy Mean BMI in the period 0–14 gestational weeks Systolic BP at first prenatal visit Diastolic BP at first prenatal visit History of pregestational diabetes History of kidney disease before pregnancy History of gestational diabetes in a prior pregnancy History of a prior high-risk pregnancy History of autoimmune disease History of preeclampsia in a prior pregnancy Family history of hypertension Family history of PE Minimal platelets count in the period 0–14 gestational weeks and in pregnancy before preeclampsia diagnosis or delivery Maximal uric acid in the period 0–14 gestational weeks and in pregnancy before preeclampsia diagnosis or delivery Presence of proteinuria in the period 0–14 gestational weeks and in pregnancy before preeclampsia diagnosis or delivery Systolic BP polygenic risk score Small for gestational age or intrauterine growth restriction Last BMI during pregnancy before preeclampsia diagnosis or delivery Maximal BMI before pregnancy Prescription of antihypertensive medication during pregnancy Diagnosis of gestational hypertension during pregnancy |
| Performance of a machine learning approach for the prediction of pre-eclampsia in a middle-income country [24] | Maternal age Nulliparity Spontaneous pregnancy Induction of ovulation In vitro fertilization Gestation age at screening Smoker Alcohol intake Other drugs (heroin or cocaine) Pre-existing diabetes Chronic hypertension Lupus Antiphospholipid syndrome Polycystic ovary syndrome Hypothyroidism Congenital heart disease PE in a previous pregnancy Fetal growth restriction in a previous pregnancy Mother of the patient had PE BMI MAP MAP (MoM) UtA-PI UtA-PI (MoM) PlGF PlGF (MoM) PAPP-A Gestational age at delivery |
| Validation of machine-learning model for first-trimester prediction of pre-eclampsia using cohort from PREVAL study [25]. Based on the machine learning model trained by Ansbacher-Feldman et al. [26] | Maternal age Maternal weight Maternal height Gestation age at screening Racial origin Medical history: Chronic hypertension Diabetes type I Diabetes type II Systemic lupus erythematosus/antiphospholipid syndrome Smoker Family history of PE Method of conception: Spontaneous In vitro fertilization Use of ovulation drugs Obstetric history: Nulliparous Parous, no previous PE Parous, previous PE Interpregnancy interval Aspirin MAP UtA-PI Serum concentration of pregnancy-associated plasma protein-A (PAPP-A) Serum concentration of PlGF |
| An interpretable longitudinal preeclampsia risk prediction using machine learning [16] | Maternal age Self-reported race Self-reported ethnicity (Hispanic or non-Hispanic) Private insurance Public insurance Alcohol use history Smoking history Illicit drugs history Gravidity Parity In vitro fertilization Nulliparous Interpregnancy interval Multiple gestation Maximal systolic BP: 0–14 weeks 0–20 weeks 0–24 weeks 0–28 weeks 0–32 weeks 0–36 weeks 0–39 weeks 0 weeks—admission Maximal diastolic BP: 0–14 weeks 0–20 weeks 0–24 weeks 0–28 weeks 0–32 weeks 0–36 weeks 0–39 weeks 0 weeks—admission Maximal heart rate: 0–14 weeks 0–20 weeks 0–24 weeks 0–28 weeks 0–32 weeks 0–36 weeks 0–39 weeks 0 weeks—admission Maximal BMI: 0–14 weeks 0–20 weeks 0–24 weeks 0–28 weeks 0–32 weeks 0–36 weeks 0–39 weeks 0 weeks—admission Maximal weight: 0–14 weeks 0–20 weeks 0–24 weeks 0–28 weeks 0–32 weeks 0–36 weeks 0–39 weeks 0 weeks—admission Family history of chronic hypertension Family history of preeclampsia Family history of diabetes Family history of heart disease Family history of hyperlipidemia Family history of stroke Past history of diabetes Past history of gestational diabetes Past history of cesarean delivery Past history of preterm birth Past history of gynecologic surgery Past history of asthma Past history of chronic hypertension Past history of gestational hypertension Past history of high-risk pregnancy Past history of hyperemesis gravidarum Past history of migraine Past history of obesity Past history of PE Past history of pregnancy related fatigue Past history of sexually transmitted disease Chronic hypertension Anemia during pregnancy Headaches during pregnancy Autoimmune disease High-risk pregnancy Hyperemesis gravidarum Pregnancy related fatigue Oligohydramnios: At week 39 and admission Proteinuria: 0–14 weeks 0–20 weeks 0–24 weeks 0–28 weeks 0–32 weeks 0–36 weeks 0–39 weeks 0 weeks—admission Maximal aspartate transferase: 0–14 weeks 0–20 weeks 0–24 weeks 0–28 weeks 0–32 weeks 0–36 weeks 0–39 weeks 0 weeks—admission Maximal white blood count: 0–14 weeks 0–20 weeks 0–24 weeks 0–28 weeks 0–32 weeks 0–36 weeks 0–39 weeks 0 weeks—admission Maximal alanine transaminase: 0–14 weeks 0–20 weeks 0–24 weeks 0–28 weeks 0–32 weeks 0–36 weeks 0–39 weeks 0 weeks—admission Maximal serum calcium: 0–14 weeks 0–20 weeks 0–24 weeks 0–28 weeks 0–32 weeks 0–36 weeks 0–39 weeks 0 weeks—admission Maximal serum creatinine: 0–14 weeks 0–20 weeks 0–24 weeks 0–28 weeks 0–32 weeks 0–36 weeks 0–39 weeks 0 weeks—admission Maximal eosinophils: 0–14 weeks 0–20 weeks 0–24 weeks 0–28 weeks 0–32 weeks 0–36 weeks 0–39 weeks 0 weeks—admission Maximal serum glucose: 0–14 weeks 0–20 weeks 0–24 weeks 0–28 weeks 0–32 weeks 0–36 weeks 0–39 weeks 0 weeks—admission Maximal hemoglobin: 0–14 weeks 0–20 weeks 0–24 weeks 0–28 weeks 0–32 weeks 0–36 weeks 0–39 weeks 0 weeks—admission Maximal lymphocytes: 0–14 weeks 0–20 weeks 0–24 weeks 0–28 weeks 0–32 weeks 0–36 weeks 0–39 weeks 0 weeks—admission Maximal platelets: 0–14 weeks 0–20 weeks 0–24 weeks 0–28 weeks 0–32 weeks 0–36 weeks 0–39 weeks 0 weeks—admission Minimal red blood count: 0–14 weeks 0–20 weeks 0–24 weeks 0–28 weeks 0–32 weeks 0–36 weeks 0–39 weeks 0 weeks—admission Antihypertensive medications: 0–14 weeks 0–20 weeks 0–24 weeks 0–28 weeks 0–32 weeks 0–36 weeks 0–39 weeks 0 weeks—admission |
| Predictive Performance of machine learning-Based Methods for the Prediction of Preeclampsia-A Prospective Study [27] | Maternal age BMI Medium: Urban Rural Parity: Nulliparity Multiparity Smoking status during pregnancy The use of assisted reproductive technologies Personal or family history of PE Personal history of hypertension Personal history of renal disease Personal history of diabetes Personal history of systemic lupus erythematosus/antiphospholipid syndrome Hyperglycemia in pregnancy Obesity Interpregnancy interval MAP (MoM) UtA-PI (MoM) PAPP-A (MoM) PLGF (MoM) Placental protein-13 (MoM) |
| Dynamic gestational week prediction model for pre-eclampsia based on ID3 algorithm [17] | Static parameters: Multiple births Spontaneous miscarriage history History of hypertension in pregnancy History of diabetes mellitus Family history of hypertension Preconception BMI Dynamic parameters: Gestational week BMI during pregnancy Systolic BP Diastolic BP Pulse pressure MAP Pulse waveform area parameters Cardiac output Cardiac index Total peripheral resistance Hematocrit Mean platelet volume Platelet count Alanine aminotransferase Aspartate aminotransferase Creatinine Uric acid PlGF |
| Development of a prediction model on preeclampsia using machine learning-based method: a retrospective cohort study in China [18] | Maternal age Height Weight BMI Parity Method of conception Previous diagnosis of hypertension History of diabetes mellitus History of gestational diabetes History of PE History of fetal growth restriction MAP β-human chorionic gonadotropin PAPP-A Gestational age at screening Chronic hypertension Left uterine artery PI Right uterine artery PI Mean uterine artery PI |
| Novel electronic health records applied for prediction of pre-eclampsia: Machine-learning algorithms [19] | All features: Maternal age BMI Mean BP Maternal abdominal circumference Gravidity Parity PE in a previous pregnancy Prior cesarean delivery Pregnancy interval Nulliparity Multifetal gestations Assisted reproductive technology Pre-pregnancy diabetes Heart disease Thyroid disease Renal disease Autoimmune diseases Mental disorder Uterine leiomyoma Adenomyosis Uterine malfunctions History of seizure disorder Family history of hypertension Hemoglobin White blood cell count Platelet counts Direct bilirubin Total bilirubin Alanine aminotransferase Γ-glutamyl transferase Total protein Albumin Globulin Fasting plasma glucose Total bile acid Creatinine Serum urea nitrogen Serum uric acid Baseline risk features: Nulliparity Multifetal gestations PE in a previous pregnancy Pre-gestational diabetes BMI Maternal age Assisted reproductive technology Kidney diseases Autoimmune diseases Questionnaire features: Family history of hypertension Nulliparity Prior cesarean delivery Pregnancy interval Multifetal gestations Assisted reproductive technology Gravidity Parity Pre-gestational diabetes Heart disease Thyroid disease Renal disease Autoimmune diseases Mental disorder Uterine leiomyoma Adenomyosis Uterine malfunctions History of seizure disorder Maternal age BMI |
| Early prediction of preeclampsia via machine learning [28] | Maternal age Height weight Blood pressure: Mean systolic Mean diastolic Maximum systolic Maximum diastolic Race Ethnicity: Hispanic Non-Hispanic unknown Gravida: Nulliparous Multiparous Number of babies Medical history: PE Assisted reproductive treatment Chronic hypertension Diabetes (type I or type II) Obesity Renal disease Autoimmune conditions: Systemic lupus erythematosus Discoid lupus erythematosus Systemic sclerosis Rheumatoid arthritis Dermatomyositis Polymyositis Undifferentiated connective tissue disease Celiac disease Antiphospholipid syndrome Sexually transmitted diseases (human papillomavirus, chlamydia, genital herpes) Hyperemesis gravidarum Headache Migraine Poor obstetrics history Poor obstetrics history Medical history at 17 weeks of gestation: Gestational diabetes Anemia High-risk pregnancy Routine prenatal laboratory results: Protein from urine Glucose from urine Platelet count Red blood cells White blood cells Creatinine Hemoglobin Hematocrit Monocytes Lymphocytes Eosinophils Neutrophils Basophils Blood type with Rh Uric acid Rubella Varicella Hepatitis B Syphilis Chlamydia Gonorrhea Intake of medication: Aspirin Nifedipine Aldomet Labetalol Insulin Glyburide Prednisone Azathioprine Plaquenil Heparin Levothyroxine Doxylamine Acyclovir |
| Clinical risk assessment in early pregnancy for preeclampsia in nulliparous women: A population based cohort study [30] | Multivariable regression model: Family history of PE Country of birth Method of conception Gestational length Maternal age Height Weight Smoking in early pregnancy Pre-existing diabetes mellitus Chronic hypertension Systemic lupus erythematosus MAP Backward selection model and RF model: Gestational length first examination in weeks Maternal age BMI MAP Capillary glucose Protein in urine Hemoglobin Previous miscarriage Previous ectopic pregnancy Infertility duration Family situation: Single Living together with partner Other Region of birth: Sweden Nordic countries (except Sweden) Europe (except of Nordic countries) Africa North America South America Asia Oceania Smoking 3 months before pregnancy Smoking at registration Snuff 3 months before pregnancy Snuff at registration Alcohol consumption three months before registration Alcohol consumption at registration Family history of PE Family history of hypertension Infertility: Without treatment Ovary simulation In vitro fertilization Cardiovascular disease Endocrine disease Pre-existing diabetes Thrombosis Psychiatric disease systemic lupus erythematosus Epilepsy Chronic hypertension Morbus Chron/ulcerous colitis Lung disease or asthma Chronic kidney disease Hepatitis Gynecological disease or operation Recurrent urinary tract infections Blood group |
| Artificial intelligence-assisted prediction of preeclampsia: Development and external validation of a nationwide health insurance dataset of the BPJS Kesehatan in Indonesia [20] | Demographic: Age Marriage Family role Member strata Member type International Classification of Diseases 10th Revision coded diagnoses: A codes B codes C codes D codes E codes F codes G codes H codes I codes J codes K codes L codes M codes N codes Infection-related codes: G0, H00, H01, H10, H15, H16, H20, H30, H60, H65, H66, H67, H68, H70, I0, J0, J1, J2, J40, J41, J42, J85, J86, K12, K2, K35, K36, K37, K5, K65, K67, K73, K80, K81, L0, M00, M01, M02, N7 Immune-related codes: B20, D8, E10, G35, G61, G70, I0, J30, J31, J32, J35, J45, L2, L50, M04, M05, M06, M15, M16, M17, M18, M19, M3, M65, N00, N01, N03, N04 Nervous system-related codes: A8, C7, G Eye-related codes: C69, H0, H1, H2, H3, H4, H5 Ear-related codes: C30, D02, H6, H7, H8, H9 Heat-related codes: C38, I2, I3, I4, I5 Respiratory system-related codes: A1, C0, C3, J Digestive system-related codes: A0, C0, C1, K0, K1, K3, K4, K5, K6 Skin and subcutaneous-related codes: B0, B1, B8, C43, C44, L Musculoskeletal system-related codes: C40, C41, M Urinary system-related codes: C64, C65, C66, C67, C68, N0, N1, N2, N3 Reproduction system-related codes: A5, A60, A61, A62, A63, A64, C51, C52, C53, C54, C55, C56, C57, C58, N7, N8 Liver and pancreas-related codes: B15, B16, B17, B19, C22, C23, C24, C25, K7, K8 Breast-related codes: C50, N6 Vascular-related codes: I1, I7, I8 |
| Ethnicity as a Factor for the Estimation of the Risk for Preeclampsia: A Neural Network Approach [21] | MAP Uterine pulsatility index PAPP-A Ethnicity Weight Height Smoking Alcohol consumption Previous PE Conception: Spontaneous Ovulation drug In vitro fertilization Medical condition of pregnant woman Drugs taken by the pregnant woman Gestation age Crown rump length Mother had PE |
| An early screening model for preeclampsia: utilizing zero-cost maternal predictors exclusively [29] | Pre-gestational BMI Age Height Chronic hypertension Nausea and vomiting in pregnancy Previous PE Gravidity Pre-gestational diabetes Multifetal pregnancy Menstrual cycle irregularity Previous miscarriage Scarred uterus Previous stillbirth Family history of hypertension Chronic renal disease Assisted reproductive technology |
| An imbalance-aware deep neural network for early prediction of preeclampsia [22] | Dataset 1: The International Classification of Diseases, 9th Revision, Clinical Modification: Obesity (V853, V854, 27800, 27801, 27803, 6491) Pregnancy resulting from assisted reproductive technology (V2385) Cocaine dependence (3042, 3056) Amphetamine dependence (3044, 3057) Gestational diabetes (6488) Pre-existing diabetes (250, 6480) Anxiety (3000) Anemia NOS (2859) Iron deficiency anemia (280) Other anemia (281) Depression (311) Primigravida at the extremes of maternal age (6595, V2381, V2383) Hemorrhagic disorders due to intrinsic circulating antibodies (2865) Systemic lupus erythematosus (7100) Lupus erythematosus (6954) Autoimmune disease not elsewhere classified (27949) Pure hypercholesterolemia (2720) Unspecified vitamin D deficiency (2689) Proteinuria (7910) Tobacco use disorder (3051, 6490) History of tobacco use (V1582) Hypertension (401) Hypertensive heart disease (402) Chronic venous hypertension (4593) Unspecified renal disease in pregnancy without mention of hypertension (404) Chronic kidney disease (585) Hypertensive kidney disease (403) Hypertensive heart and chronic kidney disease (404) Renal failure not elsewhere classified (586) Infections of genitourinary tract in pregnancy (6466) Urinary tract infection (5990) Pernal history of trophoblastic disease (V131) Supervision of high-risk pregnancy with history of trophoblastic disease (V231) Thrombophilia (28981) History of premature delivery (V1321) Hemorrhage in early pregnancy (640) Congenital abnormalities of the uterus including those complicating pregnancy, childbirth, or the puerperium (6540, 7522, 7523) Multiple gestations (651) Fetal growth restriction (764) Asthma (493) Obstructive sleep apnea (32723) Other cardiovascular diseases complicating pregnancy and childbirth or the puerperium (6486) Sickle cell disease (28260) Thyroid disease (240, 241, 242, 243, 244, 245, 246) Inadequate prenatal care (V237) Periodontal disease (523) Preeclampsia/eclampsia (6424, 6425, 6426, 6427) Dataset 2: The International Classification of Diseases, 10th Revision, Clinical Modification: The International Classification of Diseases, 9th Revision, Clinical Modification: Obesity (E66, O9921, O9981, O9984, Z683, Z684, Z713, Z9884) Pregnancy resulting from assisted reproductive technology (O0981) Cocaine dependence (F14, T405) Amphetamine dependence (F15, F19, P044, T4362) Gestational diabetes (O244, P700) Pre-existing diabetes (E10, E11, O240, O241, O243, O248, O249) Anxiety (F064, F41) Anemia NOS (D51) Iron deficiency anemia (D50) Other anemia (D64, D59, D489, D53, O990) Depression (F32, F341, F33, F0631, Z139, Z1331, Z1332) Primigravidas at the extremes of maternal age (O095, O096) Hemorrhagic disorders due to intrinsic circulating antibodies (D683) Systemic lupus erythematosus (M32) Lupus erythematosus (L93, D6862) Autoimmune disease not elsewhere classified (D89) Pure hypercholesterolemia (E780) Unspecified vitamin D deficiency (E55) Proteinuria (D511, N06, O121, O122, R80) Current smoker (F172) Hypertension (G932, I10, I14, I15, I272, I674, I973, O10, O13, O16, R030) Hypertensive heart disease (I11) Chronic venous hypertension (I873) Unspecified renal disease in pregnancy without mention of hypertension (O2683, O9089) Chronic kidney disease (D631, E0822, E0922, E1922, E1122, E1322, N18) Hypertensive kidney disease (I12) Hypertensive heart and chronic kidney disease (I13) Renal failure not elsewhere classified (N19) Infections of genitourinary tract in pregnancy (O23, O861, O862, O868) Urinary tract infection (O0338, O0388, O0488, O0788, O0883, N136, N390, N99521, N99531) Pernal history of trophoblastic disease (Z8759, O01) Supervision of high-risk pregnancy with history of throphoblastic disease (O091) Thrombophilia (D685, D686) History of premature delivery (Z8751) Hemorrhage in early pregnancy (O20) Congenital abnormalities of the uterus including those complicating pregnancy, childbirth, or the puerperium (O34, O340) Multiple gestations (O30) Fetal growth restriction (O093) Other cardiovascular diseases complicating pregnancy and childbirth or the puerperium (O9943) Sickle cell disease (D57) Thyroid disease (E00, E01, E02, E03, E04, E05, E06, E07) Inadequate prenatal care (O093) Periodontal disease (E08630, E09630, E10630, E11630, E13630, K05, K06, K08129) Preeclampsia/eclampsia (O14, O15)Dataset 3: Acute renal failure Asthma Autoimmune diseases Bacterial vaginosis Chronic kidney disease CNS abnormality (spina bifida, congenital hydrocephalus, multiple diagnostic codes, microcephaly, other congenital illness) Chlamydia Chronic hypertension Cocaine Condylomata Congenital syphilis Depression Diabetes (unspecified prior diabetes, type I, type II, gestational diabetes, none) Gestational hypertension Gonococcal infection Group B streptococcus Heart failure Hemorrhagic disorder Hepatitis B infection Maternal herpes infection or history of herpes Personal history of trophoblastic disease History of infertility History of premature delivery High-risk pregnancy with history of trophoblastic disease Hyperemesis gravidarum Periodontal disease Previous cesarean Primigravida Proteinuria Repeat cesarean Sickle cell anemia with crisis Internal injuries of thorax, abdomen, and pelvis Thrombocytopenia (other, disseminated intravascular coagulation, gestational, none) Thrombophilia Kidney disease (lupus nephritis, pyelonephritis, glomerulonephritis, transplant, nephrotic syndrome, nephrolithiasis, multiple diagnostic codes, other, none) Anemia without hemoglobinopathy (folate deficiency anemia, unspecified anemia, B2 deficiency anemia, iron deficiency anemia, none) Collagen vascular disease (multiple diagnostic codes, rheumatoid arthritis, lupus, none) Hemoglobinopathy (hemoglobin-SC, alpha thalassemia, beta thalassemia, hemoglobin-SS, hemoglobin-Sthal, sickle cell trait, none) Maternal liver, gall bladder, or pancreatic illness (hepatitis A, liver transplant, pancreatitis, other, hepatitis B, cholelithiasis, hepatitis C, none) Structural heart disease (artificial valves, myocarditis/cardiomyopathy, rheumatic heart disease, other, valve disorder, congenital heart disease, none) Marijuana use Maternal neuromuscular disease (cerebral palsy, myotonic dystrophy, myasthenia gravis, multiple sclerosis, none) Operations on heart and pericardium Opioid abuse Other substance abuse (hallucinogens, sedatives/hypnotics/anxiolytics, stimulants, anti-depressants/other psychoactive, alcohol, multiple diagnostic codes, other, none) Total number of pregnancies Deliveries prior to admission Total abortions MAP Previous incidents of high blood pressure |
| Prediction model development of late-onset preeclampsia using machine learning-based methods [31] | Systolic blood pressure Serum blood urea nitrogen Serum creatinine Platelet counts Potassium White blood cell Calcium Spot urine protein to creatinine ratio Aspartate transaminase Magnesium TCO2 Alanine transaminase Urine albumin to creatinine ratio |
| Neural networks to estimate the risk for preeclampsia occurrence [23] | MAP Uterine pulsatility index Serum PAPP-A Ethnicity Weight Height Smoking Alcohol consumption Previous PE Method of conception: Spontaneous Ovulation drug In vitro fertilization Medical condition Drugs taken Gestational age in days Crown rump length Mother of the pregnant woman’s history of PE |
Appendix B
This appendix provides information concerning the quality of the datasets used within the included studies. It offers insight into the use of different types of datasets, handling of class imbalance, and management of missing data.
Table A2.
The datasets listed within the included studies are divided into training, validation, test, and external validation sets. The information extracted from the studies includes the type, size, and balance of the dataset, as well as whether the dataset was imbalanced and if this was addressed. Additionally, the performance of the machine learning models was extracted, detailing which dataset the performance was based on and the use of performance metrics. If the information was not provided within the study, it is reported as “NA”. For columns that do not apply to a given dataset, it is denoted as “-”. Abbreviations used: cross-validation (CV).
| Study | Dataset | Size | Balance | Data Splitting | Quality | Class Imbalance | Performance |
|---|---|---|---|---|---|---|---|
| [13] | Test set | 417 | Imbalanced: 7.9% PE | - | NA | NA | Non-standardized reporting used, but is interpreted to be TP and FP. Does not highlight metric trade-offs but interpret their results. |
| [14] | Training set | 1634 | Imbalanced: 16.5% PE | Leave one out CV | Missing data were replaced with the mode (categorical) and average (numerical). | NA | The performance is based on CV. Used standardized performance metrics. Does not interpret the results of the different metrics. |
| [15] | Training set | 1125 | Imbalanced: 7.8% PE | 5-fold CV | Missing data were replaced with the mean (continuous variables) and assumed false (binary variables) | NA | The performance is based on CV. Using standardized metrics. Does not interpret the results of the different metrics. |
| [16] | Training set | 98,241 | NA | 5-fold CV | NA | NA | - |
| Validation set | 22,511 | NA | NA | NA | - | ||
| Test set | 7705 | Imbalanced: 5.9% PE | - | NA | NA | Used standardized performance metrics. Does not interpret the results of the different metrics. | |
| [17] | Training set | 1272 | Imbalanced: 18% PE | 70%/30% random split performed 20 times | NA | NA | - |
| Validation set | 546 | Imbalanced: 26% PE | NA | Created a weighted average to be used for imbalanced dataset. | The performance is based on the average of the 20 iterations and reported as macro average and weighted average. Used standardized performance metrics. Does not highlight metric trade-offs or interpret the results of the different metrics used. | ||
| [18] | Training set | 9945 | Imbalanced: 1.3% PE | 10-fold CV. | Standardized the data and removed patients with missing data. | Use the synthetic minority over-sampling technique. Leaving out features with no occurrence within the PE group. - | - |
| Validation set | 1105 | The performance is based on CV. Used standardized metrics. Interpret the performance metrics. | |||||
| [19] | Training set | NA | Imbalanced: 5.1% PE | Split by time, where the first part was used to train using a nested CV (5-fold CV in both an outer and inner loop), second part used for validation set. | Used complete data. | The weight assignment of 1:19 ratio was used. | - |
| Temporal validation set | NA | - | Used standardized performance metrics. Does not interpret the results of the different metrics. | ||||
| [20] | Training set | 20,975 | Imbalanced: 14.6% PE | 10-fold CV and 10-time bootstrapped external validation. | Normalized continuous variables | Using geographical and temporal randomization to avoid ethnic and seasonal effect on preeclampsia. Naïve random sampling was used to oversample the minority outcome with replacement. | - |
| Geographical split—external validation set | 1322 | Imbalanced: 11% PE | - | - | - | Used standardized performance metrics. Does not highlight metric trade-offs or interpret the results of the different metrics. | |
| Temporal split—external validation set | 904 | Imbalanced: 13.2% PE | - | - | - | Used standardized performance metrics. Does not highlight metric trade-offs or interpret the results of the different metrics. | |
| [21] | Training set | 6793 | Imbalanced: 1.7% PE | NA | NA | NA | - |
| Test set | 36 | Balanced: 44% PE | NA | - | - | - | |
| Validation set | 9 | Balanced: 56% PE | - | - | - | Non-standardized reporting used. Does not highlight metric trade-offs but interpret their results. | |
| [22] | Training set | 360,943 | Imbalanced: 4% PE | 10-fold CV repeated 5 times. | Continuous variables were normalized. Multiple Imputation technique using Bayesian ridge regression was used to estimate missing values. Used a 20% drop-out rate in training. | Used weighted cross-entropy loss and alpha-balanced focal loss function, respectively, on a deep neural network | Performance is based on CV. Used standardized performance metrics. Does not interpret the results of the different metrics. |
| Training set | 84,632 | Imbalanced: 5.6% PE | 10-fold CV repeated 5 times. | Continuous variables were normalized. Multiple Imputation technique using Bayesian ridge regression was used to estimate missing values. Used a 20% drop-out rate in training. | Used weighted cross-entropy loss and alpha-balanced focal loss function, respectively, on a deep neural network | Performance is based on CV. Used standardized performance metrics. Does not interpret the results of the different metrics. | |
| Training set | 31,431 | Imbalanced: 8.7% PE | 10-fold CV repeated 5 times. | Normalized numerical and continuous variables. Features missing in >20% were removed and local outlier factor was used to remove outliers. Multiple Imputation technique using Bayesian ridge regression was used to estimate missing values. Used a 20% drop-out rate in training. | Used weighted cross-entropy loss and alpha-balanced focal loss function, respectively, on a deep neural network | Performance is based on CV. Used standardized performance metrics. Does not interpret the results of the different metrics. | |
| [23] | Training set | 6793 | Imbalanced: 1.4% PE | NA | NA | NA | - |
| Test set | 36 | Balanced: 44% PE | NA | - | - | - | |
| Validation set | 9 | Balanced: 56% PE | - | - | - | Non-standardized reporting used. Does not highlight metric trade-offs but interpret their results. | |
| [24] | Training set | 1068 | Imbalanced: 4.1% PE | Used fifty iterations to identify a stable model | Biomarker values were normalized to multiples of the median. Excluded women taking aspirin. | NA | - |
| Validation set | 914 | - | - | NA | - | ||
| Test set | 1068 | - | - | - | Used standardized performance metrics. Does not highlight metric trade-offs or interpret the results of the different metrics. | ||
| [25] | External validation set | 10,110 | Imbalanced: 2.3% PE | - | Categorical values were not normalized but used one-hot encoding. Scaling of the PlGF values were performed to obtain similar average and variance between the PlGF analyzing machines. | - | Used standardized performance metrics. Does not highlight metric trade-offs or interpret the results of the different metrics. |
| [27] | Training set | 70 | Balanced: 50% PE | 5-fold CV | NA | NA | - |
| Validation set | 163 | - | - | Used standardized performance metrics. Does not interpret the results of the different metrics. | |||
| [28] | Training set | 5245 | Imbalanced: 10.7% PE | 4-fold CV repeated 5 times | Missing categorical values was made into a new category. Missing numeric values were replaced with the mean | NA | The performance is based on CV. Used standardized performance metrics. Does not highlight metric trade-offs but interpret the results of the metrics. |
| [29] | Training set | 25,709 | Imbalanced: 6.4% PE | 5-fold CV | Features with missing values were removed. | Used the different variants of random under sampling and Gaussian mixture model to find the best solution for class imbalance. | - |
| External validation set | 1760 | Imbalanced: 9% PE | - | - | - | Used standardized performance metrics. Does not interpret the results of the different metrics. | |
| [30] | Training set | 62,562 | Imbalanced: 4.4% PE | 10-fold CV and bootstrap | Used single-chained imputation for missing values replacing with the mean | NA | The performance is based on CV. Used standardized performance metrics. Does not highlight metric trade-offs or interpret the results of the different metrics. |
| [31] | Training set | 7704 | Imbalanced: 4.7% PE | Random split | Used multiple imputation | NA | - |
| Validation set | 3302 | - | - | - | Used standardized performance metrics. Does not highlight metric trade-offs or interpret the results of the different metrics. |
References
- Duley, L. The Global Impact of Pre-eclampsia and Eclampsia. Semin. Perinatol. 2009, 33, 130–137. [Google Scholar] [CrossRef] [PubMed]
- Magee, L.A.; Nicolaides, K.H.; von Dadelszen, P. Preeclampsia. N. Engl. J. Med. 2022, 386, 1817–1832. [Google Scholar] [CrossRef] [PubMed]
- Van Doorn, R.; Mukhtarova, N.; Flyke, I.P.; Lasarev, M.; Kim, K.; Hennekens, C.H.; Hoppe, K.K. Dose of aspirin to prevent preterm preeclampsia in women with moderate or high-risk factors: A systematic review and meta-analysis. PLoS ONE 2021, 16, e0247782. [Google Scholar] [CrossRef] [PubMed]
- O’Gorman, N.; Wright, D.; Syngelaki, A.; Akolekar, R.; Wright, A.; Poon, L.C.; Nicolaides, K.H. Competing risks model in screening for preeclampsia by maternal factors and biomarkers at 11–13 weeks gestation. Am. J. Obstet. Gynecol. 2016, 214, e1–e103. [Google Scholar] [CrossRef] [PubMed]
- Hackelöer, M.; Schmidt, L.; Verlohren, S. New advances in prediction and surveillance of preeclampsia: Role of machine learning approaches and remote monitoring. Arch. Gynecol. Obstet. 2023, 308, 1663–1677. [Google Scholar] [CrossRef]
- Wright, D.; Gallo, D.M.; Gil Pugliese, S.; Casanova, C.; Nicolaides, K.H. Contingent screening for preterm pre-eclampsia. Ultrasound Obstet. Gynecol. 2016, 47, 554–559. [Google Scholar] [CrossRef]
- Ranjbar, A.; Montazeri, F.; Ghamsari, S.R.; Mehrnoush, V.; Roozbeh, N.; Darsareh, F. Machine learning models for predicting preeclampsia: A systematic review. BMC Pregnancy Childbirth 2024, 24, 6. [Google Scholar] [CrossRef]
- Brunelli, V.B.; Prefumo, F. Quality of first trimester risk prediction models for pre-eclampsia: A systematic review. BJOG 2015, 122, 904–914. [Google Scholar] [CrossRef]
- Bertini, A.; Salas, R.; Chabert, S.; Sobrevia, L.; Pardo, F. Using Machine Learning to Predict Complications in Pregnancy: A Systematic Review. Front. Bioeng. Biotechnol. 2022, 9, 780389. [Google Scholar] [CrossRef]
- Page, M.J.; McKenzie, J.E.; Bossuyt, P.M.; Boutron, I.; Hoffmann, T.C.; Mulrow, C.D.; Shamseer, L.; Tetzlaff, J.M.; Akl, E.A.; Brennan, S.E.; et al. The PRISMA 2020 statement: An updated guideline for reporting systematic reviews. Syst. Rev. 2021, 10, 89. [Google Scholar] [CrossRef]
- Ao, C.; Zhou, W.; Gao, L.; Dong, B.; Yu, L. Prediction of antioxidant proteins using hybrid feature representation method and random forest. Genomics 2020, 112, 4666–4674. [Google Scholar] [CrossRef] [PubMed]
- Moons, K.G.; Wolff, R.F.; Riley, R.D.; Whiting, P.F.; Westwood, M.; Collins, G.S.; Reitsma, J.B.; Kleijnen, J.; Mallett, S. PROBAST: A tool to assess risk of bias and applicability of prediction model studies: Explanation and elaboration. Annals of Internal Medicine. Am. Coll. Physicians 2019, 170, W1–W33. [Google Scholar]
- Velikova, M.; Lucas, P.J.F.; Spaanderman, M. A Predictive Bayesian Network Model for Home Management of Preeclampsia. In Artificial Intelligence in Medicine AIME 2011 Lecture Notes in Computer Science; Peleg, M., Lavrač, N., Combi, C., Eds.; Springer: Berlin/Heidelberg, Germany, 2011; Volume 6747, pp. 179–183. [Google Scholar]
- Martínez-Velasco, A.; Martínez-Villaseñor, L.; Miralles-Pechuán, L. Machine learning approach for pre-eclampsia risk factors association. In Proceedings of the 4th EAI International Conference on Smart Objects and Technologies for Social Good, Bologna, Italy, 28–30 November 2018; Association for Computing Machinery: New York, NY, USA, 2018; pp. 232–237. [Google Scholar]
- Kovacheva, V.P.; Eberhard, B.W.; Cohen, R.Y.; Maher, M.; Saxena, R.; Gray, K.J. Preeclampsia Prediction Using Machine Learning and Polygenic Risk Scores from Clinical and Genetic Risk Factors in Early and Late Pregnancies. Hypertension 2024, 81, 264–272. [Google Scholar] [CrossRef] [PubMed]
- Eberhard, B.W.; Cohen, R.Y.; Rigoni, J.; Bates, D.W.; Gray, K.J.; Kovacheva, V.P. An Interpretable Longitudinal Preeclampsia Risk Prediction Using Machine Learning. medRxiv [Internet]. 2023 Aug 16. Available online: http://www.ncbi.nlm.nih.gov/pubmed/37645797 (accessed on 22 February 2024).
- Li, Z.; Xu, Q.; Sun, G.; Jia, R.; Yang, L.; Liu, G.; Hao, D.; Zhang, S.; Yang, Y.; Li, X.; et al. Dynamic gestational week prediction model for pre-eclampsia based on ID3 algorithm. Front. Physiol. 2022, 13, 1035726. [Google Scholar] [CrossRef]
- Liu, M.; Yang, X.; Chen, G.; Ding, Y.; Shi, M.; Sun, L.; Huang, Z.; Liu, J.; Liu, T.; Yan, R.; et al. Development of a prediction model on preeclampsia using machine learning-based method: A retrospective cohort study in China. Front. Physiol. 2022, 13, 896969. [Google Scholar] [CrossRef]
- Li, Y.X.; Shen, X.P.; Yang, C.; Cao, Z.Z.; Du, R.; Wang, J.P.; Wang, M. Novel electronic health records applied for prediction of pre-eclampsia: Machine-learning algorithms. Pregnancy Hypertens. 2021, 26, 102–109. [Google Scholar] [CrossRef]
- Sufriyana, H.; Wu, Y.W.; Su, E.C.Y. Artificial intelligence-assisted prediction of preeclampsia: Development and external validation of a nationwide health insurance dataset of the BPJS Kesehatan in Indonesia. EBioMedicine 2020, 54, 102710. [Google Scholar] [CrossRef]
- Neocleous, C.; Nicolaides, K.; Neokleous, K.; Schizas, C. Ethnicity as a Factor for the Estimation of the Risk for Preeclampsia: A Neural Network Approach. In Proceedings of the Artificial Intelligence: Theories, Models and Applications: 6th Hellenic Conference on AI, SETN 2010, Athens, Greece, 4–7 May 2010; LNAI; Springer: Berlin/Heidelberg, Germany, 2010; Volume 6040. [Google Scholar]
- Bennett, R.; Mulla, Z.D.; Parikh, P.; Hauspurg, A.; Razzaghi, T. An imbalance-aware deep neural network for early prediction of preeclampsia. PLoS ONE 2022, 17, e0266042. [Google Scholar] [CrossRef]
- Neocleous, C.K.; Anastasopoulos, P.; Nikolaides, K.H.; Schizas, C.N.; Neokleous, K.C. Neural networks to estimate the risk for preeclampsia occurrence. In Proceedings of the IEEE International Joint Conference on Neural Networks, Atlanta, GA, USA, 14–19 June 2009; pp. 2221–2224. [Google Scholar]
- Torres-Torres, J.; Villafan-Bernal, J.R.; Martinez-Portilla, R.J.; Hidalgo-Carrera, J.A.; Estrada-Gutierrez, G.; Adalid-Martinez-Cisneros, R.; Rojas-Zepeda, L.; Acevedo-Gallegos, S.; Camarena-Cabrera, D.M.; Cruz-Martínez, M.Y.; et al. Performance of a machine learning approach for the prediction of pre-eclampsia in a middle-income country. Ultrasound Obstet. Gynecol. 2024, 63, 350–357. [Google Scholar] [CrossRef]
- Gil, M.M.; Cuenca-Gómez, D.; Rolle, V.; Pertegal, M.; Díaz, C.; Revello, R.; Adiego, B.; Mendoza, M.; Molina, F.S.; Santacruz, B.; et al. Validation of machine-learning model for first-trimester prediction of pre-eclampsia using cohort from PREVAL study. Ultrasound Obstet. Gynecol. 2024, 63, 68–74. [Google Scholar] [CrossRef]
- Ansbacher-Feldman, Z.; Syngelaki, A.; Meiri, H.; Cirkin, R.; Nicolaides, K.H.; Louzoun, Y. Machine-learning-based prediction of pre-eclampsia using first-trimester maternal characteristics and biomarkers. Ultrasound Obstet. Gynecol. 2022, 60, 739–745. [Google Scholar] [CrossRef] [PubMed]
- Melinte-Popescu, A.S.; Vasilache, I.A.; Socolov, D.; Melinte-Popescu, M. Predictive Performance of Machine Learning-Based Methods for the Prediction of Preeclampsia—A Prospective Study. J. Clin. Med. 2023, 12, 418. [Google Scholar] [CrossRef] [PubMed]
- Marić, I.; Tsur, A.; Aghaeepour, N.; Montanari, A.; Stevenson, D.K.; Shaw, G.M.; Winn, V.D. Early prediction of preeclampsia via machine learning. Am. J. Obstet. Gynecol. MFM 2020, 2, 100100. [Google Scholar] [CrossRef] [PubMed]
- Wang, L.; Ma, Y.; Bi, W.; Meng, C.; Liang, X.; Wu, H.; Zhang, C.; Wang, X.; Lv, H.; Li, Y. An early screening model for preeclampsia: Utilizing zero-cost maternal predictors exclusively. Hypertens. Res. 2024, 47, 1051–1062. [Google Scholar] [CrossRef]
- Sandström, A.; Snowden, J.M.; Höijer, J.; Bottai, M.; Wikström, A.K. Clinical risk assessment in early pregnancy for preeclampsia in nulliparous women: A population based cohort study. PLoS ONE. 2019, 14, e0225716. [Google Scholar] [CrossRef]
- Jhee, J.H.; Lee, S.; Park, Y.; Lee, S.E.; Kim, Y.A.; Kang, S.-W.; Kwon, J.-Y.; Park, J.T. Prediction model development of late-onset preeclampsia using machine learning-based methods. PLoS ONE 2019, 14, e0221202. [Google Scholar] [CrossRef]
- Zhou, Y.; Tu, F.; Sha, K.; Ding, J.; Chen, H. A Survey on Data Quality Dimensions and Tools for Machine Learning. arXiv 2024, arXiv:2406.19614. [Google Scholar]
- James, G.; Witten, D.; Hastie, T.; Tibshirani, R. Statistical Learning. In An Introduction to Statistical Learning with Applications in R, 2nd ed.; Springer: New York, NY, USA, 2023; pp. 15–58. [Google Scholar]
- Hardt, M.; Blum, A. The Ladder: A Reliable Leaderboard for Machine Learning Competitions. In Proceedings of the 32nd International Conference on Machine Learning, Lille, France, 6–11 July 2015; pp. 1006–1014. [Google Scholar]
- Kabongo, S.; D’Souza, J.; Auer, S. ORKG-Leaderboards: A systematic workflow for mining leaderboards as a knowledge graph. Int. J. Digit. Libr. 2024, 25, 41–54. [Google Scholar] [CrossRef]
- James, G.; Witten, D.; Hastie, T.; Tibshirani, R. Linear Regression. In An Introduction to Statistical Learning with Applications in R, 2nd ed.; Springer: New York, NY, USA, 2023; pp. 59–128. [Google Scholar]
- Lazdam, M.; de la Horra, A.; Diesch, J.; Kenworthy, Y.; Davis, E.; Lewandowski, A.J.; Szmigielski, C.; Shore, A.; Mackillop, L.; Kharbanda, R.; et al. Unique Blood Pressure Characteristics in Mother and Offspring after Early Onset Preeclampsia. Hypertension 2012, 60, 1338–1345. [Google Scholar] [CrossRef]
- Macdonald-Wallis, C.; Lawlor, D.A.; Fraser, A.; May, M.; Nelson, S.M.; Tilling, K. Preeclampsia Blood Pressure Change in Normotensive, Gestational Hypertensive, Preeclamptic, and Essential Hypertensive Pregnancies. Hypertension 2012, 59, 1241–1248. [Google Scholar] [CrossRef]
- Sculley, D.; Holt, G.; Golovin, D.; Davydov, E.; Phillips, T.; Ebner, D.; Chaudhary, V.; Young, M.; Crespo, J.-F.; Dennison, D. Hidden Technical Debt in Machine Learning Systems. Adv. Neural Inf. Process Syst. 2015, 2, 2503–2511. [Google Scholar]
- Baylor, D.; Breck, E.; Cheng, H.-T.; Fiedel, N.; Foo, C.Y.; Haque, Z.; Haykal, S.; Ispir, M.; Jain, V.; Koc, L. TFX: A TensorFlow-based production-scale machine learning platform. In Proceedings of the ACM SIGKDD International Conference on Knowledge Discovery and Data Mining. Association for Computing Machinery, Halifax, NS, Canada, 13–17 August 2017; pp. 1387–1395. [Google Scholar]
- Cheng, Y. Kubeflow: A Machine Learning Platform on Kubernetes. In Proceedings of the 21st International Middleware Conference, Delft, The Netherlands, 7–11 December 2020. [Google Scholar]
- Villarmizar, M. Evaluating the Impact of Cloud Resource Auto-scaling in Containerized Microservices. In Proceedings of the IEEE 7th International Conference on Cloud Computing Technology and Science, Vancouver, BC, Canada, 30 November–3 December 2015. [Google Scholar]
- Breck, E.; Cai, S.; Nielsen, E.; Salib, M.; Sculley, D. The ML Test Score: A Rubric for ML Production Readiness and Technical Debt Reduction. In Proceedings of the IEEE International Conference on Big Data (BIGDATA), Boston, MA, USA, 11–14 December 2017; pp. 1123–1132. [Google Scholar]
- Chen, Z. Continuous Integration and Continuous Deployment for Machine Learning. IEEE Trans Emerg Top Comput. 2021. [Google Scholar]
- Zaharia, M.; Chen, A.; Davidson, A.; Ghodsi, A.; Hong, S.A.; Konwinski, A.; Murching, S.; Nykodym, T.; Ogilvie, P.; Parkhe, M.; et al. Accelerating the Machine Learning Lifecycle with MLflow. IEEE Data Eng. Bull. 2018, 41, 39–45. [Google Scholar]
- Goodfellow, I.J.; Shlens, J.; Szegedy, C. Explaining and Harnessing Adversarial Examples. arXiv 2015, arXiv:14126572. [Google Scholar]
- Voigt, P.; von dem Bussche, A. The EU General Data Protection Regulation (GDPR): A Practical Guide [Internet]; Springer International Publishing: Cham, Switzerland, 2017; Available online: http://link.springer.com/10.1007/978-3-319-57959-7 (accessed on 19 September 2024).
- Villamizar, M. Microservices in the Cloud: Load Balancing Patterns and Best Practices. IEEE Cloud Comput. 2015, 2, 50–59. [Google Scholar]
- Amazon Web Services. AWS Auto Scaling. Available online: https://aws.amazon.com/autoscaling/ (accessed on 19 September 2024).
- Abadi, M.; Barham, P.; Chen, J.; Chen, Z.; Davis, A.; Dean, J.; Devin, M.; Ghemawat, S.; Irving, G.; Isard, M.; et al. TensorFlow: A System for Large-Scale Machine Learning. In Proceedings of the 12th USENIX Symposium on Operating Systems Design and Implementation. USENIX Association, Savannah, GA, USA, 2–4 November 2016; p. 786. [Google Scholar]
- Hummer, W.; Muthusamy, V.; Rausch, T.; Dube, P.; El Maghraoui, K.; Murthi, A. ModelOps: Cloud-based lifecycle management for reliable and trusted AI. In Proceedings of the 2019 IEEE International Conference on Cloud Engineering, IC2E 2019, Prague, Czech Republic, 24–27 June 2019; Institute of Electrical and Electronics Engineers Inc.: Piscataway, NJ, USA, 2019; pp. 113–120. [Google Scholar]
- Oprescu, A.; Miró-Amarante, G.; García-Díaz, L.; Rey, V.; Chimenea-Toscano, A.; Martínez-Martínez, R.; Romero-Ternero, M. Towards a data collection methodology for Responsible Artificial Intelligence in health: A prospective and qualitative study in pregnancy. Inf. Fusion 2022, 83–84, 53–78. [Google Scholar] [CrossRef]
- High-Level Expert Group on Artificial Intelligence. Ethics guidelines for trustworthy AI [Internet]. European Commission. 2019. Available online: https://digital-strategy.ec.europa.eu/en/library/ethics-guidelines-trustworthy-ai (accessed on 28 August 2024).
- Oprescu, A.M.; Miró-Amarante, G.; García-Díaz, L.; Beltrán, L.M.; Rey, V.E.; Romero-Ternero, M. Artificial intelligence in pregnancy: A scoping review. IEEE Access 2020, 8, 181450–181484. [Google Scholar] [CrossRef]
- Clement, T.; Kemmerzell, N.; Abdelaal, M.; Amberg, M. XAIR: A Systematic Metareview of Explainable AI (XAI) Aligned to the Software Development Process. Mach. Learn. Knowl. Extr. 2023, 5, 78–108. [Google Scholar] [CrossRef]
- Mohammad Amini, M.; Jesus, M.; Fanaei Sheikholeslami, D.; Alves, P.; Hassanzadeh Benam, A.; Hariri, F. Artificial Intelligence Ethics and Challenges in Healthcare Applications: A Comprehensive Review in the Context of the European GDPR Mandate. Mach. Learn. Knowl. Extr. 2023, 5, 1023–1035. [Google Scholar] [CrossRef]
- Chiaburu, T.; Haußer, F.; Bießmann, F. Uncertainty in XAI: Human Perception and Modeling Approaches. Mach. Learn. Knowl. Extr. 2024, 6, 1170–1192. [Google Scholar] [CrossRef]
Disclaimer/Publisher’s Note: The statements, opinions and data contained in all publications are solely those of the individual author(s) and contributor(s) and not of MDPI and/or the editor(s). MDPI and/or the editor(s) disclaim responsibility for any injury to people or property resulting from any ideas, methods, instructions or products referred to in the content. |
© 2024 by the authors. Licensee MDPI, Basel, Switzerland. This article is an open access article distributed under the terms and conditions of the Creative Commons Attribution (CC BY) license (https://creativecommons.org/licenses/by/4.0/).