Abstract
The aim of our work was to study the structure of a typical modern cosmetic oil-in-water emulsion (o/w-emulsion), based on the emulsifier polyglyceryl-3 dicitrate/stearate and glycerylstearate/stearyl alcohol as consistency enhancer. We have used a systematic approach building up the cosmetic emulsion step by step, characterizing all systems by using Small Angle Neutron Scattering (SANS), Differential Scanning Calorimetry (DSC), Freeze Fracture Transmission Electron Microscopy (FF-TEM), light microscopy and rheology. The starting point was the pure emulsifier in water, which was shown to form lamellar stacked bilayers with a spacing of 7 nm, coexisting with polydisperse unilamellar vesicles in the sub-µm range. Upon addition of consistency enhancer, also multilamellar vesicles could be obtained. Then, oil has been added stepwise, until finally a complete cosmetic o/w-emulsion was obtained. In the final emulsion, oil droplets with sizes in the µm range are surrounded by multiple, irregularly spaced bilayer structures and vesicles. Approximately 30% of the water present in the system shows a restricted mobility (“encapsulated water”) according to PFG-NMR. Crucial for the viscosity build-up is the presence of the oil droplets; a cream-like consistency is obtained by steric interaction of oil droplets and crystalline bilayer structures in the aqueous phase of the emulsion.
Keywords:
emulsion; formulation; structure; bilayers; scattering; SANS; DSC; electron microscopy; FF-TEM; PFG-NMR spectroscopy 1. Introduction
Oil-in-water emulsions (o/w-emulsions) play a dominant role in cosmetic skin care products. They are used in different applications such as facial creams, body lotions, sun care lotions, antiperspirant/deo roll-ons or even in some make-up foundations. o/w-emulsions typically show a sensory profile that combines attributes such as easy distribution, quick absorption and a perception of low oiliness on the skin after application. Both sensory profile and application properties of such emulsions can be optimized by choosing suitable emulsifiers, consistency enhancers, oils, stabilizing polymers, particles and active ingredients. The classical way to stabilize cosmetic o/w-emulsions is a combination of a suitable o/w-emulsifier with consistency enhancers such as stearyl alcohol or glyceryl stearate. Such o/w-creams are classically prepared in a hot/hot process at temperatures between 70 and 85 °C, by combining the hot oil and water phases, followed by homogenization. Upon cooling, at temperatures between 55 and 30 °C, the cream-like viscosity is obtained.
Until today, the structure of such cosmetic o/w-emulsions is typically explained with the four-phase-system model by Junginger [1]. In the late 1970s, Junginger et al. studied the structure of a water-containing hydrophilic o/w-based ointment (“DAB 7”) [2] as it is used for pharmaceutical applications. They also investigated the structure of the individual components themselves [3] systematically by means of X-ray investigations, using the Kiessing low angle technique. In addition, they looked into the structure of a hydrophilic ointment (“DAB 8”) using Freeze Fracture Transmission Electron Microscopy (FF-TEM) [4,5] as well as Differential Scanning Calorimetry (DSC) [6]. Apart from the water-containing hydrophilic ointment (“DAB 8”), they also studied a nonionic hydrophilic ointment (“DAC”) and a stearate cream [7] without any oil.
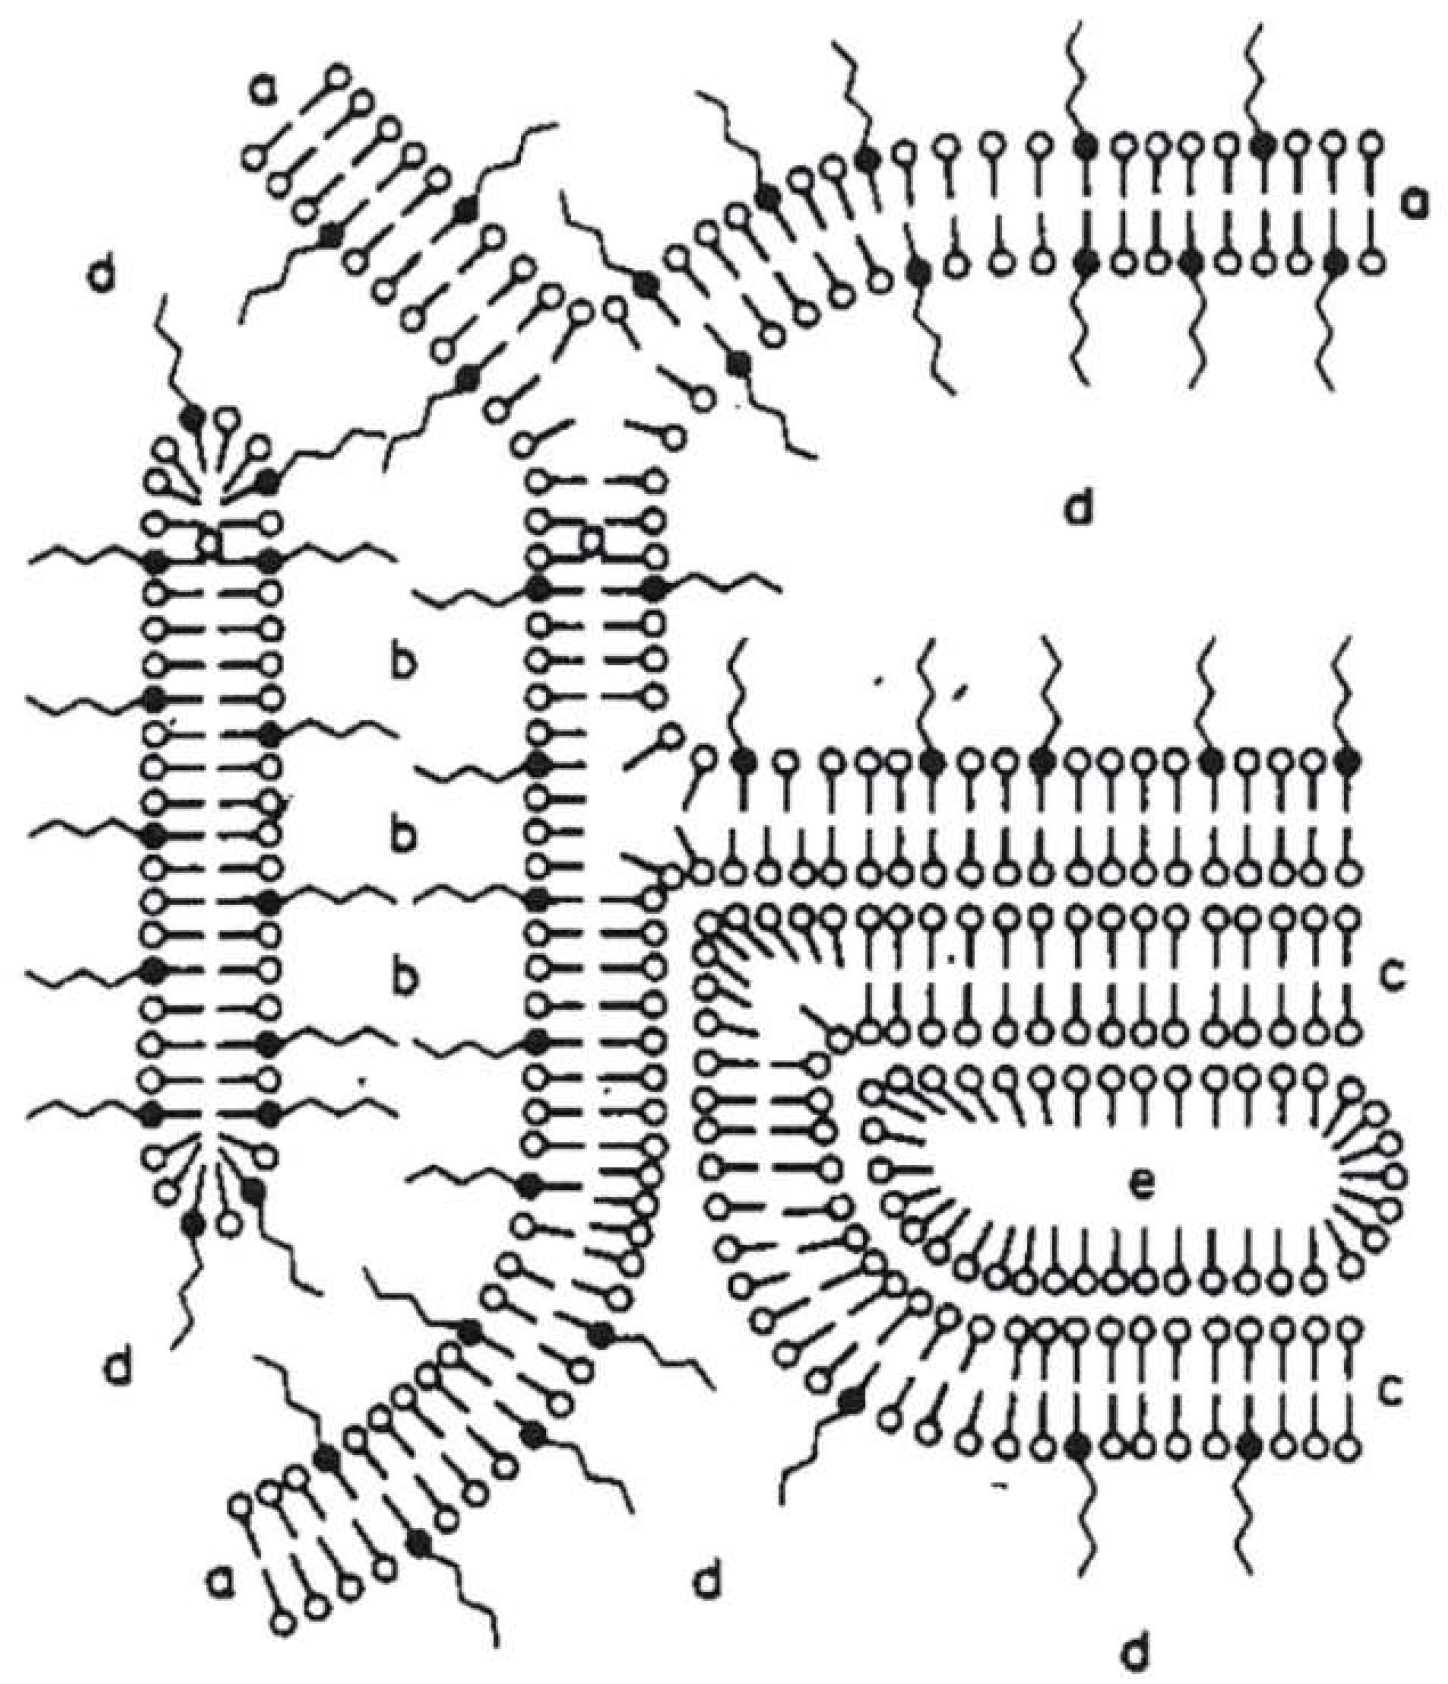
As a result, Junginger et al. proposed a four-phase-system for o/w-creams with a hydrophilic and a hydrophobic gel phase as the two dominant matrices in the system; Figure 1 represents the gel structures for a nonionic hydrophilic cream (“DAC”) [1]. The more hydrophilic bilayer (a) is a mixed crystal bilayer of emulsifier and consistency enhancer. Together with the water (b), the hydrophilic bilayer (a) forms the hydrophilic gel phase. The interlamellarly fixed water molecules in the hydrophilic gel phase are in equilibrium with the molecules of the bulk water phase (d), and both water phases together form the continuous phase of the o/w-system. Additionally, an excess of consistency enhancer forms lipophilic bilayers (c), which immobilize the oil phase (e) in the system. This model has basically been applied to all the three systems Junginger studied in a similar fashion and still constitutes the basic structural model for such systems.

Figure 1.
Schematic presentation of the gel structures of a nonionic hydrophilic cream (“DAC”) according to Junginger [1]: (a) mixed crystal bilayer of emulsifier and consistency enhancer, (b) interlamellarly fixed water, (c) bilayer of consistency enhancer, (d) bulk water, (e) oil phase. Reproduced with permission from Wissenschaftliche Verlagsgesellschaft mbH, Stuttgart/Germany.
In 1984, Müller-Goymann [8] investigated the structure of emulsions, creams and gels containing ethoxylated sterol emulsifiers. In her study she demonstrated the appearance of different mesophases depending on the concentration and the hydrophobicity of the emulsifiers by means of X-ray analysis, polarization microscopy and FF-TEM. Like Junginger et al., as a first step of her study she looked at binary mixtures of emulsifier and water as well as oil. It was found that at high emulsifier contents (e.g., 50–75 wt % emulsifier in water), the more hydrophobic emulsifiers form multilamellar vesicles with water, whereas the more hydrophilic emulsifiers tend to give a hexagonal liquid crystalline phase. Adding paraffin to these systems containing high amounts (e.g., 25–45 wt %) of hydrophobic emulsifier, the paraffin is supposed to be located in the inner core of the multilamellar vesicle. In case of the more hydrophilic emulsifiers, the oil droplets are dispersed in the hexagonal mesophase.
More recently, the microstructure of o/w-creams containing mixed emulsifiers, i.e., combinations of ionic or nonionic emulsifiers with fatty amphiphiles, was studied by Kónya et al. [9] using TEM, rheology and X-ray diffraction. In a system containing 4 wt % of the emulsifiers glyceryl stearate or PEG(20)-sorbitanstearate and 16 wt % of the fatty amphiphile cetearyl alcohol and water, the emulsifiers were reported to form micelles rather than mixed bilayers with the fatty amphiphile, whereas the bilayers should consist merely of the fatty amphiphile. In the resulting cream, 20 wt % of the oil isopropyl myristate was assumed to be entrapped inside the micelles as well as incorporated between the apolar chains of the fatty amphiphile. However, it is quite surprising why in an emulsion system containing 20 wt % of oil, micelles rather than emulsion droplets have been discussed.
Comparing the systems studied by Junginger et al., Müller-Goymann and Kónya et al. to modern cosmetic emulsions reveals some important differences. The classical ointment systems contained extremely high amounts of consistency enhancers (e.g., 5 wt % cetyl alcohol and 5 wt % stearyl alcohol in the “DAC” system or 16 wt % in the system studied by Kónya). In modern cosmetic emulsions, typically only 1–6 wt % consistency enhancers are used, and preferably part of the fatty alcohol is replaced by glyceryl stearate in order to provide a less waxy skin feel. Moreover, the emulsifier content in the “DAC” system was 7.5 wt % of PEG-(20)-stearate, which is also clearly above the typical emulsifier content of 1.5–5 wt % in modern cosmetic emulsions. Furthermore, Junginger’s stearate cream either did not contain any oil, or in the case of the “DAB” and “DAC” system only very heavy waxes (petrolatum, soft paraffin) or oils (liquid paraffin), which is a substantial difference to most formulations relevant in applications today. Hence, the structural build-up of the emulsion is not necessarily similar.
Taking into account that today’s cosmetic o/w-emulsions contain a rather high oil content of 10–25 wt %, the role of the oil droplets on the proposed structure of the emulsion might not be reflected properly by simply applying Junginger’s ointment model. In fact, the oil droplet depicted in Figure 1 is significantly below the droplet size in cosmetic emulsions, which is known to be typically in a range of 1–10 µm. The driving force for our studies was therefore to look into a typical modern cosmetic o/w-emulsion system based on the emulsifier polyglyceryl-3 dicitrate/stearate; questions to be addressed then were:
- Which types of structures can actually be found in such an emulsion system?
- What is the impact of the oil droplets on the viscosity build-up?
- Can lamellar bilayers be identified in the system and if yes, what kind of bilayers (lamellar phases, vesicles) are present there and what is their role in stabilizing the systems?
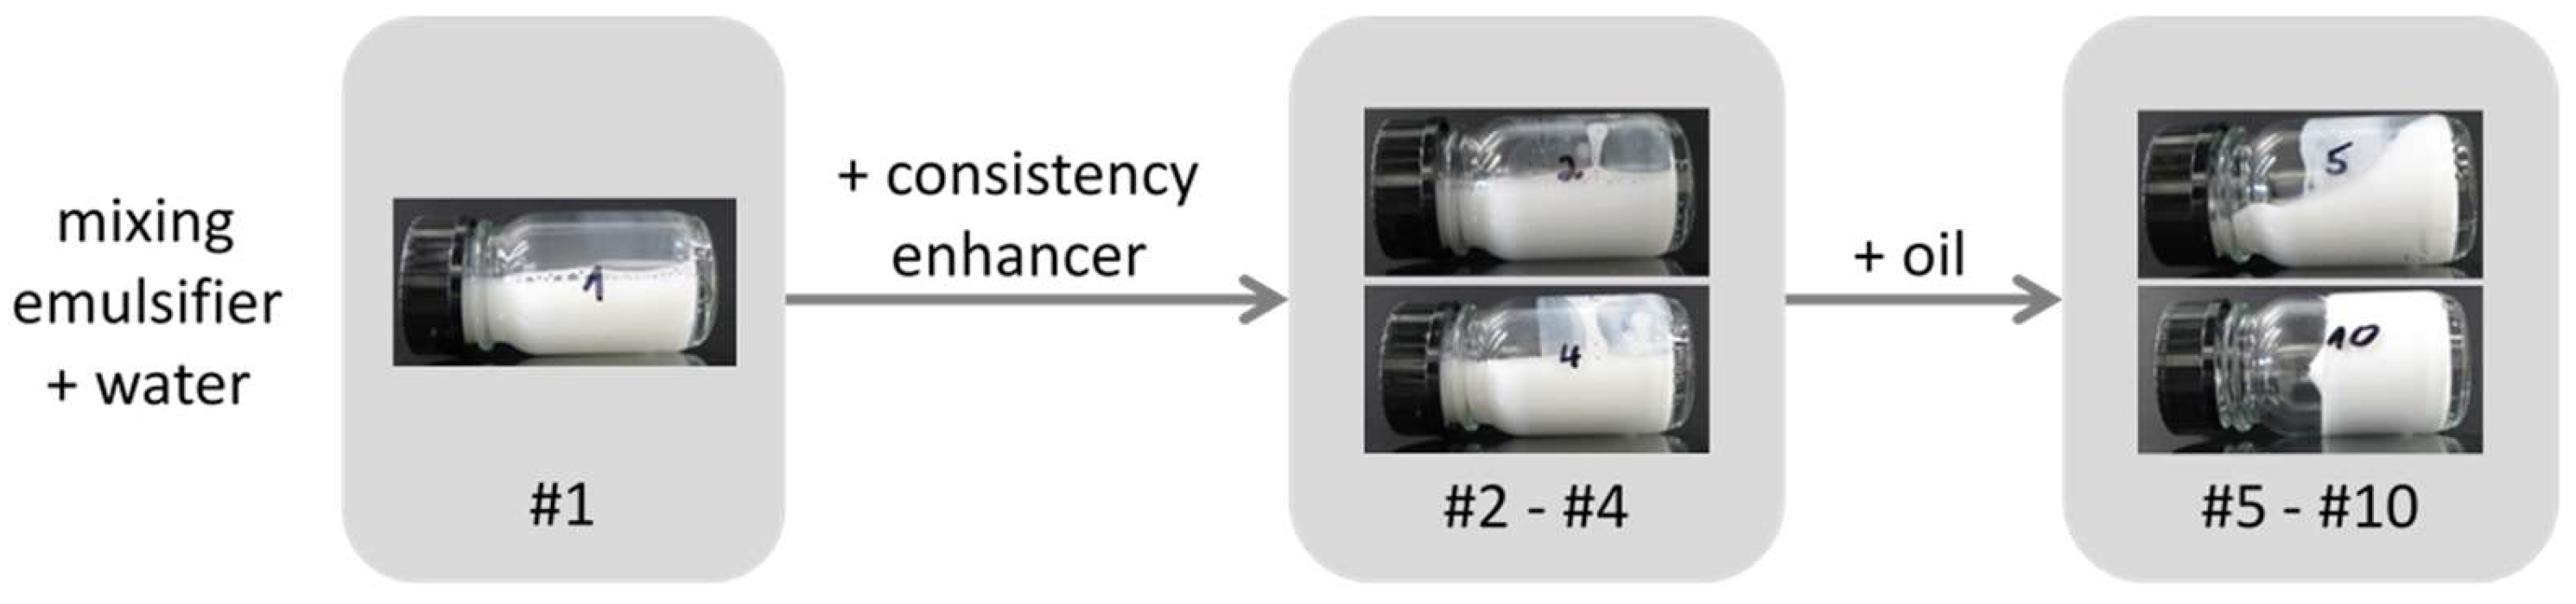
In order to study these questions thoroughly, in our experiments we were building up a cosmetic emulsion step by step in a systematic fashion, characterizing all systems by means of Small Angle Neutron Scattering (SANS), Differential Scanning Calorimetry (DSC), Freeze Fracture Transmission Electron Microscopy (FF-TEM) and rheological measurements in each step. The starting point was the pure emulsifier in water, then the consistency enhancer mixture was added stepwise, followed by a stepwise addition of the oil phase, until finally a complete cosmetic o/w-emulsion was obtained. With our approach, we expect to gain a systematic understanding of these technically relevant systems.
2. Materials and Methods
2.1. Materials
The emulsifier TEGO® Care PSC 3, the consistency enhancers TEGIN® M and TEGO® Alkanol 18 as well as the emollients (cosmetic oils) TEGOSOFT® OP and TEGOSOFT® DEC are commercial products of Evonik Nutrition and Care GmbH (Essen, Germany). TEGO® Care PSC 3 (INCI: Polyglyceryl-3 Dicitrate/Stearate; d = 1.00 g/cm3) is an esterification product of polyglycerol-3 with stearic acid and a minor amount of citric acid (Figure 2). The average degree of esterification is approximately 2 and the average molecular weight is approx. 700 g/mol. TEGIN® M (INCI: Glyceryl Stearate; d = 0.95 g/cm3) is a mono/diester of glycerol and stearic acid with a monoester content of approx. 60 wt %, the average molecular weight is approx. 500 g/mol. TEGO® Alkanol 18 is stearyl alcohol (molecular weight 270 g/mol; d = 0.81 g/cm3). TEGOSOFT® OP (INCI: Ethylhexyl Palmitate; d = 0.86 g/cm3) is an ester of palmitic acid and 2-ethylhexanol (molecular weight 368 g/mol). TEGOSOFT® DEC (INCI: Diethylhexyl Carbonate; d = 0.90 g/cm3) is a diester of carbonic acid and 2-ethylhexanol (molecular weight 268 g/mol). D2O (99.9% isotopic purity) was obtained from Euriso-top, Groupe CEA (Gif-sur-Yvette, France). All materials were used as received.
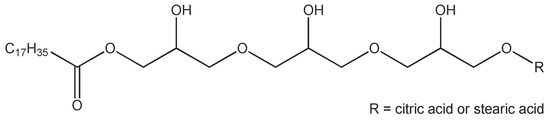
Figure 2.
Structure of Polyglyceryl-3 Dicitrate/Stearate (one schematic structure of a range of different molecular structures possible).
2.2. Sample Preparation
The emulsions were prepared by a standard hot/hot process in which both the oil phase and the water phase were heated to 75 °C and then mixed and homogenized for 90 seconds using an immersion blender (ESGE Zauberstab, Unold AG, Hockenheim, Germany). The resulting emulsion was cooled down to 25 °C in a water bath under gentle stirring. The composition of the samples is given in Table 1. For the investigation by Small Angle Neutron Scattering (SANS), samples were prepared in D2O using exactly the same preparation process as mentioned above, but replacing the H2O by an equivalent mass of D2O, i.e., using 76.29 g of D2O instead of 69 g of H2O.

Table 1.
Composition of the samples investigated (weights in g). Starting from pure emulsifier in water (#1), increasing amounts of consistency enhancers were added (#2–#4). In samples #5–#10, the amount of oil phase was increased until a composition of a stable emulsion of practical relevance (#10) was reached.
2.3. Optical Microscopy
The microstructure of the samples was followed with an optical microscope Olympus BH-2 (Olympus Optical Co. (Europa) GmbH, Hamburg, Germany) using Hoffmann Modulation Contrast (HMC) as well as Phase Contrast (PC) mode. Images were captured with a CCD camera (Tucsen TCA 5.0 color, Xintu Photonics Co. Ltd., Fuzhou, China).
2.4. Differential Scanning Calorimetry (DSC)
Phase transition temperatures and transition enthalpies were obtained using a Multi-Cell Differential Scanning Calorimeter (MC-DSC, TA-instruments, New Castle, DE, USA). The measurements were performed in a temperature range from 15 °C to 85 °C using a scan rate of 0.2 °C/min and equilibration times of 600 s at the upper and lower holding temperatures before each scan. As the samples prepared with D2O were used for the DSC measurements, the thermograms of D2O were used as reference and subtracted from the sample scan before defining the baseline. Baselines were defined with the help of the NanoAnalyze Data Analysis software (version 3.5.0, TA-instruments, New Castle, DE, USA) using a sigmoidal fit of the data corrected with the corresponding reference. Integration of the peaks above the baseline yielded the transition enthalpies.
2.5. Small Angle Neutron Scattering (SANS)
The SANS experiments were performed at the Helmholtz Zentrum Berlin (HZB, Berlin, Germany) on the instrument V4. The samples were prepared with D2O in order to achieve better contrast conditions. All measurements were carried out with a constant neutron wavelength (4.5 Å) at 3 different sample-detector distances (1, 4 and 16 m) allowing for the observation of the scattered intensity in a Q-range from 0.04 nm−1 to 5 nm−1. Absolute intensities were obtained by comparison with the scattering of a 1 mm water sample, after taking into account the scattering of the empty cell and correcting for the experimental transmission values, but not subtracting the incoherent background of the sample. All data reduction was done by means of the BerSANS program [10]. Every sample was measured at 25 °C, far below the expected melting region of the emulsifiers and consistency enhancers. The scattering experiments were carried out 24 h after preparation of the samples.
2.6. Pulsed Field Gradient NMR (PFG-NMR)
The PFG-NMR measurements are performed on a Bruker DRX 500 spectrometer (Bruker AG, Karlsruhe, Germany) equipped with a BAFPA 40 gradient amplifier and a Bruker DIFF30 probe with a deuterium lock system. The instrument is tuned to 500 MHz proton frequency, gradient pulses were adjusted to gradient strengths between 5 and 700 Gauss/cm with individual durations of 2 ms. For all measurements, the stimulated echo (90°-τ1-90°-τ2-90°-τ1-echo) was used in combination with the gradient pulses during each τ1 waiting period. The duration of the 90°-pulse was 8 µs, the waiting period between the 16 repetitions (scans) of each experiment amounted to 13 s. The spacing ∆ between the two gradient pulses was varied between 25 ms and 200 ms. The temperature of the sample is adjusted to 25 °C by the cooling system of the gradient unit.
The free induction decays resulting from the addition of each set of 96 experiments were Fourier transformed and analyzed for the echo signal decay vs. the gradient strength G and the pulse spacing Δ. Characteristic signals were chosen for the individual observation of 1,3-butylene glycol and water. For the analysis of the diffusion profile, the relative signal intensities I/I0 (I0 referring to the signal intensity at gradient strength G = 0) are plotted logarithmically vs. the parameter γ2G2δ2(Δ − δ/3), with γ being the gyromagnetic ratio of protons, G the strength of the pulsed field gradient, δ and Δ the duration of and the spacing between the two gradient pulses [11].
2.7. Freeze Fracture Transmission Electron Microscopy (FF-TEM)
The preparation of the freeze fracture replica for the transmission electron microscopy (TEM) investigations has been carried out following the description given in details in Burauer et al. [12] with some minor modifications applied to the copper plates forming the sandwich. In the present study, both halves of the sandwich copper plates have been fixed on the back side to the tips of reverse (self-closing) tweezers using a tiny droplet of superglue (Pattex WA97, Henkel, Germany). In this way, the sandwich can be easily opened allowing therefore a small amount of the sample to be applied to the grids inside the sandwich. By closing the sandwich, the sample was squished and the excess at the external corners and edges of the sandwich has been removed with filter paper. Shock-freezing in liquid ethane (−184 °C) of the sandwich assembly at room temperature was done using a cryobox (GA G34-215, Zeiss, Oberkochen, Germany) equipped with a spring-propelled plunging rod. The fracture of the frozen samples and the replication of the fractured surfaces occurred in the same manner as described in Burauer et al. [12]. Platinum/carbon (Pt/C) was used as shadowing material for the replication of the fractured surfaces and the stabilization of the obtained 2 nm Pt/C-replication film was achieved with a 20 nm carbon film. Directly after the replication and stabilization, the on-grid prepared replica were dipped for cleaning in a dilute aqueous solution of a dishwashing detergent and washed several times with the detergent solution at 70 °C. The last cleaning steps were achieved using ethanol and finally with acetone.
The replica on copper grid was transferred into a LEO 912 Omega TEM equipped with an energy filter. The TEM was operating at 120 KV and “zero loss” conditions allowing a high image contrast enhancement. The digital acquisition of the electron micrographs has been performed using a cooled 2048 × 2048 CCD camera (TRS, Westkreis Moorenweis, Germany) corrected for gain and offset reference images (e.g., the shading correction of the camera). The remote control of the camera was achieved by using the iTEM acquisition software (version 2.1, Olympus Soft Imaging Solutions GmbH, Münster, Germany). The examination of the replica was first carried out at low magnification (315×) to collect images of meshes covered with replica film at different positions of the copper grids. Finally, at higher magnifications ranging between 10,000× and 25,000×, several of the covered meshes have been investigated to depict the structure of the samples. The multiple image alignment (MIA) feature of the iTEM-software has repeatedly been employed to cover large areas of the replica during image acquisition. MIA creates a high-resolution overview image, which results from a user-predefined number of single images around a region of interest. Depending on the different instrument magnification settings, surfaces of the replica in the order between 1 µm2 and 18 µm2 have been mapped.
2.8. Laser Diffraction
The droplet size distribution of the emulsions was obtained using a Beckman Coulter LS 230 laser diffraction particle size analyzer (Beckmann Coulter GmbH, Krefeld, Germany) with a Small Volume Module using water as working fluid at 25 °C. All measurements were performed in triplicate. The analysis and simulations of the optical parameters were performed by using the Beckman-Coulter software, version 3.29 and using the Fraunhofer model.
2.9. Rheology
The consistency of the samples in terms of their rheological properties has been examined by using both a Brookfield viscometer (Spindle C, 10 rpm) and a Stresstech Rheometer (Rheologica Instruments AB) using a plate geometry (40 mm diameter, 1.00 mm distance).
3. Results and Discussion
In our investigation, the final emulsion with a cream-like consistency has been built up consecutively in a systematic way, thereby examining the effects of the different ingredients separately. In order to obtain comprehensive structural information, the information from SANS, FF-TEM, PFG-NMR experiments and light microscopy has been combined.
3.1. Mixture of Emulsifier and Water (Sample #1)
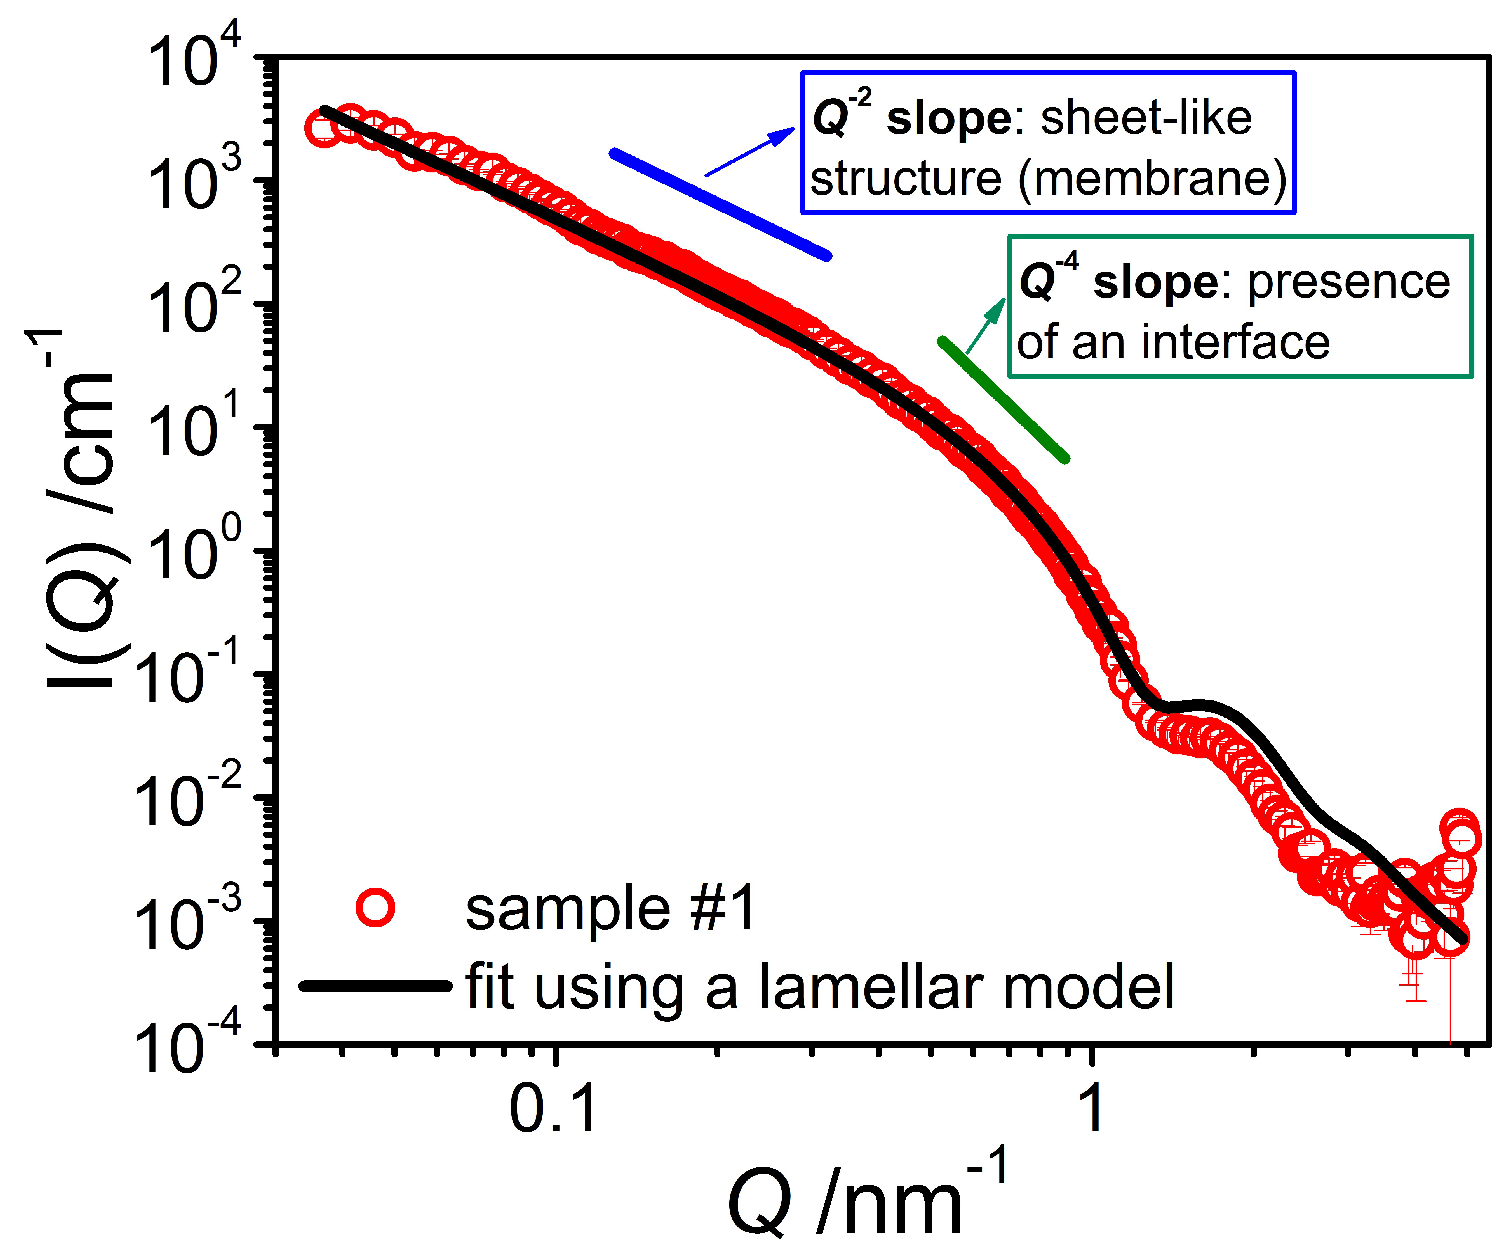
The first step was to study the binary mixture of the emulsifier with water by means of SANS measurements in D2O. The scattering curves of the pure system (Figure 3) exhibit a Q−4 behavior at high Q (Q > 0.4 nm−1) as well as a Q−2 dependence in the middle Q region, indicating the presence of sheet-like structures in the bulk, most likely emulsifier bilayers. The position of the form factor minimum, appearing at high Q, allows for the determination of an approximate bilayer thickness D of around 5 nm, as that minimum is expected to be at 2π/D. In order to obtain a more precise value for the membrane thickness, the scattering data were fitted with a model based on the form factor of lamella [13] having a homogeneous cross-section leading to a scattering intensity given by
where D is the thickness of the lamellae, η the scattering contrast and Φ the volume fraction of dispersed material. The polydispersity of the lamellar thickness was accounted for by using a lognormal distribution F(D) (with standard deviation σ) of the bilayer thickness D as it is commonly used for the fitting of scattering curves from polydisperse systems [14] and leading to the following equation for the overall intensity:
where F(D) is given by:
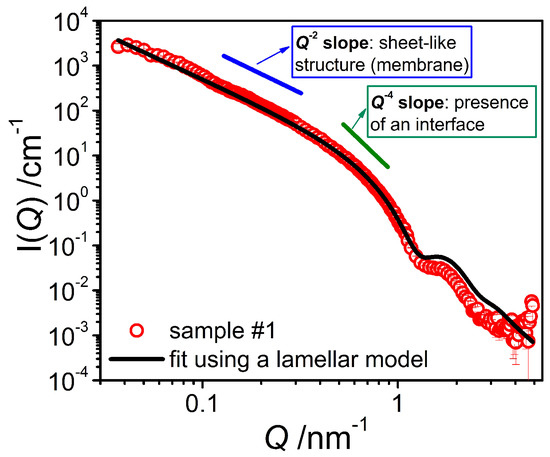
Figure 3.
SANS intensity I(Q) of the system containing only emulsifier in D2O (sample #1) at T = 25 °C. The fit was performed using a model for locally flat objects with a homogeneous bilayer cross section.
The scattering contrast η is given by the difference in scattering length density between object and the average of the sample, and can also be calculated from equating the experimentally determined scattering invariant (left side of Equation (4)) with its theoretical value (right side of Equation (4)):
Following this approach, we find a value for the scattering contrast of our structures of 6.4 × 10⁻⁴ nm−2, which is in good agreement with what one would expect from the composition of the samples and which confirms that all of the emulsifier is contained in the structures probed.
Applying Equation (2) to our experimental data and using the calculated scattering contrast allowed to obtain a good fit of the experimental data (Figure 3). From this fit we have determined the average bilayer thickness <D> to be 4.79 nm, which is a reasonable value considering the molecular length of the emulsifiers [15]. The polydispersity of the bilayer thickness (fitted with a log-normal distribution and using a wavelength smearing of 8% (FWHM)) is characterized by a standard deviation σ of 0.125. The continuing increase in intensity observed in the low Q range indicates that our window of observation was too small to enable the visualization of the entire objects. Hence, it can be estimated that the structural size of these bilayer structures must be larger than 150 nm, in agreement with the FF-TEM observation of larger vesicles.
The scattering length density distribution across the membrane was described here by a homogeneous function, as we only have access to an average value of the scattering contrast. The real scattering length density distribution of a bilayer membrane, however, is expected to be more complex than a sharp interface [16]. This explains the overestimation of the scattering intensity in the high Q range as seen in Figure 3, as such a diffuse interface leads to a sharper decrease of the scattering intensity [17].
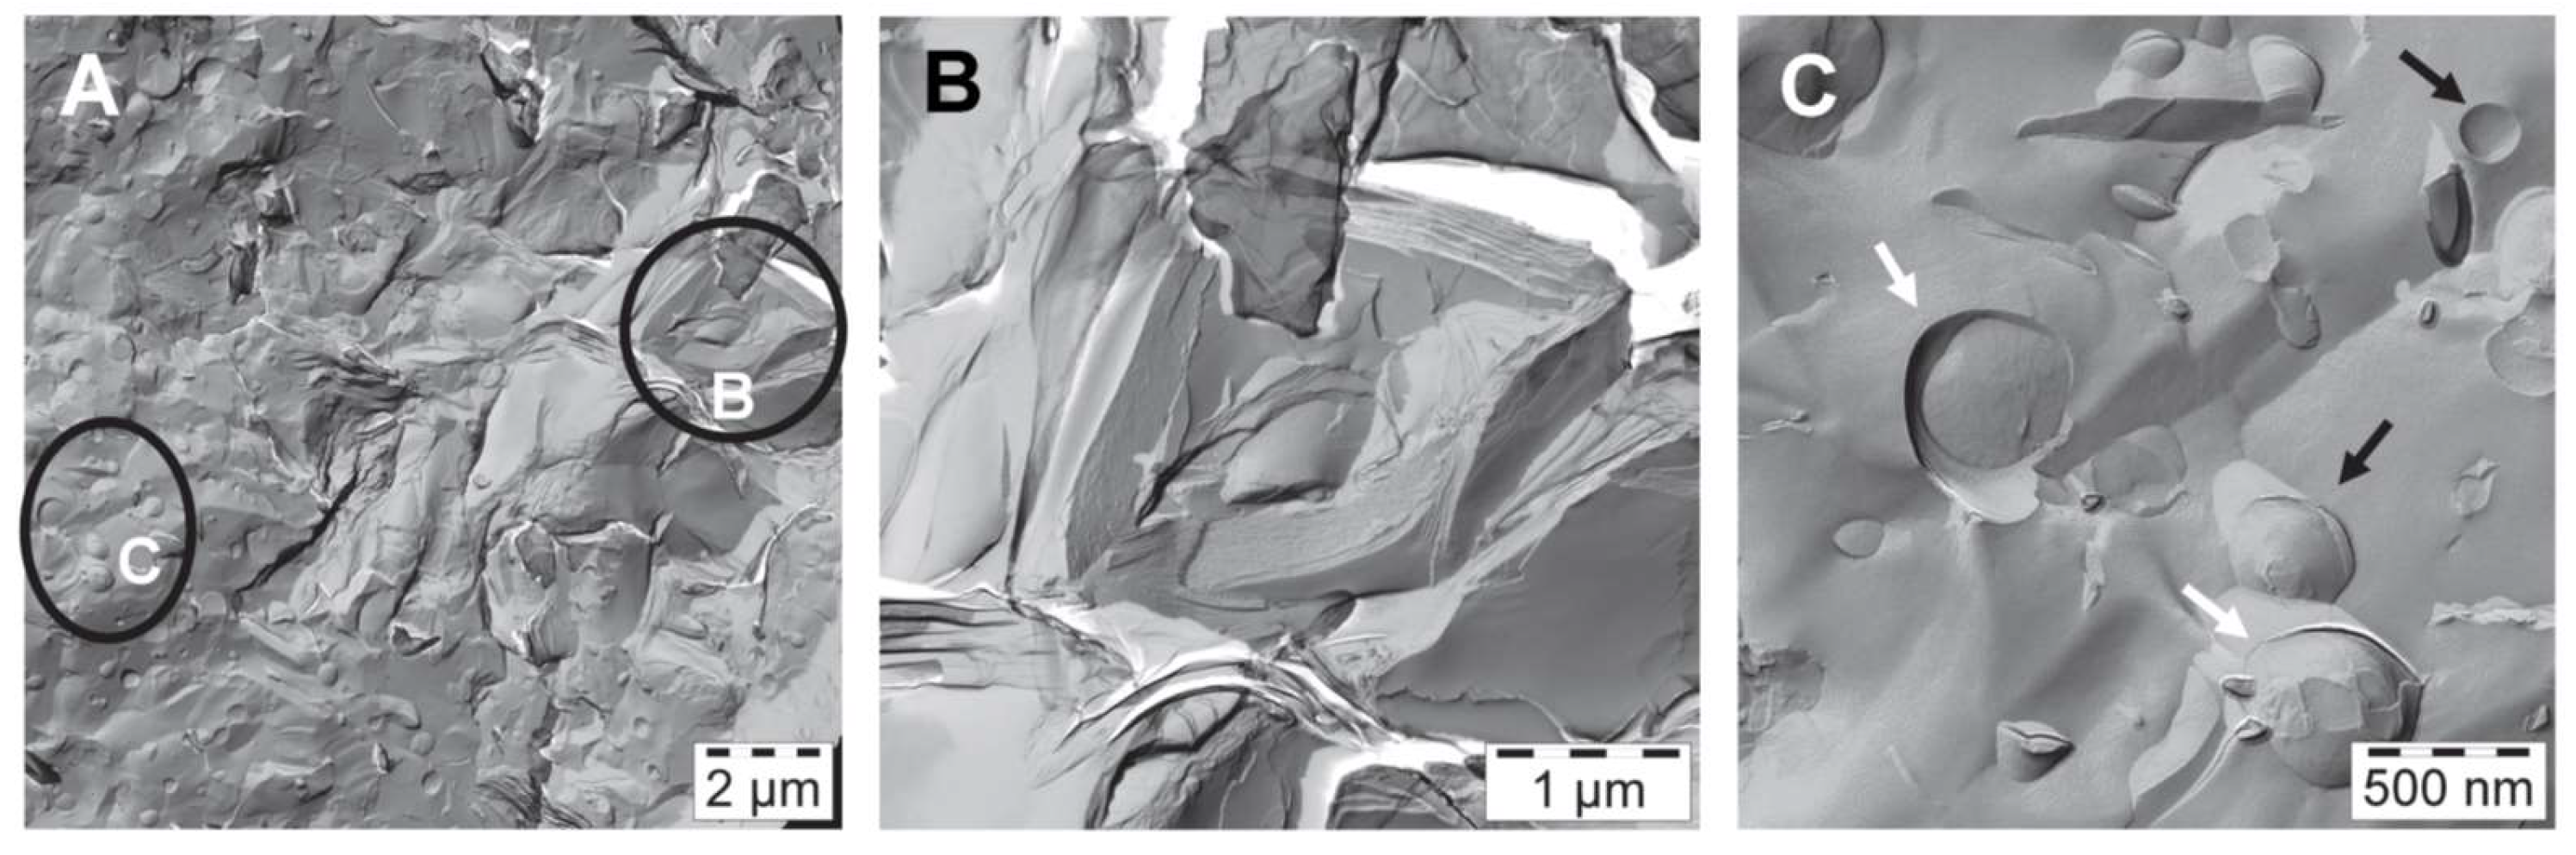
The corresponding FF-TEM images of sample #1 are shown in Figure 4. On the left is an overview image covering an area of 14.5 µm × 14.5 µm; it illustrates coexisting structures in the water-rich bulk phase. The marked regions B and C have been enlarged. The stacked bilayers (B), which seem to build the internal structure of sample #1 become clearly visible in the enlarged image shown in the middle. The spacing of these stacked bilayers has been determined to be 7 nm using Fast Fourier Transform (FFT) filtering of the iTEM-software. Similar stacked bilayers have been observed from freeze fracture investigations e.g., of crystalline stearic acid [18]. A higher magnification of the area C as shown in the right image indicates the presence of both intact (black arrow) and fractured (white arrow) unilamellar vesicles. The measured diameters of the vesicles have values ranging between 0.14 µm and 0.7 µm.
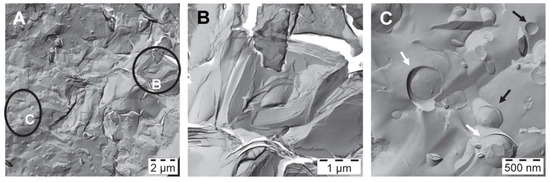
Figure 4.
FF-TEM images of emulsifier in water (sample #1) at T = 23.6 °C: Polydisperse vesicles with sizes between 0.14 and 0.7 µm coexisting with areas of stacked bilayers. (A) Overview; (B) Zoom into region B in image A; (C) Zoom into region C of image A.
Both methods, SANS and FF-TEM show that the emulsifier on its own is able to form bilayer structures with a thickness of around 4.8 nm, in form of lamellar stacked bilayers with a spacing of 7 nm, coexisting with polydisperse unilamellar vesicles with diameters in the sub-µm range.
3.2. Addition of Consistency Enhancers (Samples #2–#4)
In a first step to approach the real emulsion system, the effect of adding increasing amounts of consistency enhancers (glyceryl stearate and steary alcohol) to sample #1 containing emulsifier and water only has been investigated.
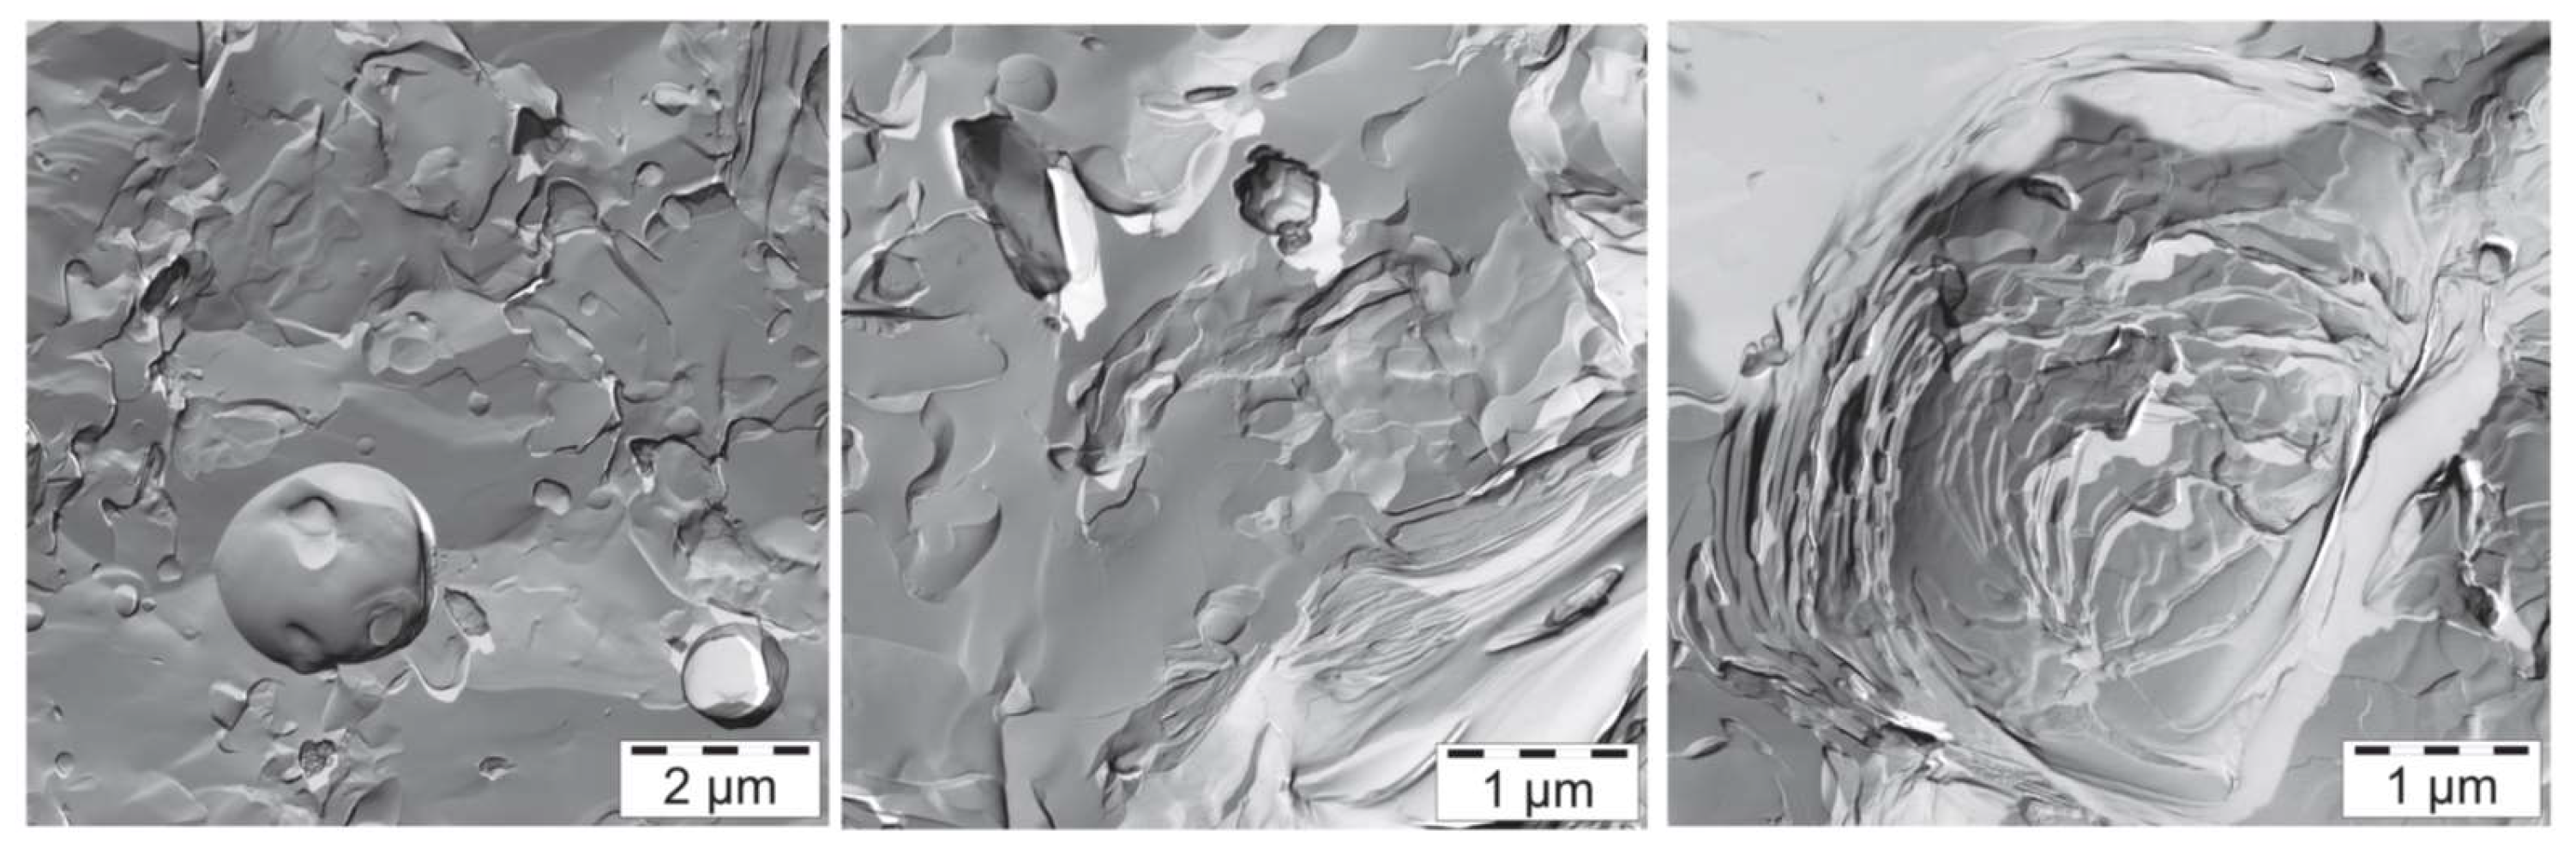
The freeze fracture electron micrographs of sample #4 (Figure 5) show that addition of consistency enhancer does not seem to make noticeable changes to the internal structure, except for the first appearance of multilayered vesicles (right image) with a large spacing between the layers ranging between 29 nm and 90 nm, in addition to the polydisperse vesicles and stacked bilayers with a lamellar spacing of 9 nm.
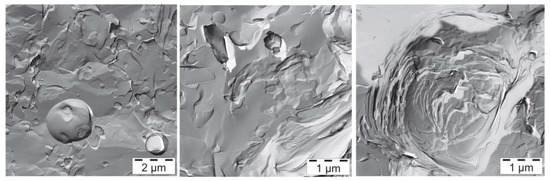
Figure 5.
FF-TEM images of sample #4 consisting of emulsifier, water and consistency enhancer at T = 23.6 °C (different areas): Coexistence of polydisperse vesicles and stacked bilayers.
The corresponding SANS curves for the samples with increasing amount of consistency enhancer are shown in Figure 6a. The addition of the consistency enhancer to the emulsifier/water system leads to an enhanced intensity just a little below Q = 0.1 nm−1, which becomes increasingly more prominent with increasing concentration of the consistency enhancer. This increase in intensity may be explained by assuming a scattering contribution from a bilayer periodicity, which would indicate a structure of stacked bilayers in the solution, most likely in form of huge multilamellar vesicles as evidenced by FF-TEM. According to the position of the peak, the spacing of two adjacent layers would be around 6.5 nm, which is also in good agreement with the observations by FF-TEM. This becomes more evident when dividing the experimental data by the fitted form factor (Equation (2)). Thereby, one obtains an effective structure factor (Figure 6b) which shows an increasingly pronounced peak around Q = 1.0 nm−1.
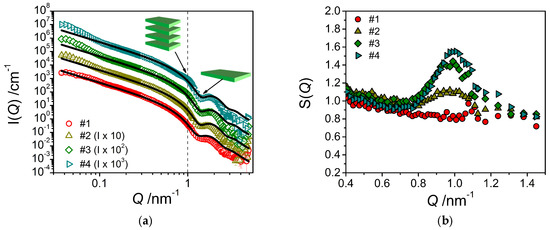
Figure 6.
(a) SANS intensity I(Q) of the system containing only emulsifier in water (sample #1) and the mixed systems containing emulsifier/water and increasing amounts of consistency enhancers (samples #2–#4) at T = 25 °C. The fits were performed using a model for planar object with homogeneous cross section adapted to the corresponding sample composition. (b) Effective structure factors S(Q) obtained by dividing the experimental data by the theoretical scattering intensities (from Equation (2)).
These observations are consistent with the increase in forward scattering I(0) that becomes more pronounced with increasing content of consistency enhancers and which indicates the presence of increasingly larger structures. It is also important to note that fitting the experimental data by means of the model of planar lamellae (Equation (2)) leads to a decrease in bilayer thickness with increasing consistency enhancer concentration, from 4.79 nm (sample #1) to 4.47 nm (sample #4) (Table 2). The standard deviation of the lamellar thickness is around 12% for the distributions in every sample containing consistency enhancers. This thickness is in good agreement with having a bilayer of twice the length of the constituting molecules. For the pure stearyl chain one would expect a bilayer thickness of 4.84 nm for stretched chains [15]. Our data agree well with the expectation that the bilayer thickness becomes somewhat smaller as the emulsifier with a polyglycerol head group becomes replaced by consistency enhancer carrying a smaller hydrophilic headgroup (glyceryl, hydroxyl), as the headgroup is effectively also accounted for in the experimental bilayer thickness.
Table 2.
Relevant parameters used for fitting the SANS data presented in Figure 6.
It is interesting to note that the experimental volume fraction of the bilayers (derived from the fits via Equation (2)) remains rather constant despite the increasing amount of consistency enhancer contained (see Table 2). At the same time, we observe a small increase of the scattering intensity at low Q. This behavior can be interpreted in the following way: The bilayers are basically formed by the emulsifier, whereas the consistency enhancer is not contained to a larger extent in these bilayers. Instead, the consistency enhancer forms larger dispersed particles of consistency enhancer, which may be surrounded by the emulsifier for colloidal stabilization. However, these much larger particles only lead to additional scattering at low Q, but no intensity at high Q; this could explain why the bilayer volume fraction remains constant or is even somewhat reduced.
Further details on the influence of the presence of consistency enhancers on the system of emulsifier and water were obtained by means of Differential Scanning Calorimetry (DSC). These measurements allow for the description of the thermodynamics of the phase transition. For the pure emulsifier in water, a transition temperature (Tm) of 56 °C with a transition enthalpy (ΔH) of 66 kJ kg−1 has been found (see Figure S1 Supporting Information A). These values are similar to those obtained for a comparable system carrying the same alkyl chain length (distearoyl phosphatidylcholine (DSPC) in water), for which the transition temperature is reported to be 55 °C and the transition enthalpy 45.2 kJ kg−1 [19].
The addition of increasing amounts of consistency enhancers leads to a systematic increase in transition enthalpy and transition temperature (see Figure S1 Supporting Information A). This can be attributed to the fact that pure stearyl alcohol has a higher melting point (59.6 °C) and a higher melting enthalpy (258 kJ kg−1) [20] than the emulsifier; consequently, its admixture to the emulsifier/water system leads to an increase in the melting temperature of the mixed bilayers.
Here we may conclude that upon adding the consistency enhancer to sample #1, from FF-TEM and SANS we find a coexistence of stacked bilayers and polydisperse unilamellar vesicles (#4), and in addition also multilamellar vesicles.
3.3. Addition of Oil (Samples #5–#10)
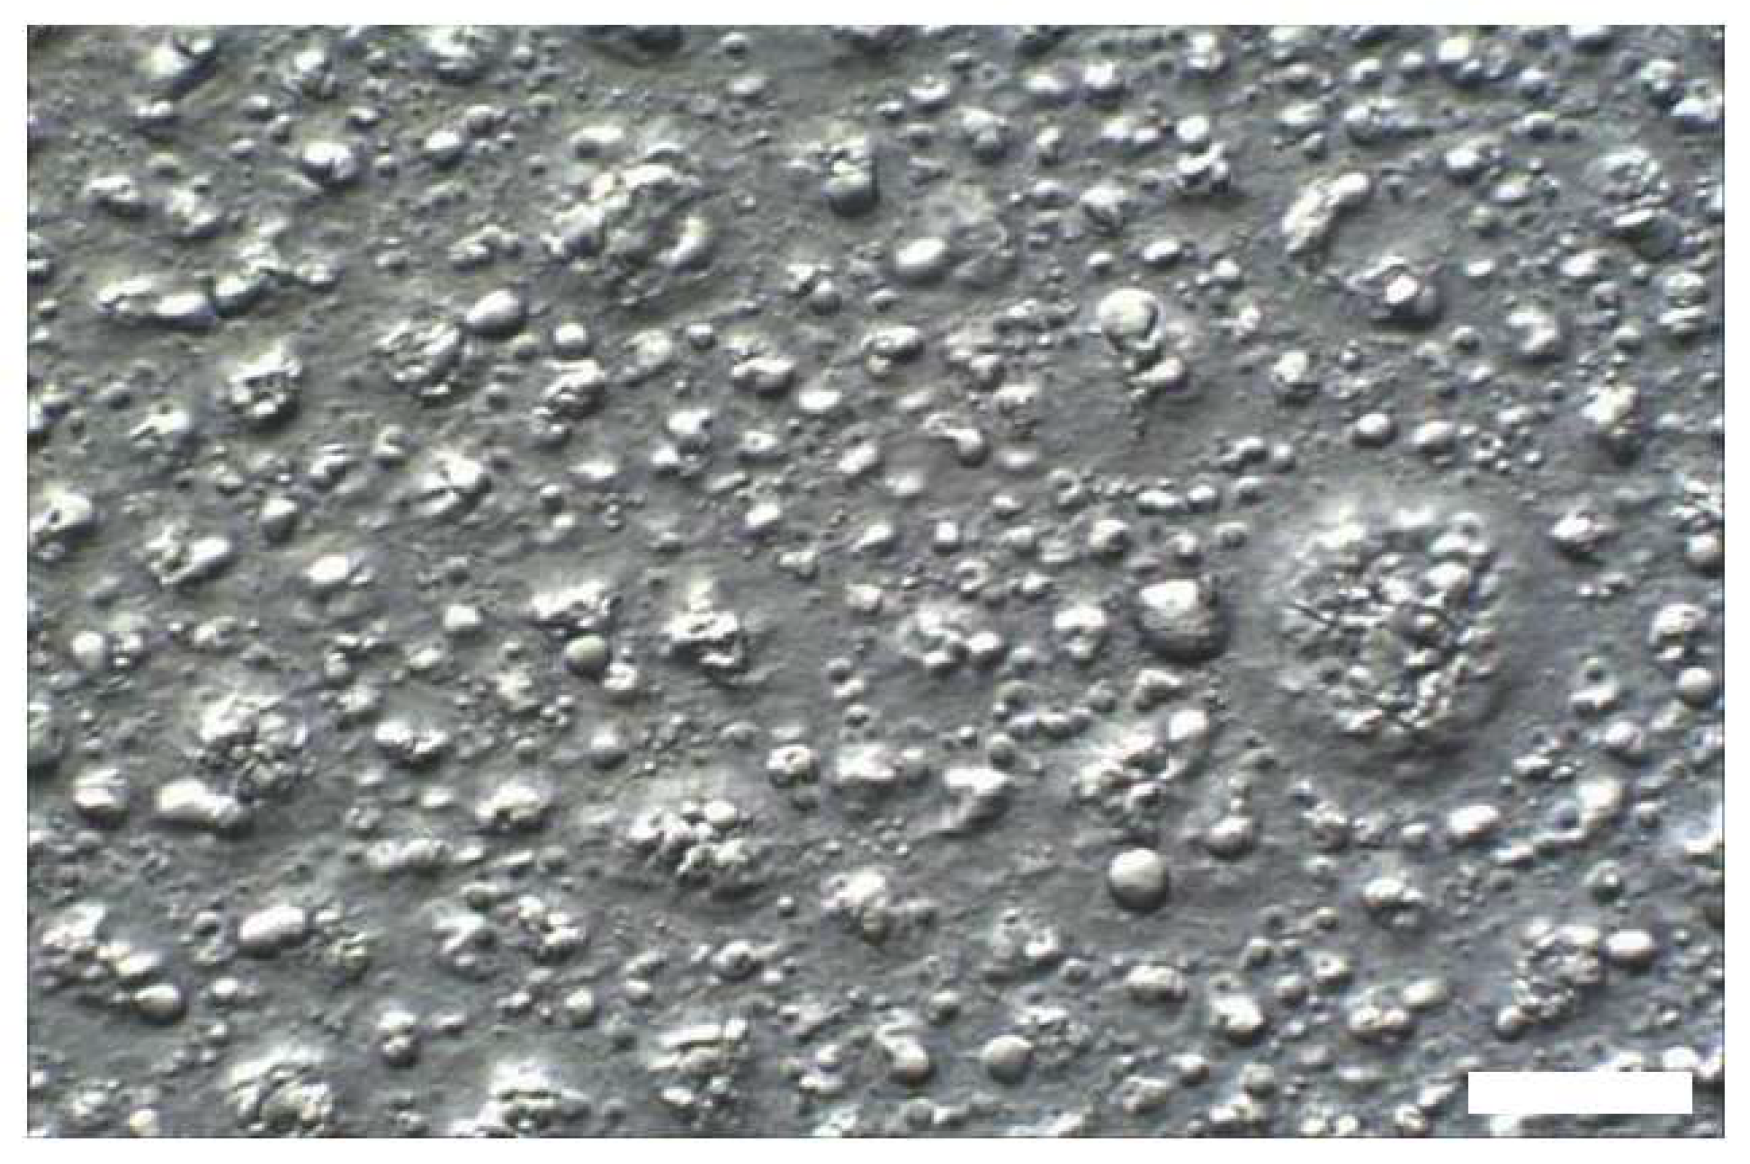
In the next step, increasing amounts of oil have been added to the aqueous mixture of emulsifier and consistency enhancer in order to investigate the effect on structure and properties of the resulting emulsions. As easily observed by optical microscopy, the addition of oil to such a emulsifier/consistency enhancer system immediately leads to the creation of large emulsion droplets in the range of several µm; Figure 7 shows a micrograph of sample #6 containing only two parts of oil.

Figure 7.
Optical micrograph of sample #6 containing two parts of oil added to the system consisting of emulsifier/consistency enhancer/water (T = 25 °C; Hoffman modulation contrast; scale bar 20 μm).
Upon addition of oil, the consistency of the samples changes too, as can be seen in Figure 8 showing photos of tilted samples: Whereas the mixtures emulsifier/consistency enhancer in water (samples #1–#4) are low viscous liquids, the viscosity increases by the presence of the oil droplets. Finally, at an oil level of 25 wt %, a cream-like consistency is reached, which is actually the reason why this final composition has been chosen. This formulation does not only have the desired rheological behavior (more detailed rheological results can be found in Table S1 Supporting Information B), it also fulfills all the stability criteria required for a market-relevant emulsion, such as neither separation nor viscosity change upon three months storage at room temperature and 45 °C, and three freeze-thaw cycles between room temperature and −15 °C.
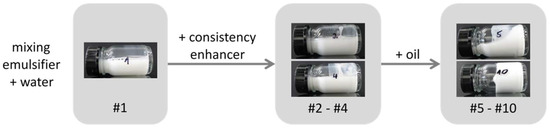
Figure 8.
Photos of tilted samples #1–#10 demonstrating the rheological behavior.
The SANS curves (Figure 9) for the samples containing oil do show the previously observed shoulder at 0.1 nm−1 to an increasingly lesser extent with increasing amount of oil. Further, the formation of emulsion droplets is accompanied by an increase in forward scattering intensity of the form I(Q) α Q−4. Hence, the scattering curves are fitted using a combination of the lamellar form factor used before and a Porod model [21] taking into account the scattering contribution of the much larger droplets
leading to the following formula for the overall scattering intensity:
where S/V is the surface area per unit volume. Such a Porod model is suited here as the contribution of large emulsion droplets to the scattering profile is mostly outside of our range of observation (Q-range) and thus one can only see the scattering due to the amphiphilic interface.
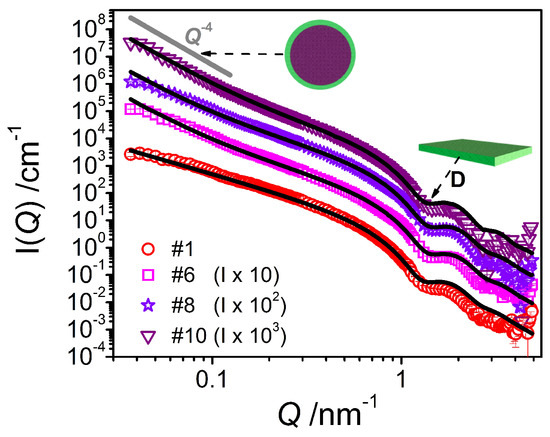
Figure 9.
SANS intensity I(Q) of the system containing emulsifier (sample #1) in comparison to the systems containing consistency enhancers and increasing amounts of oil (samples #6, #8, #10) at T = 25 °C. The fits were performed using a model for planar object with homogeneous cross section (in the case of #1) and the same model combined with a Porod model accounting for emulsion droplets (in the case of #6, #8 and #10) and thus adapted to the corresponding sample composition.
The analysis carried out on the curves for the mixtures containing oil leads to the description of mixed systems containing planar objects—with the lamellar thickness being constantly around 4.5 nm (Table 3) and thereby slightly smaller than in the case of the pure system—and large droplets with a radius beyond our window of observation as shown by the increase in forward scattering for those samples. Thus, it is basically impossible to make a precise estimation of the droplet size using SANS data. From the specific surface area S/V and taking into account the total amount of emulsifier contained, one can calculate (see Supporting Information C) the average headgroup area aH (Table 3), which then is quite small and far below the typical values for similar emulsifiers (~0.5 nm2) [22]. This observation suggests that the amount of emulsifier present at the emulsion droplet interface is far less than the available amount of emulsifier (where the amount contained in the lamellae is already taken into consideration). This means that a substantial portion of the consistency enhancer mixture is most probably solubilized within the oil phase.
Table 3.
Relevant parameters used for fitting the SANS data presented in Figure 9. R is calculated from S/V (see Supporting Information C) and represents the average radius of the spherical emulsion droplets. aH is the average headgroup area of the emulsifier/consistency enhancer mixture at the droplet interface and Φ is the total volume fraction of material dispersed.
A similar information is gained from the analysis of the decrease in φ1 (see Table 3) with increasing oil concentration. This decrease of bilayer volume fraction may be attributed to a “consumption” of the mixture emulsifier/consistency enhancers involved in bilayer structures by the oil. This can be explained by the presence of the emulsifiers at the droplet/water interface and the solubilization of emulsifiers/consistency enhancer into the oil phase (dilution effect). Finally, it might be noted that the structure factor around Q = 1 nm−1 that was observed to rise upon the addition of the consistency enhancer (see Figure 6b), is vanishing now upon the addition of the oil almost completely (see Figure S2 in the Supporting Information D). This means that in the oil-rich formulation, no pronounced stacked bilayer structures are present any more.
The freeze fracture electron micrographs of sample #6 (Figure 10) show polydisperse vesicles in coexistence with stacked bilayers, similarly to the micrographs of sample #4 (Figure 5) containing emulsifier and consistency enhancer only. However, in contrast to sample #4, the bilayers in the oil-containing sample #6 are significantly more frequent than the polydisperse vesicles, while the lamellar spacing with 7 nm does not change. However, calculating the efficient structure factor of the SANS curves shows that the presence of stacked bilayers is largely reduced by the addition of the oil (Figure S2 in the Supporting Information D). By comparison with the light microscopy image shown in Figure 8, one can conclude that the large objects in the upper right corner of the left image correspond to “imprints” of oil droplets, however, obviously wrapped in a bilayer.
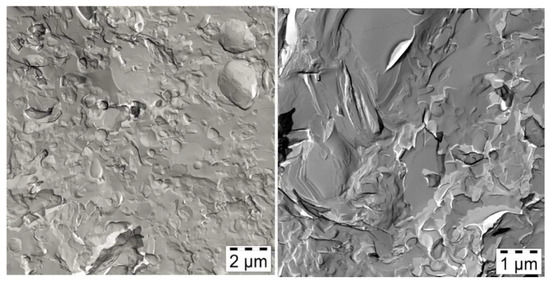
Figure 10.
FF-TEM images (two different areas) of sample #6 containing two parts of oil and emulsifier/consistency enhancer in water (T = 23.6 °C): Polydisperse vesicles and stacked bilayers.
The effect of the addition of oil was also studied by means of DSC; a decrease of both the melting temperature and the melting enthalpy ΔH with increasing amount of oil can be observed (Figure S1 (purple) of the Supporting Information A). The reduction of the phase transition temperature can be explained by an intermixing of the oil with the alkyl chains of emulsifier and consistency enhancer, thereby leading to a freezing point depression. Concerning the transition enthalpies, it is to be noted that the calculation of the transition enthalpy was performed by calculating the heat of transition based on the amount of emulsifier and consistency enhancers, as they should be the only species contributing to the melting transition. The substantial decrease in transition enthalpy observed could be related to the fact that here an increasing amount of emulsifier and consistency enhancer is no longer present in the form of bilayers (where this transition would take place)—as evidenced by the decrease in φ1 observed for increasing amount of oil (see Table 3). Those alkyl chains that are solubilized in the oil droplets do not crystallize and hence do not contribute to the transition enthalpy.
3.4. Structure of the Final Emulsion (Sample #10)
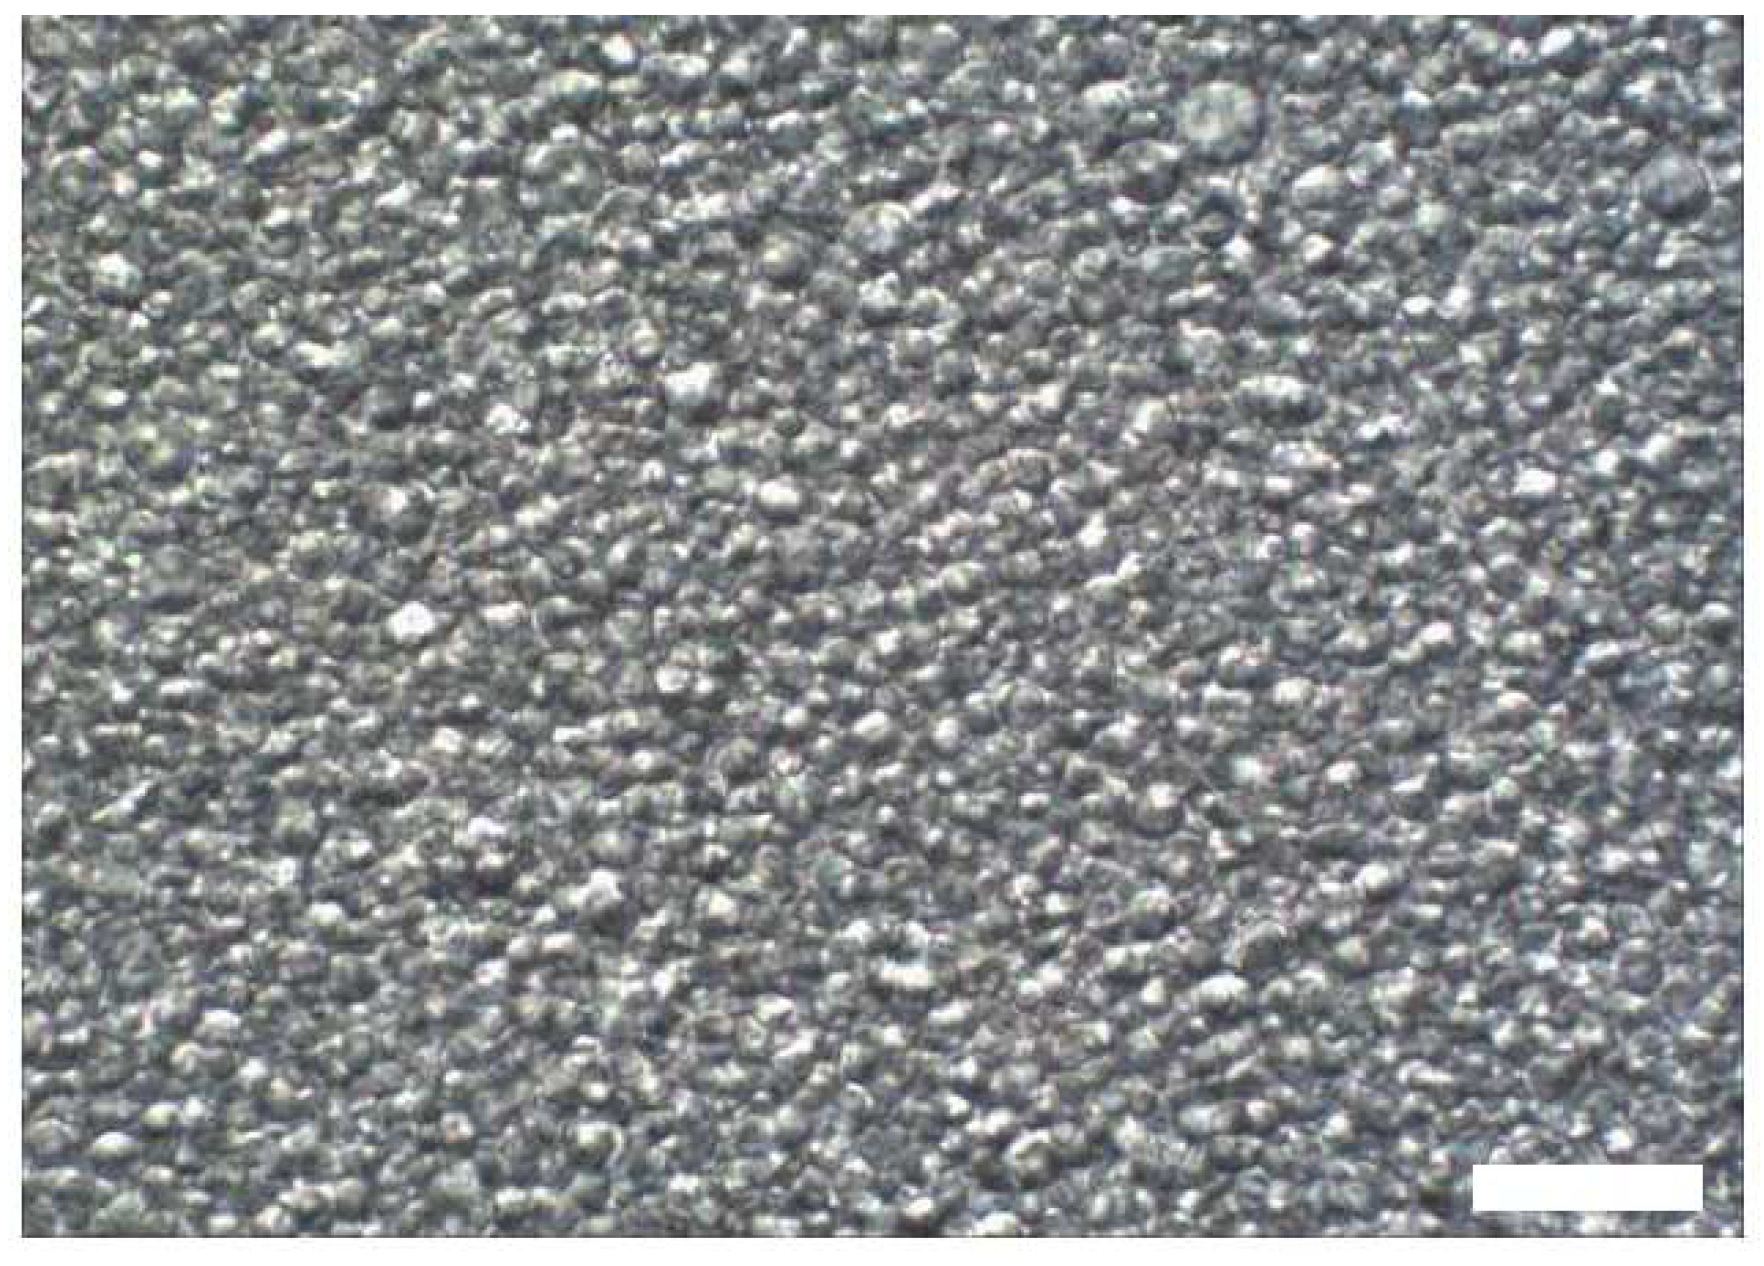
So far we have investigated the structures formed by the emulsifier in water, as well as the structural changes occurring upon addition of consistency enhancers and oil. In the final step, the amount of oil is chosen to reach the composition of a realistic cosmetic emulsion. An optical micrograph (Figure 11) shows the final emulsion containing 25 parts of the oil mixture, 3 parts of emulsifier and 3 parts of consistency enhancer; the droplet sizes are in the range of several µm.
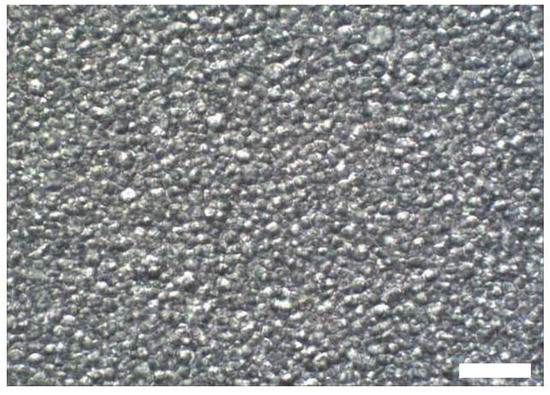
Figure 11.
Optical micrograph of the final emulsion (sample #10) containing 25 parts of the oil mixture (T = 25 °C; Hoffman modulation contrast; scale bar 20 µm).
The SANS curve of the final emulsion #10 can be nicely fitted with a form factor of an oil/water interface of larger structures (described by Porod) and a form factor for lamella as discussed above (see Figure 9), confirming the presence of large droplets as well as planar bilayers with a thickness of 4.5 nm.
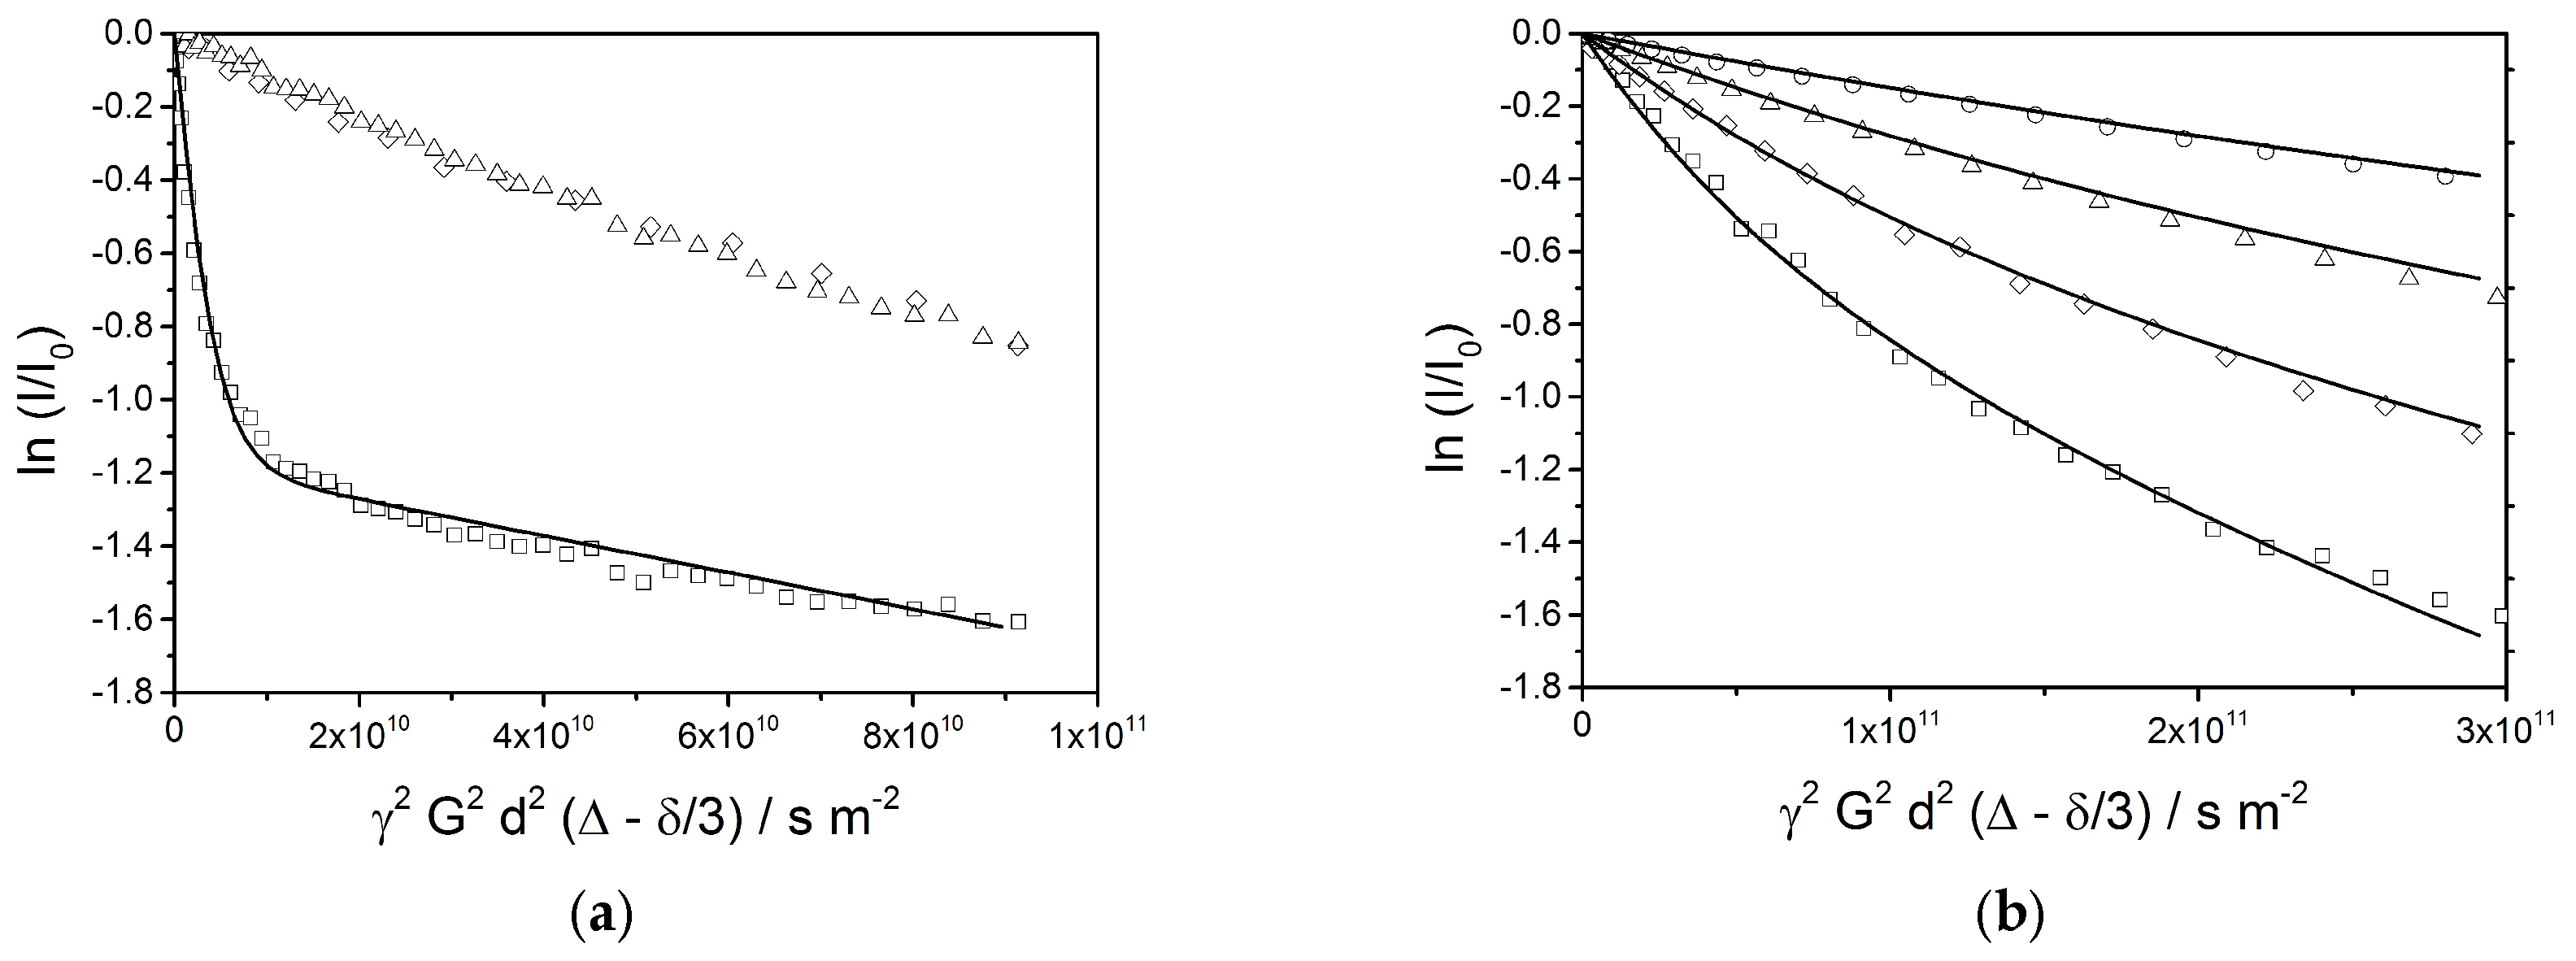
The final emulsion (sample #10) has also been analyzed by PFG-NMR. Plots of the logarithmic relative signal intensities vs. the parameter γ2G2δ2(Δ − δ/3) allow for an observation of the transversal mobility of each component represented by the corresponding NMR signals. For a free diffusion, the slope in the graph is equal to the negative self-diffusion coefficient D. In case of a hindered diffusion inside a small spherical volume, e.g., inside a vesicle, the slope of the echo decay curve yields an apparent self-diffusion constant Dapp which depends on the diffusion time Δ and on the radius of the sphere R. Provided that the observation time Δ is longer than the average time needed for a dislocation over the full diameter of the encapsulation volume, Dapp is given by [23]:
In the 1H-NMR spectrum of the final emulsion (see Figure S3 in the Supporting Information E), the signal at 4.7 ppm has been assigned to water; the signals at 1.2 ppm (methylene) and 3.86 ppm (ester) represent the oil phase. One could assume that emulsifier and consistency enhancer, which form the bilayer structures, could also contribute to the latter two signals. However, is has been verified by recording a 1H-NMR spectrum of an emulsion containing exclusively silicone oil as oil phase that the bilayers below their phase transition temperature are hardly visible in the NMR experiment—the corresponding 1H-NMR spectrum only shows the silicone signal at 0 ppm, but almost no alkyl signals which should come from the emulsifier and consistency enhancer (see Figure S4 in the Supporting Information E).
The echo decay plots of different signals at a diffusion time of Δ = 25 ms (Figure 12a) show a superposition of several phenomena. The behavior of the water signal (□) is completely different than the ones of the oil (1.2 ppm (∆) and 3.86 ppm (◊)), which follow a very similar decay function. The water signal exhibits a rapid decay at the beginning, which is followed by a final linear stretch with a shallow slope. This indicates the presence of two fractions of water: a large contribution of freely diffusing bulk water, and a smaller fraction of encapsulated water. A simulation of the echo decay (solid line) shows a best fit for a setting of 69% of mobile water with a self-diffusion coefficient of D = 4 × 10⁻¹⁰ m2/s and 31% of encapsulated water with an apparent self-diffusion coefficient of Dapp = 5 × 10⁻¹² m2/s. The smaller fraction of water is obviously encapsulated in small volumes such as vesicles with an average radius of approximately 0.4 µm or interstitial spaces between bilayers leading to a comparable confinement.
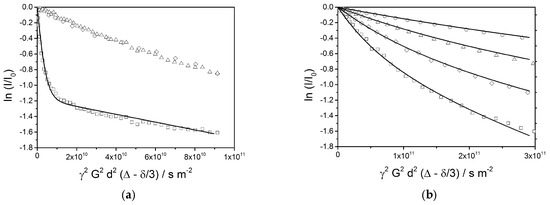
Figure 12.
(a) PFG-NMR echo decay plots (diffusion time is 25 ms) for water (4.7 ppm, □) and the oil phase (1.2 ppm, ∆ and 3.86 ppm, ◊). The solid line represents a simulation of the echo decay plot for water, the parameters are given in the text. (b) PFG-NMR echo decay plots for aliphatic components (signal at 1.2 ppm) at different diffusion times (Δ = 25 ms: □, Δ = 50 ms: ◊, Δ = 100 ms: ∆, Δ = 200 ms: ◯). The solid lines represent simulations of the echo decay plots assuming an equal (mass) distribution over radii between 0.25 μm and 4 μm and a corresponding dependence of the apparent self-diffusion constant according to Equation (9).
A similar analysis has been applied to the oil signal at 1.2 ppm; an expanded set of echo decay data is shown in Figure 12b. Again, the observed slopes are expected to indicate an apparent diffusion constant which depends on the droplet radius as given by Equation (7). The observed curvatures of the plots indicate a broad distribution of the radii, which is also expected from the optical micrographs. For the simulation of the echo decay plots, a distribution of droplet radii between 0.25 µm and 4 µm with constant mass contributions over the full range is assumed. This given, all four decay plots are equally well reproduced by the calculated lines in Figure 12b by a single parameter setting. This by itself can be considered as a strong indication for the validity of Equation (7), which requires that the observation time Δ is longer than the average time needed for a dislocation over the full diameter of the encapsulation volume.
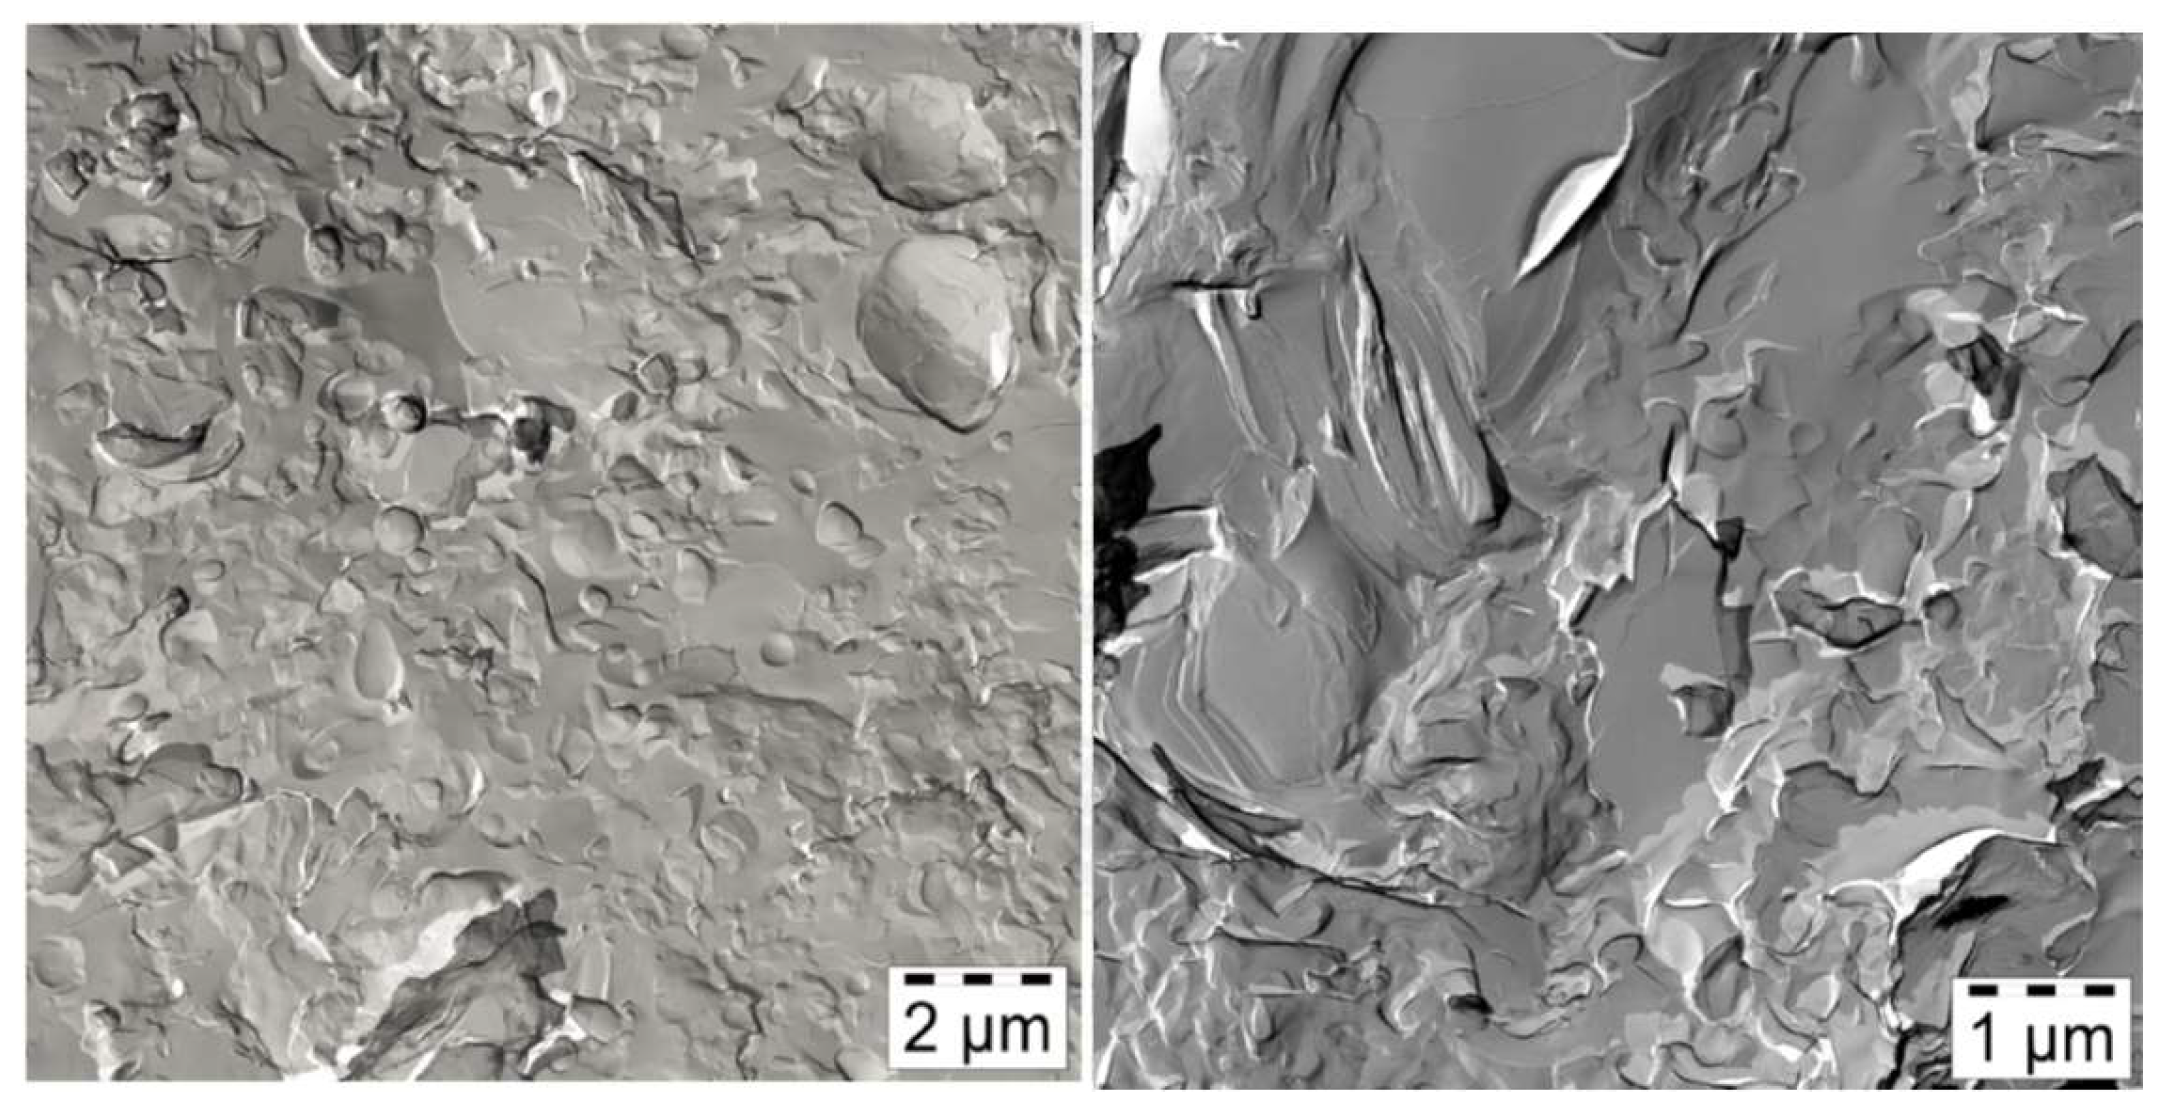
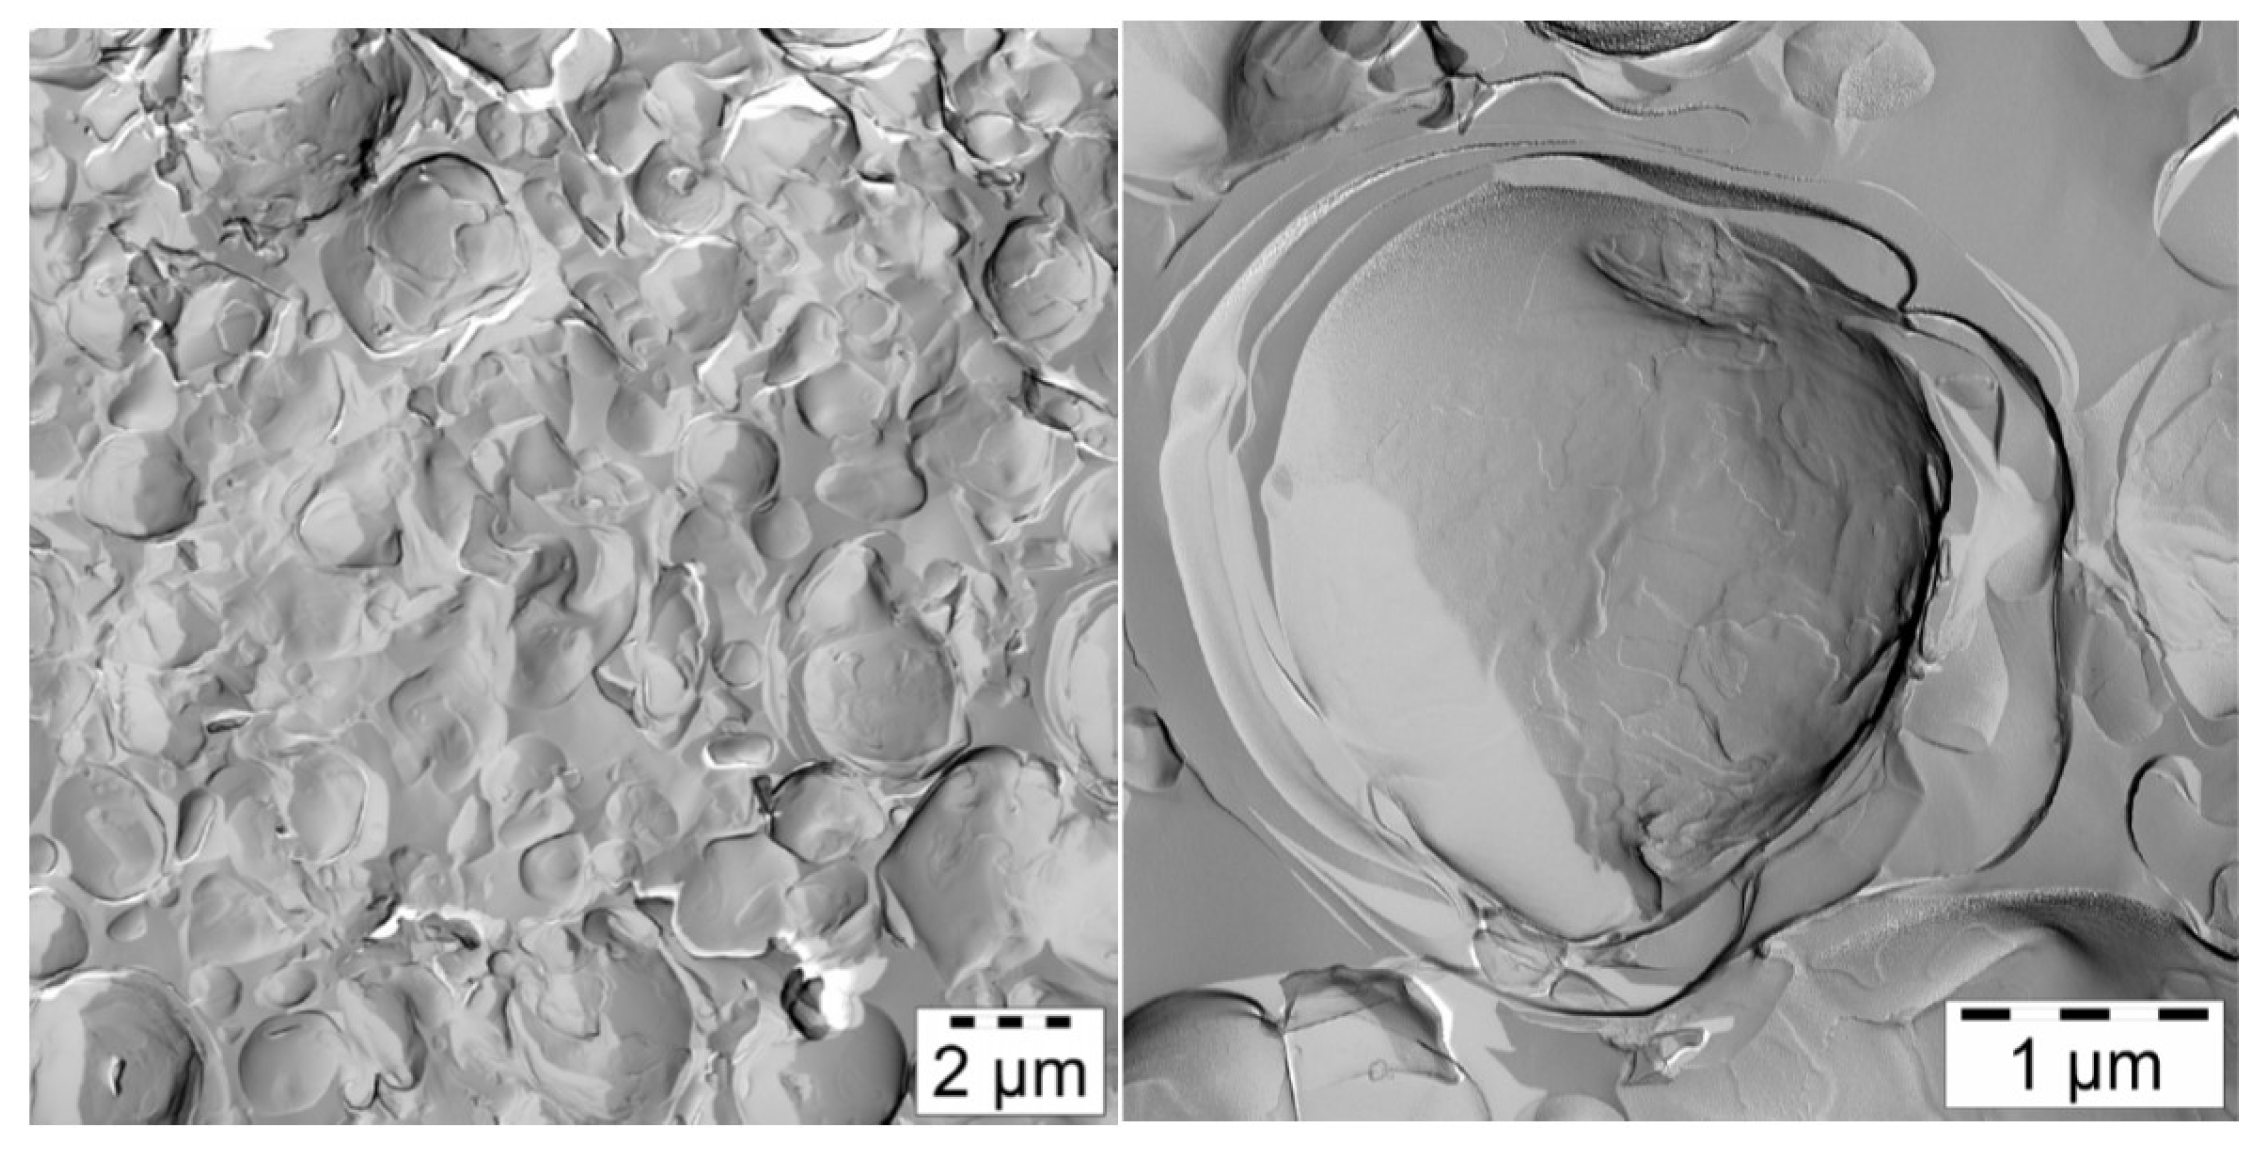
FF-TEM images of the final emulsion (Figure 13) show polydisperse oil droplets, which are surrounded by several layers of bilayers. Furthermore, some small vesicles can be seen; apparently, there is a close packing of vesicles. Also, it should be emphasized that stacked bilayers are missing completely and could not be detected in any of the electron micrographs of sample #10. Addition of 25 parts of oil to the mixture #4 seems to favor the formation of multilayered vesicles rather than retaining lamellar stacks as in the case of sample #6 containing only 2 parts of oil. The oil molecules apparently do not penetrate the bilayers formed by the emulsifier/consistency enhancer mixture, as by SANS there is no evidence to swelling of the bilayers upon oil addition (Table 3).

Figure 13.
FF-TEM images of the final emulsion containing 25 parts oil, 3 parts emulsifier and 3 parts consistency enhancer (sample #10) at T = 23.6 °C. The emulsions oil droplets are surrounded by several layers of bilayers. Furthermore, vesicles can be seen; but no stacked bilayers. Left: Overview; Right: One emulsion droplet surrounded by several bilayers at higher magnification.
Several electron micrographs obtained from the investigation of sample #10 have been used to get measures for the diameters of the vesicles. The values determined for the diameters range between 0.5 and 5 µm and can be described very well by a Schultz distribution (see Figure S5 in the Supporting Information F). This vesicle size distribution of the final emulsion obtained from FF-TEM images agrees reasonably well with the results of droplet size measurements obtained by static light scattering (see Figure S6 in the Supporting Information F). This is in line with the assumption that the oil droplets are wrapped with at least one bilayer of emulsifier/consistency enhancer.
4. Conclusions
The structure of a typical modern cosmetic o/w-cream based on the emulsifier polyglyceryl-3 dicitrate/stearate and glyceryl stearate/stearyl alcohol as consistency enhancers has been studied. The results obtained by several complementary methods, such as SANS, FF-TEM, PFG-NMR and light microscopy can be summarized in a model that is depicted schematically in Figure 14. The oil droplets with sizes in the µm range (0.5–6 µm) are surrounded by multiple, irregularly spaced bilayer structures and vesicles in the aqueous phase. Approximately 30% of the water present in the system shows a restricted mobility (“encapsulated water”), whereas approximately 70% of the water can be described as freely diffusing bulk water. One main difference to the classical Junginger model (Figure 1) is the absence of planar lamellar domains in the water phase. The most significant difference, however, is the importance of the presence of oil droplets for the viscosity build-up in cosmetic emulsions. A cream-like consistency is obtained by steric interaction of oil droplets and crystalline bilayer structures in the aqueous phase of the emulsion. The thickening of cosmetic emulsions should therefore not simply be assigned to the presence of gel networks in the aqueous phase, but the steric interaction of these structures with the emulsion droplets. When cosmetic o/w-emulsions stabilized by emulsifiers and consistency enhancers are prepared by homogenizing oil and water phase at 70–80 °C, the emulsions are fluid at these temperatures. Viscosity build-up is observed upon cooling to temperatures below 60 °C. This effect is in line with the phase transition temperature range as determined by DSC (45–60 °C). Hence, the viscosity effect can be linked to the phase transition of the multiple, irregularly spaced bilayer structures and vesicles from the liquid-analogue to the solid-analogue state.
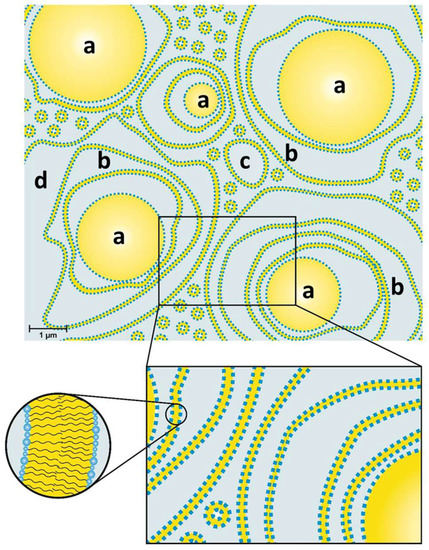
Figure 14.
Model of an o/w-emulsion containing Polyglyceryl-3 Dicitrate Stearate as emulsifier and glyceryl stearate/stearyl alcohol as consistency enhancer: Oil droplets (a) surrounded by several layers of bilayers (b) and polydisperse vesicles (c) in a water phase (d).
The findings presented in this paper should help to provide a realistic understanding of the structures of modern cosmetic emulsions and the mechanisms that help in their stabilization. Application properties such as water resistance, bioavailability of active ingredients or sensory properties such as ease of distribution or waxiness will for sure be influenced by the impact of emulsifiers and consistency enhancers on the bilayer structures in such emulsions. Accordingly, our findings will help in a rational and improved design of such practically highly important formulations.
Supplementary Materials
The following are available online, covering (A) DSC, (B) Rheology, (C) SANS—Calculation of R and aH from the Porod fit, (D) SANS—Effective structure factor S(Q) of samples #1–#10, (E) NMR and (F) Droplet size distribution in sample #10.
Acknowledgments
We are grateful to the Helmholtz-Zentrum Berlin (HZB) for allocation of SANS beamtime.
Author Contributions
V.D. contributed with rheological measurements, microscopy, particle sizing and compiled the first version of the manuscript. A.F. has prepared the emulsion samples, determined their viscosity and has drawn the final schematic drawing (Figure 14). J.M. has developed the emulsifier and the concept of this paper together with J.V., who also did the final editing. L.B. and R.S. provided the Freeze Fracture results and the corresponding portions of the manuscript. C.M. provided the PFG-NMR measurements and the corresponding portions of the manuscript. R.M. performed the DSC and SANS experiment under the guidance of M.G., who contributed by writing the corresponding chapters.
Conflicts of Interest
The authors declare no conflict of interest.
References
- Junginger, H. Systematik der Dermatika—Kolloidchemischer Aufbau. In Dermatika; Niedner, R., Ziegenmeyer, J., Eds.; Wissenschaftliche Verlagsgesellschaft: Stuttgart, Germany, 1992; p. 505. ISBN 978-3804709232. [Google Scholar]
- Junginger, H.; Führer, C.; Ziegenmeyer, J.; Friberg, S. Strukturuntersuchungen von Salben 2. Mitteilung: Strukturuntersuchungen an der Wasserhaltigen Hydrophilen Salbe DAB 7. J. Soc. Cosmet. Chem. 1979, 30, 9–23. [Google Scholar]
- Führer, C.; Junginger, H.; Friberg, S. Strukturuntersuchungen von Salben 1. Mitteilung: Röntgen-strukturuntersuchungen an der Hydrophilen Salbe DAB 7. J. Soc. Cosmet. Chem. 1978, 29, 703–716. [Google Scholar]
- Junginger, H.; Heering, W.; Führer, C.; Geffers, I. Elektronenmikroskopische Untersuchungen über den kolloidchemischen Aufbau von Salben und Cremes. Colloid Polym. Sci. 1981, 259, 561–567. [Google Scholar] [CrossRef]
- Junginger, H.; Heering, W. Darstellung kolloider Strukturen von Salben, Cremes, Emulsionen und Mikroemulsionen mittels Gefrierbruch-Ätztechnik und TEM. Acta Pharm. Technol. 1983, 29, 85–96. [Google Scholar]
- Junginger, H.; Akkermans, A.A.M.D.; Heering, W. The ratio of interlamellarly fixed water to bulk water on o/w creams. J. Soc. Cosmet. Chem. 1984, 35, 45–57. [Google Scholar]
- Junginger, H. Colloidal structures of O/W creams. Pharm. Weekbl. Sci. Ed. 1984, 6, 141–149. [Google Scholar] [CrossRef]
- Müller-Goymann, C. Liquid Crystals in Emulsions, Creams, and Gels Containing Ethoxylated Sterols as Surfactant. Pharm. Res. 1984, 1, 154–158. [Google Scholar] [CrossRef] [PubMed]
- Kónya, M.; Dékány, I.; Eros, I. X-ray investigation of the role of the mixed emulsifier in the structure formation in o/w creams. Colloid Polym. Sci. 2007, 285, 657–663. [Google Scholar] [CrossRef]
- Keiderling, U. The new ‘BerSANS-PC’ software for reduction and treatment of small angle neutron scattering data. Appl. Phys. A 2002, 74, s1455–s1457. [Google Scholar] [CrossRef]
- Stejskal, E.O.; Tanner, E.J. Spin Diffusion Measurements: Spin Echoes in the Presence of a Time-Dependent Field Gradient. J. Chem. Phys. 1965, 42, 288–292. [Google Scholar] [CrossRef]
- Burauer, S.; Belkoura, L.; Stubenrauch, C.; Strey, R. Bicontinuous microemulsions revisited: A new approach to freeze fracture electron microscopy (FFEM). Colloids Surf. A 2003, 228, 159–170. [Google Scholar] [CrossRef]
- Porod, G. Die Röntgenkleinwinkelstreuung von dichtgepackten kolloiden Systemen. Kolloid Z. 1951, 124, 83–114. [Google Scholar] [CrossRef]
- Butter, K.; Hoell, A.; Wiedenmann, A.; Petukhov, A.V.; Vroege, G.J. Small-angle neutron and X-ray scattering of dispersions of oleic-acid-coated magnetic iron particles. J. Appl. Crystallogr. 2004, 37, 847–856. [Google Scholar] [CrossRef]
- Tanford, C. Micelle shape and size. J. Phys. Chem. 1972, 76, 3020–3024. [Google Scholar] [CrossRef]
- Gordeliy, V.I.; Kiselev, M.A. Definition of lipid membrane structural parameters from neutronographic experiments with the help of the strip function model. Biophys. J. 1995, 69, 1424–1428. [Google Scholar] [CrossRef]
- Gradzielski, M.; Langevin, D.; Magid, L.; Strey, R. Small-Angle Neutron Scattering from Diffuse Interfaces. 2. Polydisperse Shells in Water-Oil-C10E4 Systems. J. Phys. Chem. 1995, 99, 13232–13238. [Google Scholar] [CrossRef]
- Deamer, D.W.; Leonard, R.; Tardieu, A.; Branton, D. Lamellar and hexagonal lipid phases visualized by freeze-etching. Biochim. Biophys. Acta 1970, 219, 47–60. [Google Scholar] [CrossRef]
- Ichimori, H.; Hata, T.; Yoshioka, T.; Matsuki, H.; Kaneshina, S. Thermotropic and barotropic phase transition on bilayer membranes of phospholipids with varying acyl chain-lengths. Chem. Phys. Lipids 1997, 89, 97–105. [Google Scholar] [CrossRef]
- Nichols, G.; Kweskin, S.; Frericks, M.; Reiter, S.; Wang, G.; Orf, J.; Carvallo, B.; Hillesheim, D.; Chickos, J. Evaluation of the Vaporization, Fusion, and Sublimation Enthalpies of the 1-Alkanols: The Vaporization Enthalpy of 1-, 6-, 7-, and 9-Heptadecanol, 1-Octadecanol, 1-Eicosanol, 1-Docosanol, 1-Hexacosanol, and Cholesterol at T = 298.15 K by Correlation Gas Chromatography. J. Chem. Eng. Data 2006, 51, 475–482. [Google Scholar] [CrossRef]
- Spalla, O. General theorems in small angle scattering. In Neutrons, X-rays and Light Scattering Methods Applied to Soft and Condensed Matter; Lindner, P., Zemb, T., Eds.; Elsevier Science B.V.: Amsterdam, The Netherlands, 2002; pp. 49–72. ISBN 9780444511225. [Google Scholar]
- Rosen, M.J. Surfactants and Interfacial Phenomena, 2nd ed.; Wiley: New York, NY, USA, 1989; pp. 70–80. ISBN 0-471-83651-6. [Google Scholar]
- Kärger, J.; Fleischer, G.; Roland, U. PFG NMR studies of anomalous diffusion. In Diffusion in Condensed Matter; Kärger, J., Heitjans, P., Haberlandt, R., Eds.; Vieweg & Teubner: Wiesbaden, Germany, 1998; pp. 144–168. ISBN 978-3528069100. [Google Scholar]


© 2018 by the authors. Licensee MDPI, Basel, Switzerland. This article is an open access article distributed under the terms and conditions of the Creative Commons Attribution (CC BY) license (http://creativecommons.org/licenses/by/4.0/).