Article

Adsorption Layer Properties and Foam Behavior of Aqueous Solutions of Whey Protein Isolate (WPI) Modified by Vacuum Cold Plasma (VCP)

by
Elham Ommat Mohammadi
1,2,
Samira Yeganehzad
1,*,
Mohammad Ali Hesarinejad
1,
Mohsen Dabestani
1,
Regine von Klitzing
2,
Reinhard Miller
2 and
Emanuel Schneck
2
1
Research Institute of Food Science and Technology (RIFST), Mashhad 91895-157.356, Iran
2
Institute for Condensed Matter Physics, Technical University Darmstadt, 64289 Darmstadt, Germany
*
Author to whom correspondence should be addressed.
Colloids Interfaces 2024, 8(2), 25; https://doi.org/10.3390/colloids8020025
Submission received: 30 December 2023 / Revised: 20 February 2024 / Accepted: 5 April 2024 / Published: 9 April 2024
(This article belongs to the Special Issue Proteins at the Interface)

Abstract

:
For years, cold plasma processing has been used as a non-thermal technology in industries such as food. As interfacial properties of protein play a remarkable role in many processes, this study investigates the effect of cold plasma on the foaming and interfacial behavior of WPI. The objective of this study is to evaluate the effect of different gases (air, 1:1 argon–air mixture, and sulfur hexafluoride (SF6)) used in low-pressure cold plasma (VCP) treatments of whey protein isolate (WPI) on the surface and foaming behavior of aqueous WPI solutions. Dynamic surface dilational elasticity, surface tension isotherms, surface layer thickness, and the foamability and foam stability were investigated in this study. VCP treatment did not significantly affect the adsorption layer thickness. However, an increase in induction time, surface pressure equilibrium value, and aggregated size is observed after SF6VCP treatment, which can be attributed to the reaction of WPI with the reactive SF6 species of the cold plasma. The surface dilational elastic modulus increased after VCP treatment, which can be related to the increased mechanical strength of the protein layer via sulfonation and aggregate formation. VCP treatment of WPI increases the foam stability, while the average diameter of foam bubbles and liquid drainage in the foam depends on the gas used for the cold plasma.

1. Introduction

The interfacial properties of food component solutions, such as surface tension, surface visco-elasticity, foamability, and foam stability, have been investigated systematically by physicists, chemists, biologists, and in particular food scientists [1,2,3], because they have an impact on the texture of popular foods like ice cream or whipped cream and they are of great importance for the development of healthier products often modified by aerated structures [4,5]. Proteins are one of the most important food ingredients that adsorb at the air/solution interface and thereby create stabilizing films around bubbles in foam [6]. These layers also increase the visco-elastic properties of the foam film surfaces and help to stabilize them [7].
Foam is a thermodynamically unstable system as the thin foam films tend to rupture. Foam stability is governed by drainage, bubble coalescence, and bubble coarsening, effects that act simultaneously [2]. To increase foam stability, surface active components are required to form stable interfacial layers. Various modification techniques for proteins, including chemical, physical, and enzymatic treatments, are widely used to modify the characteristics of protein adsorption layers [8,9]. For example, the foaming properties can be altered by protein hydrolysis or by enhancing the proteins’ tendency to aggregate [10,11]. It has also been shown that higher foam stability is provided by globular proteins because of their capacity to form visco-elastic networks at aqueous solution surfaces [7,12].
Whey protein isolate (WPI), a by-product of the dairy industry, is one of the primary proteins in dairy formulations that, due to their distinctive nutritional and functional properties, play a key role in the food processing industry to produce for example cake, ice cream, whipped toppings, beverages, meringues, and bread [13,14]. It is known that the denaturation of proteins has important effects on their foaming characteristics because it alters the proteins’ surface properties, promotes protein–protein interactions, and alters the mechanical resistance of the interfacial layers [15,16]. However, some studies have showed that pronounced denaturation and the resulting aggregation can have also opposite effects and destabilize foams because their precipitation decreases their surface activity effectively [17,18].
In recent years, the development and evaluation of non-thermal technologies for protein modifications have received a lot of attention due to concerns about the adverse effects of heat processing in the food industry [19,20,21,22]. Cold plasma (CP), a fast developing non-thermal technology, consists of highly energetic chemical species, especially reactive oxygen and nitrogen species (ROS and RNS, respectively), that dissociate during the discharge and interaction with the protein [23,24]. There is a lot of research on the use of CP to sterilize food and to alter its physicochemical characteristics in a targeted manner [25,26,27,28]. However, only a few studies have investigated the effect of CP on the structure and surface properties of food compounds [23,26]. Among all CP methods, vacuum cold plasma (VCP) has recently become the most popular plasma technology for the modification of surfaces [29,30,31,32,33]. The suitability of VCP arises from several factors, such as the nature and amounts of reactive species produced during plasma treatment. The efficiency of the treatment is mainly determined by the type and composition of the processing gas used and the way of its exposure [34,35,36,37,38,39,40].
There are a few studies that have investigated the effect of CP on the surface properties of WPI [41,42]. In addition, in some studies, the surface properties of biodegradable packaging films treated by cold plasma were investigated [43,44,45,46]. However, they showed that the adsorption of protein at the air/water surface and the resulting surface visco-elastic properties were changed depending on the operational conditions of the applied cold plasma treatment. It has been shown that conformational changes in the protein molecules lead to unfolding and aggregate formations, which were believed to be the reason for the observed changes in the interfacial behavior.
However, despite these investigations about the effect of CP treatments, there is no clear systematic understanding of the process conditions and their overall impact on the food components, and the surface characteristics of adsorbed protein layers especially remain rather unknown, including what their impact is on the final product properties.
In our previous work, we discussed how the structural and physicochemical properties of WPI solutions are modified by VCP treatments that apply different process gases [47]. The current study continues this work and provides information about the effects of cold plasma on interfacial and in particular foaming properties of WPI solutions at neutral pH.

2. Materials and Methods

2.1. Materials

Whey protein isolate (WPI) of commercial grade was supplied from Ingredia Co. (Arras, France) with the following chemical composition: protein ≈ 92% (β-lactoglobulin, α-lactalbumin, and bovine serum albumin: 69, 21, and 2% of the total protein, respectively), moisture 5 ± 0.08% w/w, sulfated ash 1.5%, and a negligible amount of fat. All other chemicals were of analytical grade and purchased from Merck Chemical Co. (Darmstadt, Germany). All solutions were prepared using Milli-Q Ultrapure water.

2.2. Cold Plasma Treatments

The WPI powder was placed in a glass container and put inside the vacuum chamber of the plasma device (Femto Science Co. Ltd., Hwaseong, Republic of Korea) with a dimension of 150 mm diameter and 320 mm length. All experiments were performed at a supply power of 80 W, a gas flow rate of 15 mL/s, a pressure of 0.7 Torr, and a frequency of 13.5 MHz. Samples of approximately 1 g of WPI powder were placed in an open glass container with a narrow neck, and continuously rotated (3 rpm) during the plasma process. Three types of gases were used as the source: air (AVCP), a 1:1 mixture of argon gas and air (ARAVCP), and SF6 gas (SF6VCP). To avoid undesirable effects of high temperatures on the proteins, the VCP treatment time of 15 min was divided into three cycles of 5 min each with a 2 min pause required for the sample to cool down. To increase the efficiency of the treatment, before using each gas, all oxygen in the chamber was discharged and replaced by new gas which was controlled via the pressure in the chamber.

2.3. Preparation of Solutions

The stock solutions of WPI (20 mg/mL) were prepared by dispersing the WPI powder in a phosphate buffer solution (0.01 M, pH 7.2 ± 0.1) using a magnetic stirrer rotating at a speed of 300 rpm for 30 min at 25 °C, to avoid foam formation. The solutions were left overnight at 4–5 °C to guarantee a complete hydration. The pH value of all dispersions was adjusted to 7.2 ± 0.1 with a phosphate buffer solution after adjusting the temperature. This pH range is well above the isoelectric point (IEP) of about 5.5 [48] for non-denatured WPI and about 4.6 for denatured WPI.

2.4. Determination of Aggregate Size and Zeta Potential

The size of protein aggregates and their surface charge (Zeta potential) were measured with a Zetasizer instrument Nano ZSP (Malvern Instruments Ltd., Malvern, UK). All measurements were conducted at 25 °C and at a fixed WPI concentration of 0.1 mg/mL. The aggregate size was calculated by a cumulative analysis of the autocorrelation function and particles were assumed to be spherical [49], while the Zeta potential was calculated via the Smoluchowski equation [50] since the ratio protein radius (a)/Debye screening length (κ) was κa ≫ 1. The size distributions of aggregated particles were determined from the scattered intensity.

2.5. Surface Tension Measurements

The adsorption layer properties of WPI in terms of kinetic and equilibrium surface tensions, γ(t) and γeq, respectively, as well as the surface dilational visco-elastic modulus Er at the air/water interface, were measured by an automated pendant drop profile analysis tensiometer (PAT1, SINTERFACE Technologies, Berlin, Germany) as described, for example, by Loglio et al. [51].
The surface tension was measured at 20 °C, over 10,800 s (3 h) as the equilibration time for all WPI solutions [52]. To determine the surface pressure isotherm, WPI solutions in the concentration range between 0.001 and 1 mg/mL were measured. All solutions were kept in the refrigerator for 24 h and then stirred for 30 min before starting the measurements at room temperature (20–25 °C). The equilibrium value γeq was defined as the value of γ(t) at time t when it did not change by more than 0.1 mN/m within 30 min. The equilibrium surface pressure (Πeq) was calculated as Πeq = γ0 − γeq, where γ0 = 72.5 mN/m at 21 °C is the surface tension of the WPI-free aqueous solution (phosphate buffer at room temperature).
The adsorption kinetics γ(t) were also measured at short adsorption times, until a few min after the formation of the WPI solution drop. This short-time behavior plays an important role in foam formation. If the adsorption of the protein molecules at the surface is controlled by diffusion, the plot of Π vs. t should initially be linear, with a slope proportional to the diffusion coefficient, according to the Ward–Tordai equation [53]. Note, however, that for proteins at low bulk concentrations, an induction time exists during which the surface coverage by adsorbed molecules is still too low to lead to a measurable surface pressure. This induction time tind decreases with increasing protein concentration [54]. Thus, tind is the most reliable quantity to characterize the adsorption kinetics at short adsorption times. But in addition, the slope dΠ/( d t ) after tind has passed is a suitable parameter to quantify the adsorption rate of the protein.
For the measurements of the surface dilational visco-elastic modulus E, sinusoidal surface area compressions and expansions were generated by the PAT1 via decreasing and increasing the drop volume. Drop oscillations were performed with a 7% amplitude of the drop surface area (ΔA/A = 7%) and at different frequencies f of 0.005, 0.01, 0.02, 0.04, 0.08, 0.1, 0.14, and 0.2 Hz. The modulus E is derived from the changes in surface tension generated by the surface area changes ΔA/A, as described by Equations (1) and (2)
E = dγ/d(ΔA/A) = dγ/d ln A,
where
E = Er + iEi
is the complex surface dilational modulus comprising the real and imaginary contributions Er and Ei, respectively. Er is the dilational elastic modulus (storage modulus), while Ei represents the surface dilational viscosity (loss modulus) [55].
For the visco-elasticity measurements, drops of an aqueous WPI solution, prepared at a concentration of 0.01 mg/mL, were formed and allowed to, first, stay for 10,800 s (3 h) at constant drop surface area to reach adsorption equilibrium. The sinusoidal drop area oscillations were then six oscillation cycles that were generated at each frequency, followed by a pause of 100 s before starting oscillations at the next frequency.

2.6. Ellipsometry Measurement

The equivalent thickness δ of the adsorbed protein layer at the air/water surface in terms of the protein volume per surface area (δ = Vprot/Asurf) was determined by measuring the ellipsometric angles Δ and Ψ, which were obtained with a Multiskop ellipsometer (Optrel, Germany). Starting from the known refractive indices of air (n = 1.000), phosphate buffer (n = 1.333), and pure protein (n = 1.58) [56], δ was calculated from the ellipsometric angles as described elsewhere [57]. Experiments were conducted in a Petri glass dish containing 20 mL of a respective diluted protein solution of 0.1 mg/mL. After 24 h aging time, the ellipsometric angles were measured at a light angle of incidence of 58°. During these long-time measurements, the Petri dish was covered by a glass lid to reduce evaporation.

2.7. Foaming Properties

The investigation of foam properties of VCP-treated WPI solutions was conducted using an air injection (bubbling) method similar to the Bikerman-type experiments [58] in a home-built foam instrument. The height of the created foam and the amount of drained liquid as a function of time were measured and used to calculate two characteristic parameters: foam stability in percent (FS) and amount of drained liquid in percent (DA).
The two foam characteristics are defined by:
F S % = H f o a m ( t ) H f o a m , f × 100
D A [ % ] = H l i q t H l i q , i × 100
Here, Hfoam(t) refers to the height of foam at a given time (t), and Hfoam,f refers to the maximum height of foam directly after gas injection has finished. Hliq(t) is the height of the remaining liquid volume underneath the formed foam at time t counted after the termination of gas injection, and Hliq,i is the initial height of liquid before gas injection. The foam half-life time (t1/2) is defined as the time, at which the FS value has reduced to 50% of its initial value.
The aqueous foams were prepared at room temperature (23 ± 1 °C) with a solution concentration of 20 mg/mL as the optimum value for the present studies. At concentrations lower than 20 mg/mL, the foam becomes unstable. The protein solution was carefully poured into a circular glass column (3 cm inner diameter and 30 cm height) up to a height of 1 cm. The foam was then generated by sparging air from the bottom of the column through a porous ceramic plate (porosity of 160–250 µm) at a fixed pressure of 0.2 bar. From a preliminary test, it was observed that after 1 min bubbling time the available protein solution of 1 cm height is almost transferred into foam. Therefore, after 1 min the airflow was stopped (here the time is set to t = 0) for all samples and the foam height was measured over time.
As the liquid drains out of the foam due to gravity, the location of the interface between the foam and bottom liquid gradually moves up. This process was monitored as a function of time to determine FS and DA. To visualize the changes in bubble size, photos were taken with a digital microscope (Dino-Lite AM3113 digital, Torrance, CA, USA) with a macro zoom lens (50×, f = 20–200 m), attached to the equipment close to the foam surface. All pictures were digitized with the Image-J software (Wayne Rasband and contributors, National Institutes of Health, Bethesda, ML, USA). The photos of foam bubbles were taken at 5, 10, and 15 min after the termination of gas injection, which appeared as reasonable times to be used for the comparison of the foam properties for different WPI samples. The segmentation of the image was carried out manually in different colors to enable the separation of contacting bubbles. Only complete bubbles were analyzed. For evaluating the bubble size distribution, the percentages of bubbles in each class (<0.35, 0.35–0.55, 0.55–0.77, and >0.8) and the corresponding standard deviations were calculated on the basis of triplicate experiments. The half-life time (t1/2) of the foam was calculated from FS% [59].

3. Results and Discussion

3.1. Influence of VCP Treatment on the Size of Aggregates and Their Zeta Potential

The mean size and Zeta potential of protein aggregates in buffer solution in dependence on the preceding VCP treatment are shown in Table 1. Only the VCP treatment with SF6VCP increases the size of aggregates as compared with the untreated sample (N). The increased aggregate size after SF6VCP treatment can be attributed to a strong oxidation and denaturation [47] causing higher hydrophobicity and the formation of disulfide bonds between the molecules. On the other hand, none of the employed VCP treatments were found to affect the aggregates’ Zeta potentials (between −25 mV and −27 mV). The negative value is in good agreement with the fact that the measurements were carried out at pH 7.2, i.e., well above the IEP of the WPI.

3.2. Adsorption Layer Behavior of WPI

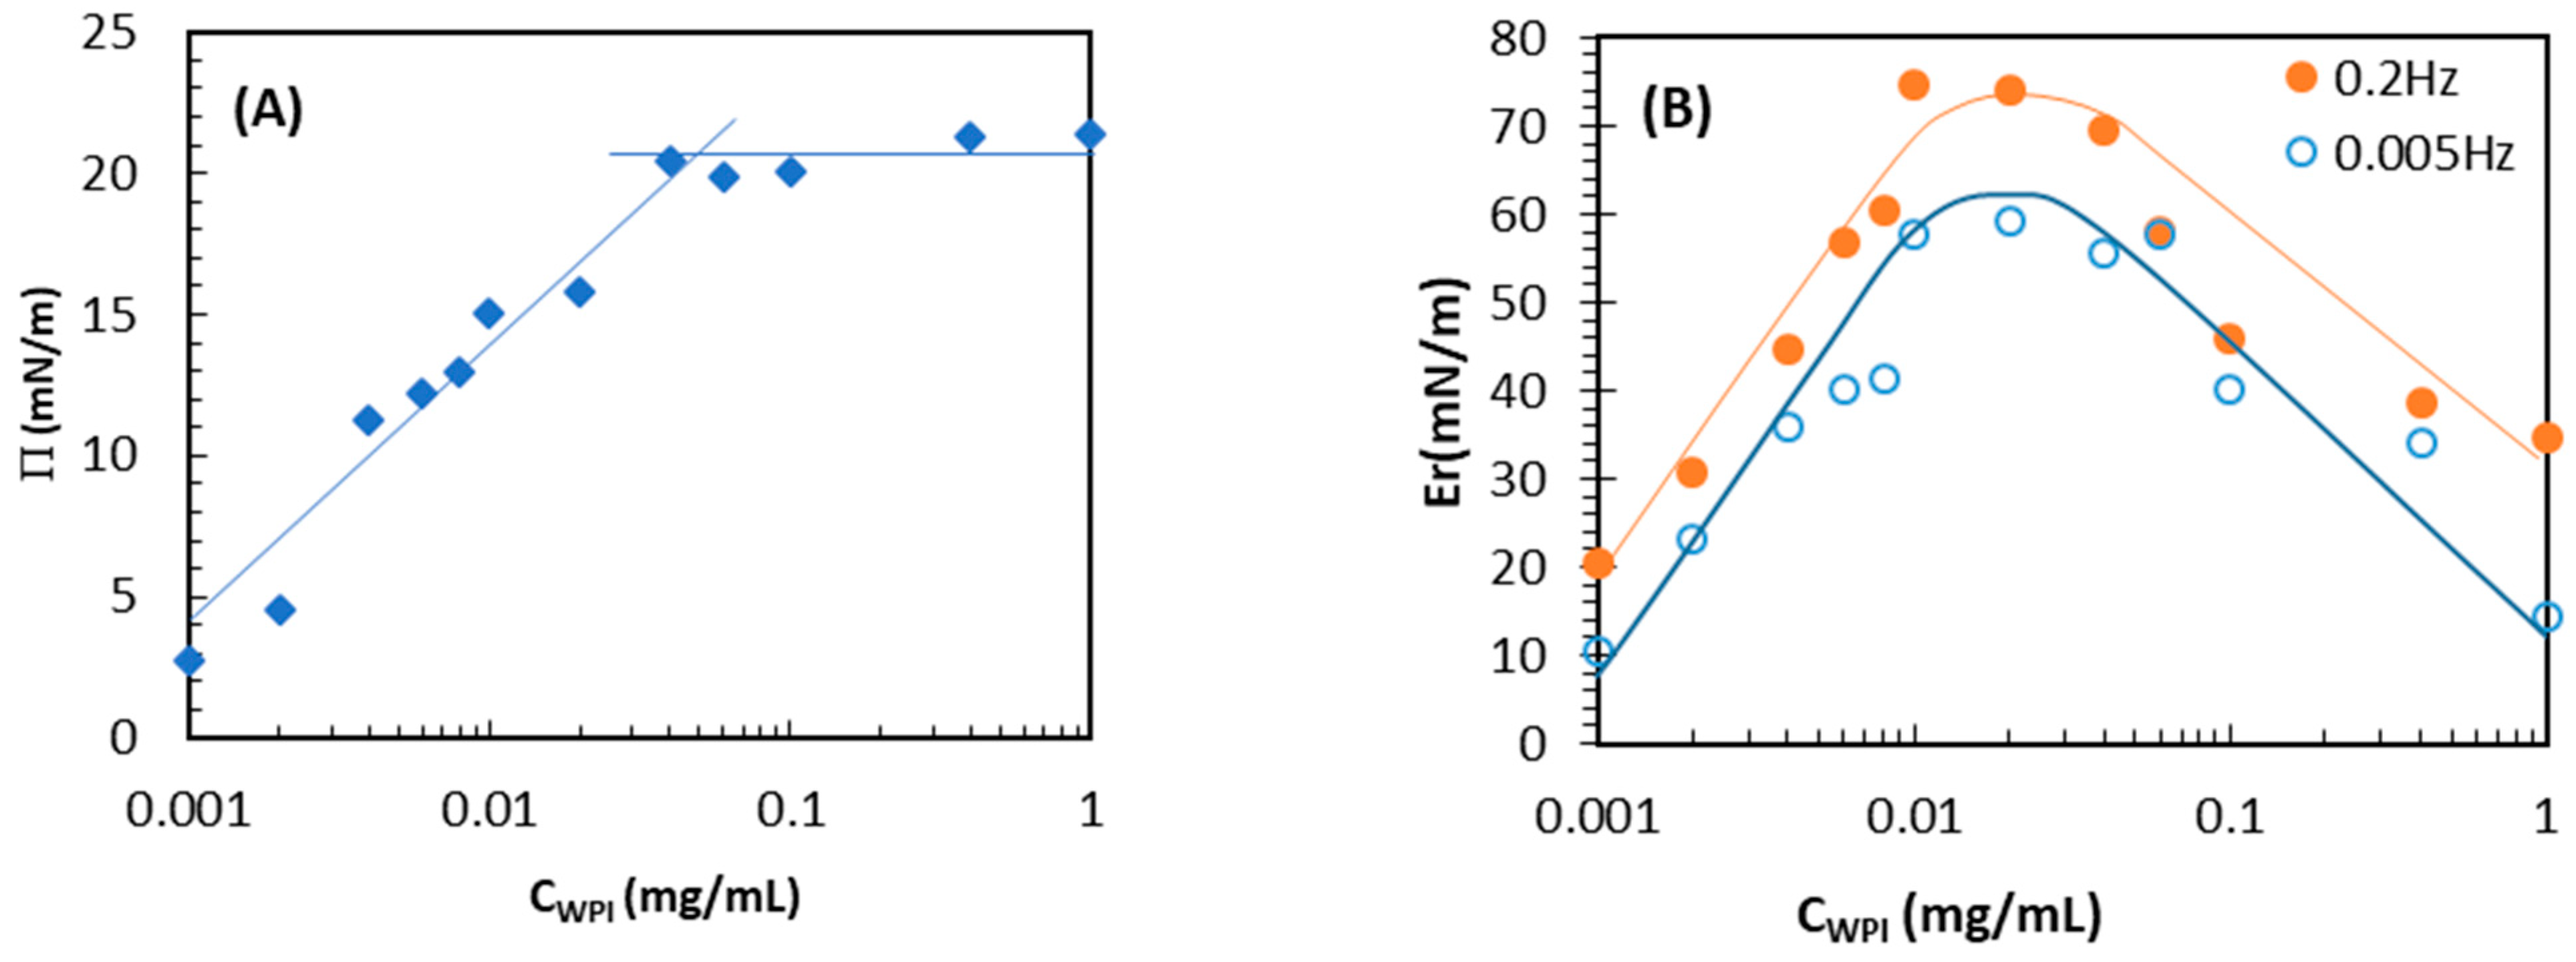
3.2.1. Surface Pressure Isotherm and Dilatational Elastic Measurement at Different Concentrations

A series of solutions with WPI concentrations CWPI in the range between 0.001 and 1 mg/mL were prepared. The final γ-values after 10,800 s were taken as equilibrium values γeq because the values of γ(t) did not change by more than 0.1 mN/m per 30 min. These values were used to construct the surface pressure isotherm Πeq(CWPI) = γ0 − γeq. After the adsorption equilibrium was reached, the dilational elasticity was measured also for all WPI concentrations at the two different frequencies of f = 0.005 Hz and f = 0.2 Hz. The dependence of the equilibrium surface pressure on the protein bulk concentration Π(CWPI) is shown in Figure 1A.
The surface pressure isotherm Π(CWPI) shows a kink at 0.04 mg/mL (Figure 1A) and then approaches a plateau value at the final bulk concentration of about 1 mg/mL (Figure 1A). The kink point has previously been interpreted as the concentration at which the protein starts to form a secondary adsorption layer [60]. The obtained value of the concentration, where the kink occurs, is in agreement with results of previous studies on WPI [61]. It should be noted that the shape of the Π(Cwpi) isotherm is typical for adsorption layers of proteins and can be well described by a thermodynamic model [60]. The dependency of the dilational elastic modulus on the WPI concentration Er (CWPI) is presented in Figure 1B. As can be seen, at a frequency of 0.005 Hz the value of Er increases up to a protein concentration of 0.02 mg/mL, passes a maximum at values of about 55–57 mN/m, and further decreases down to values of about 27 mN/m at a protein concentration of 0.1 mg/mL. At the higher frequency of 0.2 Hz, the general course of Er is similar; however, all values are generally larger by about 10–15 mN/m. The increase in elastic modulus up to the concentration of 0.02 mg/mL can be attributed to the increased adsorption of protein molecules at the surface. With the further increase in CWPI, Er starts to decrease (Figure 1B), which can be attributed to a more efficient relaxation of molecules in the secondary adsorption layer and between the two adsorbed layers [62,63,64,65]. At the concentration of 0.02 mg/mL, we observe the highest surface elastic modulus and at the same time a high surface pressure. This concentration appears therefore reasonable to be used for the comparison of the surface behavior of the different WPI samples.

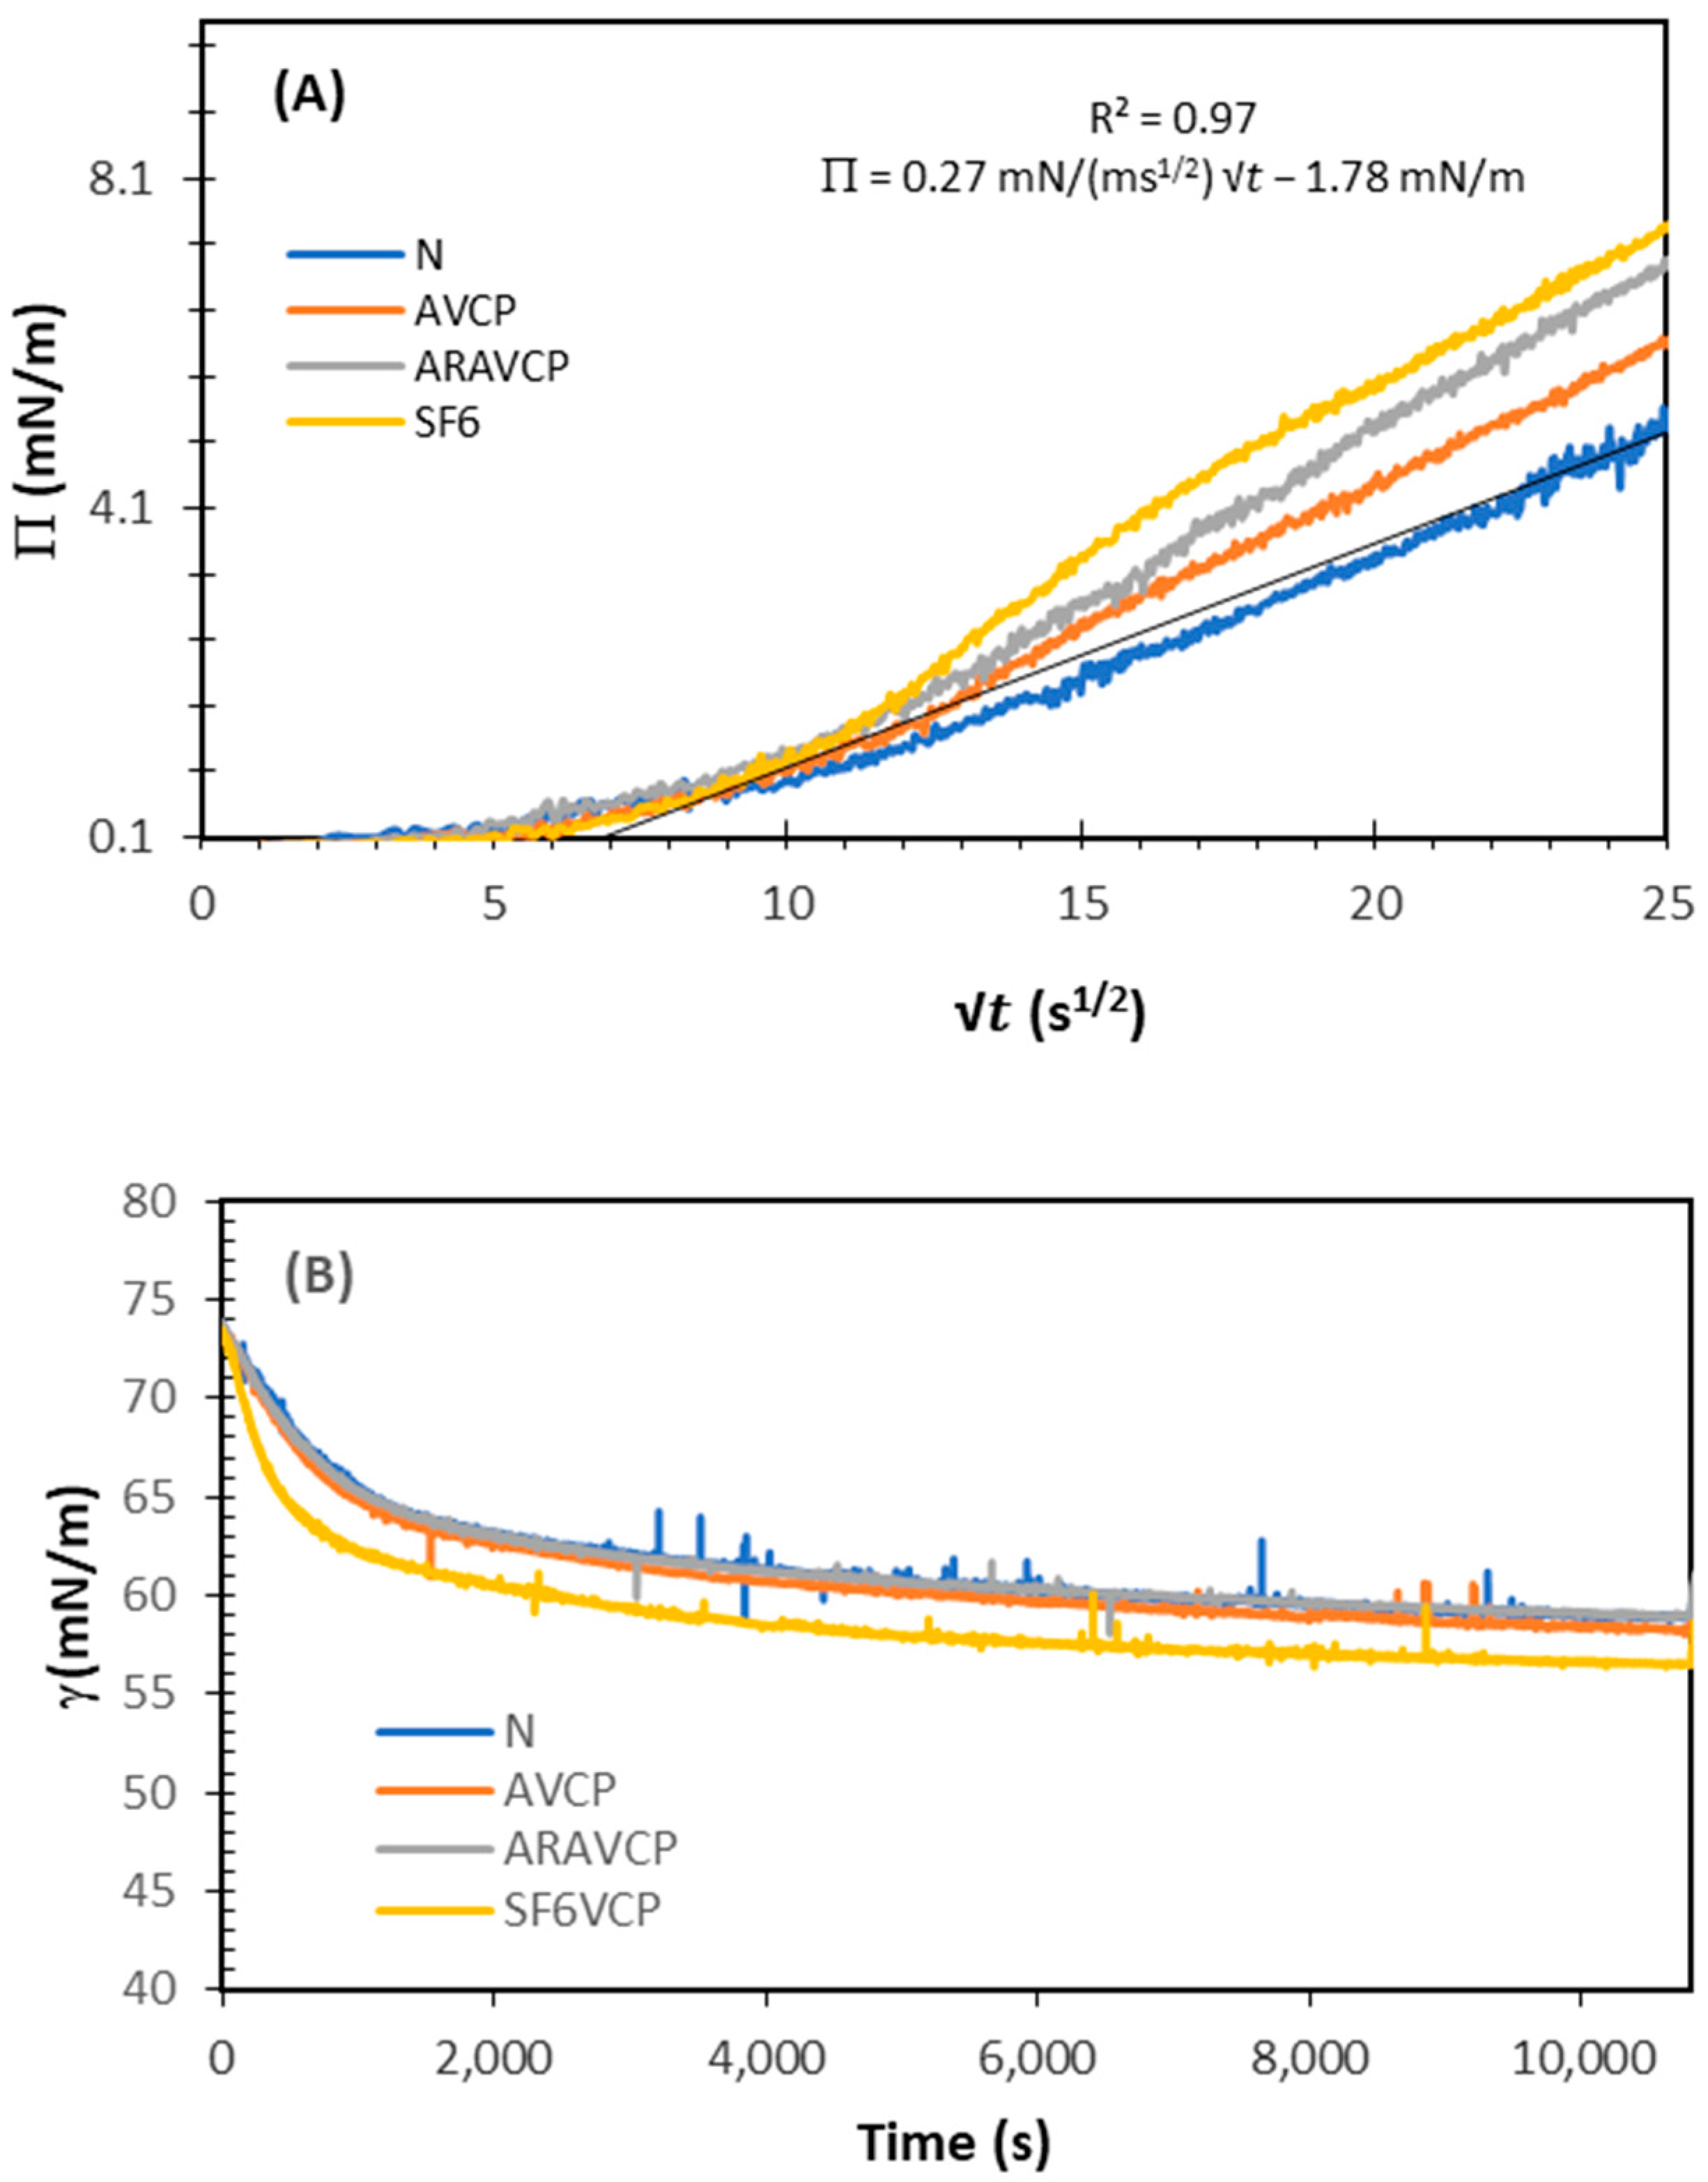
3.2.2. Dynamic Surface Pressure Measurements

The initial adsorption of WPI at the air/water interface is the most important step in the process of foam formation [66]. At the beginning of the adsorption process, at a sufficiently low bulk concentration, and in the absence of convection, diffusion is the rate-limiting process of the adsorption layer formation. This would mean that the surface concentration should change proportionally with √t. Hence, a plot Π( t ) should be linear and give access to the diffusion coefficient D, which is true for low-molecular-weight surfactants. However, Fainerman et al. [60] have shown that at low protein concentrations, an induction time is observed, within which the surface pressure does not change. Therefore, this induction time tind is a more important parameter to quantify the initial adsorption of the protein rather than the slope of the ( t )-curve. Still, we used the slope dΠ/( d t ) right after the induction time has passed as a second useful indicator to determine the effect of VCP treatment on the rate of WPI adsorption, as presented in Table 1 and Figure 2A.
Figure 2A shows the dynamic surface pressure curves of 0.01 mg/mL solutions of the different WPI samples and determined tind as the cross-section between the initial horizontal line (with an uncertainty of ±0.1 mN/m) and the steepest slope [52,67] of dΠ/( d t ) (see the solid straight line in Figure 2A). The obtained values are summarized in Table 1. Most of the treatments have no significant effect on tind. Also, the values of dΠ/( d t ) are quite close to each other, so we concluded that the VCP treatments have little effect on the early stage of the protein adsorption at the air/water interface. Only the values for tind and dΠ/( d t ) obtained by the SF6 treatment are larger than those for the non-treated WPI. The longer induction time and larger slope for the SF6VCP-treated sample could be attributed to the presence of larger protein aggregates in the WPI solution that decrease the rate of adsorption to the interface [47].

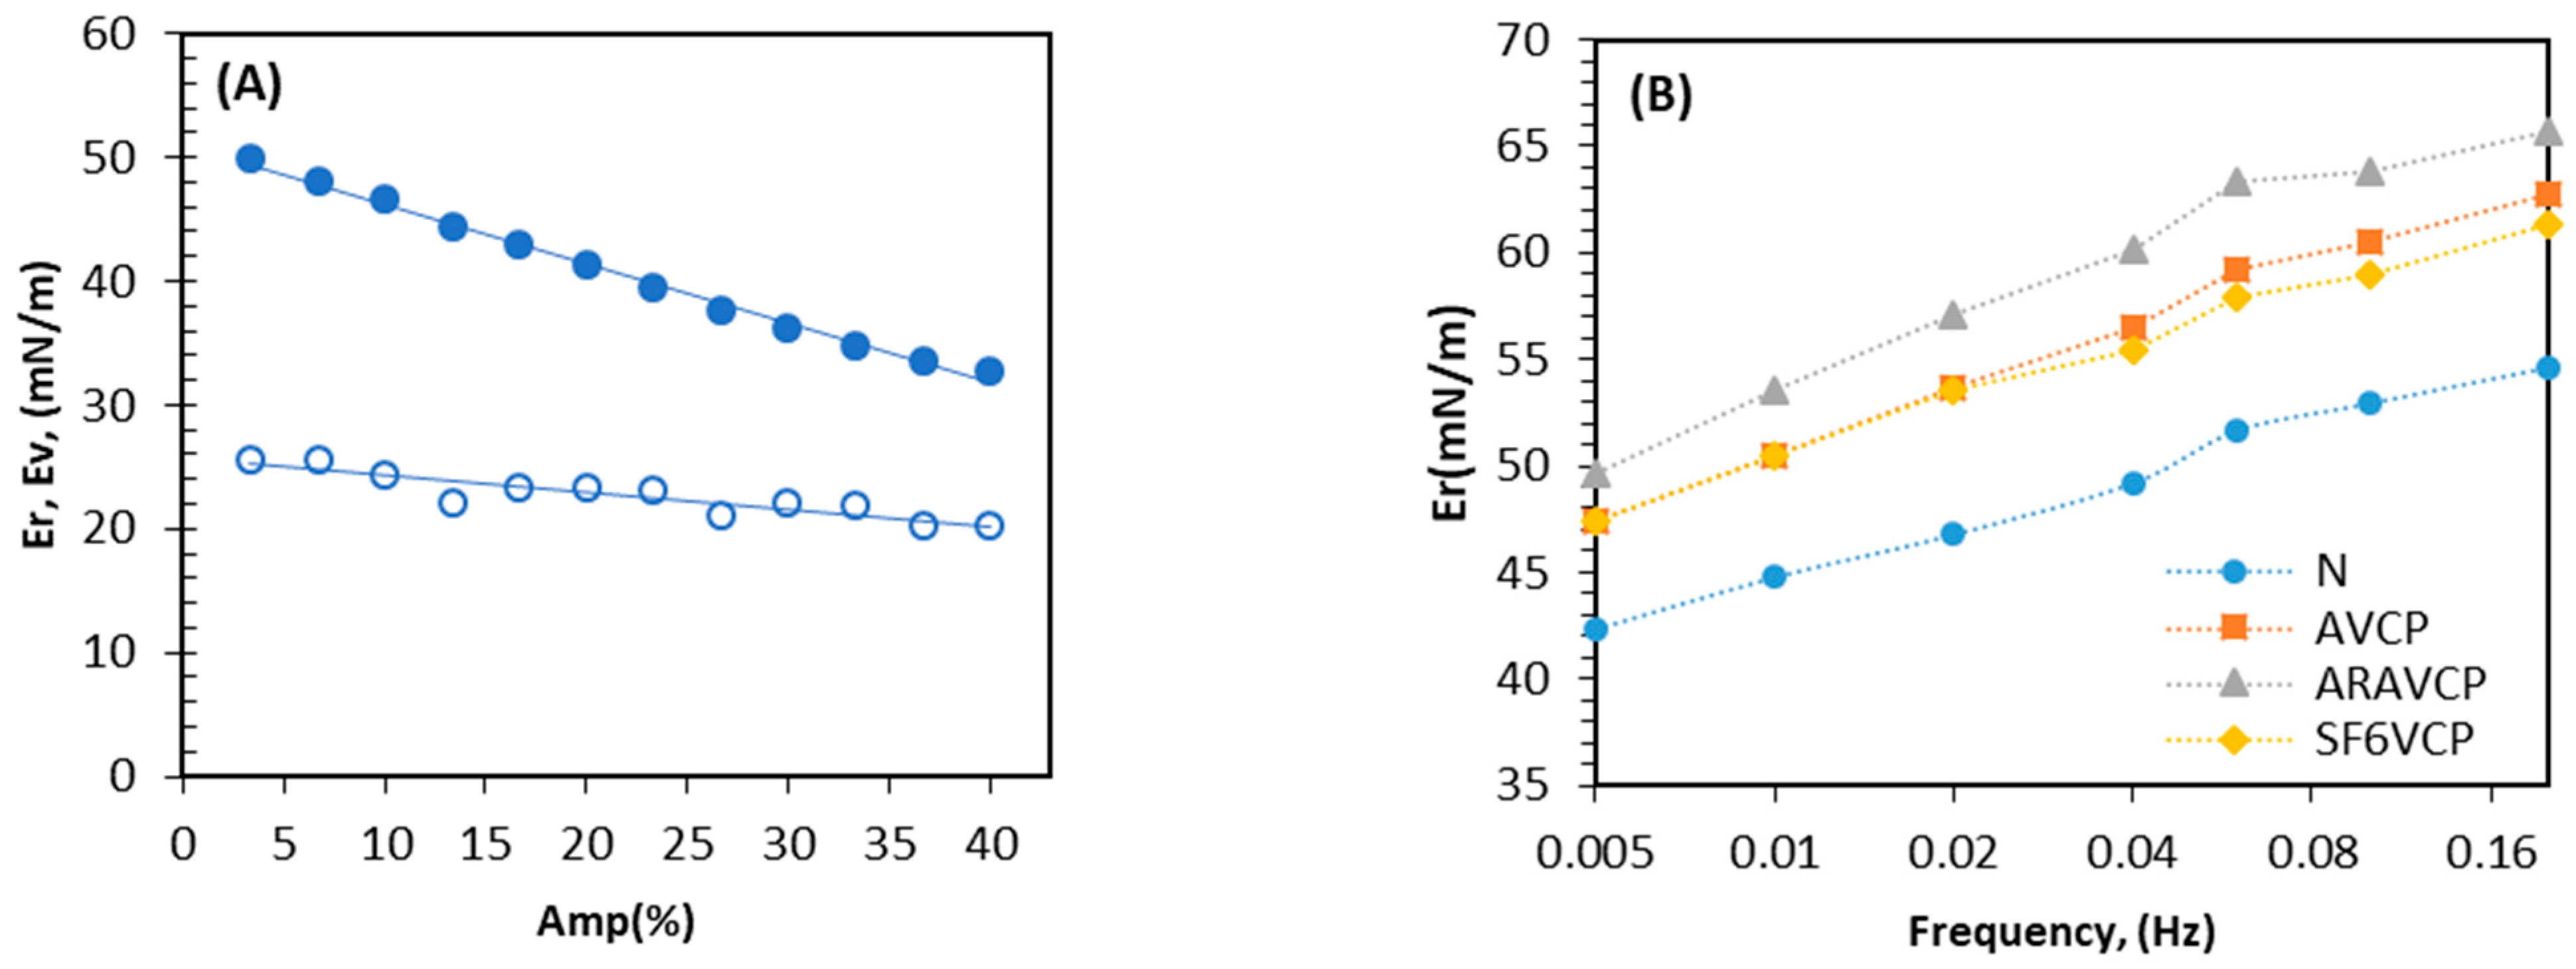
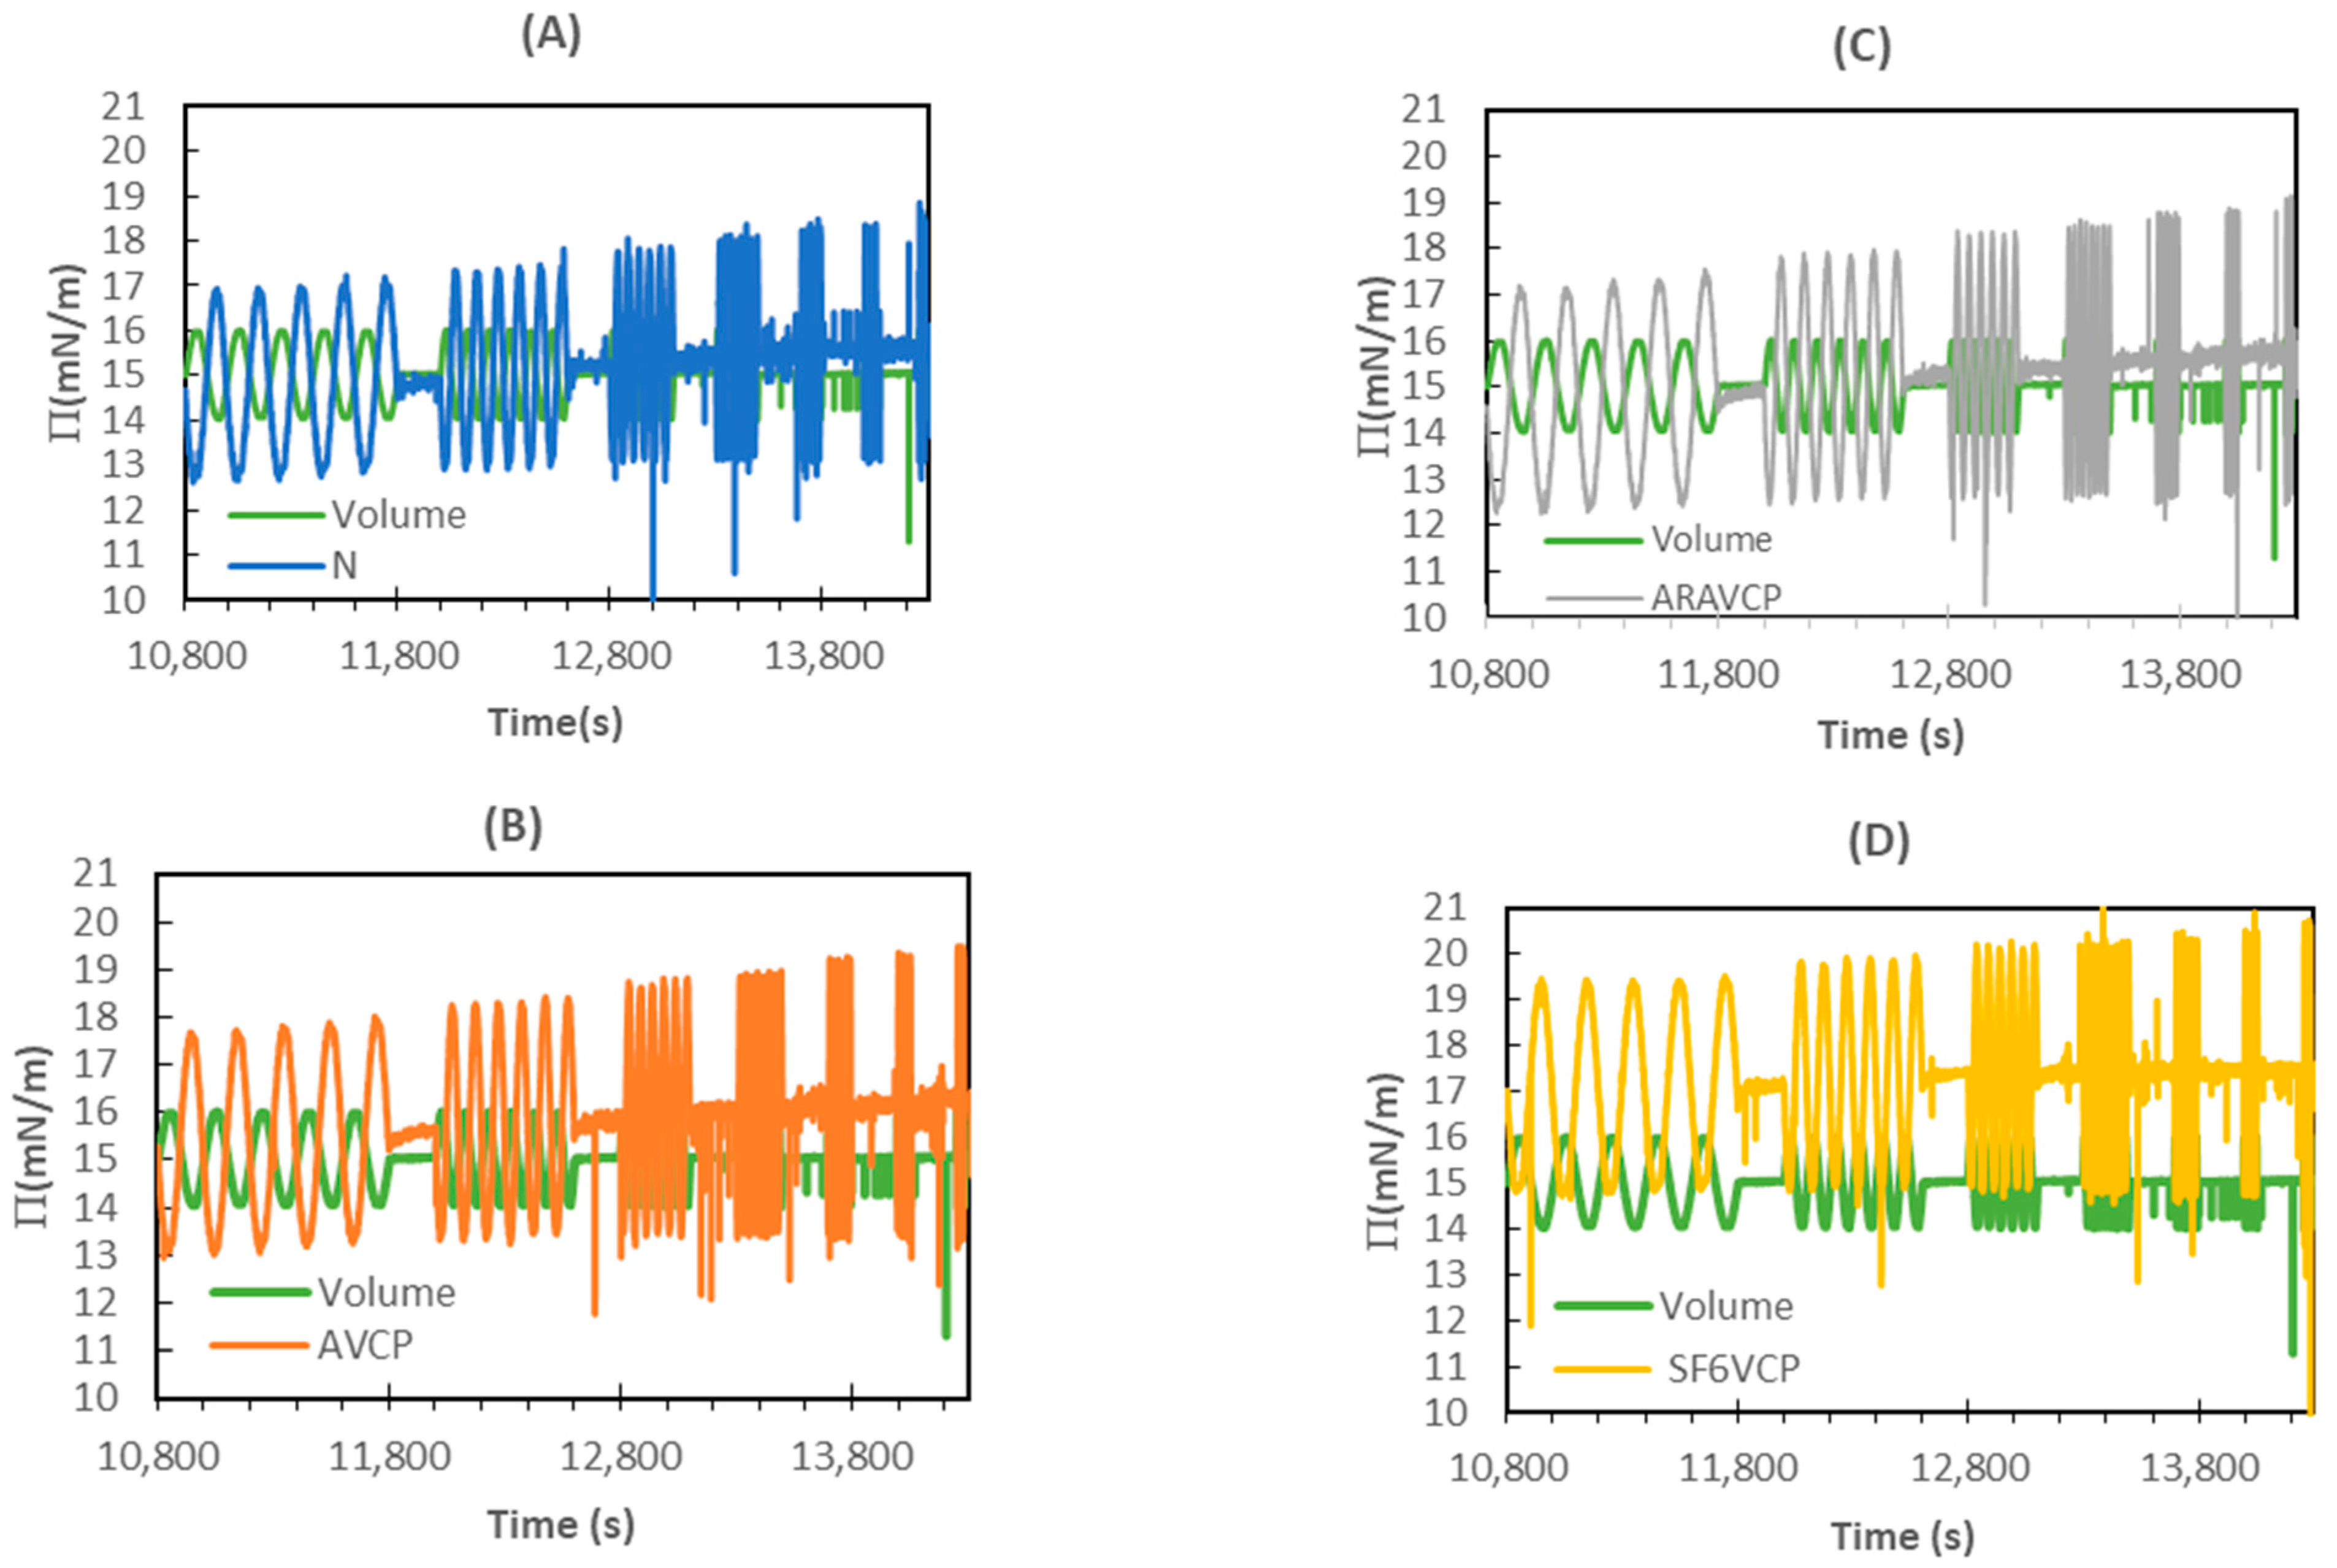
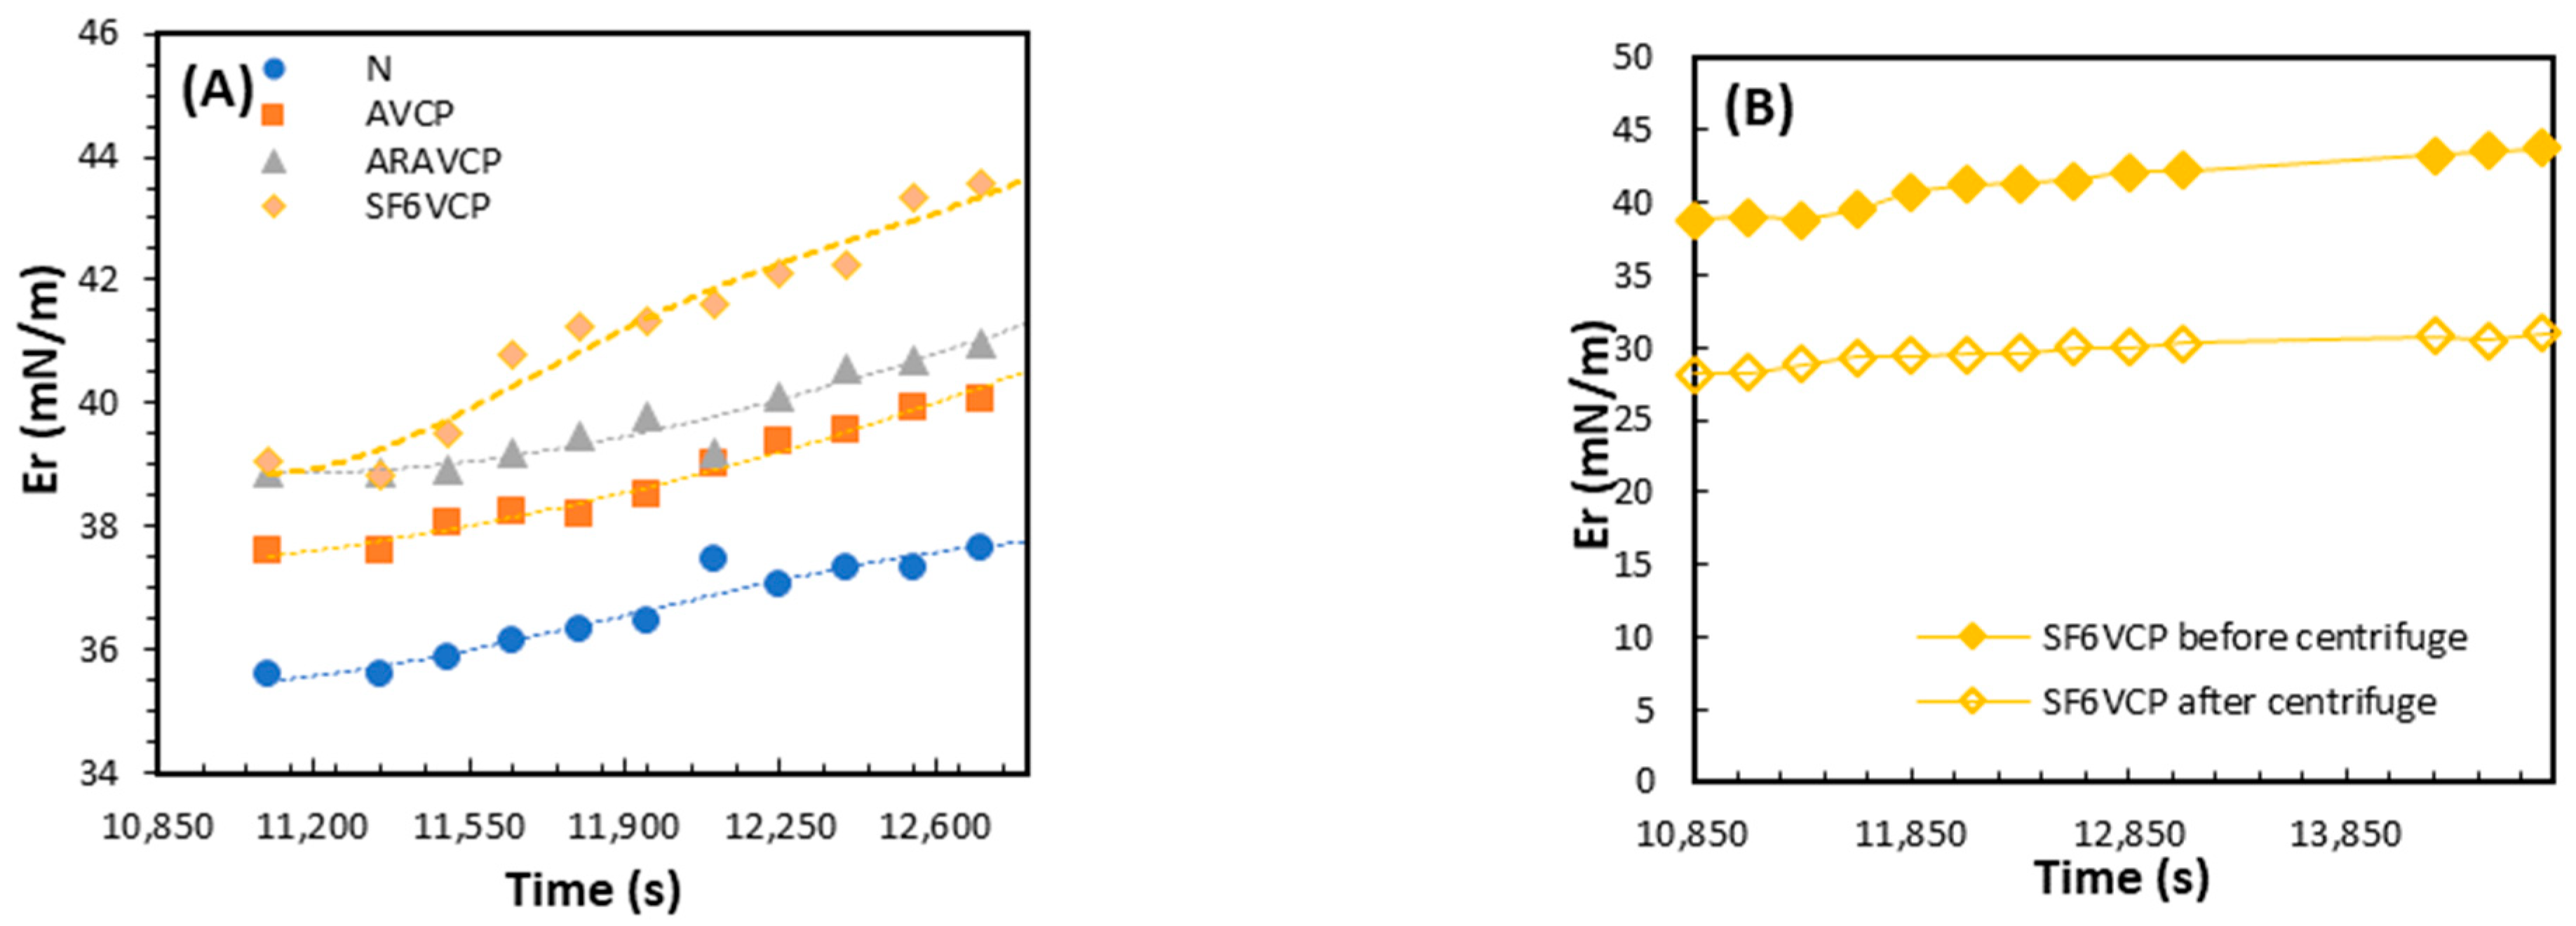
3.2.3. Surface Dilational Visco-Elasticity of Adsorbed Layers

To investigate the rheological properties of the WPI adsorption layers, we first determined the region of linear response by performing amplitude sweeps (ΔA/A, 3–40%) at a frequency of 0.04 Hz (see Figure 3A). Therefore, a comparatively small deformation of 7% was chosen for a frequency sweep. The frequency dependence of Er, measured with this amplitude before and after VCP treatments at a fixed concentration of CWPI = 0.01 mg/mL, is presented in Figure 3B and Figure 4A–D.
The Er values for all solutions of VCP-treated WPI samples are larger than those for the non-treated samples, most remarkably for ARAVCP (Figure 3B and Figure 4). This could be related to a different unfolding and exposure of the hydrophobic sites of the protein to the interface, resulting in an increased intermolecular interaction and possible rearrangement and aggregation of the adsorbed WPI molecules, so that a network is formed at the air/water interface. Furthermore, as it has been shown in our previous study [47], cold plasma treatment decreased the number of free sulfhydryl groups in the protein, depending on the type of gas used, and may lead to new disulfide bonds, which in turn increase the mechanical strength of the interfacial layer.
Nevertheless, the equivalent thickness values δeq for the WPI adsorption layers as measured by ellipsometry (cf. Table 1) do not show any significant differences. Hence, unfolding and the interaction between the protein molecules at the interface, instead of an increase in the adsorbed amount, cause an increased dilational elastic modulus for VCP-treated proteins.
After equilibration, the time evolution of the dynamic surface dilational elastic modulus Er at a concentration of 0.1 mg/mL and an oscillation frequency of 0.16 Hz (the highest available frequency for this type of measurement with PAT1) was measured over 30 min. As Figure 5A shows, Er gradually increases with time, which can be attributed to the increasing amount of adsorbed protein molecules at the surface [53]. In addition, as seen in Figure 4, the surface pressure changes during oscillations for all VCP-treated samples, especially for the AVCP- and SF6VCP-treated samples.
Thus, we can conclude that even after 3 h of adsorption, the WPI molecules have not yet fully reached the equilibrium state of adsorption, but, probably due to the continuous expansion and compression of the adsorption layer, further changes in its composition and structure were going on. The expansion opens up additional free adsorption sites at which additional proteins irreversibly adsorb, such that the adsorbed amount further increases with time, and this increase is most pronounced for WPI treated with SF6VCP.
To identify the role of protein aggregation in the variations in Er, a solution of SF6VCP-treated WPI at a concentration of 20 mg/mL in phosphate buffer was centrifuged (Thermo Fisher, Darmstadt, Germany) at 10,000× g for 30 min at 20 °C. Such a centrifugation should be sufficient to remove all particles larger than 1 µm, i.e., the insoluble fractions of the aggregated protein [68]. Indeed, the results in Figure 5B show a decrease in Er after centrifugation. This shows that the larger protein aggregates in the not-centrifuged sample contribute significantly to the surface dilational elasticity. Over time, however, we observed the same trend for the measured Er values, surely caused by a continuous adsorption of additional protein molecules in the moments of surface layer expansion.

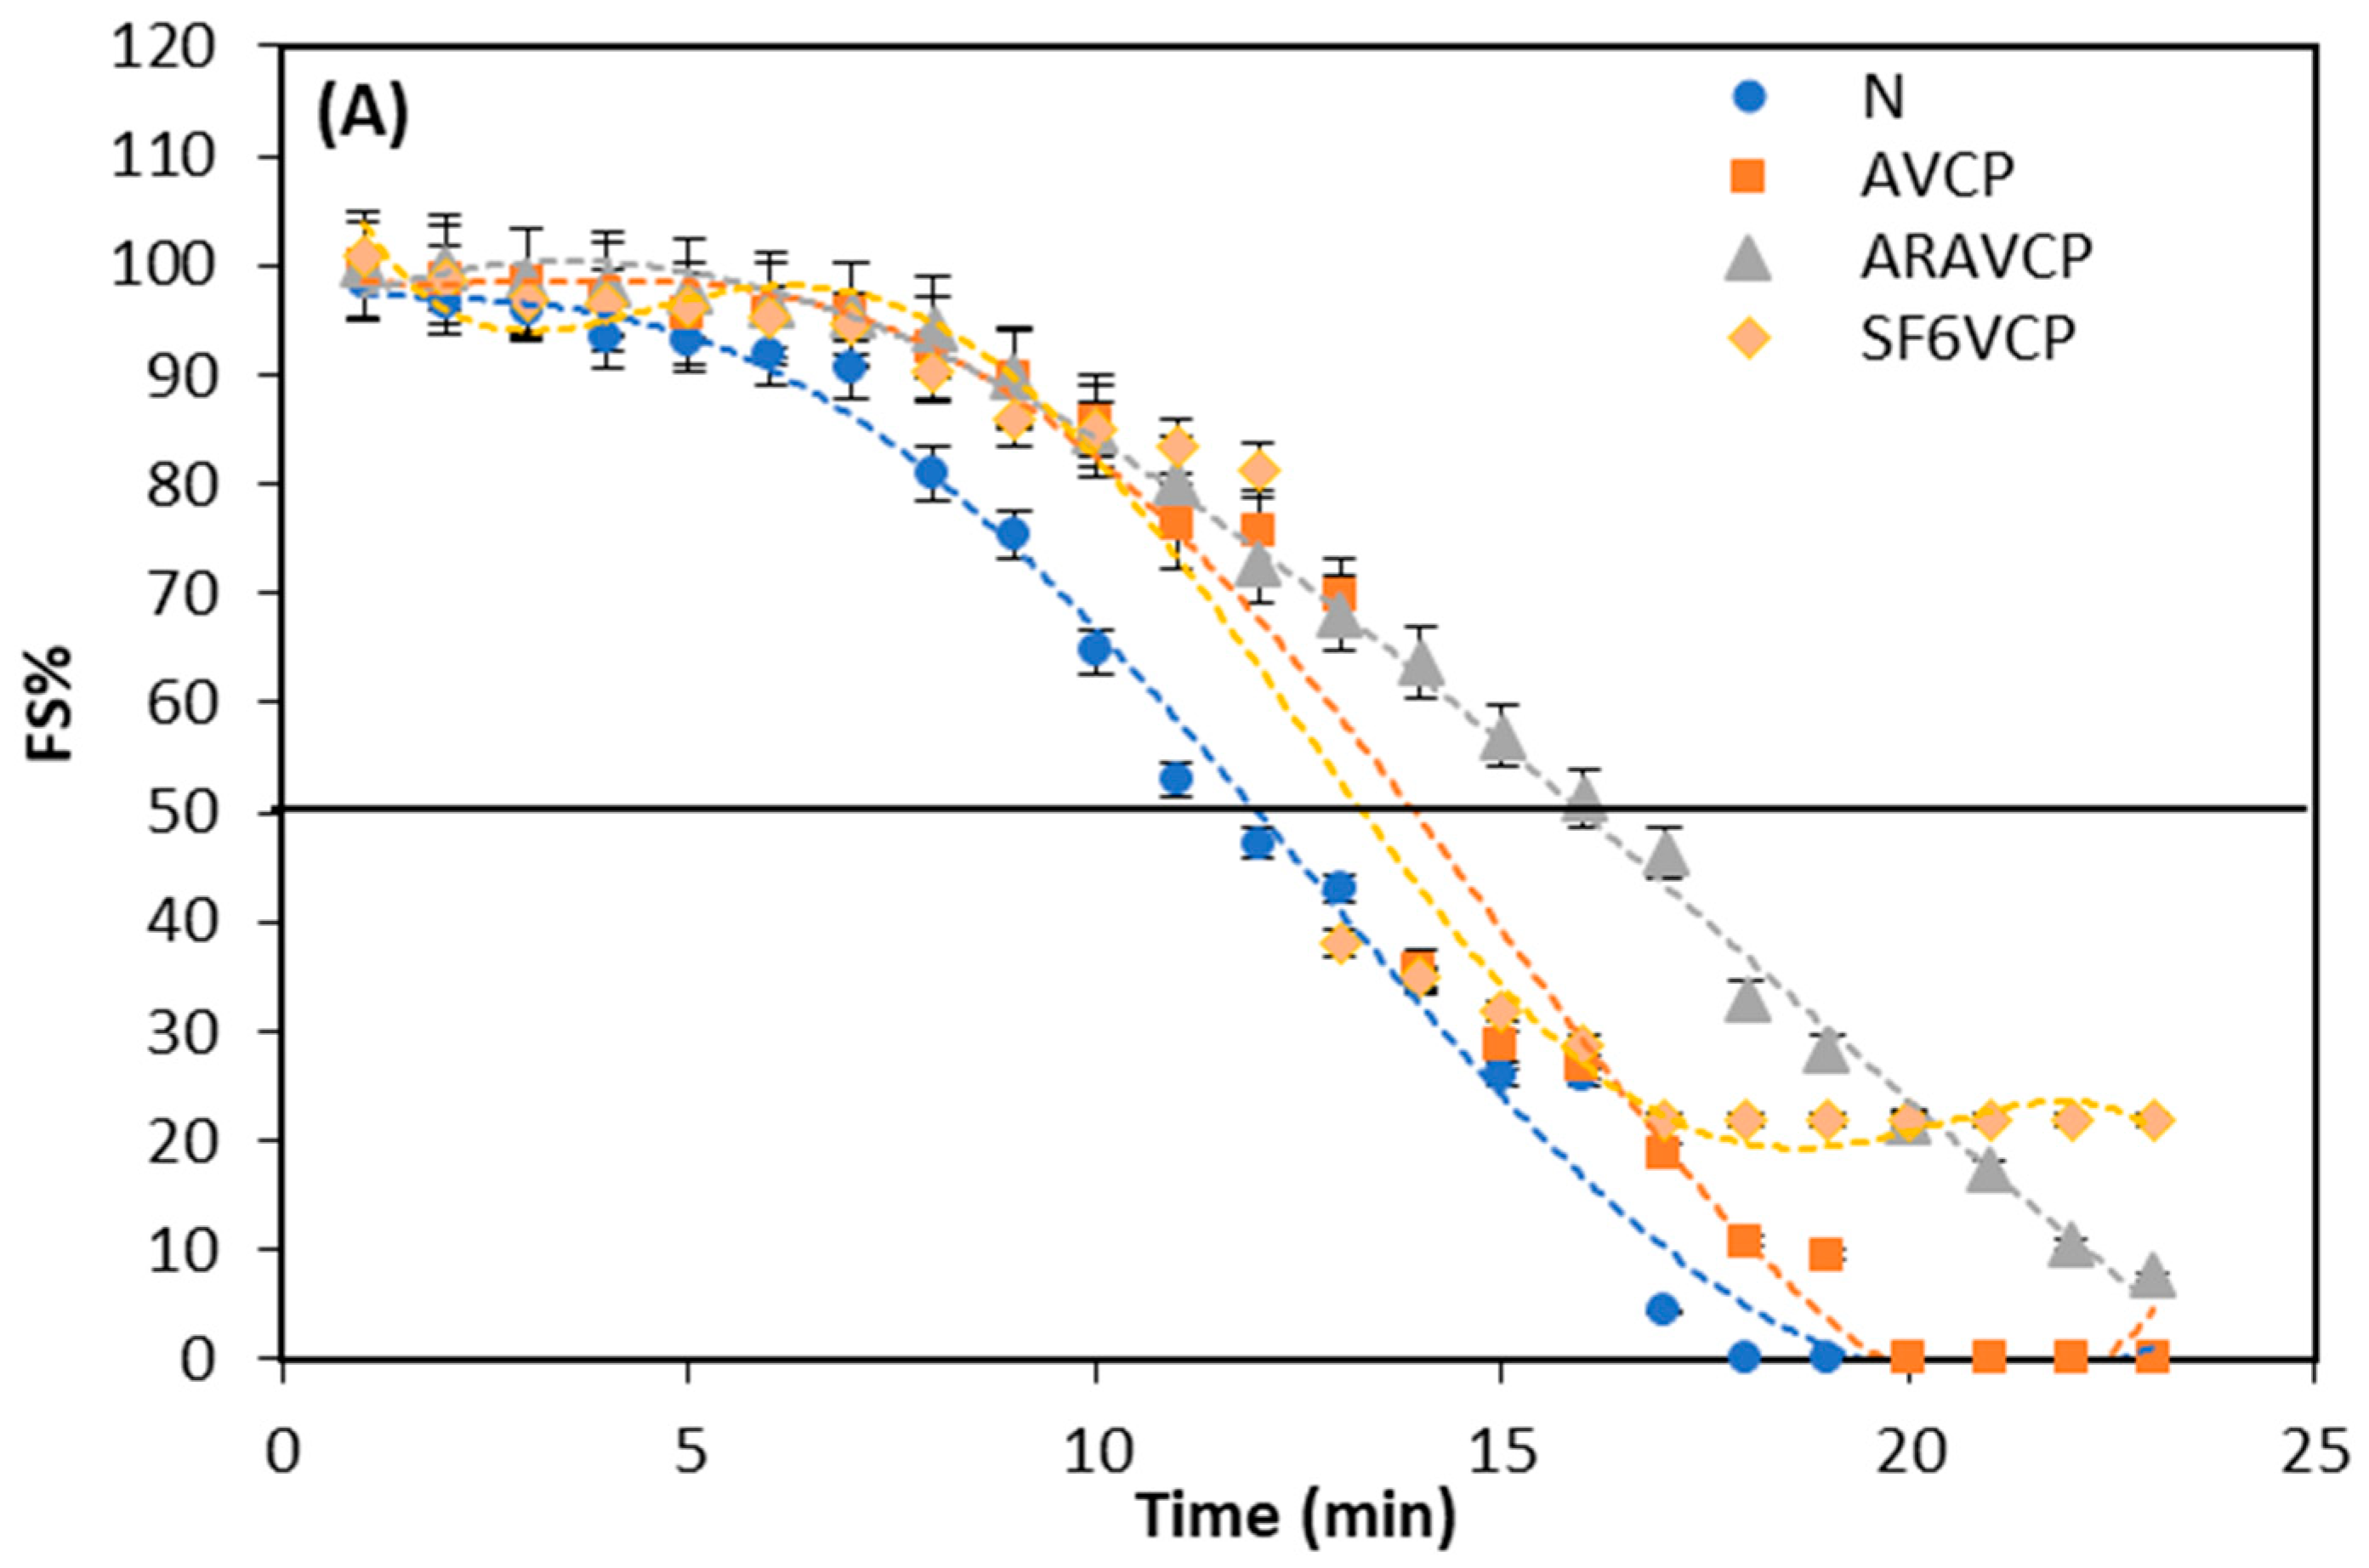
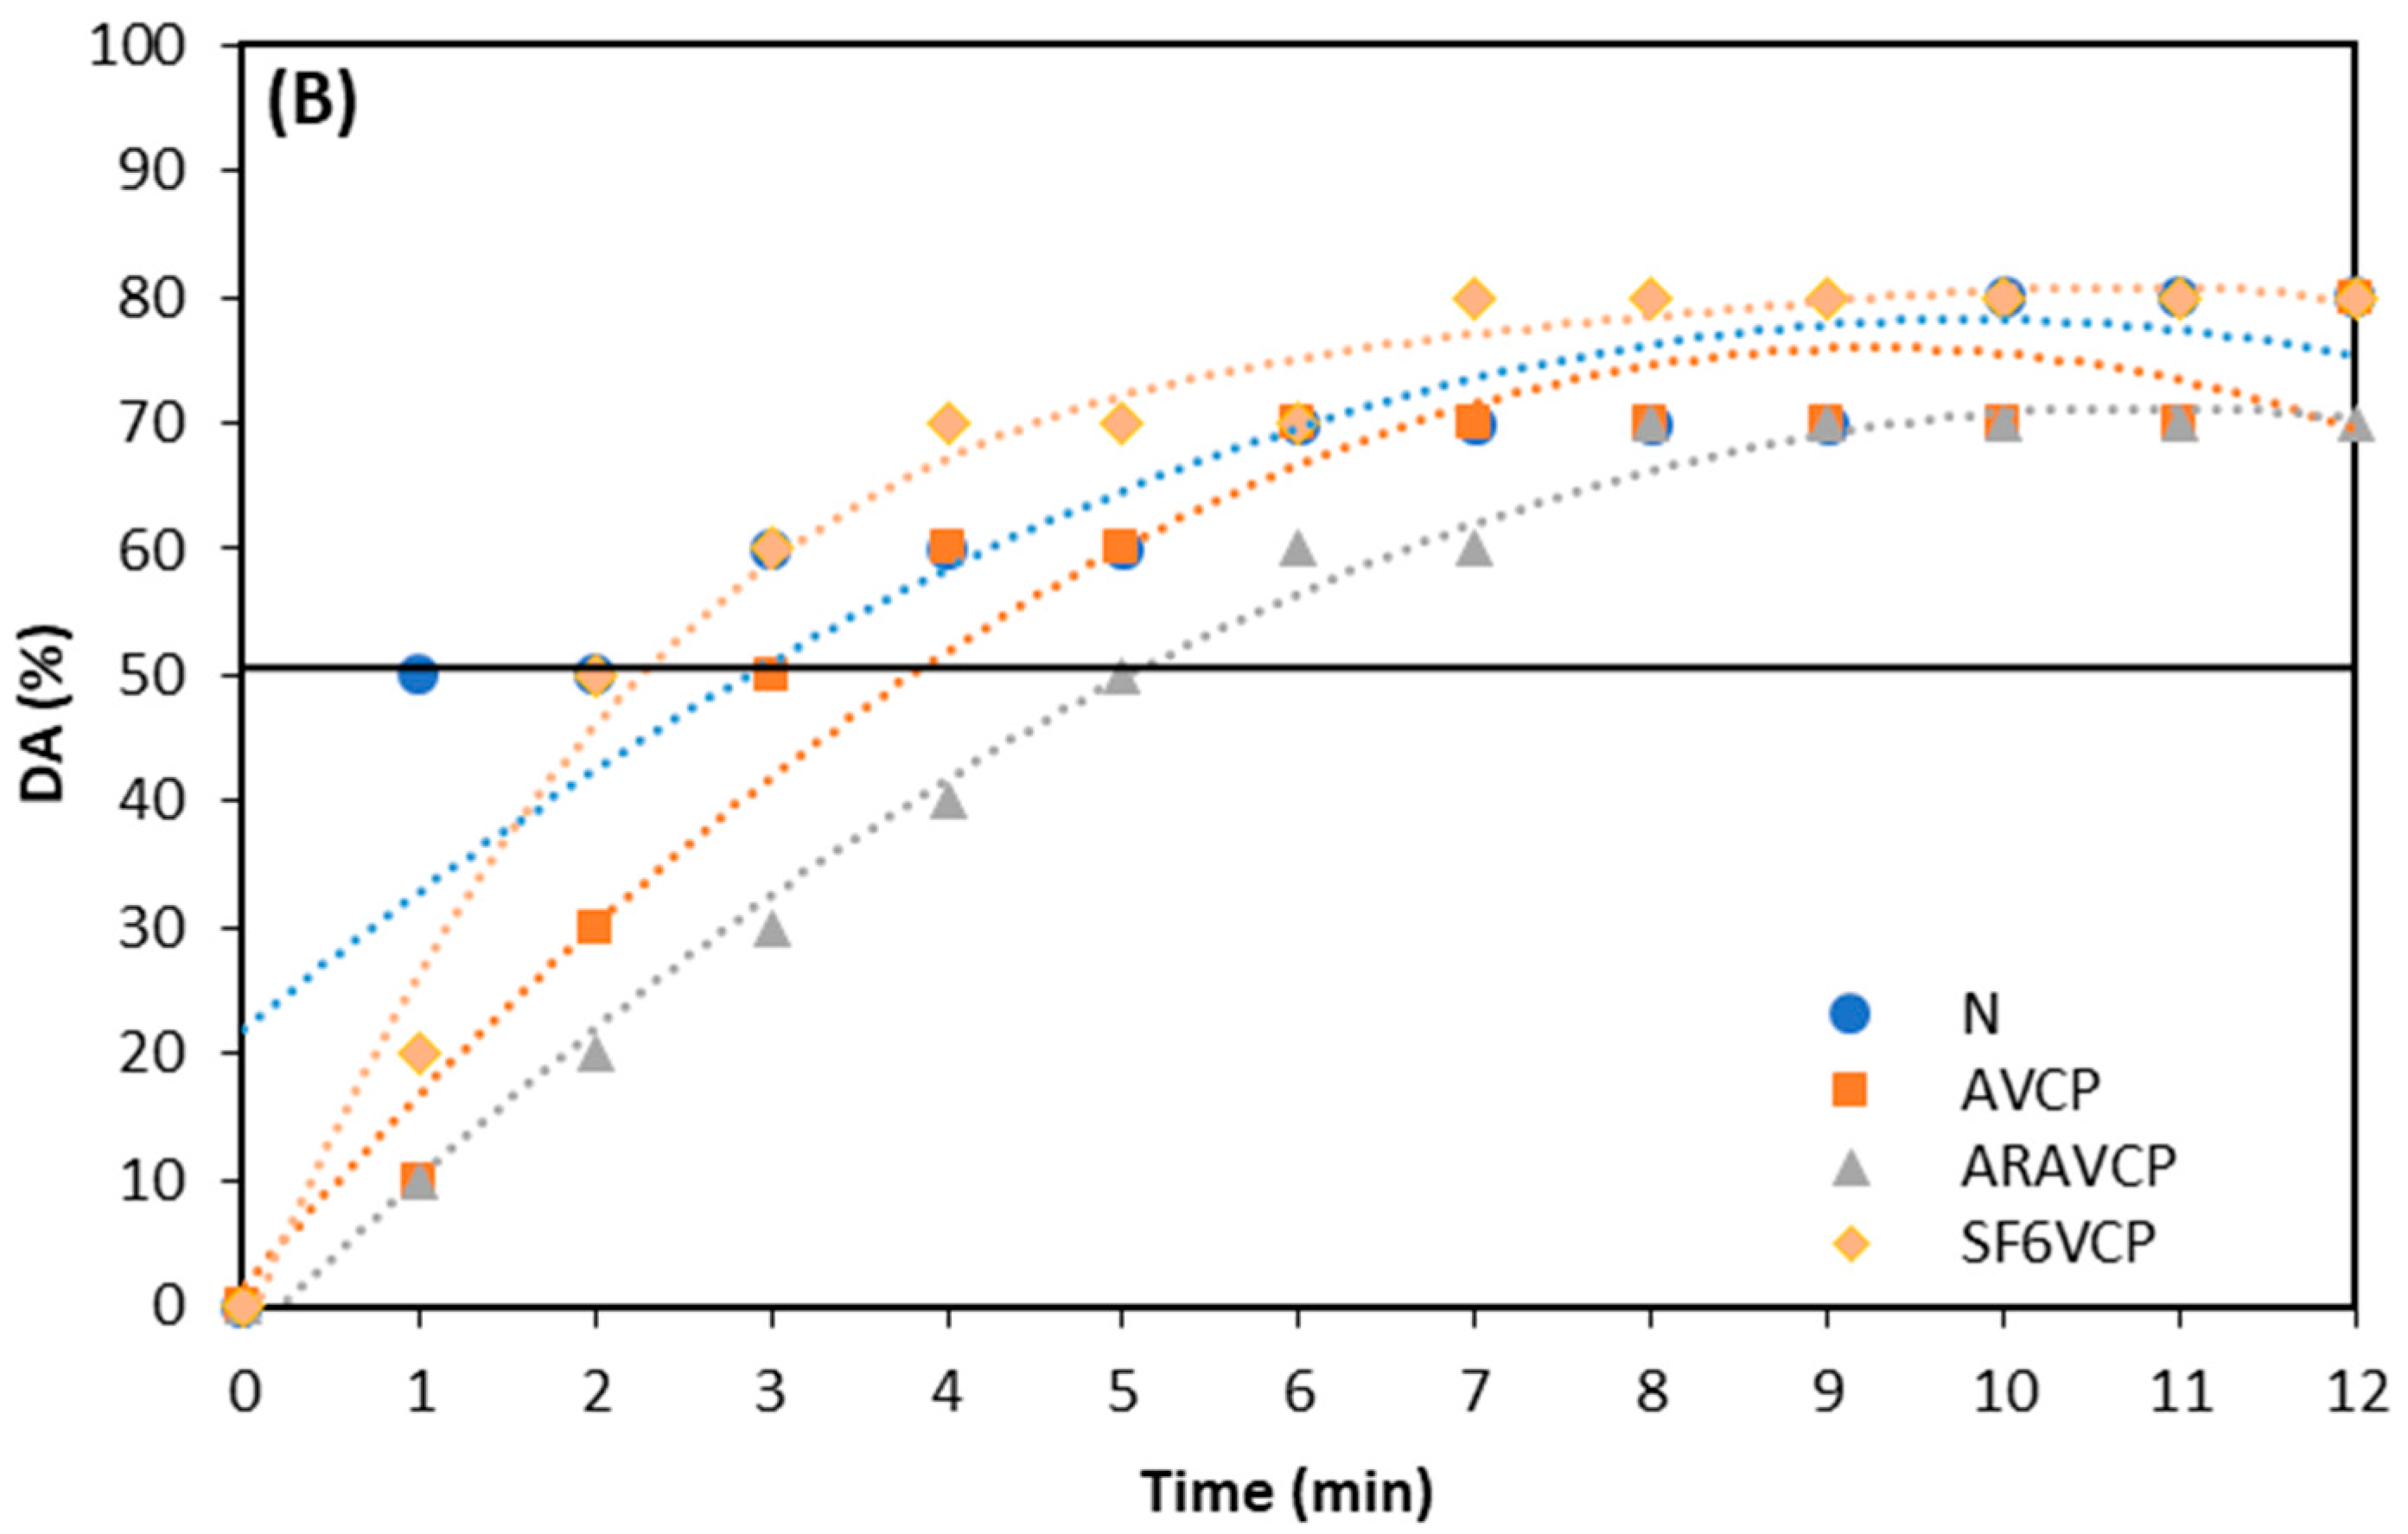
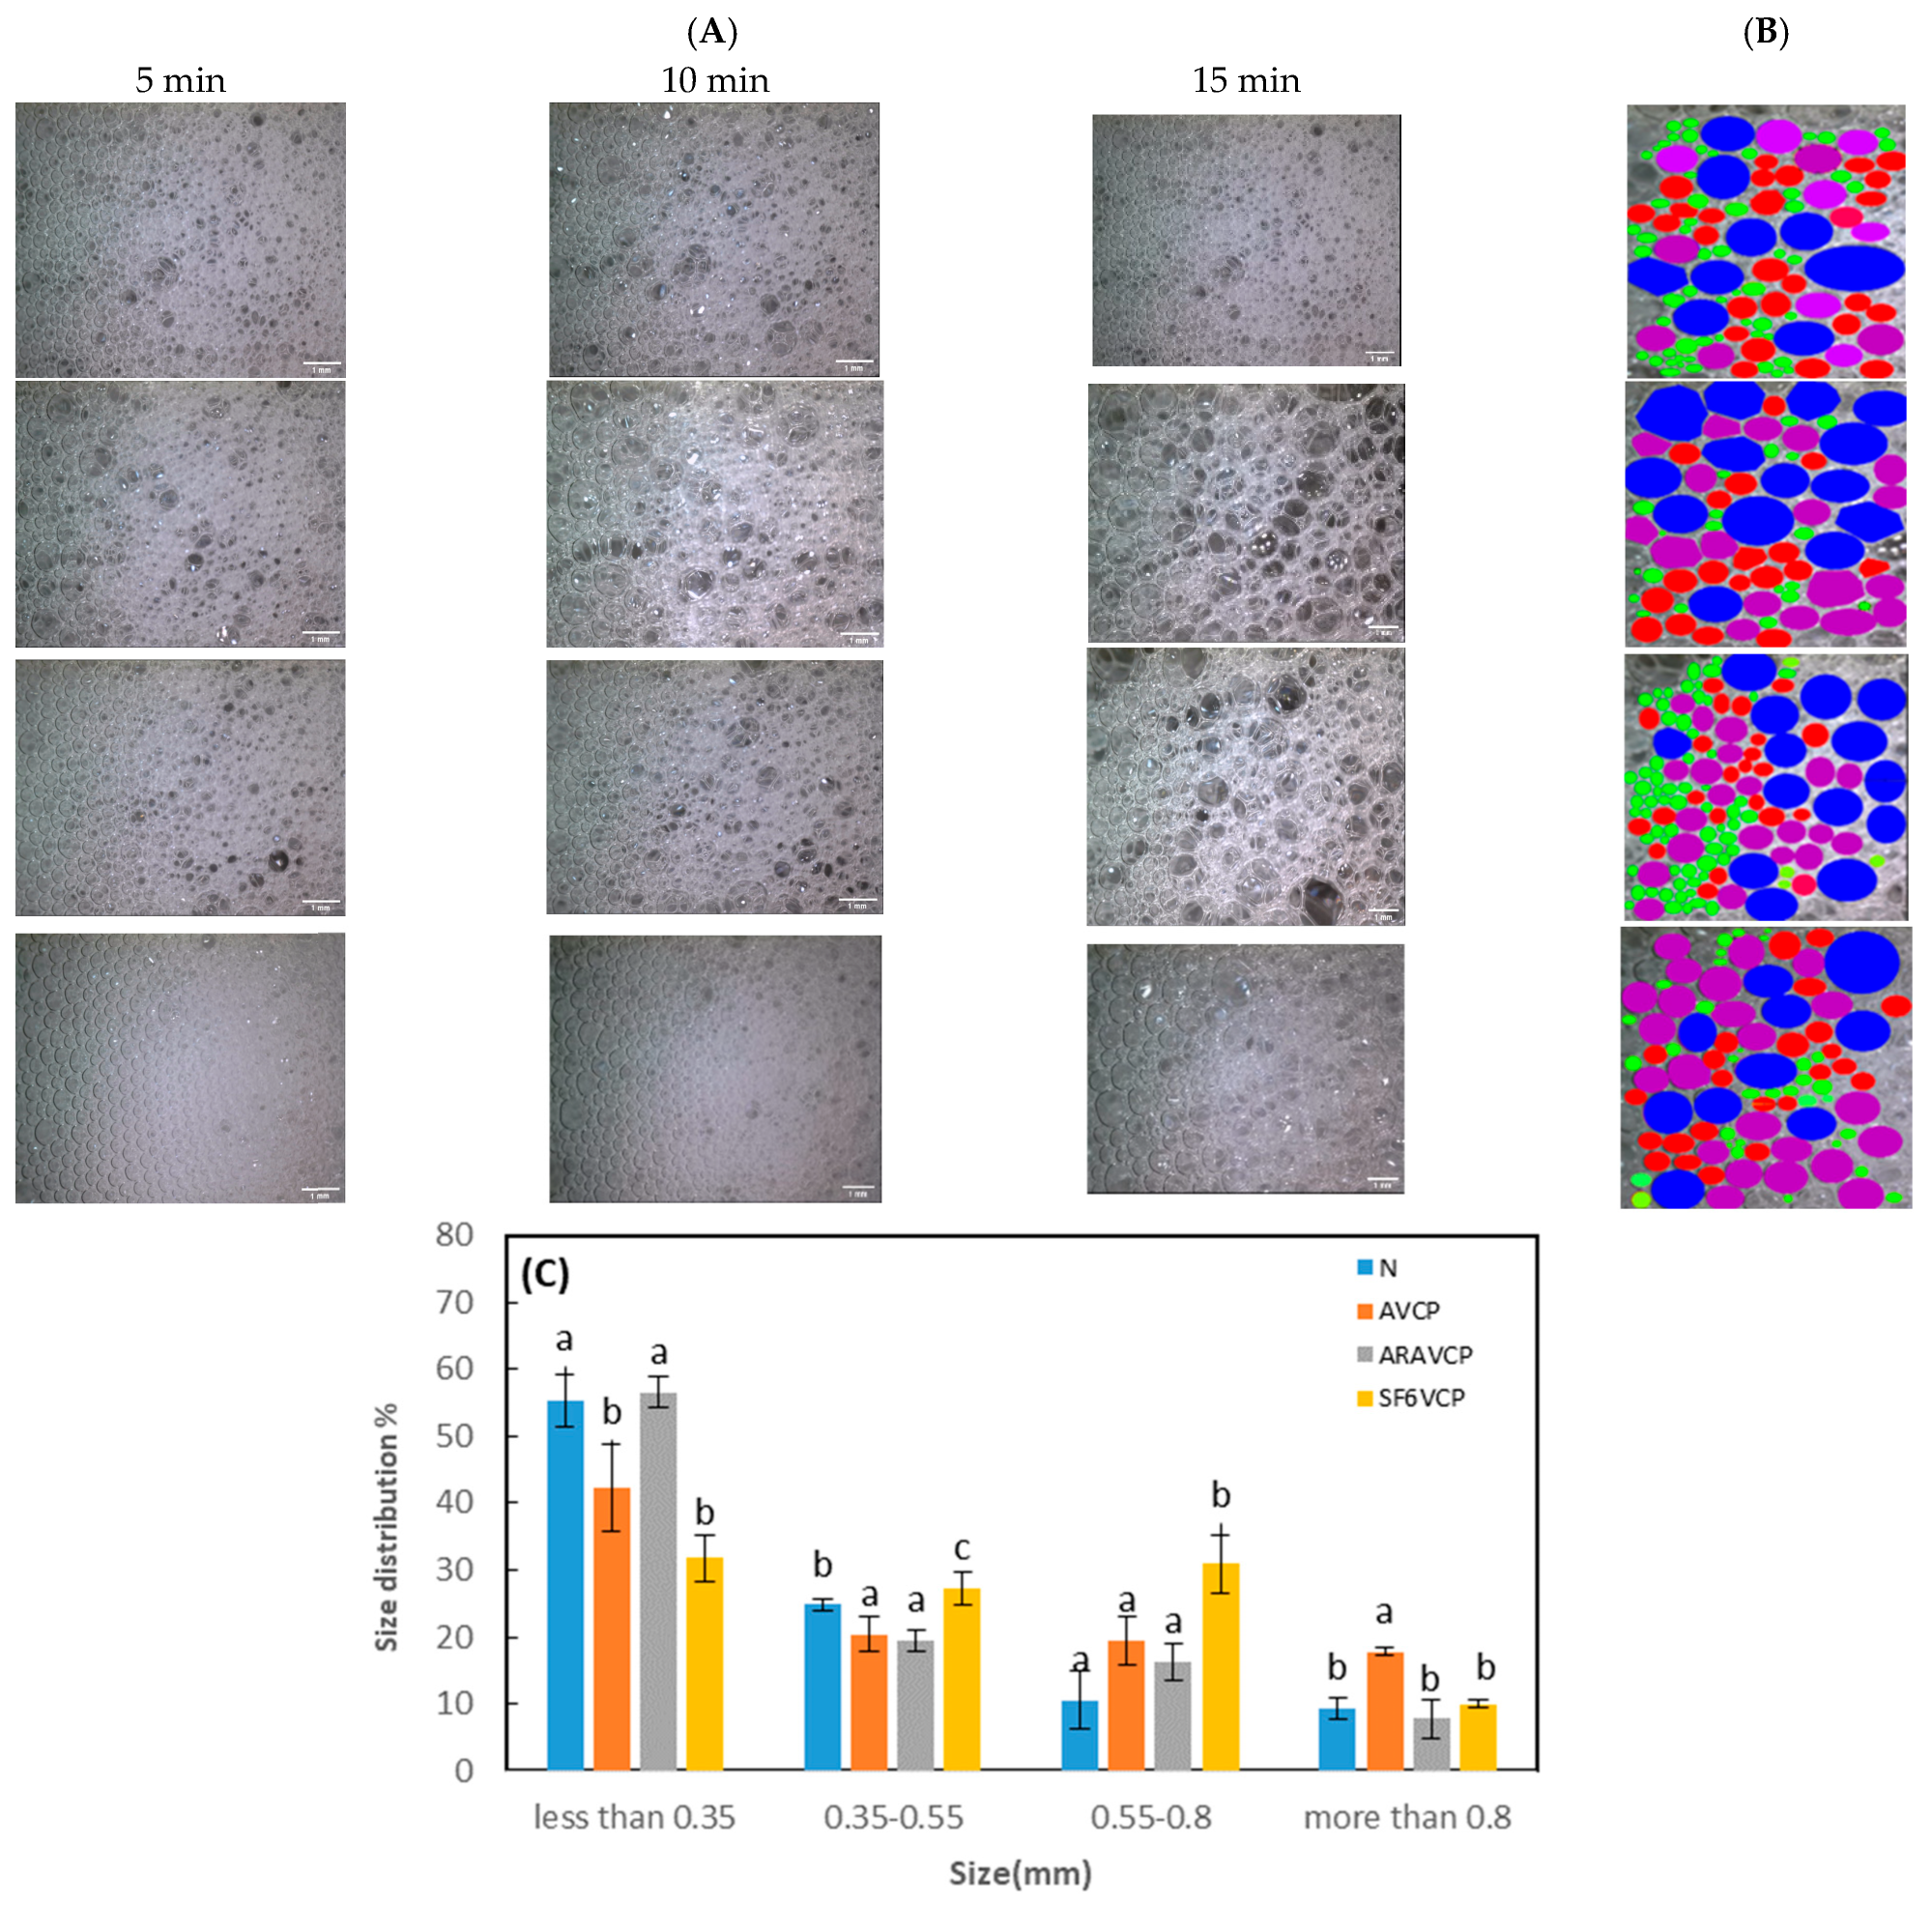
3.3. Foaming Properties

For applications of WPI as foaming agent, information on both the foamability and foam stability are relevant. The start points of the curves in Figure 6A show the height of foams generated for all studied WPI samples, which are all quite similar. The foam height of the non-treated (N) WPI samples were slightly higher (11.5 cm) than those for the VCP-treated samples (10.5–11) but the differences are not significant. Similar findings were reported in [69], which revealed that after 15 min of CP treatment, the foamability remained almost unchanged. As the induction time and the rate of adsorption values (in terms of dΠ/d√t) for solutions of VCP-treated samples, shown further above, were close to each other, similar foaming values were expected.
The stability of foams was determined by three parameters: FS (Figure 6B), bubble diameter after 15 min (Figure 6C), and half-life time (t1/2). As can be seen in Figure 6A, the t1/2 values obtained for ARAVCP-treated WPI solutions are found to be remarkably higher as compared to the other WPI samples. In total, as can be seen in Figure 6A, all VCP-treated proteins show a higher foam stability compared to the non-treated WPI. The foam of SF6VCP collapsed at 13 min after the termination of bubbling but it does not completely break down to zero: about 2 cm of foam remains in the column.
ARAVCP-treated WPI has a slower drainage than the other samples (Figure 6B). The most likely explanation for the increased foam stability after the application of ARAVCP is that the protein was able to unfold at the bubble surfaces along with the subsequent creation of a visco-elastic network due to stronger protein–protein interactions as was reported in [58,70]. In this regard, all solutions of VCP-treated samples showed a slower liquid drainage compared to the non-treated WPI of up to about 3 min (Figure 6B).
Earlier studies confirmed the effect of cold plasma on the increase in foam stability via the decrease in the drainage and observed changes in the half-life time [41,69,71]. These studies related the higher foam stability of WPI to the increased hydrophobicity of protein and the presence of aggregates due to the oxidation of protein during the cold plasma treatment [72,73]. However, they also showed that plasma treatment over a longer time shows larger differences in the foam behavior.
The higher Er values of ARAVCP-treated WPI (Figure 3B) also support our findings on the increased foam stability, which are that the interfacial layers with higher surface elastic modulus have a reduced tendency to film rupture and hence there is reduced bubble coalescence. Thus, protein-aerated systems need a high surface elastic modulus to prevent rapid foam destabilization [74].
Figure 7A shows images of foams taken for the four WPI samples at 5 min, 10 min, and 15 min after termination of the bubbling. During storage of the bubbles, liquid drains out of the film lamellae, which causes the films to become thinner and eventually rupture [75]. Therefore, foam stability increases when both the rate of coarsening and bubble coalescence decrease.
In Figure 7B, the bubble composition of the WPI-stabilized foams is shown. The evaluation of the bubble size distribution and average bubble size in the foams after 15 min of drainage (Figure 7C) indicates that about 56% of bubbles for ARAVCP-treated WPI comprises bubbles with average diameters lower than 0.35 mm. This percentage is higher compared to the other VCP-treated samples. Although the percentages of smaller bubbles after 15 min show no significant differences between ARAVCP-treated and non-treated WPI, the number of smaller-size bubbles and their homogeneity in AVRVCP-treated WPI is higher than for the non-treated WPI after 10 min of bubbling (Figure 7A). As we explained further above (Figure 6B), ARAVCP-treated WPI shows the minimum rate of drainage during the time up to 12 min, which supports the findings on the smallest bubble sizes (Figure 7C). Smaller bubble sizes and more narrow bubble size distributions lead to a slower coarsening and results in a higher foam stability.
Among all VCP-treated samples, the SF6VCP-treated WPI shows a more narrow bubble size distribution than other samples. However, it also shows the highest percentage of big bubbles (0.55–0.85), which then rapidly collapse and lead to the largest percentage of destroyed foam. It could be related to the higher sulfonation and excessive aggregation produced by SF6VCP, which is not suitable for stable foam [23].

4. Conclusions and Future Perspectives

Due to the high attractiveness of non-thermal processing technologies, cold plasma treatments of proteins have been extensively reviewed and investigated from a chemical and microbial point of view. Since interfacial properties of adsorbed protein are of great importance in many technological areas, this study was dedicated to investigations of protein adsorption layers and their role in foam formation and stabilization by WPI. It is shown that the treatment by low-pressure cold plasma (VCP) leads to a modification depending on the gases used. In particular, significant differences are observed in the surface dilational visco-elasticity, leading to a reduced foam drainage and consequently higher foam stability.
The findings allow predictions for how VCP treatments can be used in various food applications. Since proteins have complex structures, different degrees of alteration result in different changes in their properties, and future trends regarding the modification of the interfacial properties by VCP treatments of proteins may be predicted. Therefore, further research on the controllable alterations of proteins by cold plasma treatments at a low pressure should let us expect further advancements in all fields where modifications of the protein structure are relevant.

Author Contributions

Conceptualization, E.O.M., M.A.H., M.D. and S.Y.; methodology, E.O.M., R.v.K. and E.S.; investigation, E.O.M.; resources, S.Y., R.v.K. and E.S.; data curation, E.O.M. and R.M.; writing—original draft preparation, E.O.M., S.Y. and R.M.; writing—review and editing, E.O.M., S.Y., M.A.H., M.D., R.v.K., R.M. and E.S. All authors have read and agreed to the published version of the manuscript.

Funding

This research received no external funding.

Data Availability Statement

The original contributions presented in the study are included in the article, inquiries can be directed to the corresponding author.

Conflicts of Interest

The authors declare no conflict of interest.

References

  1. Murray, B.S. Stabilization of bubbles and foams. Curr. Opin. Colloid Interface Sci. 2007, 12, 232–241. [Google Scholar] [CrossRef]
  2. Murray, B.S.; Ettelaie, R. Foam stability: Proteins and nanoparticles. Curr. Opin. Colloid Interface Sci. 2004, 9, 314–320. [Google Scholar] [CrossRef]
  3. Groß, M.; Lima, M.T.; Uhlig, M.; Ebraheme, A.; Roeber, O.; Olschewski, B.; von Klitzing, R.; Schomäcker, R.; Schwarze, M. Biopolymers for dye removal via foam separation. Sep. Purif. Technol. 2017, 188, 451–457. [Google Scholar] [CrossRef]
  4. Goff, H.D.; Vega, C. Structure-engineering of ice-cream and foam-based foods. In Understanding and Controlling the Microstructure of Complex Foods; Woodhead Publishing Ltd.: Cambridge, UK, 2007; pp. 557–574. [Google Scholar]
  5. Oh, I.K.; Lee, S. Utilization of foam structured hydroxypropyl methylcellulose for oleogels and their application as a solid fat replacer in muffins. Food Hydrocoll. 2018, 77, 796–802. [Google Scholar] [CrossRef]
  6. Stites, W.E. Protein−protein interactions: Interface structure, binding thermodynamics, and mutational analysis. Chem. Rev. 1997, 97, 1233–1250. [Google Scholar] [CrossRef] [PubMed]
  7. Gräff, K.; Stock, S.; Mirau, L.; Bürger, S.; Braun, L.; Völp, A.; Willenbacher, N.; von Klitzing, R. Untangling effects of proteins as stabilizers for foam films. Front. Soft Matter 2022, 2, 1035377. [Google Scholar] [CrossRef]
  8. Liang, G.; Chen, W.; Qie, X.; Zeng, M.; Qin, F.; He, Z.; Chen, J. Modification of soy protein isolates using combined pre-heat treatment and controlled enzymatic hydrolysis for improving foaming properties. Food Hydrocoll. 2020, 105, 105764. [Google Scholar] [CrossRef]
  9. Gharbi, N.; Labbafi, M. Influence of treatment-induced modification of egg white proteins on foaming properties. Food Hydrocoll. 2019, 90, 72–81. [Google Scholar] [CrossRef]
  10. Rullier, B.; Novales, B.; Axelos, M.A.V. Effect of protein aggregates on foaming properties of β-lactoglobulin. Colloids Surf. A Physicochem. Eng. Asp. 2008, 330, 96–102. [Google Scholar] [CrossRef]
  11. Fameau, A.L.; Salonen, A. Effect of particles and aggregated structures on the foam stability and aging. Comptes Rendus Phys. 2014, 15, 748–760. [Google Scholar] [CrossRef]
  12. Davis, J.P.; Foegeding, E.A. Comparisons of the foaming and interfacial properties of whey protein isolate and egg white proteins. Colloids Surf. B Biointerfaces 2007, 54, 200–210. [Google Scholar] [CrossRef] [PubMed]
  13. Cicco, F.D.; Oosterlinck, F.; Tromp, H.; Sein, A. Comparative study of whey protein isolate gel and polydimethylsiloxane as tribological surfaces to differentiate friction properties of commercial yogurts. Food Hydrocoll. 2019, 97, 105204. [Google Scholar] [CrossRef]
  14. Wijaya, W.; Harfieyanto, R.C.; Dewettinck, K.; Patel, A.R.; Van der Meeren, P. Whey protein isolate–low methoxyl pectin nanocomplexes improve physicochemical and stability properties of quercetin in a model fat-free beverage. Food Funct. 2019, 10, 986–996. [Google Scholar] [CrossRef] [PubMed]
  15. Leman, J.; Dolgan, T. Effects of heating and pressurization on foaming properties of beta-lactoglobulin. Electron. J. Pol. Agric. Univ. Ser. Food Sci. Technol. 2004, 2, 7. [Google Scholar]
  16. Nicorescu, I.; Loisel, C.; Riaublanc, A.; Vial, C.; Djelveh, G.; Cuvelier, G.; Legrand, J. Effect of dynamic heat treatment on the physical properties of whey protein foams. Food Hydrocoll. 2009, 23, 1209–1219. [Google Scholar] [CrossRef]
  17. Nicorescu, I.; Vial, C.; Talansier, E.; Lechevalier, V.; Loisel, C.; Della Valle, D.; Riaublanc, A.; Djelveh, G.; Legrand, J. Comparative effect of thermal treatment on the physicochemical properties of whey and egg white protein foams. Food Hydrocoll. 2011, 25, 797–808. [Google Scholar]
  18. Moro, A.; Báez, G.D.; Busti, P.A.; Ballerini, G.A.; Delorenzi, N.J. Effects of heat-treated β-lactoglobulin and its aggregates on foaming properties. Food Hydrocoll. 2011, 25, 1009–1015. [Google Scholar] [CrossRef]
  19. Arvanitoyannis, I.S.; Kotsanopoulos, K.V.; Savva, A.G. Use of ultrasounds in the food industry–Methods and effects on quality, safety, and organoleptic characteristics of foods: A review. Crit. Rev. Food Sci. Nutr. 2017, 57, 109–128. [Google Scholar] [CrossRef]
  20. Barba, F.J.; Parniakov, O.; Pereira, S.A.; Wiktor, A.; Grimi, N.; Boussetta, N.; Saraiva, J.A.; Raso, J.; Martin-Belloso, O.; Witrowa-Rajchert, D.; et al. Current applications and new opportunities for the use of pulsed electric fields in food science and industry. Food Res. Int. 2015, 77, 773–798. [Google Scholar] [CrossRef]
  21. Li, X.; Farid, M. A review on recent development in non-conventional food sterilization technologies. J. Food Eng. 2016, 182, 33–45. [Google Scholar] [CrossRef]
  22. Bourke, P.; Ziuzina, D.; Boehm, D.; Cullen, P.J.; Keener, K. The potential of cold plasma for safe and sustainable food production. Trends Biotechnol. 2018, 36, 615–626. [Google Scholar] [CrossRef]
  23. Jiang, Y.-H.; Cheng, J.-H.; Sun, D.-W. Effects of plasma chemistry on the interfacial performance of protein and polysaccharide in emulsion. Trends Food Sci. Technol. 2020, 98, 129–139. [Google Scholar] [CrossRef]
  24. Takamatsu, T.; Uehara, K.; Sasaki, Y.; Miyahara, H.; Matsumura, Y.; Iwasawa, A.; Ito, N.; Azuma, T.; Kohno, M.; Okino, A. Investigation of reactive species using various gas plasmas. RSC Adv. 2014, 4, 39901–39905. [Google Scholar] [CrossRef]
  25. Zhang, S.; Huang, W.; Feizollahi, E.; Roopesh, M.S.; Chen, L. Improvement of pea protein gelation at reduced temperature by atmospheric cold plasma and the gelling mechanism study. Innov. Food Sci. Emerg. Technol. 2021, 67, 102567. [Google Scholar] [CrossRef]
  26. Mehr, H.M.; Koocheki, A. Effect of atmospheric cold plasma on structure, interfacial and emulsifying properties of Grass pea (Lathyrus sativus L.) protein isolate. Food Hydrocoll. 2020, 106, 105899. [Google Scholar] [CrossRef]
  27. Ng, S.W.; Lu, P.; Rulikowska, A.; Boehm, D.; O’Neill, G.; Bourke, P. The effect of atmospheric cold plasma treatment on the antigenic properties of bovine milk casein and whey proteins. Food Chem. 2021, 342, 128283. [Google Scholar] [CrossRef] [PubMed]
  28. Nikmaram, N.; Keener, K.M. The effects of cold plasma technology on physical, nutritional, and sensory properties of milk and milk products. LWT 2022, 154, 112729. [Google Scholar] [CrossRef]
  29. Chang, R.; Lu, H.; Tian, Y.; Li, H.; Wang, J.; Jin, Z. Structural modification and functional improvement of starch nanoparticles using vacuum cold plasma. Int. J. Biol. Macromol. 2020, 145, 197–206. [Google Scholar] [CrossRef]
  30. Thirumdas, R.; Saragapani, C.; Ajinkya, M.T.; Deshmukh, R.R.; Annapure, U.S. Influence of low pressure cold plasma on cooking and textural properties of brown rice. Innov. Food Sci. Emerg. Technol. 2016, 37, 53–60. [Google Scholar] [CrossRef]
  31. Ulbin-Figlewicz, N.; Brychcy, E.; Jarmoluk, A. Effect of low-pressure cold plasma on surface microflora of meat and quality attributes. J. Food Sci. Technol. 2015, 52, 1228–1232. [Google Scholar] [CrossRef]
  32. Mandolfino, C.; Lertora, E.; Gambaro, C.; Bruno, M. Improving adhesion performance of polyethylene surfaces by cold plasma treatment. Meccanica 2014, 49, 2299–2306. [Google Scholar] [CrossRef]
  33. Darvish, H.; Ramezan, Y.; Khani, M.R.; Kamkari, A. Effect of low-pressure cold plasma processing on decontamination and quality attributes of Saffron (Crocus sativus L.). Food Sci. Nutr. 2022, 10, 2082–2090. [Google Scholar] [CrossRef] [PubMed]
  34. Misra, N.N.; Martynenko, A.; Chemat, F.; Paniwnyk, L.; Barba, F.J.; Jambrak, A.R. Thermodynamics, transport phenomena, and electrochemistry of external field-assisted nonthermal food technologies. Crit. Rev. Food Sci. Nutr. 2018, 58, 1832–1863. [Google Scholar] [CrossRef] [PubMed]
  35. Laroque, D.A.; Seó, S.T.; Valencia, G.A.; Laurindo, J.B.; Carciofi, B.A.M. Cold plasma in food processing: Design, mechanisms, and application. J. Food Eng. 2022, 312, 110748. [Google Scholar] [CrossRef]
  36. Sharifian, A.; Soltanizadeh, N.; Abbaszadeh, R. Effects of dielectric barrier discharge plasma on the physicochemical and functional properties of myofibrillar proteins. Innov. Food Sci. Emerg. Technol. 2019, 54, 1–8. [Google Scholar] [CrossRef]
  37. Ekezie, F.-G.C.; Cheng, J.-H.; Sun, D.-W. Effects of mild oxidative and structural modifications induced by argon plasma on physicochemical properties of actomyosin from king prawn (Litopenaeus vannamei). J. Agric. Food Chem. 2018, 66, 13285–13294. [Google Scholar] [CrossRef] [PubMed]
  38. Esteghlal, S.; Gahruie, H.H.; Niakousari, M.; Barba, F.J.; Bekhit, A.E.D.; Mallikarjunan, K.; Roohinejad, S. Bridging the knowledge gap for the impact of non-thermal processing on proteins and amino acids. Foods 2019, 8, 262. [Google Scholar] [CrossRef]
  39. Ji, H.; Dong, S.; Han, F.; Li, Y.; Chen, G.; Li, L.; Chen, Y. Effects of dielectric barrier discharge (DBD) cold plasma treatment on physicochemical and functional properties of peanut protein. Food Bioprocess Technol. 2018, 11, 344–354. [Google Scholar] [CrossRef]
  40. Thirumdas, R.; Sarangapani, C.; Annapure, U.S. Cold plasma: A novel non-thermal technology for food processing. Food Biophys. 2015, 10, 1–11. [Google Scholar] [CrossRef]
  41. Segat, A.; Misra, N.N.; Cullen, P.J.; Innocente, N. Atmospheric pressure cold plasma (ACP) treatment of whey protein isolate model solution. Innov. Food Sci. Emerg. Technol. 2015, 29, 247–254. [Google Scholar] [CrossRef]
  42. Gong, W.; Guo, X.; Huang, H.; Xu, X.; Li, Y.; Hu, J.-N. Structural characterization of modified whey protein isolates using cold plasma treatment and its applications in emulsion oleogels. Food Chem. 2021, 356, 129703. [Google Scholar] [CrossRef]
  43. Honarvar, Z.; Farhoodi, M.; Khani, M.R.; Mohammadi, A.; Shokri, B.; Ferdowsi, R.; Shojaee-Aliabadi, S. Application of cold plasma to develop carboxymethyl cellulose-coated polypropylene films containing essential oil. Carbohydr. Polym. 2017, 176, 1–10. [Google Scholar] [CrossRef]
  44. Chen, G.; Ali, F.; Dong, S.; Yin, Z.; Li, S.; Chen, Y. Preparation, characterization and functional evaluation of chitosan-based films with zein coatings produced by cold plasma. Carbohydr. Polym. 2018, 202, 39–46. [Google Scholar] [CrossRef] [PubMed]
  45. Bormashenko, E.; Whyman, G.; Multanen, V.; Shulzinger, E.; Chaniel, G. Physical mechanisms of interaction of cold plasma with polymer surfaces. J. Colloid Interface Sci. 2015, 448, 175–179. [Google Scholar] [CrossRef] [PubMed]
  46. Han, Y.; Manolache, S.O.; Denes, F.; Rowell, R.M. Fluorocarbon barriers on starch foam tray surfaces through SF6 cold plasma treatment. Compos. Interfaces 2009, 16, 813–824. [Google Scholar] [CrossRef]
  47. Mohammadi, E.O.; Yeganehzad, S.; Hesarinejad, M.A.; Dabestani, M.; Schneck, E.; Miller, R. Effects of Various Types of Vacuum Cold Plasma Treatment on the Chemical and Functional Properties of Whey Protein Isolate with a Focus on Interfacial Properties. Colloids Interfaces 2023, 7, 54. [Google Scholar] [CrossRef]
  48. Durham, R.J.; Hourigan, J.A. Waste management and co-product recovery in dairy processing. In Handbook of Waste Management and Co-Product Recovery in Food Processing; Woodhead Publishing: Sawston, UK, 2007; Volume 1, pp. 332–387. [Google Scholar] [CrossRef]
  49. Koppel, D.E. Analysis of macromolecular polydispersity in intensity correlation spectroscopy: The method of cumulants. J. Chem. Phys. 1972, 57, 4814–4820. [Google Scholar] [CrossRef]
  50. Hunter, R.J. Zeta Potential in Colloid Science: Principles and Applications; Academic Press: Cambridge, MA, USA, 2013; Volume 2. [Google Scholar]
  51. Loglio, G.; Pandolfini, P.; Ravera, F.; Pugh, R.; Makievski, A.V.; Javadi, A.; Miller, R. Experimental observation of drop-drop coalescence in liquid-liquid systems: Instrument design and features. In Bubble Drop Interfaces, Progress in Colloid and Interface Science; Miller, R., Liggieri, L., Eds.; CRC Press: Boca Raton, FL, USA, 2011; Volume 2. [Google Scholar]
  52. Miller, R.; Fainerman, V.; Makievski, A.; Krägel, J.; Grigoriev, D.; Kazakov, V.; Sinyachenko, O. Dynamics of protein and mixed protein/surfactant adsorption layers at the water/fluid interface. Adv. Colloid Interface Sci. 2000, 86, 39–82. [Google Scholar] [CrossRef] [PubMed]
  53. Ward, A.F.H.; Tordai, L. Time-dependence of boundary tensions of solutions I. The role of diffusion in time-effects. J. Chem. Phys. 1946, 14, 453–461. [Google Scholar] [CrossRef]
  54. Miller, R.; Fainerman, V.B.; Aksenenko, E.V.; Leser, M.E.; Michel, M. Dynamic surface tension and adsorption kinetics of β-casein at the solution/air interface. Langmuir 2004, 20, 771–777. [Google Scholar] [CrossRef]
  55. Perez, A.A.; Carrara, C.R.; Sánchez, C.C.; Santiago, L.G.; Patino, J.M.R. Interfacial dynamic properties of whey protein concentrate/polysaccharide mixtures at neutral pH. Food Hydrocoll. 2009, 23, 1253–1262. [Google Scholar] [CrossRef]
  56. Gochev, G.G.; Scoppola, E.; Campbell, R.A.; Noskov, B.A.; Miller, R.; Schneck, E. β-Lactoglobulin adsorption layers at the water/air surface: 3. Neutron reflectometry study on the effect of pH. J. Phys. Chem. B 2019, 123, 10877–10889. [Google Scholar] [CrossRef]
  57. Pusterla, J.M.; Scoppola, E.; Appel, C.; Mukhina, T.; Shen, C.; Brezesinski, G.; Schneck, E. Characterization of lipid bilayers adsorbed to functionalized air/water interfaces. Nanoscale 2022, 14, 15048–15059. [Google Scholar] [CrossRef]
  58. Waniska, R.D.; Kinsella, J.E. Foaming properties of proteins: Evaluation of a column aeration apparatus using ovalbumin. J. Food Sci. 1979, 44, 1398–1402. [Google Scholar] [CrossRef]
  59. Kamal, M.S. A novel approach to stabilize foam using fluorinated surfactants. Energies 2019, 12, 1163. [Google Scholar] [CrossRef]
  60. Fainerman, V.; Lucassen-Reynders, E.H.; Miller, R. Description of the adsorption behaviour of proteins at water/fluid interfaces in the framework of a two-dimensional solution model. Adv. Colloid Interface Sci. 2003, 106, 237–259. [Google Scholar] [CrossRef]
  61. Perez, A.A.; Sánchez, C.C.; Patino, J.M.R.; Rubiolo, A.C.; Santiago, L.G. Surface adsorption behaviour of milk whey protein and pectin mixtures under conditions of air–water interface saturation. Colloids Surf. B Biointerfaces 2011, 85, 306–315. [Google Scholar] [CrossRef]
  62. Kovalchuk, V.I.; Aksenenko, E.V.; Trukhin, D.V.; Makievski, A.V.; Fainerman, V.B.; Miller, R. Effect of amplitude on the surface dilational visco-elasticity of protein solutions. Colloids Interfaces 2018, 2, 57. [Google Scholar] [CrossRef]
  63. Benjamins, J.; Lyklema, J.; Lucassen-Reynders, E.H. Compression/expansion rheology of oil/water interfaces with adsorbed proteins. Comparison with the air/water surface. Langmuir 2006, 22, 6181–6188. [Google Scholar] [CrossRef]
  64. Fainerman, V.B.; Kovalchuk, V.I.; Aksenenko, E.V.; Zinkovych, I.I.; Makievski, A.V.; Nikolenko, M.V.; Miller, R. Dilational viscoelasticity of proteins solutions in dynamic conditions. Langmuir 2018, 34, 6678–6686. [Google Scholar] [CrossRef]
  65. Ulaganathan, V.; Retzlaff, I.; Won, J.; Gochev, G.; Gehin-Delval, C.; Leser, M.; Noskov, B.; Miller, R. β-Lactoglobulin adsorption layers at the water/air surface: 1. Adsorption kinetics and surface pressure isotherm: Effect of pH and ionic strength. Colloids Surf. A Physicochem. Eng. Asp. 2017, 519, 153–160. [Google Scholar] [CrossRef]
  66. Patino, J.M.R.; Sanchez, C.C.; Niño, M.R.R. Implications of interfacial characteristics of food foaming agents in foam formulations. Adv. Colloid Interface Sci. 2008, 140, 95–113. [Google Scholar] [CrossRef]
  67. Ganzevles, R.A.; Stuart, M.A.C.; van Vliet, T.; de Jongh, H.H.J. Use of polysaccharides to control protein adsorption to the air–water interface. Food Hydrocoll. 2006, 20, 872–878. [Google Scholar] [CrossRef]
  68. Nicorescu, I.; Riaublanc, A.; Loisel, C.; Vial, C.; Djelveh, G.; Cuvelier, G.; Legrand, J. Impact of protein self-assemblages on foam properties. Food Res. Int. 2009, 42, 1434–1445. [Google Scholar] [CrossRef]
  69. Segat, A.; Misra, N.; Fabbro, A.; Buchini, F.; Lippe, G.; Cullen, P.J.; Innocente, N. Effects of ozone processing on chemical, structural and functional properties of whey protein isolate. Food Res. Int. 2014, 66, 365–372. [Google Scholar] [CrossRef]
  70. Murray, B.S.; Durga, K.; Yusoff, A.; Stoyanov, S.D. Stabilization of foams and emulsions by mixtures of surface active food-grade particles and proteins. Food Hydrocoll. 2011, 25, 627–638. [Google Scholar] [CrossRef]
  71. Uzun, H.; Ibanoglu, E.; Catal, H.; Ibanoglu, S. Effects of ozone on functional properties of proteins. Food Chem. 2012, 134, 647–654. [Google Scholar] [CrossRef]
  72. Dickinson, E. Adsorbed protein layers at fluid interfaces: Interactions, structure and surface rheology. Colloids Surf. B Biointerfaces 1999, 15, 161–176. [Google Scholar] [CrossRef]
  73. Foegeding, E.A.; Davis, J.P. Food protein functionality: A comprehensive approach. Food Hydrocoll. 2011, 25, 1853–1864. [Google Scholar] [CrossRef]
  74. Rouimi, S.S.; Schorsch, C.; Valentini, C.; Vaslin, S. Foam stability and interfacial properties of milk protein–surfactant systems. Food Hydrocoll. 2005, 19, 467–478. [Google Scholar] [CrossRef]
  75. Damodaran, S. Protein stabilization of emulsions and foams. J. Food Sci. 2005, 70, R54–R66. [Google Scholar] [CrossRef]
Figure 1. Non-treated WPI in phosphate buffer solution (0.01 M at pH 7.2). (A): surface pressure isotherm Π(CWPI); (B): surface dilational elasticity Er(CWPI) at 0.2 Hz (●) and 0.005 Hz (○) (the reproducibility of the results was better than 0.5% and 3.0% for surface pressure and surface dilatational properties, respectively).
Colloids 08 00025 g001
Figure 2. Time dependence of the dynamic surface pressure for 0.01 mg/mL WPI solutions at the air/water interface: (A) at the initial adsorption time, (B) as a function of time until reaching the equilibrium; the solid straight line in (A) is the best fit to the curve with respect to a linear regression.
Colloids 08 00025 g002
Figure 3. WPI solutions at a concentration of 0.01 mg/mL. (A): Er () and Ev () as a function of relative area oscillation amplitude (ΔA/A) and at a fixed frequency of 0.04 Hz; (B): frequency dependence of the dilational elastic modulus at equilibrium condition at a fixed relative amplitude of 7%.
Colloids 08 00025 g003
Figure 4. Changes in surface pressure as a function of sinusoidal volume changes (15 ± 1 mm3) (green constant amplitude) during oscillations for 0.01 mg/mL WPI solutions after different VCP treatments: (A) N, (B) AVCP, (C) ARAVCP, and (D) SF6VCP.
Colloids 08 00025 g004
Figure 5. WPI solutions at a concentration of 0.1 mg/mL. (A): dynamic surface dilational elastic modulus Er at a fixed frequency of 0.16 Hz and an area oscillation amplitude of 7%; (B): evolution of Er before and after centrifugation at 10,000× g over 30 min, measured at a frequency of 0.16 Hz and amplitude of 7% for SF6VCP-treated WPI.
Colloids 08 00025 g005
Figure 6. Time evolution of the foam stability (A) (standard deviations less than 0.1 are not shown) and liquid drainage amount (B) of 20 mg/mL WPI solutions (standard deviation values are ±0.5%) after bubble sparging during 1 min.
Colloids 08 00025 g006aColloids 08 00025 g006b
Figure 7. Optical microscopy images of foams generated from WPI solutions at a concentration of 20 mg/mL: (A) during 5, 10, and 15 min, (B) at 15 min after termination of bubbling, with each class of bubble diameter highlighted with a different color, and (C) histograms obtained from optical images show the bubble diameter distribution analyzed by image J software (1.53k; java 1.8.0_172 (64-bit)); values are compared statistically in each class and those with the same superscript on the column are not significantly different from each other (p > 0.05).
Colloids 08 00025 g007
Table 1. Zeta potential, size of aggregates, equilibrium surface pressure Πeq, slope of dynamic surface pressure dΠ/( d t ) , induction time tind, and adsorption layer thickness measured at a WPI concentration of 0.01 mg/mL. All values represent the mean of three replicate experiments. Values marked by the same letter (a, b, c) are not significantly different from each other (p > 0.05).
Zeta Potential (mV)* Aggregate Size (nm)Πeq (mN/m)
d Π / ( d t )
mN.m−1.s−1/2
tind (s)Thickness (nm)
N−27.0 ± 1.6 a55614.6 ± 0.3 a0.2 ± 0.1 a26 ± 0.3 a1.5 ± 0.1 a
AVCP−27.5 ± 0.9 a37915.3 ± 0.4 a0.3 ± 0.2 a30 ± 0.4 a1.3 ± 0.3 a
ARAVCP−26.6 ± 2.0 a54414.5 ± 0.2 a0.3 ± 0.1 a24 ± 0.1 a1.5 ± 0.2 a
SF6VCP−25.6 ± 1.4 a103617.0 ± 0.4 a0.4 ± 0.1 b44 ± 0.1 c1.6 ± 0.1 a
* Analysis without quality criteria due to high polydispersity.
Disclaimer/Publisher’s Note: The statements, opinions and data contained in all publications are solely those of the individual author(s) and contributor(s) and not of MDPI and/or the editor(s). MDPI and/or the editor(s) disclaim responsibility for any injury to people or property resulting from any ideas, methods, instructions or products referred to in the content.

