Article

Caffeine Adsorption on a Thermally Modified Bentonite: Adsorbent Characterization, Experimental Design, Equilibrium and Kinetics

by
Javier A. Quintero-Jaramillo
,
Javier Ignacio Carrero
and
Nancy R. Sanabria-González
*
Departamento de Ingeniería Química, Universidad Nacional de Colombia Sede Manizales, Campus La Nubia, km 9 vía al Aeropuerto, Manizales 170003, Colombia
*
Author to whom correspondence should be addressed.
Colloids Interfaces 2024, 8(2), 26; https://doi.org/10.3390/colloids8020026
Submission received: 30 November 2023 / Revised: 9 March 2024 / Accepted: 14 April 2024 / Published: 15 April 2024

Abstract

:
Caffeine is a chemical compound found in various products such as coffee, tea, and energy drinks; therefore, it is common in wastewater and surface water. The present study investigated caffeine adsorption on a thermally modified bentonite-type clay. The effects of the heat treatment of the adsorbent over the temperature range of 60–500 °C, as well as the initial pH of the solution, stirring speed, and contact time, on the removal of caffeine were analyzed. The adsorbent was characterized by XRF, XRD, FT–IR, thermal analysis (TGA–DSC), and N2 physisorption at 77 K. The response surface methodology (RSM) based on a central composite design (CCD) was used to evaluate and optimize the adsorption of caffeine in aqueous solution. The maximum adsorption capacity of caffeine obtained with the Langmuir model was 80.3 ± 2.1 mg/g (0.41 ± 0.01 mmol/g) at 25 °C under equilibrium conditions (initial pH = 8.0, stirring speed = 400 rpm, contact time = 120 min). A kinetic study showed that the pseudo-second-order and Elovich models adequately describe the adsorption process. Bentonite thermally modified at 400 °C can be considered a low-cost adsorbent with potential application for removing caffeine in aqueous media.

Graphical Abstract

1. Introduction

Caffeine is a chemical compound present in domestic wastewater due to the release of liquid residues from coffee, tea, drinks, and even unused drugs into sewers, along with urine, which contains 1–2% of the ingested caffeine dose [1,2,3]. Caffeine is considered a lifestyle compound, given its extensive use and an indicator of anthropogenic pollution [4].
The increasing concern about caffeine contamination in water bodies has increased the interest in treatments for its removal from water, including biodegradation, ozonation, photo-Fenton processes, and electrochemical oxidation [5,6,7]. However, these technologies do not achieve complete degradation, are expensive, and require high power consumption [8]. In contrast, adsorption is widely used to remove contaminants from water, especially those not biodegradable, such as heavy metals and organic pollutants, including caffeine [9,10]. Different adsorbent materials have been used to remove caffeine, including activated carbon, agricultural biomass waste, polymeric resins, soil and sediments, composites, and clay minerals [11].
Smectite is one of the main groups within the category of clay minerals. Smectite minerals include montmorillonite, beidellite, nontronite, and saponite [12,13]. Montmorillonite is used in a wide range of applications, including as an adsorbent in water purification, a binder in foundry sands, a component in drilling muds, and as a catalyst support in some chemical processes [14]. Montmorillonites are considered low-cost adsorbent materials and have proven to be efficient for the removal of contaminants present in water [15,16]. Bentonite is a term often used to describe clay minerals that are rich in montmorillonite, a mineral with a high specific surface area, swelling capacity, and affinity for water [17,18]. As a result of the excellent adsorbent properties of montmorillonite, it has been used as a pharmaceutical excipient in drug delivery systems [17]. Different modifications of bentonite with aluminum and iron polymeric precursors intercalated in the interlayer space [17], acid treatments [18], and pillaring with aluminum oxide and Al-lanthanum/cerium mixed oxides [19] have been implemented for the adsorption of As(V), the anionic dye methyl orange, and 239Pu, respectively, demonstrating the applicability of these materials for contaminant removal.
Bentonite heat treatment can affect swelling, cation exchange capacity, pore structure, surface acidity, and adsorption capacity [20,21]. Studies on the adsorption of caffeine on montmorillonite have established that caffeine can adsorb in the interlayer space and on the surface of the clay [20,22]. The heating temperature used in the thermal treatment of clays must be evaluated for the particular case of clay since, depending on the clay structure, such treatment can lead to changes that benefit the adsorption processes for a specific solute [21,23,24]. For example, Yamamoto et al. (2016) studied the adsorption of caffeine on heat-treated montmorillonite between 100 and 600 °C, finding that the maximum adsorption occurs with the material treated at 200 and 300 °C (0.51 mmol/g), while montmorillonite calcined at 600 °C removed approximately 20% of caffeine compared to montmorillonite treated at 100 °C [21]. For the analysis and modeling of adsorption processes with applications in water and wastewater treatment, response surface methodology (RSM) has been successfully used [25,26]. The statistical design of experiments and the RSM are helpful tools to analyze the effects of different factors or variables and their interactions on a process response within a given range and with a minimum number of tests [27].
Although the adsorption of caffeine on calcined montmorillonite has been studied under fixed conditions of adsorbent mass and solution volume (adding 10 g/L of adsorbent) [21], no research is available on the adsorption process of this pollutant on thermally modified bentonite, where experimental design, equilibrium, and kinetics are analyzed simultaneously. Knowledge of the optimal adsorption conditions, combined with the study of equilibrium and kinetics, helps to understand the interaction mechanisms between organic compounds such as caffeine and clay minerals (thermally modified) and provides information to design adsorption systems in water treatment.
In this research, the adsorption of caffeine in aqueous solution using a heat-treated bentonite between 60 and 500 °C was studied. Changes in the structure and texture of thermally modified bentonite were analyzed using various characterization techniques such as XRF, XRD, FT–IR, thermal analysis (TGA–DSC), and N2 physisorption at 77 K. First, the effect of the bentonite’s heat treatment temperature on caffeine’s adsorption capacity was analyzed under specific contact time, pH, and stirring speed conditions. Then, the optimal adsorption conditions were established using a central composite design (CCD) and RSM. Finally, studies of the adsorption isotherm, reuse of the adsorbent material, adsorption kinetics, and a possible mechanism of caffeine adsorption on thermally modified bentonite were performed. Understanding how thermal modification affects the adsorption properties of bentonite can lead to an understanding of the influence of temperature on the surface chemistry and adsorption capacity of this material.

2. Materials and Methods

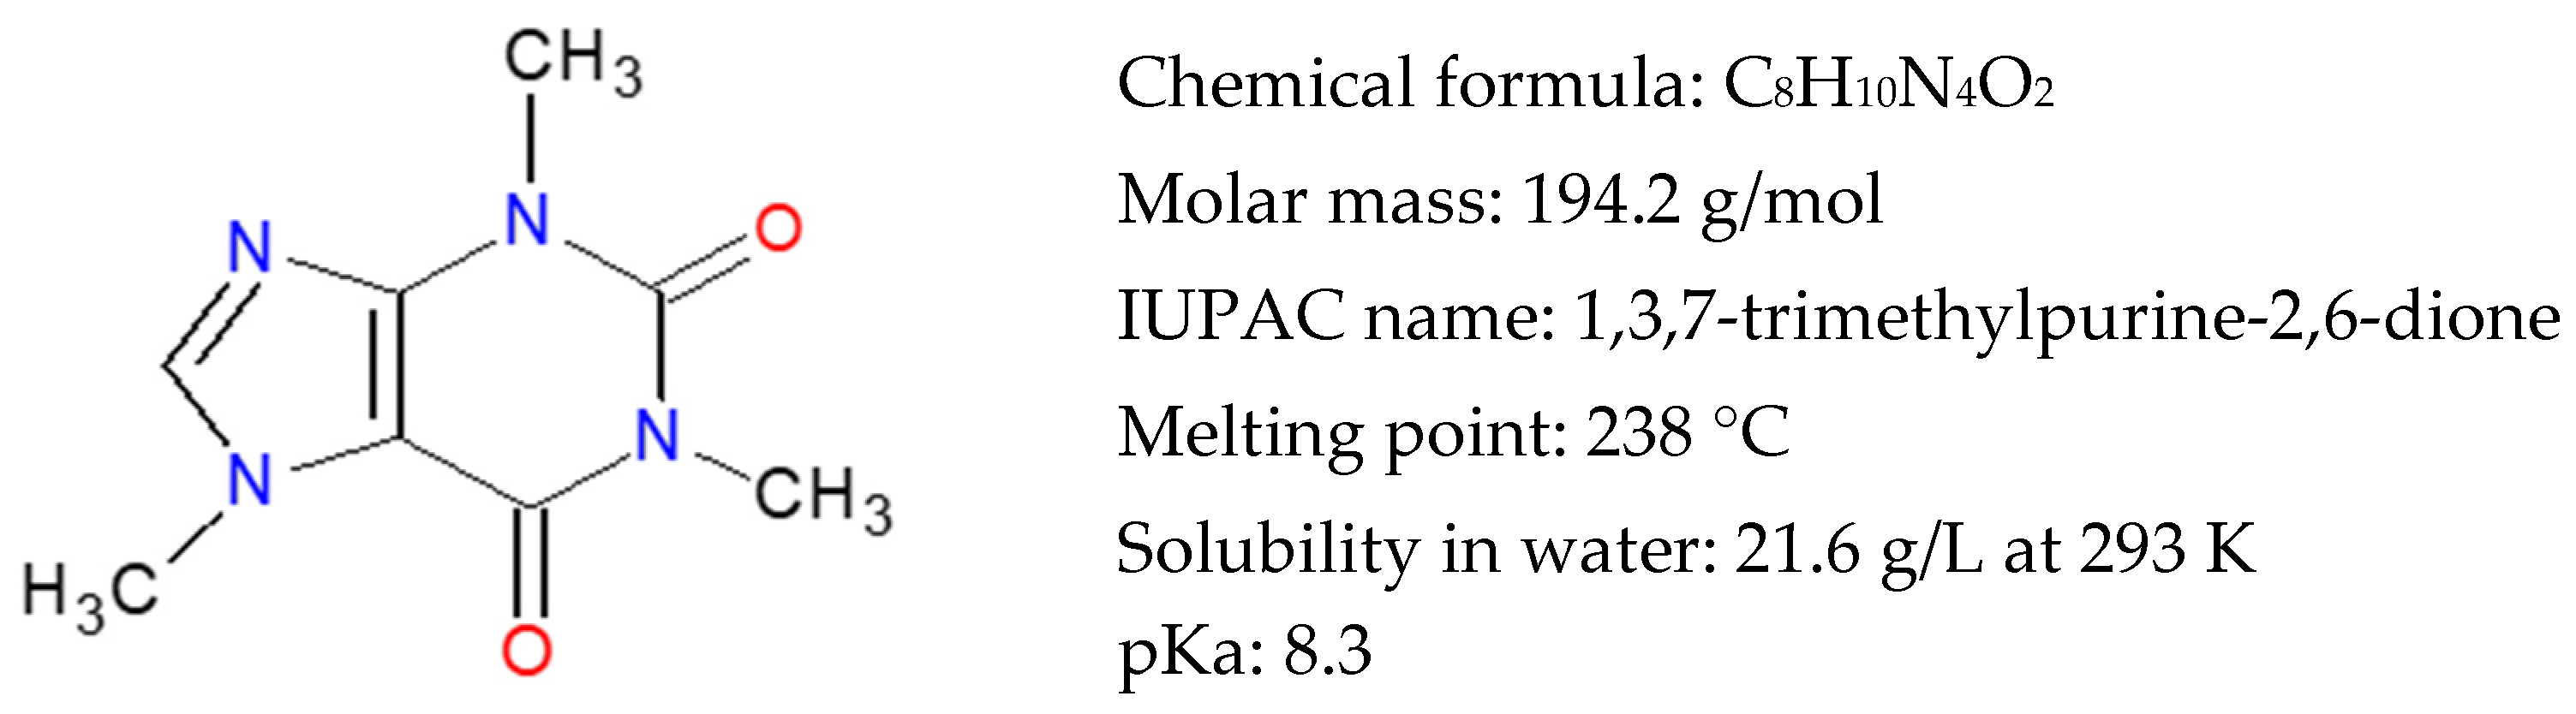
2.1. Materials and Reagents

The raw clay for the adsorbent preparation was collected in an Armero-Guayabal (Colombia) mine, which Gea Minerales SAS exploited. The mineralogical and chemical composition of this bentonite has been reported previously [28].
The adsorbate used in this study was caffeine anhydrous (99%, LobaChemie Pvt. Ltd., Mumbai, India), whose structure and some properties are shown in Figure 1. NaOH and HCl were supplied by Merck KGaA (Darmstadt, Germany). The caffeine stock solution was prepared by accurately dissolving a weighed amount of this compound in distilled/deionized water.

2.2. Clay Modification and Characterization

The raw clay was dried at 60 °C for 36 h, ground in a mill, and passed through a 100-mesh sieve (149 μm). Purified clay was obtained by gravitational sedimentation, dispersing raw clay in deionized water (5 g/L) and collecting the supernatant dispersion of particles with a size of ≤50 μm. Although conventionally, the separation of the clay fraction is performed for particles with a size of ≤2 μm; in a study on the effect of aggregate size in Colombian bentonites, it was found that the size distribution measured by laser diffraction is similar for particle fractions with a size of ≤2 and 50 μm, finding particle sizes between 0.6 and 1.9 μm [31]. The clay fraction was subject to ionic exchange three times with 1.0 M NaCl solution, washed with distilled water to remove chloride ions (negative test with AgNO3), dried at 60 °C, and ground and passed through a 100-mesh sieve (149 μm). This material was designated Na–Bent–60 and was characterized by X-ray fluorescence (XRF), X-ray diffraction (XRD), thermal analysis (TGA–DSC), N2 adsorption–desorption, and point of zero charge (pHPZC).
The Na–Bent–60 material was thermally modified at 200, 300, 400, and 500 °C temperatures, with a heating ramp of 1 °C/min and 2 h at the set temperature. The adsorbents obtained were named Na–Bent–200, Na–Bent–300, Na–Bent–400, and Na–Bent–500, respectively. The adsorbents were characterized by XRD, FT–IR, N2 adsorption–desorption, and point of zero charge (pHPZC).
XRF analysis was performed with a Philips Magix Pro PW2440. XRD patterns were acquired on a LabX Shimadzu XRD-6000 diffractometer with Cu Kα radiation (λ = 1.5406 Å), step 0.02°, and step time 1 s. The textural characterization of the materials was carried out by a N2 adsorption–desorption isotherm at 77 K (Micromeritics 3 Flex Sorptometer, Micromeritics Instrument Corp., Norcross, GA, USA) on samples previously degassed. Specific surface area (SBET) was determined using the multipoint Brunauer–Emmett–Teller model [32,33]. The external surface areas (SExt), micropore volumes (Vμp), and micropore surface area (Sμp) were calculated from the t-plot model [34]. Total pore volume (V0.99) was estimated for nitrogen uptake at a relative pressure of 0.99, along with the Gurvitch method [35]. The simultaneous thermal analyses (TGA/DSC) of the sodium bentonite (Na–Bent–60) were recorded in an SDT Q600 TA Instruments equipment, and the measurements were made at a heating rate of 10 °C/min under a flow of 20 cm3/min of nitrogen gas from room temperature to 1000 °C. The addition solid method was used to determine the pHPZC of samples [36,37].

2.3. Experimental Conditions for Adsorption

Batch adsorption experiments were conducted at ambient conditions (25 °C and atmospheric pressure of 77 kPa). For this purpose, 50 mL of caffeine solution of known concentration (20 mg/L) was placed into 100 mL Erlenmeyer flasks, and the initial pH was adjusted with 0.1 M HCl and 0.1 M NaOH solutions. Then, the thermally modified bentonite adsorbent (100 mg) was added to the aqueous caffeine solution. The suspension was magnetically stirred at a constant speed (rpm) using a 5-position digital magnetic stirrer (RT 5, IKA, Staufen, Germany). The caffeine concentration was determined from aliquots (0.75 mL of sample filtered on 0.45 μm, millipore membrane), quantified from a previous calibration curve, obtained by UV–Vis spectrophotometry (Genesys 150, Thermo Scientific, Madison, WI, USA) at a wavelength (λ) of 273 nm. The removal efficiency was calculated from Equation (1):
R e m o v a l   ( % ) = C 0 C t C 0 × 100
where C 0 and C t represent the concentrations of caffeine in mg/L, at the initial of adsorption (t = 0) and at time t.
The temperature for the thermal treatment of Na–Bent was established from caffeine adsorption tests, where the effects of contact time and initial pH on the contaminant removal efficiency were analyzed. Once the adsorbent was selected, the effect of stirring speed was examined, as illustrated in Table 1.

2.4. Experimental Design

From the adsorption tests described in Table 1, the thermal treatment temperature of the adsorbent was selected, as well as the initial pH of the caffeine solution and the contact time and stirring speed that guarantee equilibrium conditions in the process. The RSM based on a central composite design (CCD) was proposed for the experimental design, considering adsorbent mass (X1) and initial caffeine concentration (X2) as variables. Design Expert 8.0 software (StatEase, Inc., Minneapolis, MN, USA) was used to design and analyze the experiments, where the response variable was caffeine removal efficiency (Equation (1)). The independent variables and their ranges are shown in Table 2.

2.5. Adsorption Isotherm and Reuse Tests

Caffeine adsorption isotherm with the selected adsorbent was obtained at 25 °C, using initial caffeine concentrations ranging between 5 and 250 mg/L. The equilibrium adsorption capacity of caffeine was calculated using the following Equation (2):
q e   ( m g / g ) = V × ( C 0 C e ) m a d s × 100
where C 0 and C e are the initial and equilibrium concentrations of the caffeine in aqueous solution (mg/L), V is the volume of the solution (L), and m a d s is the mass of the adsorbent (g). The experimental data of the caffeine adsorption isotherm were fitted to the Langmuir, Freundlich, and Redlich–Peterson models [38,39,40,41].
The reusability of the selected adsorbent was studied by repeating the adsorption/desorption for several cycles. The adsorbent was regenerated by contact with an aqueous solution at pH = 12.0, subsequently washed with distilled–deionized water, and dried at 60 °C for 24 h.

2.6. Adsorption Kinetics and Mechanism

The adsorption kinetics for caffeine at three different concentrations and 25 °C were studied using the selected adsorbent. For the kinetic studies, the experimental data (adsorption capacity at time t in mg/g) were fitted to pseudo-first-order (PFO), pseudo-second-order (PSO), Elovich, and intraparticle diffusion (IPD) models [42], whose equations are shown in Table 3.

3. Results and Discussion

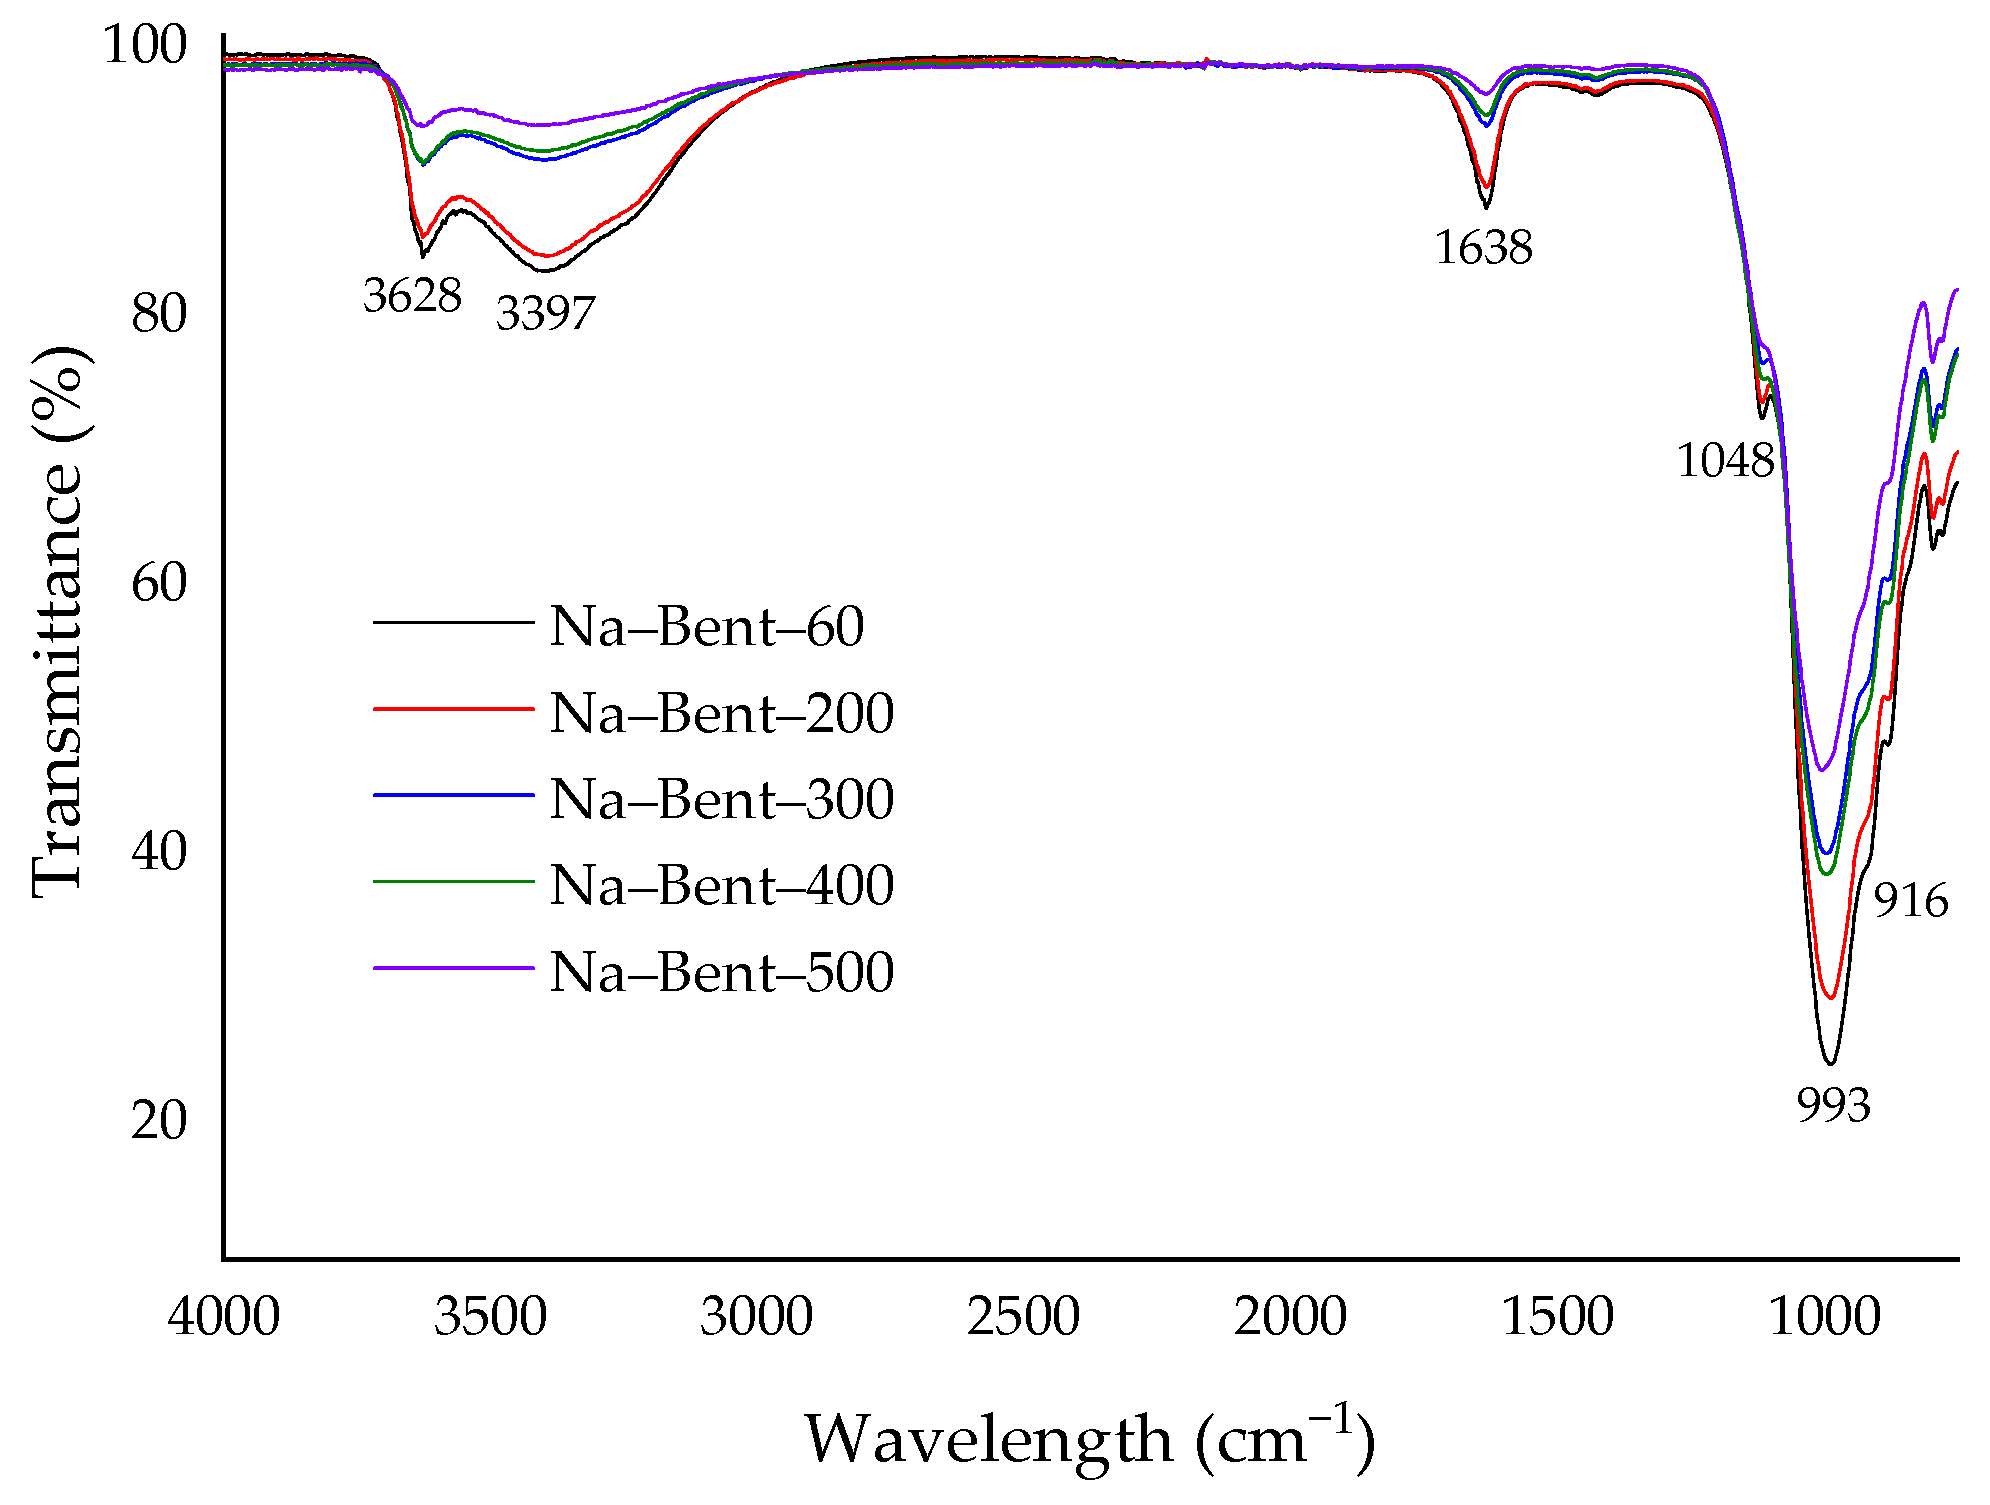
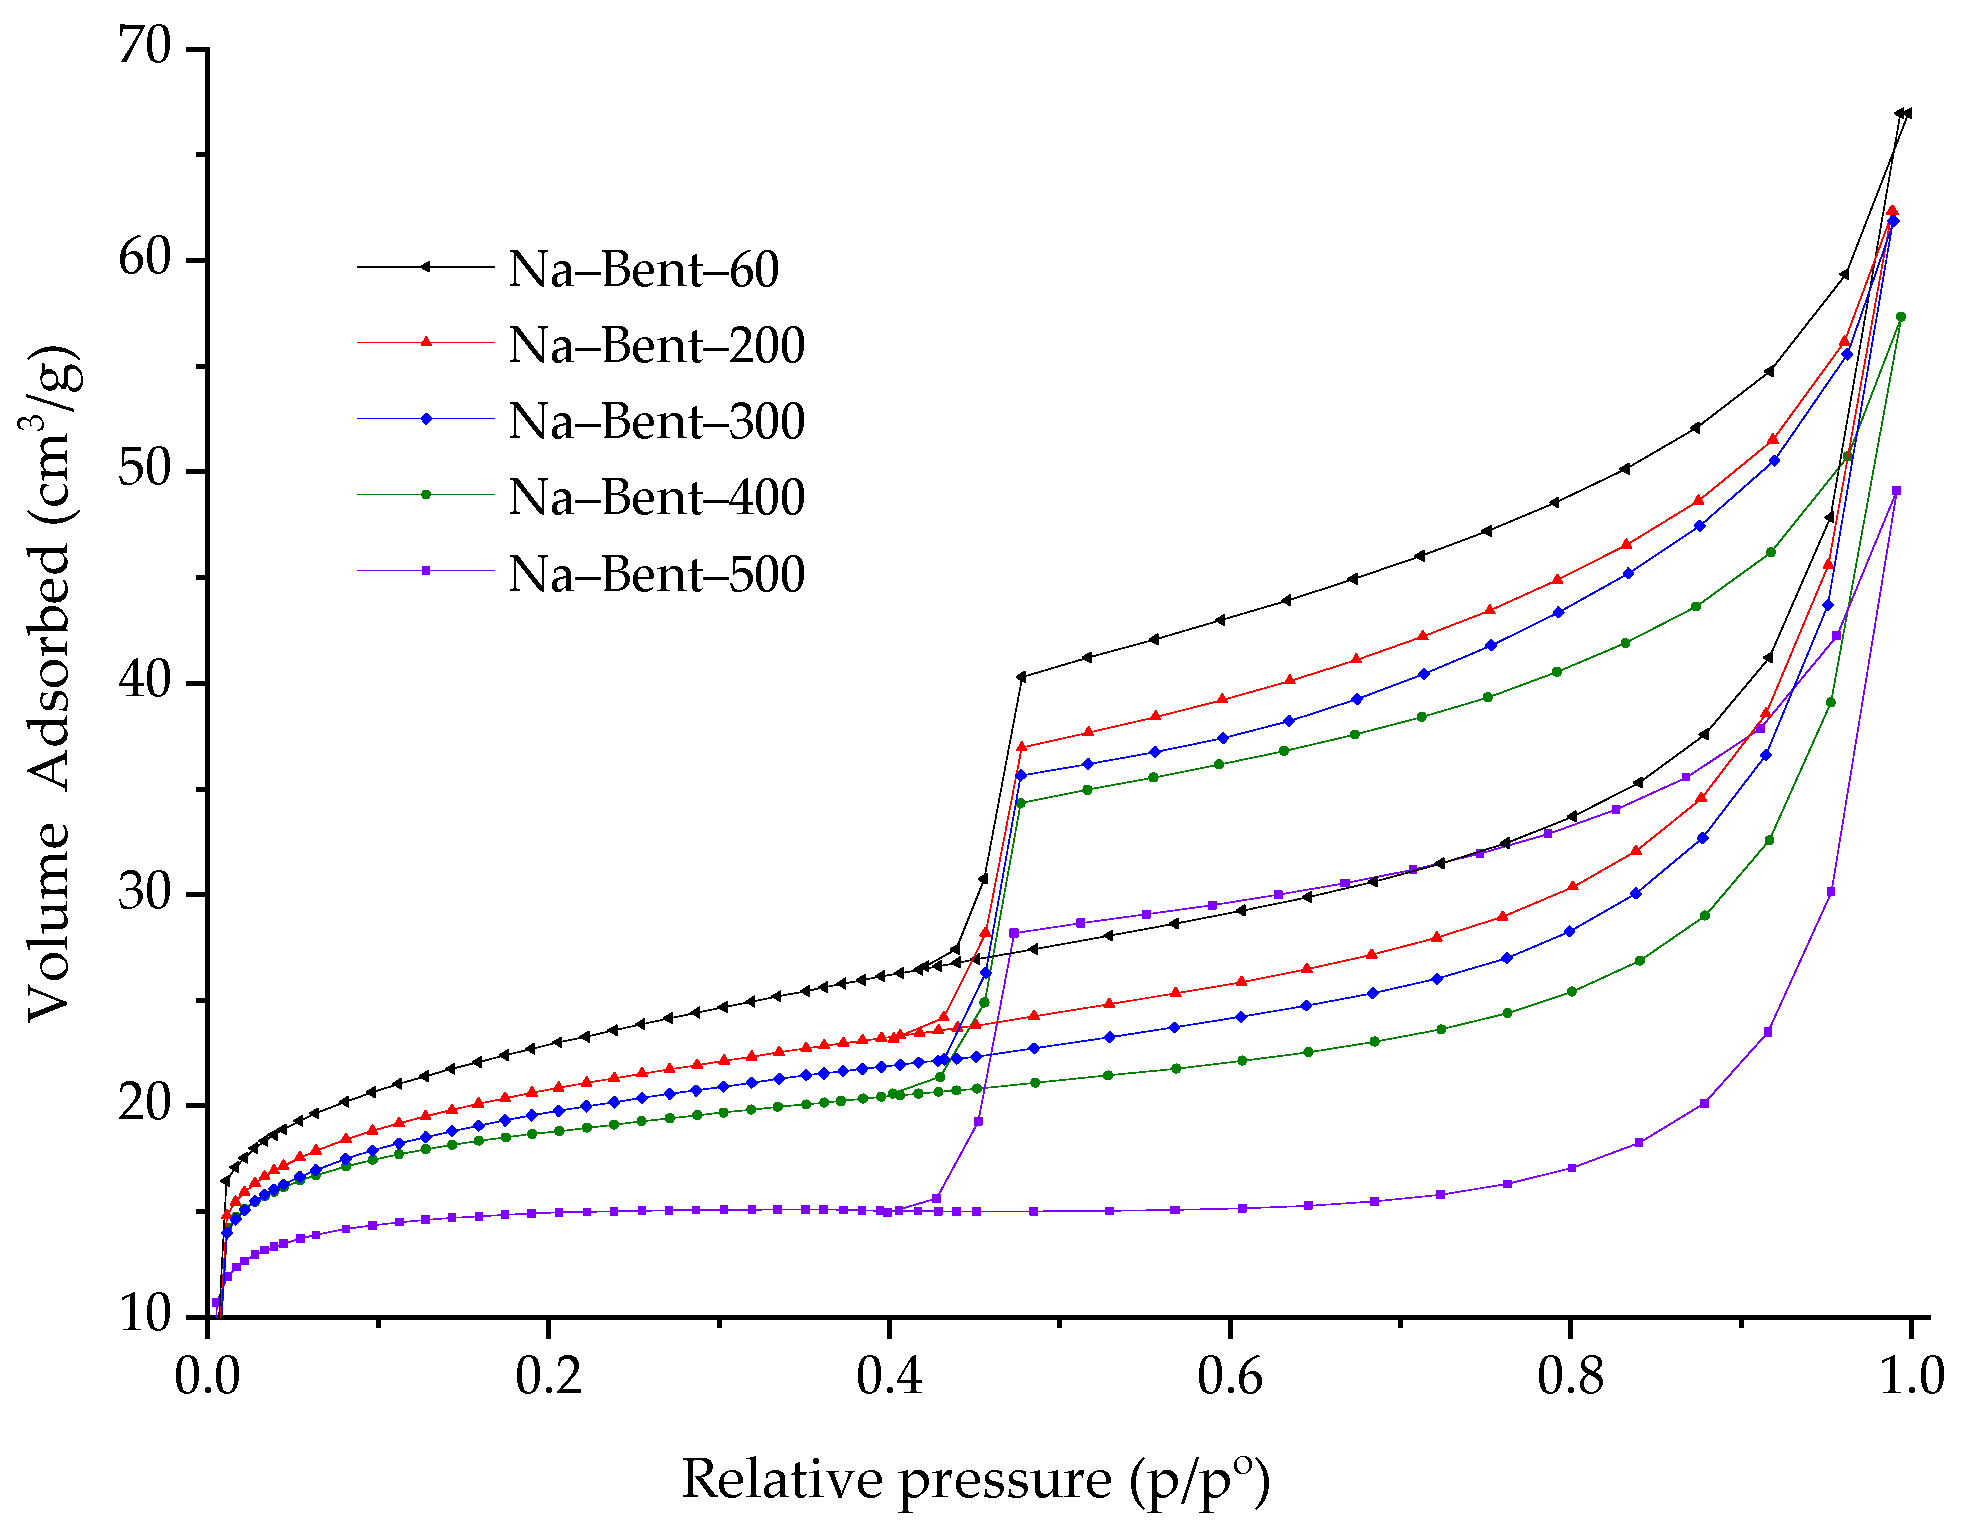
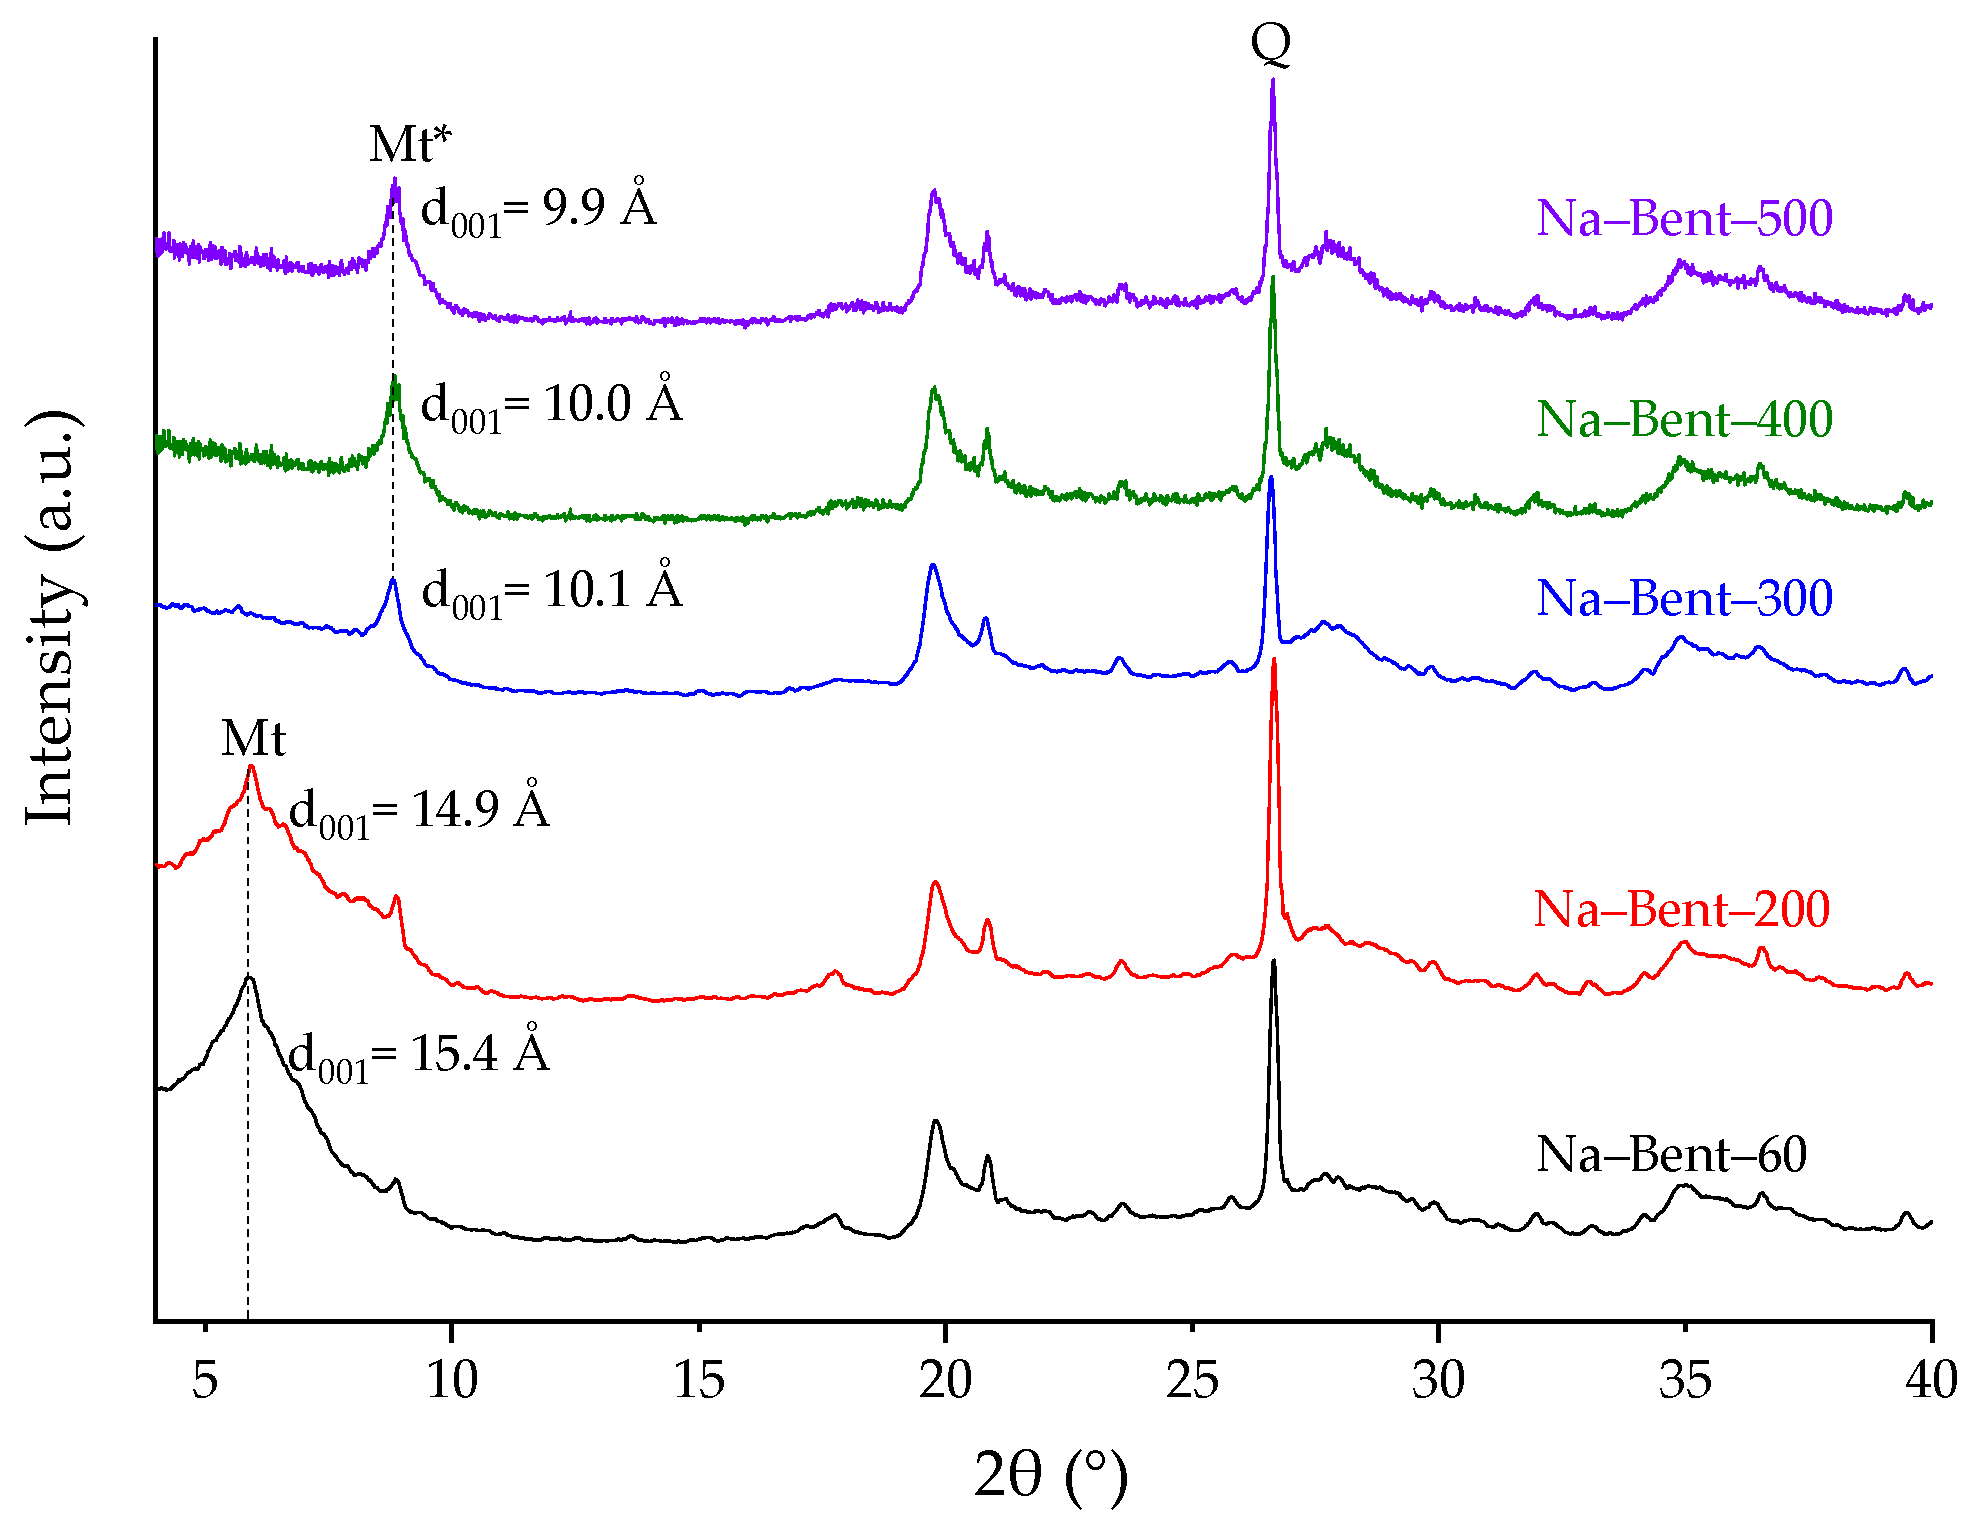
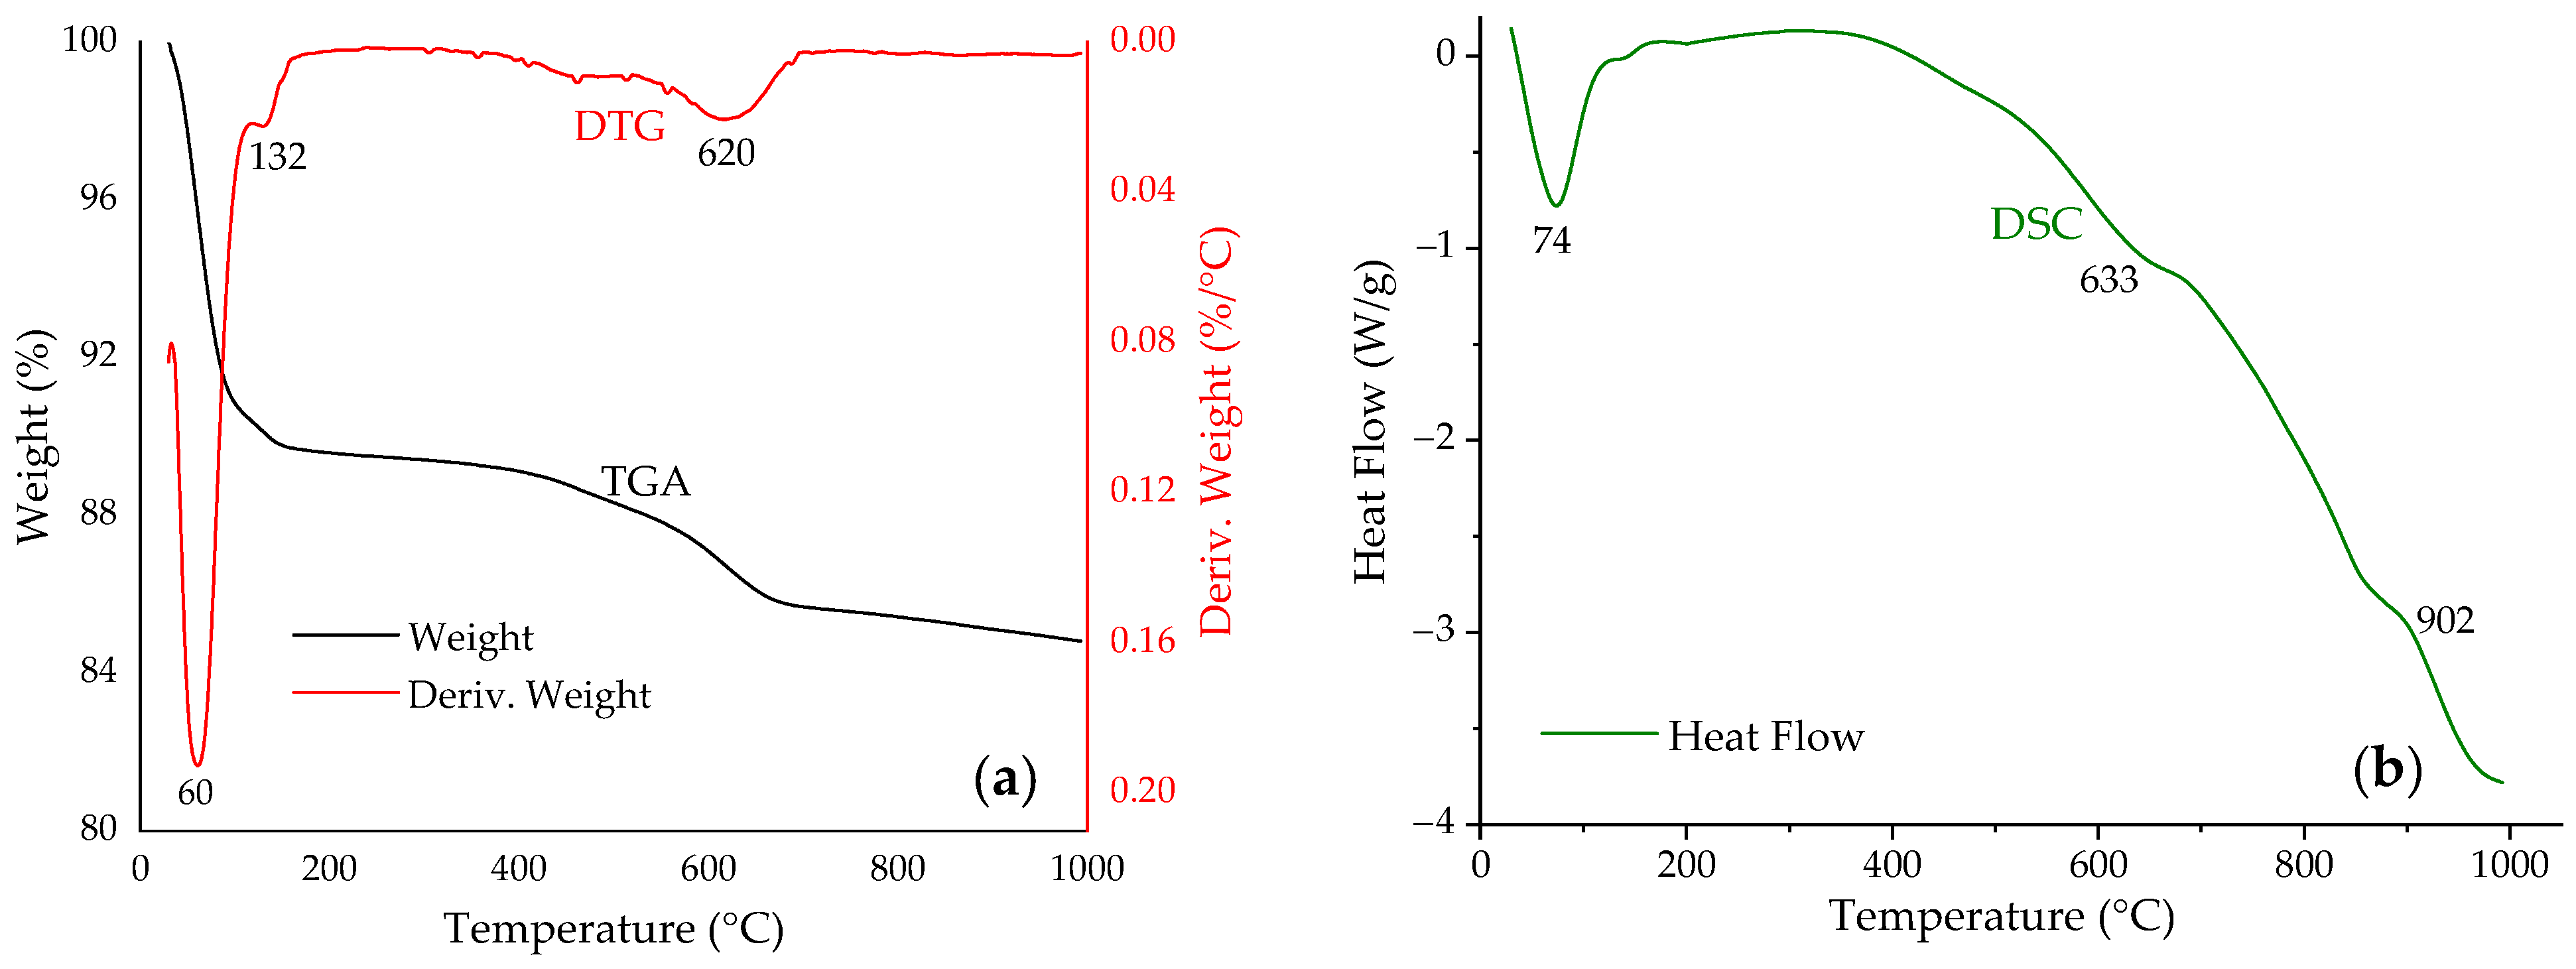
3.1. Adsorbent Characterization

The chemical compositions of raw clay, purified bentonite, and thermally modified bentonite at 400 °C are shown in Table 4. According to the diagram proposed by Sivrikaya et al. (2017), based on the composition of SiO2 and Al2O3 + Fe2O3 for the classification of clay minerals [43], raw clay, Na–Bent–60, and Na–Bent–400 are in the montmorillonite zone. The chemical composition of the principal oxides in the analyzed samples is within the range established for the montmorillonites, except for Fe2O3. A particularity of the smectite deposits in the Armero-Guayabal (Colombia) is the reddish coloration due to the high Fe2O3 content [28].
The chemical compositions of Na–Bent–60 and Na–Bent–400 are similar, as also reported by Vieira et al. (2010), who found that the chemical composition of bentonite from Brazil did not change after calcination, the main elements being preserved, such as silicon and aluminum, as well as the exchangeable cations [44].
The X-ray diffractograms for the raw clay and sodium bentonite subjected to the different thermal treatments are shown in Figure 2. According to the previous mineralogical characterization of this raw clay, the main component is montmorillonite accompanied by impurities of quartz, plagioclase feldspar, sillimanite, and cristobalite [28]. The d001 reflection in the raw clay and Na–Bent–60 corresponds to a basal spacing of 15.4 Å, and during the thermal treatment, a change in this reflection is observed. The 001 reflection of bentonite decreases in intensity after heating from 60 to 200 °C, and the d001 value reduces from 15.4 to 14.9 Å due to the loss of adsorbed water on the external surfaces of the clay. After heating from 200 to 300 °C, the basal spacing decreases from 14.9 to 10.1 Å due to complete dehydration of the clay. The position of the 001 reflection does not change considerably between 300 and 500 °C, but the signal intensity becomes more pronounced with thermal treatment, suggesting greater structural organization in the clay. The dehydrated and partially dehydroxylated montmorillonite is referred to as meta-montmorillonite (Mt*), which shows a high crystalline degree based on the diffraction pattern [45]. The above XRD patterns are similar to those reported for bentonite (Ankara, Turkey) subjected to thermal treatment [46].
The FT–IR spectra of the heat-treated sodium bentonite are shown in Figure 3. The broad band centered near 3397 cm−1 is due to –OH stretching for interlayer water [47]. The intensity of this signal decreases in bentonite with increasing treatment temperature. High-iron montmorillonites show a typical stretching of the –OH band for Al–OH at 3628 cm−1, while those with low-iron content show a band at 3622 cm−1 [28,48]. The absorption peaks in the region of 1638 cm−1 are assigned to the –OH–bending mode of adsorbed water [48], the intensity of which decreases with increasing treatment temperature. The peak at 1048 cm−1 in the spectrum for raw clay is attributed to the layered silicates Si–O (in-plane) stretching vibration [49]. The vibrations between 993 and 916 cm−1 correspond to Si–O and Al–Al–OH stretching and deformation, respectively [28].
Thermogravimetric analysis (TGA) and derivative thermogravimetric (DTG) of Na–Bent–60 show that typical regions are associated with water loss and dehydroxylation (Figure 4a) [32]. The shape of the weight line suggests external surface water loss between 60 and 110 °C and hydration water loss between 110 and 160 °C, with endothermic peaks at 60 and 132 °C, respectively. Dehydroxylation occurs between 410–713 °C, with an endothermic peak at 620 °C. From DSC analysis (Figure 4b), the endothermic peaks for dehydration and dehydroxylation are observed at 74 and 633 °C, followed by a small exothermic peak at 902 °C due to the structural modification [33,45]. The total mass losses due to dehydration and dehydroxylation were 10.6% and 3.7%, respectively.
TGA analysis of sodium bentonite between 200 and 300 °C shows a mass loss of 0.18%. However, the XRD patterns of Na–Bent–200 and Na–Bent–300 are very different because bentonite treated at 200 °C can quickly rehydrate with moisture in the air. For Na–Bent–300, the dehydrated cations present in the interlayer space could be rearranged because the acidity of the clay surface changes with heat treatment, and this material cannot rehydrate. According to Heller-Kallai (2006), upon heating, all clay minerals pass through a temperature range in which they dehydrate to varying degrees. In the upper region of this temperature range, dehydration and the onset of dehydroxylation may overlap [50]. The above could explain the differences in the XRD patterns of the Na–Bent–200 and Na–Bent-300 samples, with minimal variation in the TGA analysis.
The N2 adsorption–desorption isotherms for sodium bentonite subjected to thermal treatment are shown in Figure 5, while the calculated textural parameters are summarized in Table 5. According to the IUPAC classification, all isotherms are of type IV a with H3 hysteresis loops, characteristic of mesoporous materials with a small volume of micropores. The hysteresis loop of this type results from nonrigid aggregates of plate-like particles [51].
The heat treatment of bentonite results in a decrease in textural properties, obtaining materials with a lower specific surface area, microporous area, and micropore volume. However, the mesoporous character of bentonite is preserved after heating, which is observable from the hysteresis loop between the adsorption and desorption isotherms [52]. According to the research conducted by Noyan et al. (2006), the heating of bentonite leads to a decrease in the specific surface area, with small changes observed until the beginning of dehydroxylation after which the changes become greater [46].
The point of zero charge values for sodium bentonite treated at 60, 200, 300, 400, and 500 °C is shown in Table 5. The increase in heating temperature increases the pHPZC value due to the dehydration and dehydroxylation of the clay. The number of acid sites and the acid strength of bentonite also change with increasing treatment temperature [46].

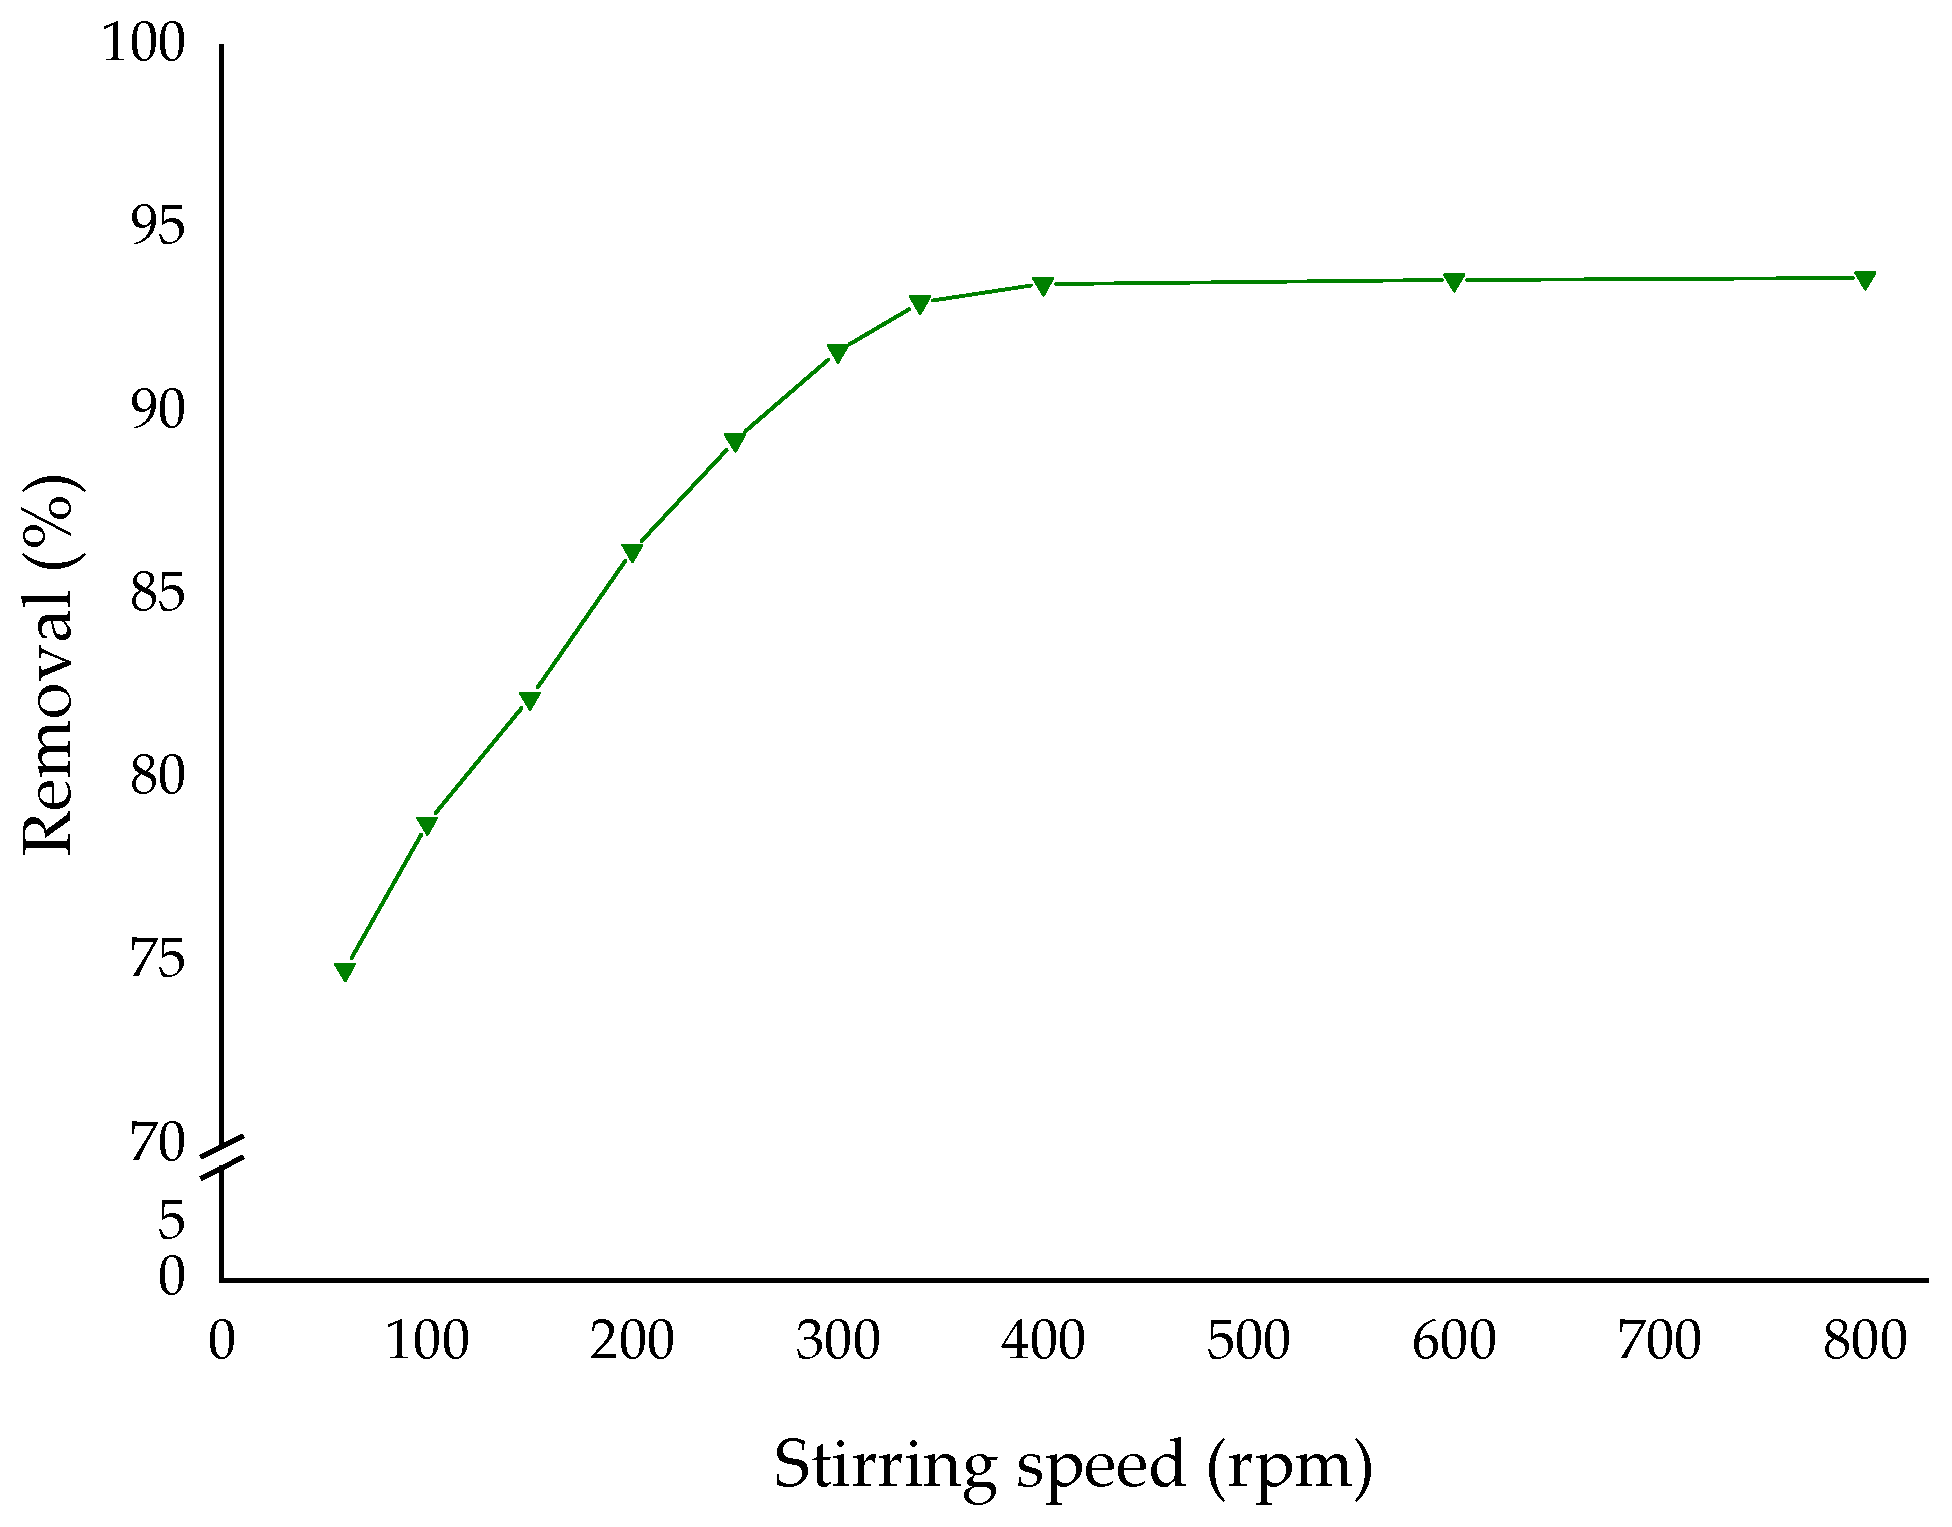
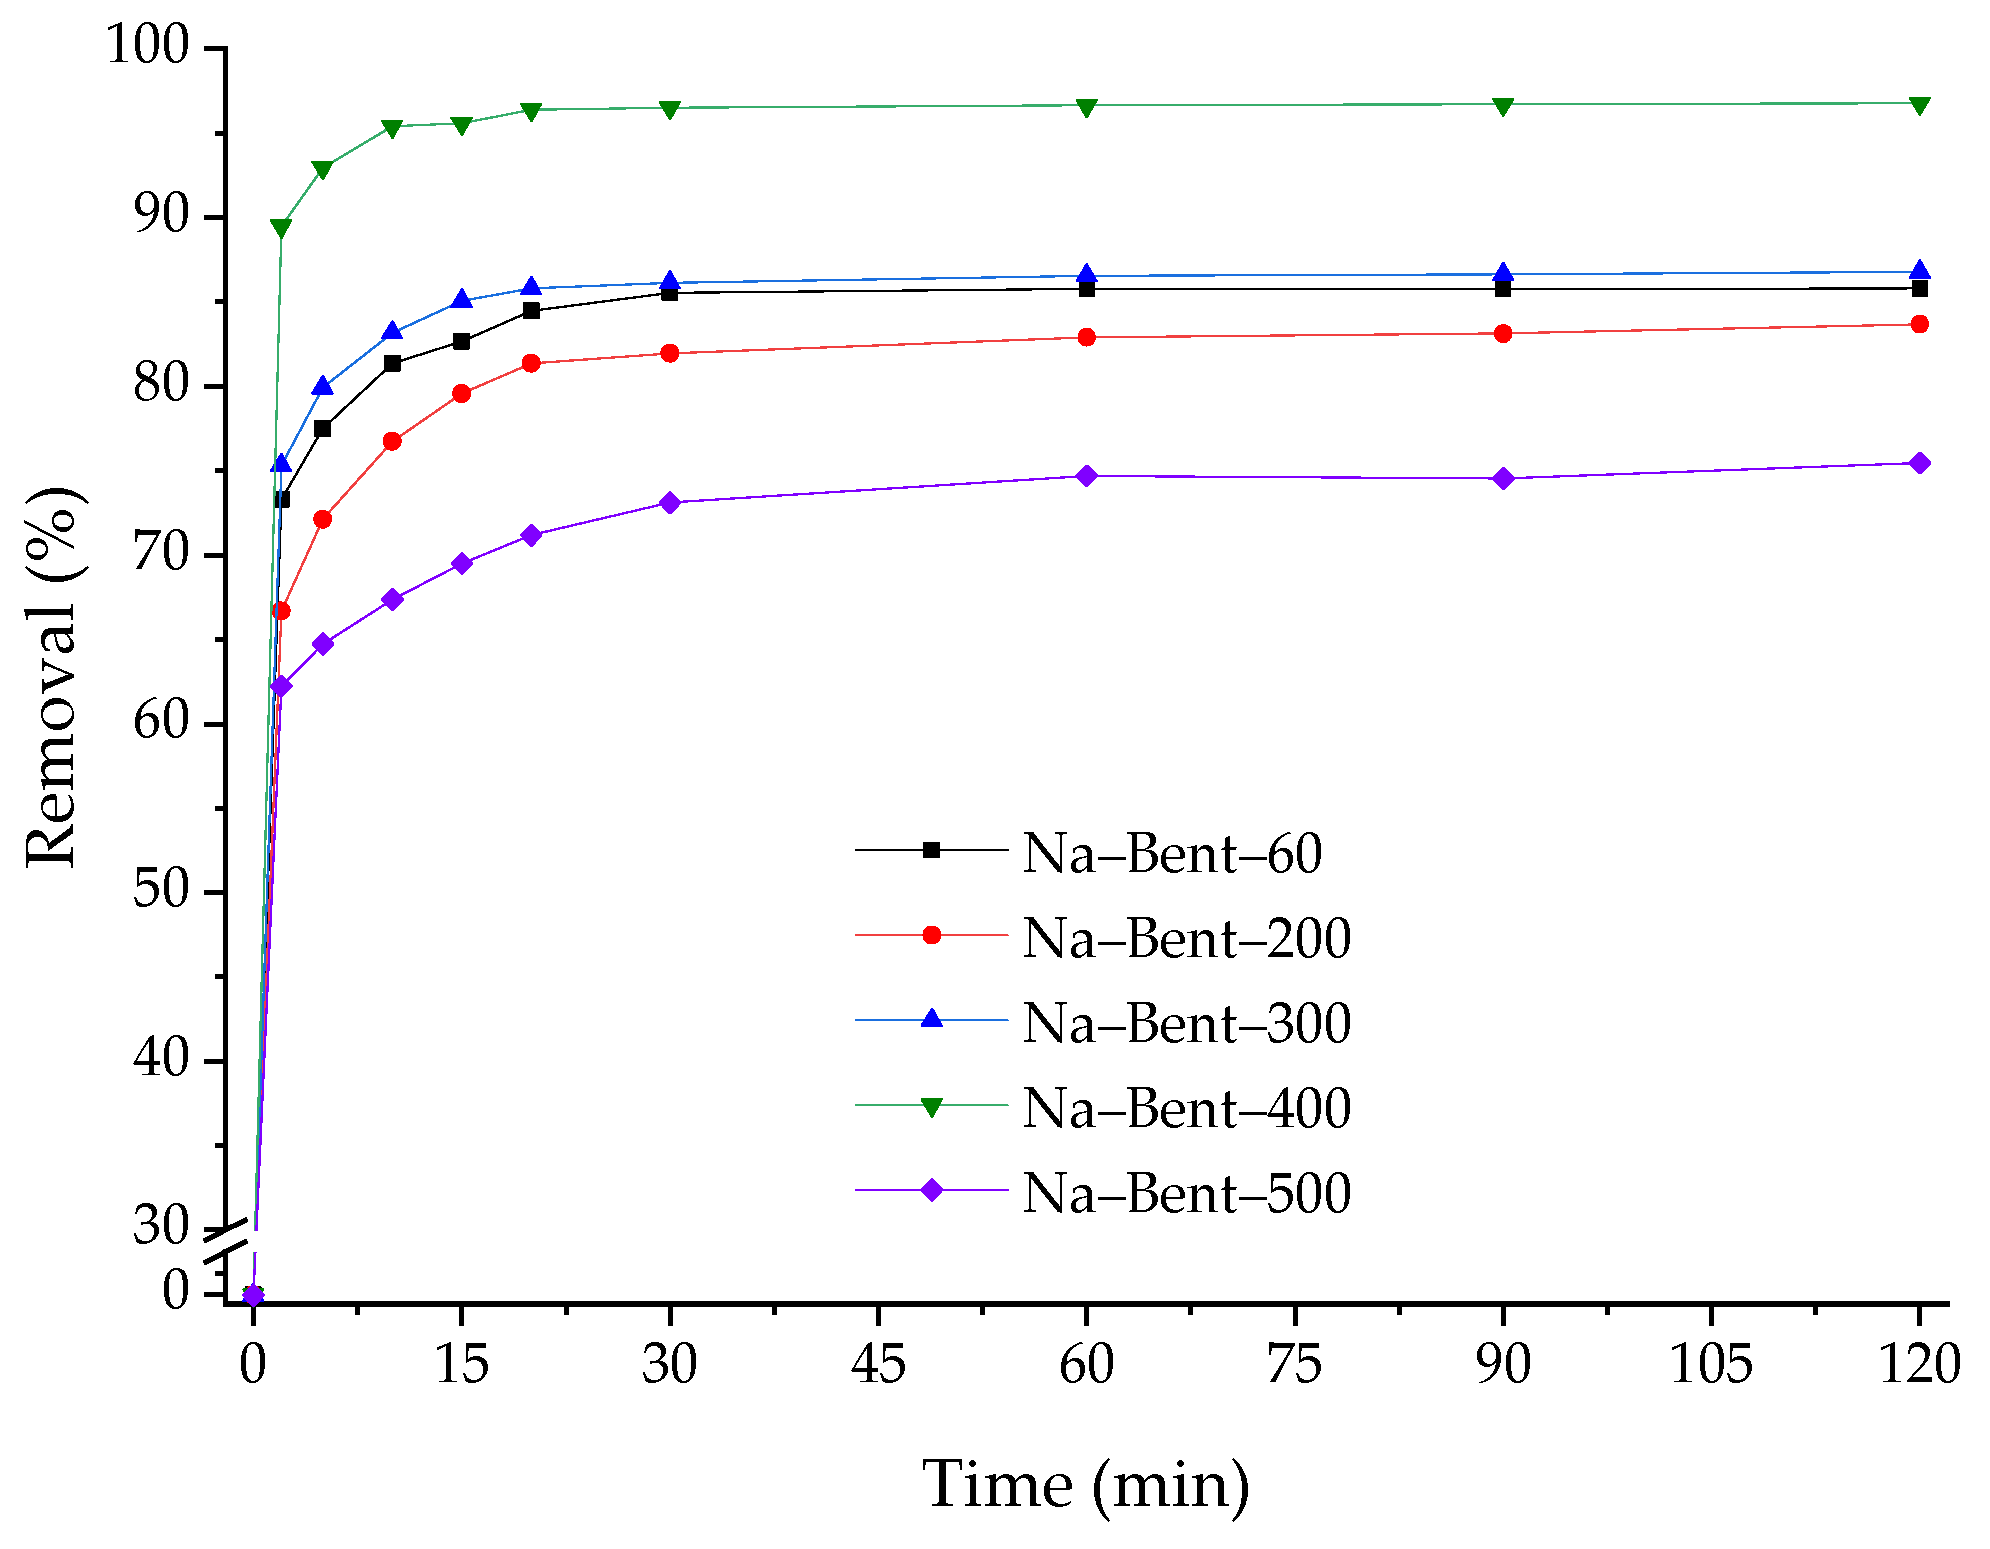
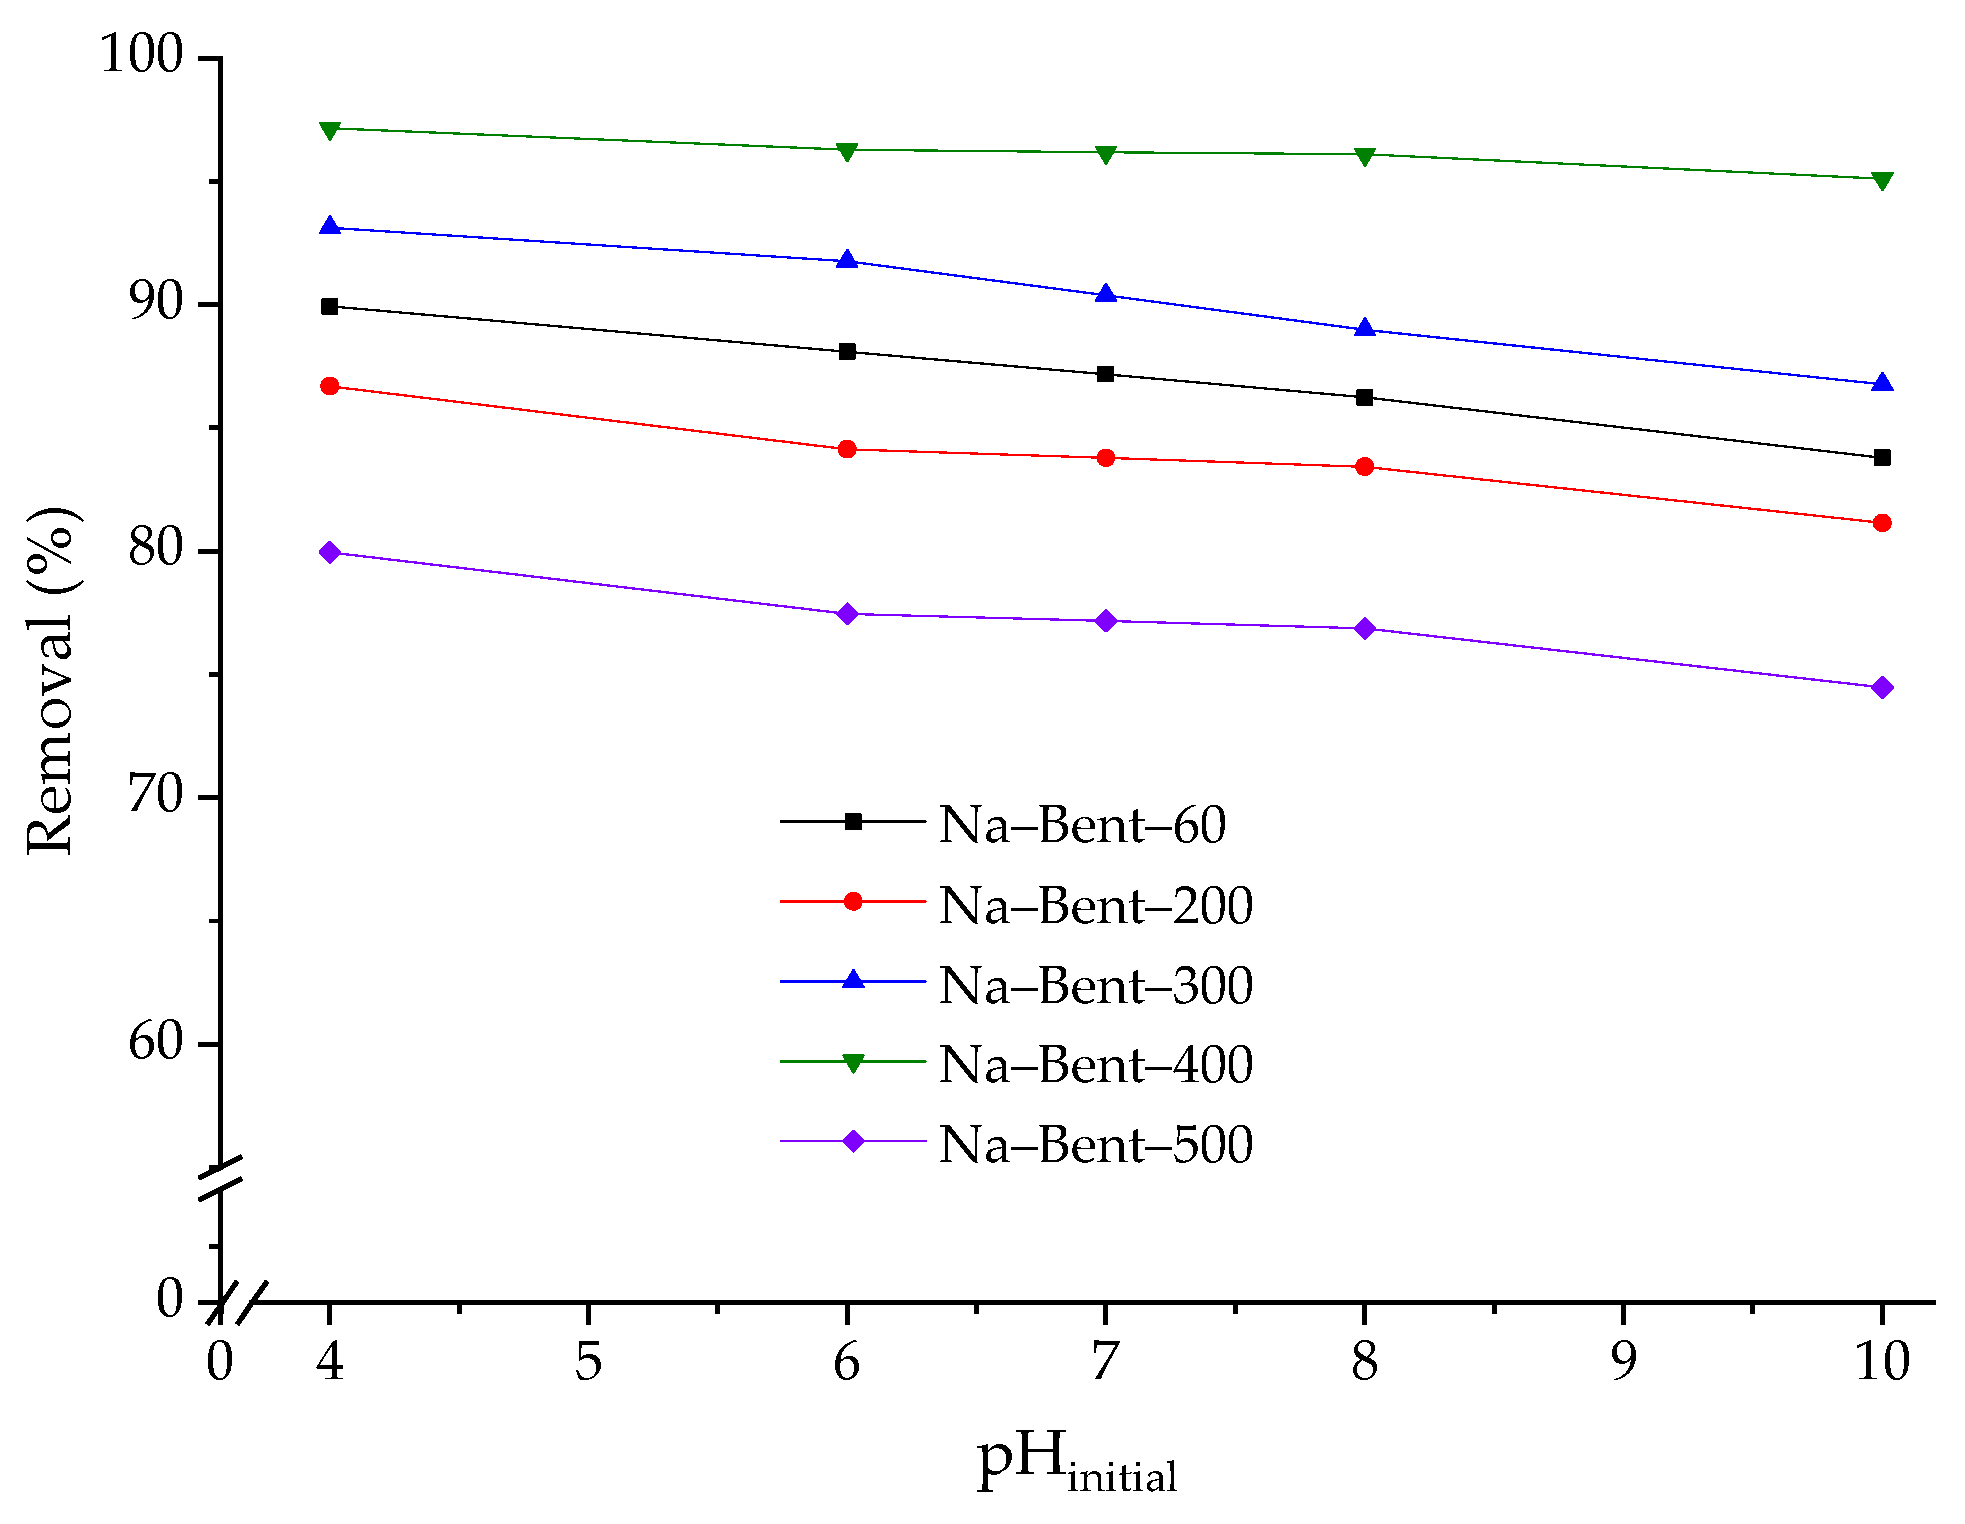
3.2. Experimental Conditions for Adsorption

The contact time analysis showed rapid caffeine adsorption on all the adsorbents studied, reaching equilibrium behavior after 60 min of contact time (Figure 6). For the adsorbents thermally modified between 200 and 400 °C, at 10 min of contact time, caffeine removals above 76% are obtained. The caffeine removal efficiency varies with the heating temperature of the sodium bentonite, being higher for bentonite thermally treated at 400 °C and lower for that treated at 500 °C. The contact time in the following adsorption tests was 120 min, ensuring equilibrium conditions.
The effect of the initial pH on caffeine removal is shown in Figure 7. The highest caffeine removal was obtained for Na–Bent–400 at an initial pH of 4.0, while the lowest was found for Na–Bent–500 at an initial pH of 10.0. Although the initial pH in the adsorption tests was fixed at a specific value, the monitoring of this variable showed that upon addition of the adsorbent, the pH changes rapidly and stabilizes after 10 min.
In all caffeine adsorption tests, changes between the initial (caffeine solution, pHi = 6.8 ± 0.1) and final (caffeine solution + adsorbent) pH were presented as follows: Na–Bent–60 (7.9–8.3), Na–Bent–200 (7.4–8.1), Na–Bent–300 (7.7–8.1), Na–Bent–400 (7.3–8.0) and Na–Bent–500 (7.0–7.7). For the adsorbents analyzed in the initial pH range of 4.0 to 10.0, the final pH was between 7.0 and 8.3. The Na–Bent–400 material showed the minimum dependence of caffeine removal on initial pH variation, which ranged from 95 to 97% over the pH range evaluated.
According to the results shown in Figure 6 and Figure 7, the adsorbent with the highest efficiency in removing caffeine was Na–Bent–400. An initial pH of 8.0 was selected for the following adsorption tests, and this variable was stabilized at 7.9 ± 0.1 after 10 min of contact time.
The effect of stirring speed on caffeine removal is shown in Figure 8. Between 60 and 340 rpm, the caffeine removal efficiency increases with stirring speed; however, between 340 and 800 rpm, the caffeine removal efficiency remains constant. Stirring speeds higher than 340 rpm guarantee complete mixing conditions; therefore, 400 rpm was selected for the following adsorption tests.

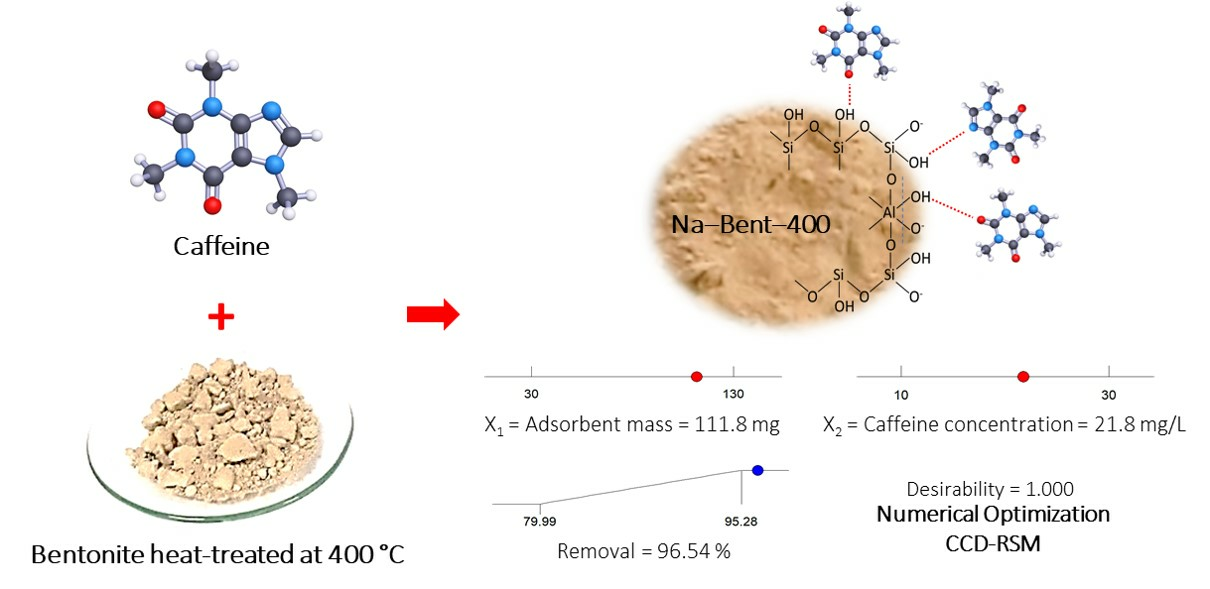
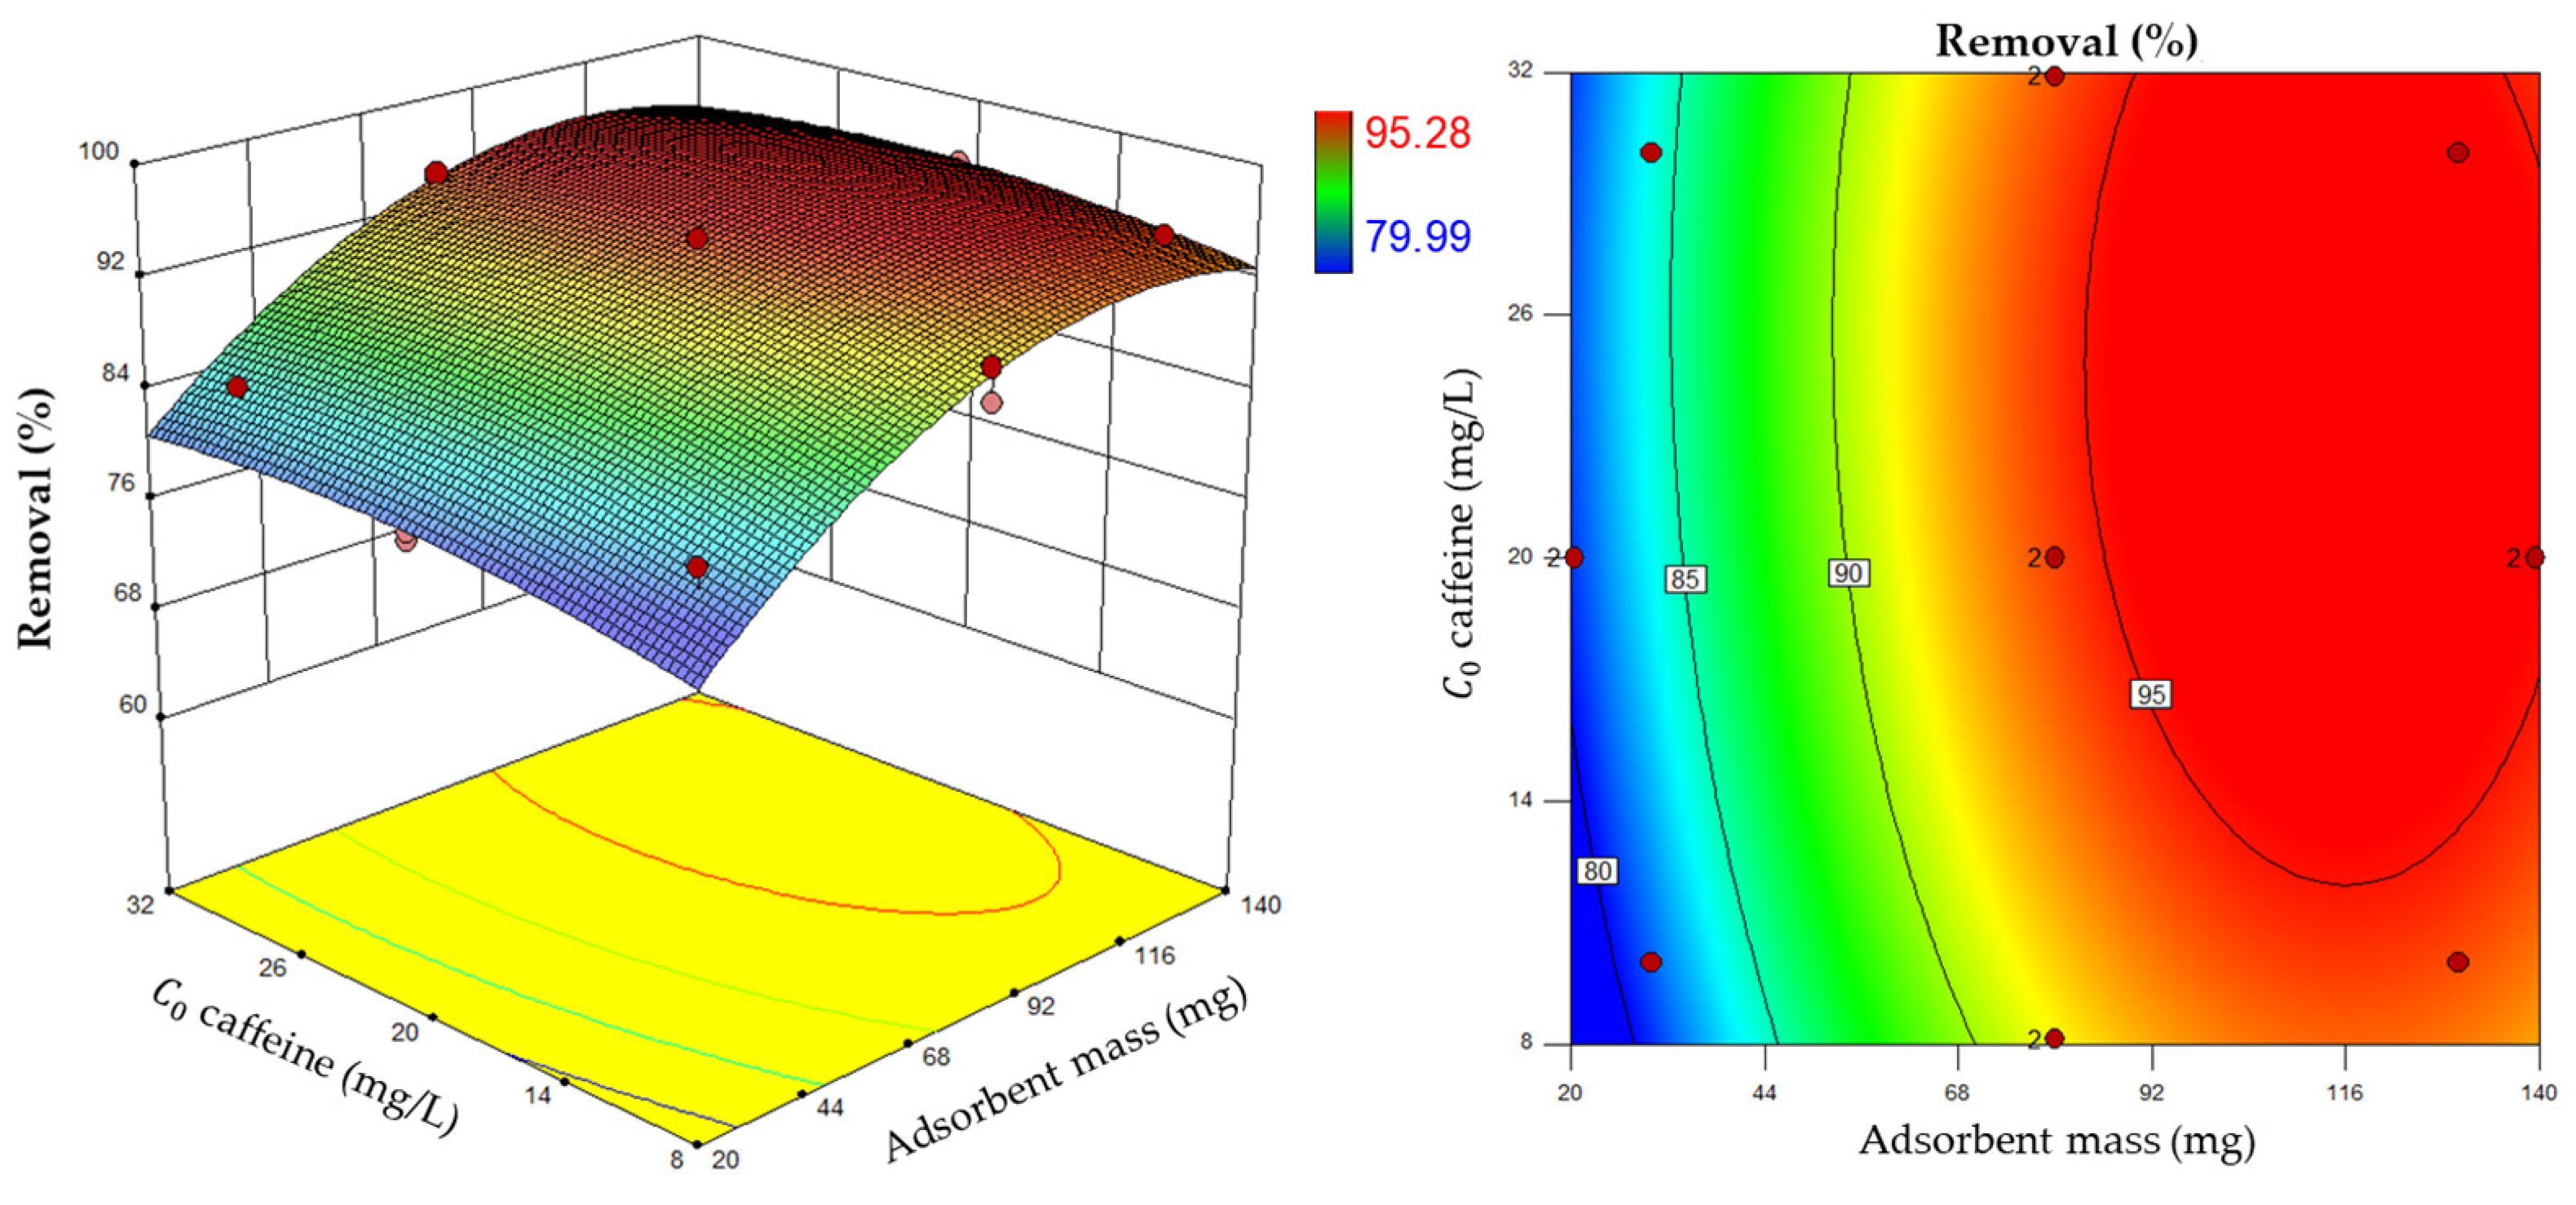
3.3. Experimental Design for Caffeine Adsorption

From the previously analyzed adsorption conditions, the bentonite treated at 400 °C was selected as the adsorbent material (Na–Bent–400) for the experimental design. A contact time of 120 min and a stirring speed of 400 rpm were used to guarantee equilibrium conditions. All the tests for the experimental design were carried out at an initial pH of 8.0. Experimental data on caffeine removal (Y) as a function of adsorbent mass (X1) and initial caffeine concentration (X2) were adjusted to a second-order polynomial equation to determine the coefficients of the response models as well as their significance [53]. For the two variables input under consideration, the response model is shown in Equation (3):
Y = β 0 + i = 1 k β i X i + i = 1 k β i i X i 2 i = 1 k 1 j = 2 j > i k β i j X i X j
where Y is the predicted response (removal efficiency, %), β 0 , β i , β i i , and β i j are the regression coefficients for the intercept and the linear, quadratic, and interaction coefficients, respectively; X i and X j are the coded levels for independent variables, and k = 2, i.e., the number of independent variables. Table 6 shows the coded and experimental values for the runs made in the experimental design together with the observed response.
The model fit was evaluated by the coefficients of determination (R2 and adjusted R2) and analysis of variance (ANOVA),which was applied to estimate the significance (Table 7). The model showed a p-value < 0.0001, indicating that it was highly significant and could be used to predict the response function accurately. From the p-values shown in Table 7, the linear terms X1 and X2 and the quadratic term X12 are significant in the model.
The second-order response function representing the relationship between the caffeine removal efficiency (%) and the independent variables is presented in Equation (4):
R ( % ) = 65.96113 + 0.41239 X 1 + 0.59379 X 2 0.00057 X 1 X 2 0.0017483 × 10 3 X 1 2 0.011004 X 2 2
where the first-order coefficients of the model show positive effects, while the quadratic coefficient has a negative effect. The R2 and the adjusted R2 for the model show that this regression is statistically significant and that only 3.55% of the total variations are not explained by the model.
Figure 9 shows the 3D surface and 2D contour plots for the removal of caffeine as a function of independent variables. Caffeine removal increases with adsorbent mass (X1) and caffeine concentration (X2) until a maximum is reached. The maximum caffeine removal (96.54%) is achieved when X1 = 111.8 mg and X2 = 21.8 mg/L, with a desirability of 1.000.
The criteria established in the Design Expert® 8.0 software for optimization were to maximize caffeine removal and the variables X1 and X2 in the range studied. To validate the results obtained with the mathematical model presented in Equation (4), additional adsorption tests were performed under the same conditions under which the model was obtained (Table 8). The maximum difference between the experimental value and the one calculated with Equation (4) was 4.6%. Therefore, the model obtained can predict the system response with minimum variations. It is important to note that the RSM is sensitive to the experimental range within which the input variables are examined, and extrapolation beyond this range can lead to inaccurate predictions [54].

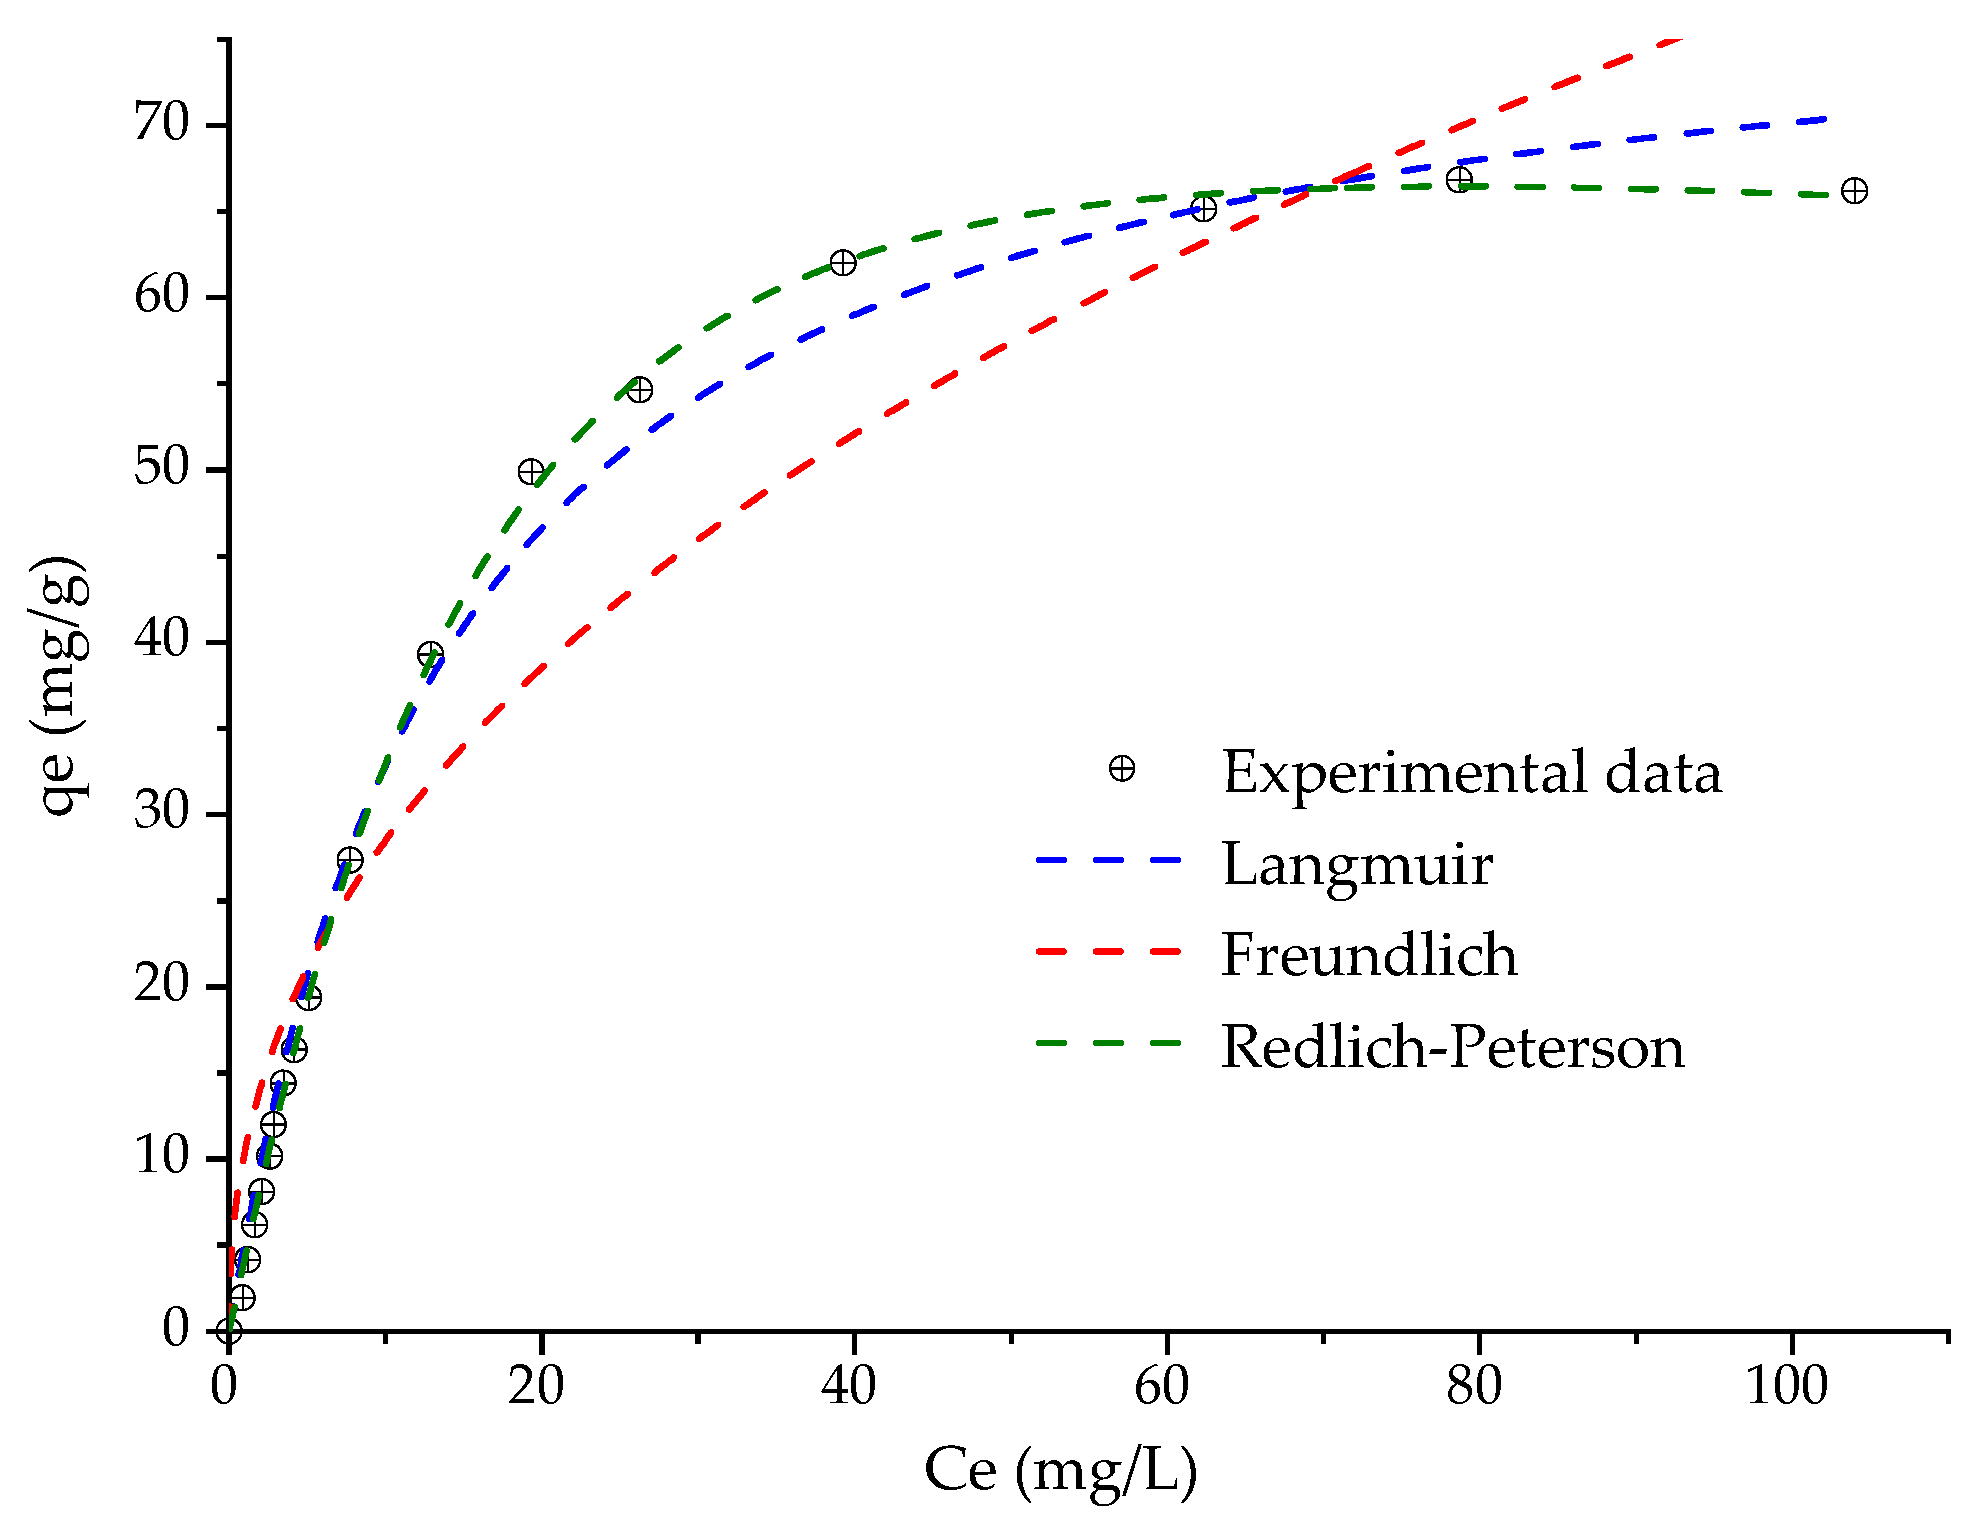
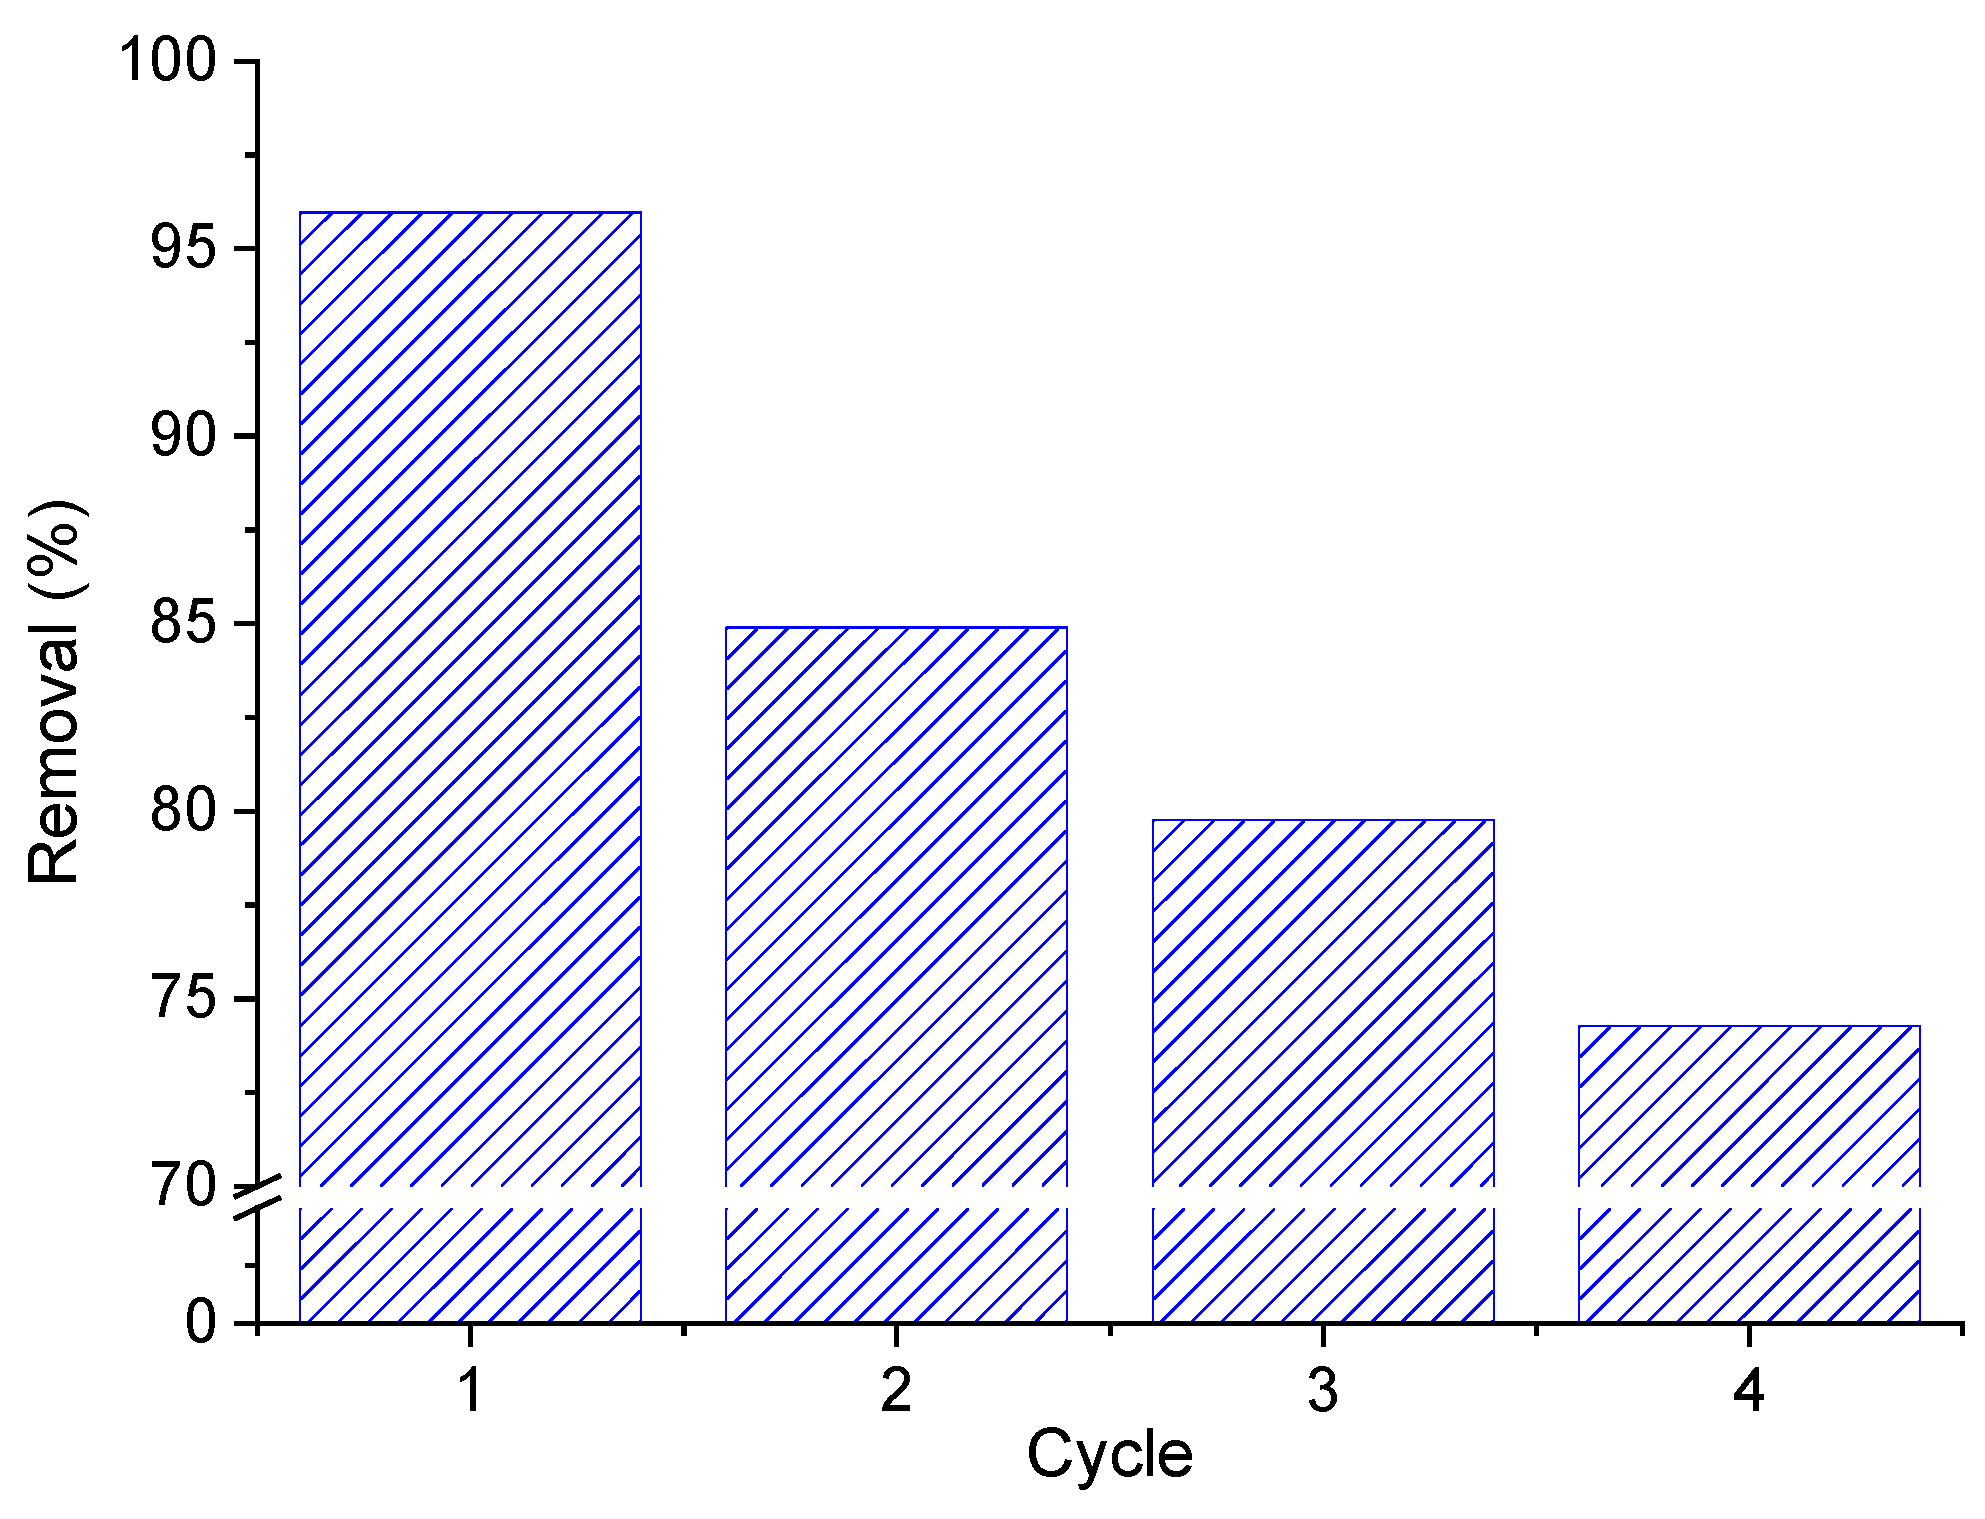
3.4. Adsorption Isotherm and Reuse Tests

The adsorption isotherm at 25 °C was studied for initial caffeine concentrations between 5 and 250 mg/L, keeping the adsorbent mass constant at 100 mg. All equilibrium tests were performed at pH = 8.0, contact equilibrium = 120 min, and stirring speed = 400 rpm. The experimental data of q e vs. C e were fitted to the Langmuir, Freundlich, and Redlich–Peterson models (Figure 10), and their parameters (Table 9) were obtained by nonlinear regression.
The experimental data for the isotherms adjust to a concave shape, corresponding to an L-type isotherm according to Giles’ classification. This type of isotherm suggests a progressive saturation of the solid phase [55]. The three-parameter Redlich–Peterson model shows the best fit (R2 > 0.998). This equation corrects the inaccuracies of the two-parameter Langmuir and Freundlich isotherm equations in some adsorption systems, where the adsorption mechanism is complex and does not follow that of an ideal monolayer. Additionally, the Redlich–Peterson model represents the adsorption equilibrium over a wide range of adsorbate concentrations, which is applicable in homogeneous and heterogeneous systems [56].
The maximum adsorption capacity of caffeine obtained with the Langmuir isotherm (80.3 mg/g) is similar to that reported for montmorillonite calcined at 200 °C [21] and lower than that obtained with activated carbons [57,58,59]. However, activated carbon is, on average, 20 times more expensive than natural clays [60].
The characteristic of the Langmuir isotherm can also be expressed using a dimensionless constant called separation factor ( R L ) [40], which is given by the Equation (5):
R L = 1 1 + K L × C i
where K L is de Langmuir constant (L/mg), C i is the initial caffeine concentration in the solution (mg/L), and the R L value indicates the isotherm type, whether it is unfavorable ( R L   > 1), linear ( R L   = 1), favorable (0 < R L < 1), or irreversible ( R L = 0). The R L values at 25 °C varied between 0.055 and 0.743, indicating the favorable nature of caffeine adsorption on Na–Bent–400.
The initial caffeine concentration for the adsorption and reuse tests was 20 mg/L, and the adsorbent load was 2 g/L. Caffeine desorption was performed by putting the caffeine-saturated adsorbent in an aqueous solution at pH = 12.0 (obtained by adding 0.1 M NaOH) and maintaining constant agitation at 400 rpm for 30 min. After four adsorption/desorption cycles, the removal of caffeine by the regenerated adsorbent went from 95.97% to 74.27% (Figure 11).

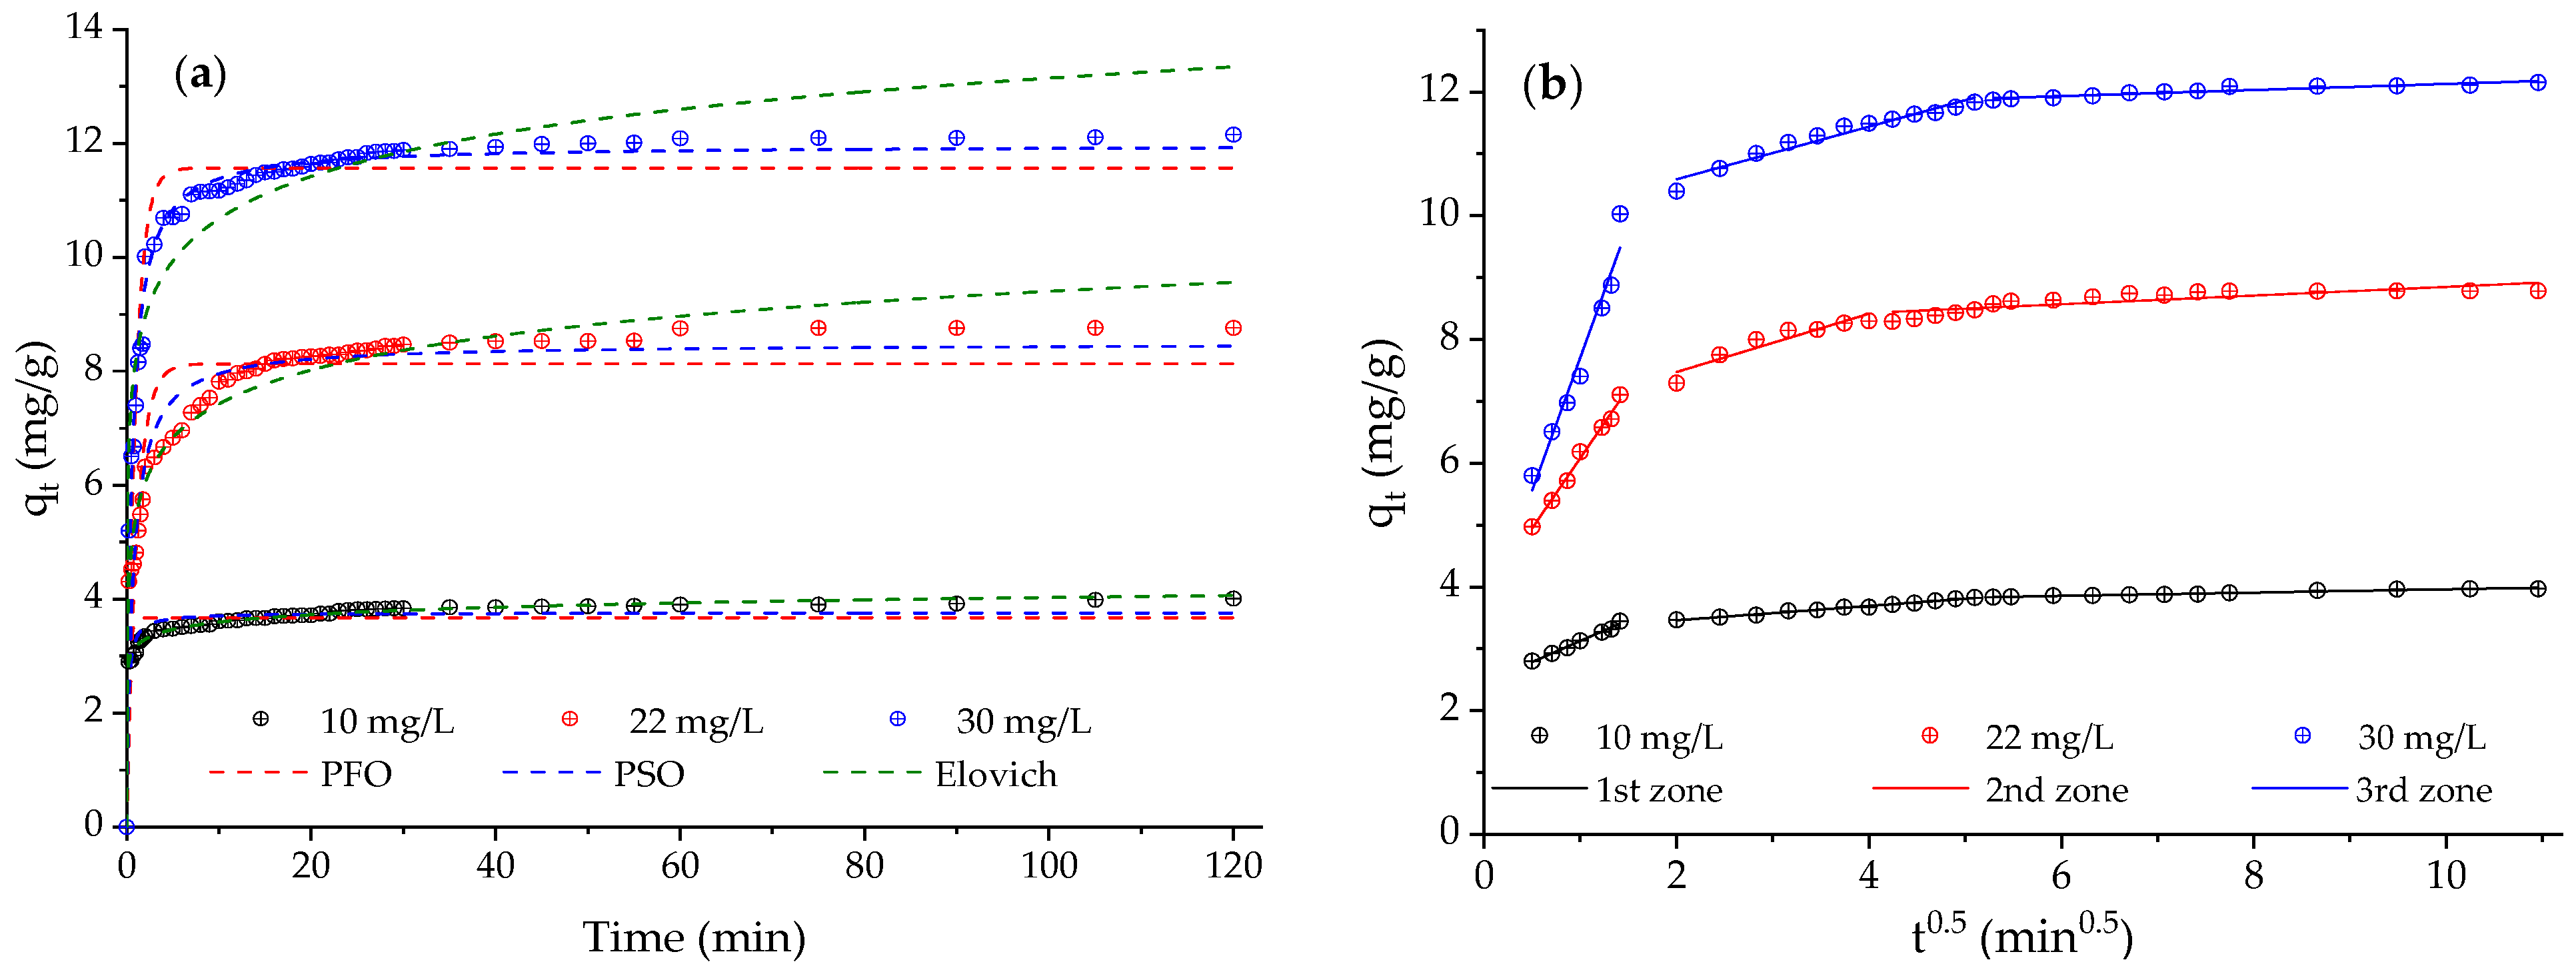
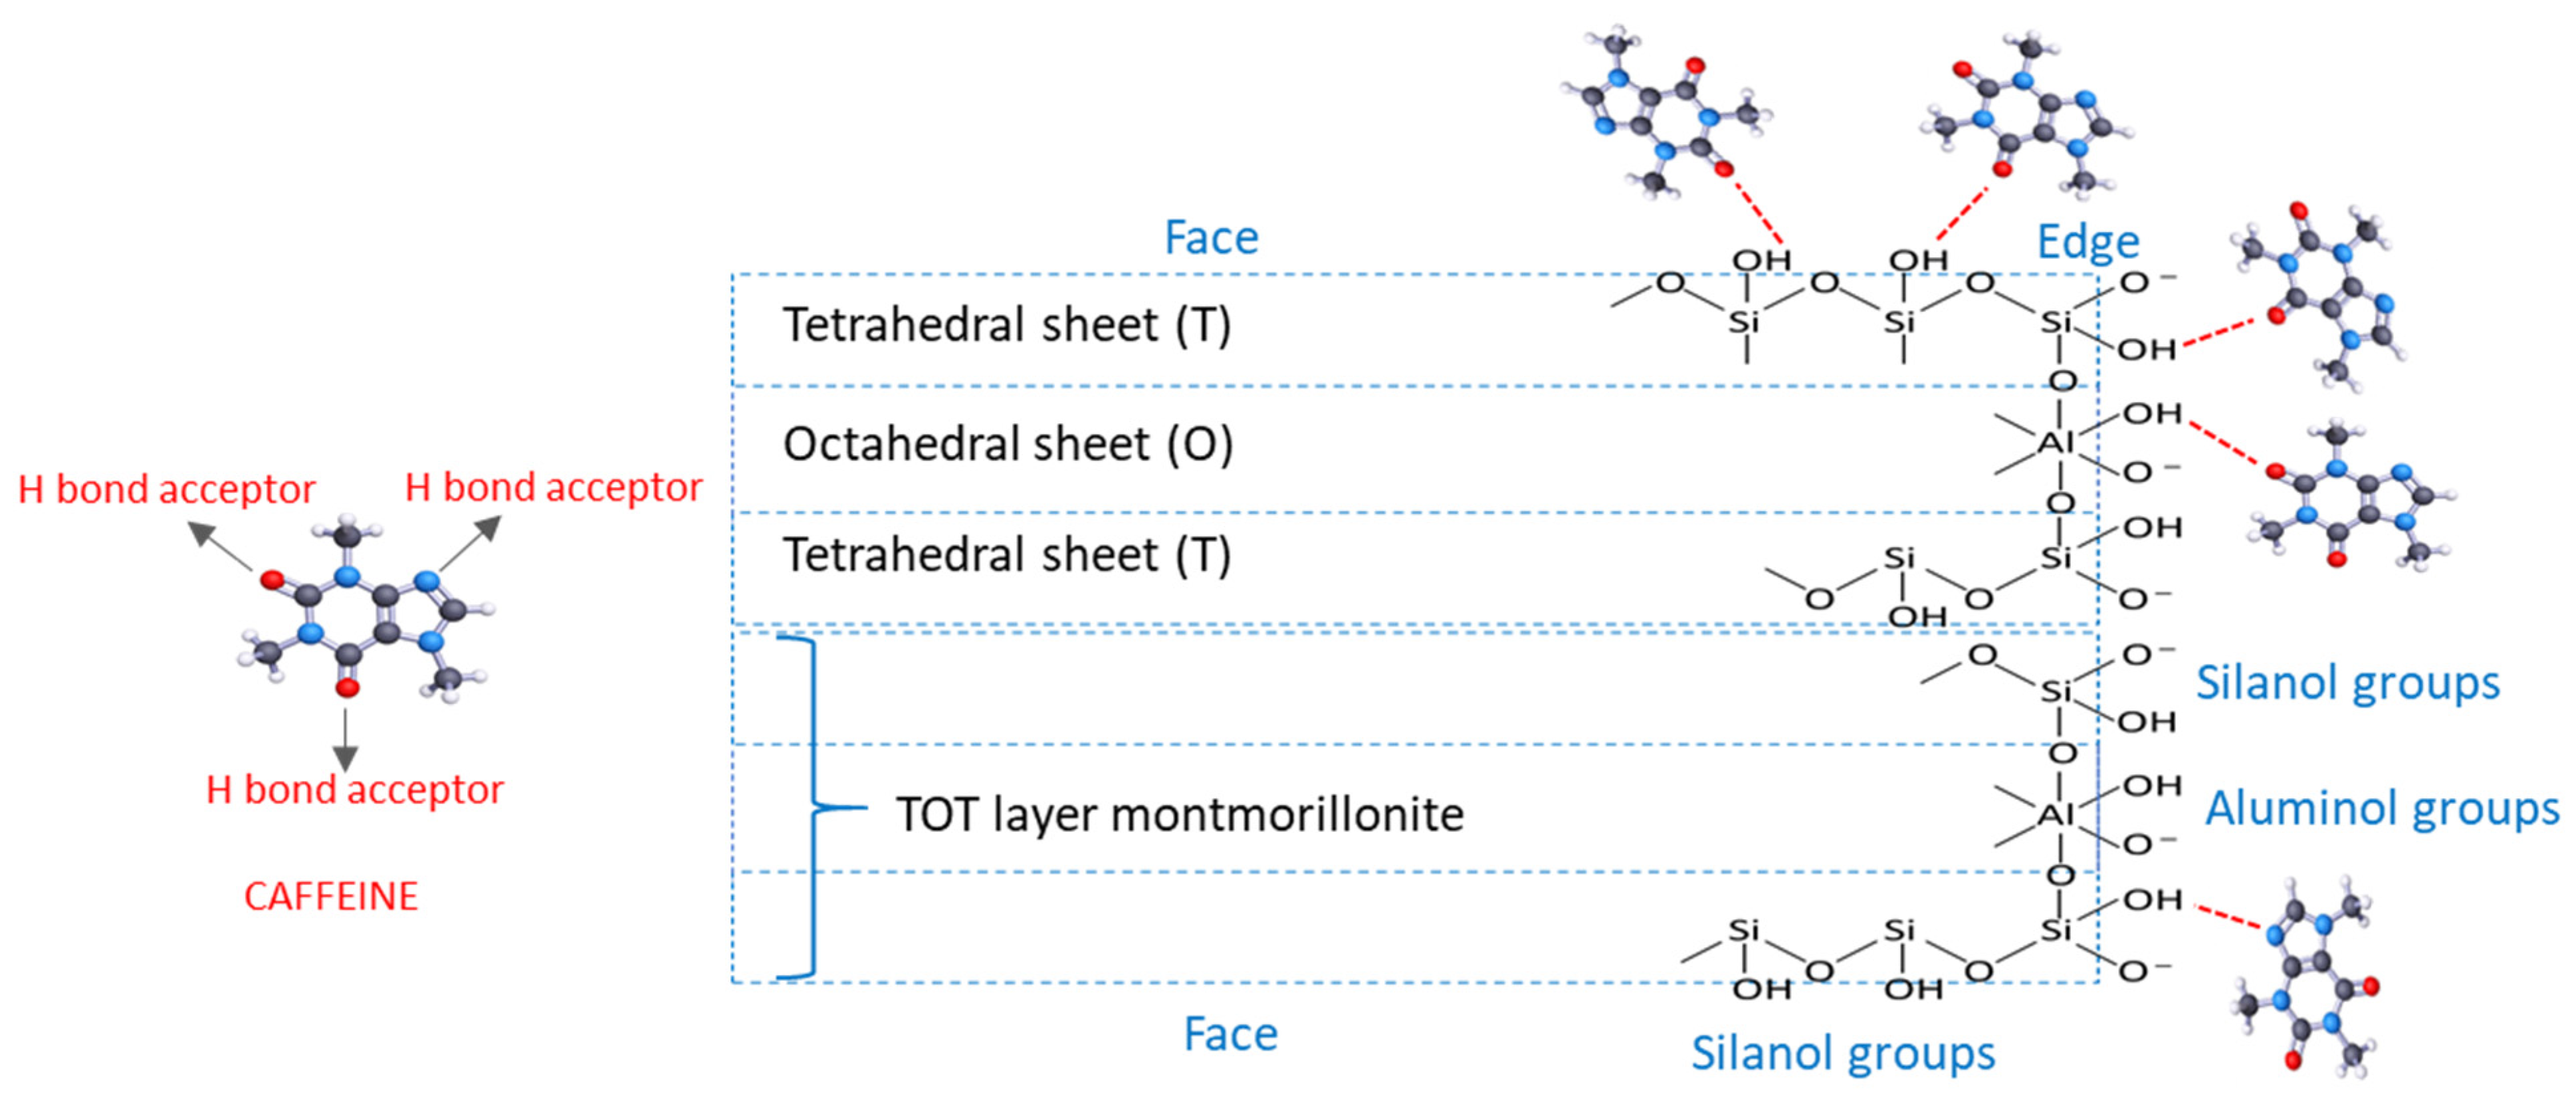
3.5. Adsorption Kinetics and Proposed Mechanism for the Adsorption of Caffeine

The q t data as a function of time (t) at concentrations of 10, 22, and 30 mg/L were fitted to the PFO, PSO, Elovich, and IPD models (Figure 12). The fit parameters of the kinetic data to the different models are summarized in Table 10.
The pseudo-second-order and Elovich kinetic models fitted the experimental data well (Figure 12a), with R2 values between 0.950 and 0.994 for the three concentrations studied. For a contact time of 30 min, between 96 and 98% of the initial caffeine was adsorbed. The good fit of the pseudo-second-order model indicates that the adsorption process is initially fast. As it approaches its final step (slow), the kinetic curve asymptotically approaches equilibrium, possibly due to diffusion in the smaller pores [61,62]. This study’s pseudo-second-order rate constants ( k 2 ) depend on the initial concentration ( C 0 ), and k 2 decreases from 0.182 to 0.018 g/mg min when C 0 is increased from 10 to 30 mg/L, suggesting that longer times are required to reach equilibrium. The good fit of the kinetic data to the Elovich model (R2 < 0.950) suggests that the adsorbent surface is heterogeneous and has different activation energies [42].
According to the k i values obtained with the IPD model for the three linear zones, the first zone (t < 4 min) associated with the adsorption on the external surface of the clay (film diffusion) is the step that controls the adsorption of caffeine on Na–Bent–400, followed by intraparticle diffusion.
Figure 12b shows the model of IPD fitted to the obtained data for the initial concentrations of 10, 22, and 30 mg/L, where three linear zones can be observed. The existence of three zones suggests that adsorption occurs in different steps and that intraparticle diffusion is present [63,64,65]. The adsorption capacity of the first linear zone (t < 4 min) increases rapidly due to instantaneous or external surface adsorption driven by film diffusion. In the second zone (4 min < t < 26 min), gradual adsorption occurs, where intraparticle diffusion is the limiting step for the decrease in adsorption. In the third stage (28 min < t < 120 min), equilibrium is reached as intraparticle diffusion slows due to the reduction of the caffeine concentration gradient between the solution and bentonite surface.
Several adsorption mechanisms, including π–π, dipole–dipole, hydrogen bonding, nucleophilic interaction, and electrostatic interactions, have been suggested in removing caffeine from various adsorbents [29,66,67]. Although partial ionization of caffeine to cation and anion forms may occur, electrochemical studies have found that the neutral form of caffeine was predominant in the pH range of 5.5 to 9.0 [68]. After the caffeine adsorption on Na–Bent–400, an XRD analysis was performed on the adsorbent. No changes were observed in the d001 reflection of the material suggesting that caffeine was not adsorbed in the interlayer space of the clay, unlike what has been established for unmodified montmorillonite where a broadening of this reflection has been detected [69]. The adsorption of caffeine most likely occurs on the Na–Bent–400 surface, specifically on the faces and edges of the clay layer, by the formation of H–bonds between the hydrogen bond acceptors of the caffeine molecule and the silanol and aluminol groups of the adsorbent (Figure 13). Yamamoto et al. (2019) studied the interaction of caffeine with montmorillonite and found that more than 80% of the S i O H groups of the clay were involved in caffeine adsorption. Furthermore, it was suggested that the N atom of the imidazole ring interacted with the Si–OH of montmorillonite and the O atoms of siloxane [20].

4. Conclusions

The heat treatment of bentonite affects the physicochemical properties of the clay. Increasing the bentonite treatment temperature initially leads to dehydration and partial dehydroxylation of the clay, which is reflected in decreased basal spacing and specific surface area.
Sodium bentonite treated at 400 °C was an efficient adsorbent for caffeine removal. The effect of the amount of adsorbent (Na–Bent–400) and the initial concentration of caffeine on the adsorption of this compound was optimized using the response surface methodology. The error between the predicted and experimental results for caffeine removal is less than 4.6%, showing that the testing results agree with those predicted from the second-order polynomial equation. The maximum caffeine removal (96.54%) was achieved with an adsorbent mass of 111.8 mg for a caffeine concentration of 21.8 mg/L. Under equilibrium conditions (initial pH = 8.0, stirring speed = 400 rpm, contact time = 120 min), the maximum adsorption capacity of caffeine obtained with the Langmuir model was 80.3 ± 2.1 mg/g at 25 °C.
The existence of three zones in the intraparticle diffusion (IPD) model indicates that adsorption occurs in different steps: the diffusion of caffeine on the external surface of the Na–Bent–400, intraparticle diffusion, and an equilibrium stage. According to the k i values obtained in each stage for the three concentrations studied, in the first zone (t < 4 min) the caffeine adsorption capacity increases rapidly due to instantaneous or external surface adsorption driven by film diffusion, and this is the step that controls adsorption, followed by intraparticle diffusion.
The Na–Bent–400 adsorbent can be easily regenerated and reused for three cycles of caffeine adsorption. Bentonite heat-treated at 400 °C is a potential adsorbent for the removal of caffeine in an aqueous solution, and adsorption can occur by the formation of H-bonding between the adsorbate and the silanol (≡Si–OH) and aluminol ((≡Al–OH)) groups formed by partial dehydroxylation of the clay.

Author Contributions

Conceptualization, J.A.Q.-J., J.I.C. and N.R.S.-G.; methodology, J.A.Q.-J., J.I.C. and N.R.S.-G.; validation, J.A.Q.-J., J.I.C. and N.R.S.-G.; formal analysis, J.A.Q.-J., J.I.C. and N.R.S.-G.; investigation, J.A.Q.-J. and N.R.S.-G.; writing—original draft preparation, J.A.Q.-J., J.I.C. and N.R.S.-G.; writing—review and editing, N.R.S.-G.; project administration, N.R.S.-G. All authors have read and agreed to the published version of the manuscript.

Funding

This research was funded by Universidad Nacional de Colombia Sede Manizales (Hermes project code 50752) and Colciencias, grant number Convocation 785-2017.

Data Availability Statement

The data supporting this study’s findings are included within the article (Tables and Figures) and available from the corresponding author upon reasonable request.

Acknowledgments

The authors thank the “Laboratorio de Fisicoquímica Avanzada” of the Universidad Nacional de Colombia Sede Manizales for the experimental support for this research and Ministerio de Ciencia, Tecnología e Innovación through the announcement 785 of 2017 National Doctorates.

Conflicts of Interest

The authors declare no conflict of interest.

References

  1. Naidu, R.; Jit, J.; Kennedy, B.; Arias, V. Emerging contaminant uncertainties and policy: The chicken or the egg conundrum. Chemosphere 2016, 154, 385–390. [Google Scholar] [CrossRef]
  2. Álvarez, S.; Rodríguez, A.; Ovejero, G.; Gómez, J.M.; García, J. Removal of caffeine from pharmaceutical wastewater by adsorption: Influence of NOM, textural and chemical properties of the adsorbent. Environ. Technol. 2016, 37, 1618–1630. [Google Scholar] [CrossRef] [PubMed]
  3. Yargeau, V.; Lopata, A.; Metcalfe, C. Pharmaceuticals in the Yamaska River, Quebec, Canada. Water Qual. Res. J. Can. 2007, 42, 231–239. [Google Scholar] [CrossRef]
  4. Buerge, I.J.; Poiger, T.; Muller, M.; Buser, H.R. Caffeine, an anthropogenic marker for wastewater contamination of surface waters. Environ. Sci. Technol. 2003, 37, 691–700. [Google Scholar] [CrossRef] [PubMed]
  5. Rigueto, C.; Nazari, M.; De Souza, C.; Cadore, J.; Brião, V.; Piccin, J. Alternative techniques for caffeine removal from wastewater: An overview of opportunities and challenges. J. Water Process Eng. 2020, 35, 101231. [Google Scholar] [CrossRef]
  6. Lin, T.; Yu, S.; Chen, W. Occurrence, removal and risk assessment of pharmaceutical and personal care products (PPCPs) in an advanced drinking water treatment plant (ADWTP) around Taihu Lake in China. Chemosphere 2016, 152, 1–9. [Google Scholar] [CrossRef] [PubMed]
  7. Mena, E.; Rey, A.; Beltrán, F.J. TiO2 photocatalytic oxidation of a mixture of emerging contaminants: A kinetic study independent of radiation absorption based on the direct-indirect model. Chem. Eng. J. 2018, 339, 369–380. [Google Scholar] [CrossRef]
  8. Li, L.; Gong, L.; Wang, Y.X.; Liu, Q.; Zhang, J.; Mu, Y.; Yu, H.Q. Removal of halogenated emerging contaminants from water by nitrogen-doped graphene decorated with palladium nanoparticles: Experimental investigation and theoretical analysis. Water Res. 2016, 98, 235–241. [Google Scholar] [CrossRef] [PubMed]
  9. Dordio, A.; Miranda, S.; Ramalho, J.P.; Carvalho, A.P. Mechanisms of removal of three widespread pharmaceuticals by two clay materials. J. Hazard. Mater. 2017, 323, 575–583. [Google Scholar] [CrossRef]
  10. Marcal, L.; de Faria, E.H.; Nassar, E.J.; Trujillano, R.; Martin, N.; Vicente, M.A.; Rives, V.; Gil, A.; Korili, S.A.; Ciuffi, K.J. Organically modified saponites: SAXS study of swelling and application in caffeine removal. ACS Appl. Mater. Interfaces 2015, 7, 10853–10862. [Google Scholar] [CrossRef]
  11. Quintero-Jaramillo, J.A.; Carrero-Mantilla, J.I.; Sanabria-González, N.R. A review of caffeine adsorption studies onto various types of adsorbents. Sci. World J. 2021, 2021, 9998924. [Google Scholar] [CrossRef] [PubMed]
  12. Bergaya, F.; Lagaly, G. General Introduction: Clays, Clay Minerals, and Clay Science. In Developments in Clay Science. Handbokk of Clay Science; Bergaya, F., Theng, B.K.G., Lagaly, G., Eds.; Elsevier: Amsterdam, The Netherlands, 2006; Volume 1, pp. 1–18, Chapter 1. [Google Scholar]
  13. Odom, I.E. Smectite clay minerals: Properties and uses. Phil. Trans. R. Soc. Land. A 1984, 311, 391–409. [Google Scholar]
  14. Murray, H.H. Bentonite Applications. In Developments in Clay Science. Applied Clay Mineralogy; Murray, H.H., Ed.; Elsevier: Amsterdam, The Netherlands, 2006; Volume 2, pp. 111–130, Chapter 6. [Google Scholar]
  15. Ewis, D.; Ba-Abbad, M.M.; Benamor, A.; El-Naas, M.H. Adsorption of organic water pollutants by clays and clay minerals composites: A comprehensive review. Appl. Clay Sci. 2022, 229, 106686. [Google Scholar] [CrossRef]
  16. França, D.B.; Oliveira, L.S.; Filho, F.G.N.; Filho, E.C.S.; Osajima, J.A.; Jaber, M.; Fonseca, M.G. The versatility of montmorillonite in water remediation using adsorption: Current studies and challenges in drug removal. J. Environ. Chem. Eng. 2022, 10, 107341. [Google Scholar] [CrossRef]
  17. My Linh, N.L.; Hoang Van, D.; Duong, T.; Tinh, M.X.; Quang Khieu, D. Adsorption of arsenate from aqueous solution onto modified Vietnamese bentonite. Adv. Mater. Sci. Eng. 2019, 2019, 2710926. [Google Scholar] [CrossRef]
  18. Fernandes, J.V.; Rodrigues, A.M.; Menezes, R.R.; Neves, G.d.A. Adsorption of anionic dye on the acid-functionalized bentonite. Materials 2020, 13, 3600. [Google Scholar] [CrossRef] [PubMed]
  19. Leng, Y.; Li, Q.; Tian, Q.; Chen, X.; Almásy, L.; Liu, Y.; Sun, G.; Tuo, X.; Yan, M.; Henderson, M.J. (Ce-Al)-oxide pillared bentonite: A high affinity sorbent for plutonium. J. Hazard. Mater. 2018, 352, 121–129. [Google Scholar] [CrossRef] [PubMed]
  20. Yamamoto, K.; Shiono, T.; Matsui, Y.; Yoneda, M. Interaction of caffeine with montmorillonite. Part. Sci. Technol. 2019, 37, 325–332. [Google Scholar] [CrossRef]
  21. Yamamoto, K.; Shiono, T.; Matsui, Y.; Yoneda, M. Changes the structure and caffeine adsorption property of calcined montmorillonite. Int. J. Geomate. 2016, 11, 2301–2306. [Google Scholar] [CrossRef]
  22. Yamamoto, K.; Shiono, T.; Yoshimura, R.; Matsui, Y.; Yoneda, M. Influence of hydrophilicity on adsorption of caffeine onto montmorillonite. Adsorpt. Sci. Technol. 2018, 36, 967–981. [Google Scholar] [CrossRef]
  23. Pradas, E.G.; Sánchez, M.V.; Cruz, F.C.; Viciana, M.S.; Pérez, M.F. Adsorption of cadmium and zinc from aqueous solution on natural and activated bentonite. J. Chem. Tech. Biotechnol. 1994, 59, 289–295. [Google Scholar] [CrossRef]
  24. Padilla, E.; Medellín, N.; Robledo, A. Comparative study of the effect of structural arrangement of clays in the thermal activation: Evaluation of their adsorption capacity to remove Cd(II). J. Environ. Chem. Eng. 2020, 8, 103850. [Google Scholar] [CrossRef]
  25. Iamsaard, K.; Weng, C.-H.; Tzeng, J.-H.; Anotai, J.; Jacobson, A.R.; Lin, Y.-T. Systematic optimization of biochars derived from corn wastes, pineapple leaf, and sugarcane bagasse for Cu(II) adsorption through response surface methodology. Bioresour. Technol. 2023, 382, 129131. [Google Scholar] [CrossRef] [PubMed]
  26. Ni’mah, Y.L.; Subandi, A.P.K.; Suprapto, S. The application of silica gel synthesized from chemical bottle waste for zinc (II) adsorption using Response Surface Methodology (RSM). Heliyon 2022, 8, e11997. [Google Scholar] [CrossRef] [PubMed]
  27. Homem, V.; Alves, A.; Santos, L. Amoxicillin degradation at ppb levels by Fenton’s oxidation using design of experiments. Sci. Total Environ. 2010, 408, 6272–6280. [Google Scholar] [CrossRef] [PubMed]
  28. Macias-Quiroga, I.F.; Giraldo-Gómez, G.I.; Sanabria-González, N.R. Characterization of colombian clay and its potential use as adsorbent. Sci. World J. 2018, 2018, 5969178. [Google Scholar] [CrossRef] [PubMed]
  29. Januário, E.F.D.; Vidovix, T.B.; Ribeiro, A.C.; da Costa Neves Fernandes de Almeida Duarte, E.; Bergamasco, R.; Vieira, A.M.S. Evaluation of hydrochar from peach stones for caffeine removal from aqueous medium and treatment of a synthetic mixture. Environ. Technol. 2022, 45, 1141–1154. [Google Scholar] [CrossRef] [PubMed]
  30. Couto, O.M., Jr.; Matos, I.; da Fonseca, I.M.; Arroyo, P.A.; da Silva, E.A.; de Barros, M.A.S.D. Effect of solution pH and influence of water hardness on caffeine adsorption onto activated carbons. Can. J. Chem. Eng. 2015, 93, 68–77. [Google Scholar] [CrossRef]
  31. Álvarez, A.; Moreno, S.; Molina, R.; Ivanova, S.; Centeno, M.A.; Odriozola, J.A. Gold supported on pillared clays for CO oxidation reaction: Effect of the clay aggregate size. Appl. Clay Sci. 2012, 69, 22–29. [Google Scholar] [CrossRef]
  32. Önal, M.; Sarıkaya, Y. Thermal behavior of a bentonite. J. Therm. Anal. Calorim. 2007, 90, 167–172. [Google Scholar] [CrossRef]
  33. Damonte, M.; Sánchez, R.; dos Santos Afonso, M. Some aspects of the glyphosate adsorption on montmorillonite and its calcined form. Appl. Clay. Sci. 2007, 36, 86–94. [Google Scholar] [CrossRef]
  34. Gil, A.; Korili, S.; Vicente, M. Recent advances in the control and characterization of the porous structure of pillared clay catalysts. Catal. Rev. Sci. Eng. 2008, 50, 153–221. [Google Scholar] [CrossRef]
  35. Leofanti, G.; Padovan, M.; Tozzola, G.; Venturelli, B. Surface area and pore texture of catalysts. Catal. Today 1998, 41, 207–219. [Google Scholar] [CrossRef]
  36. Guechi, E.-K.; Hamdaoui, O. Biosorption of methylene blue from aqueous solution by potato (Solanum tuberosum) peel: Equilibrium modelling, kinetic, and thermodynamic studies. Desalin. Water Treat. 2016, 57, 10270–10285. [Google Scholar] [CrossRef]
  37. Balistrieri, L.; Murray, J.W. The surface chemistry of goethite (αFeOOH) in major ion seawater. Am. J. Sci. 1981, 281, 788–806. [Google Scholar] [CrossRef]
  38. Langmuir, I. The constitution and fundamental properties of solids and liquids. Part I. Solids. J. Am. Chem. Soc. 1916, 38, 2221–2295. [Google Scholar] [CrossRef]
  39. Freundlich, H.M.F. Over the adsorption in solution. J. Phys. Chem. 1906, 57, 385–471. [Google Scholar]
  40. Foo, K.Y.; Hameed, B.H. Insights into the modeling of adsorption isotherm systems. Chem. Eng. J. 2010, 156, 2–10. [Google Scholar] [CrossRef]
  41. Redlich, O.; Peterson, D.L. A useful adsorption isotherm. J. Phys. Chem. 1959, 63, 1024. [Google Scholar] [CrossRef]
  42. Tan, K.L.; Hameed, B.H. Insight into the adsorption kinetics models for the removal of contaminants from aqueous solutions. J. Taiwan Inst. Chem. E. 2017, 74, 25–48. [Google Scholar] [CrossRef]
  43. Sivrikaya, O.; Uzal, B.; Ozturk, Y. Practical charts to identify the predominant clay mineral based on oxide composition of clayey soils. Appl. Clay Sci. 2017, 135, 532–537. [Google Scholar] [CrossRef]
  44. Vieira, M.; Neto, A.A.; Gimenes, M.; Da Silva, M. Sorption kinetics and equilibrium for the removal of nickel ions from aqueous phase on calcined Bofe bentonite clay. J. Hazard. Mater. 2010, 177, 362–371. [Google Scholar] [CrossRef] [PubMed]
  45. Andrini, L.; Toja, R.M.; Gauna, M.R.; Conconi, M.S.; Requejo, F.G.; Rendtorff, N. Extended and local structural characterization of a natural and 800 C fired Na-montmorillonite–Patagonian bentonite by XRD and Al/Si XANES. Appl. Clay Sci. 2017, 137, 233–240. [Google Scholar] [CrossRef]
  46. Noyan, H.; Önal, M.; Sarikaya, Y. The effect of heating on the surface area, porosity and surface acidity of a bentonite. Clay Miner. 2006, 54, 375–381. [Google Scholar] [CrossRef]
  47. Patel, H.A.; Somani, R.S.; Bajaj, H.C.; Jasra, R.V.J. Nanoclays for polymer nanocomposites, paints, inks, greases and cosmetics formulations, drug delivery vehicle and waste water treatment. Bull. Mater. Sci. 2006, 29, 133–145. [Google Scholar] [CrossRef]
  48. Russell, J.D.; Fraser, A.R. Infrared Methods. In Clay Mineralogy: Spectroscopic and Chemical Determinative Methods; Wilson, M.J., Ed.; Springer Dordrecht: London, UK, 1995; Volume 30, pp. 11–67. [Google Scholar]
  49. Fil, B.A.; Özmetin, C.; Korkmaz, M. Characterization and electrokinetic properties of montmorillonite. Bulg. Chem. Commun. 2014, 46, 258–263. [Google Scholar]
  50. Heller-Kallai, L. Chapter 7.2 Thermally Modidied Clay Minerals. In Developments in Clay Science; Bergaya, F., Theng, B.K.G., Lagaly, G., Eds.; Elsevier: Amsterdam, The Netherlands, 2006; Volume 1, pp. 289–308. [Google Scholar]
  51. Thommes, M.; Kaneko, K.; Neimark, A.V.; Olivier, J.P.; Rodriguez-Reinoso, F.; Rouquerol, J.; Sing, K.S. Physisorption of gases, with special reference to the evaluation of surface area and pore size distribution (IUPAC Technical Report). Pure Appl. Chem. 2015, 87, 1051–1069. [Google Scholar] [CrossRef]
  52. Orolínová, Z.; Mockovčiaková, A.; Dolinská, S.; Briančin, J. Effect of thermal treatment on the bentonite properties. Arh. Teh. Nauke. 2012, 7, 49–56. [Google Scholar] [CrossRef]
  53. Karimifard, S.; Alavi Moghaddam, M. Application of response surface methodology in physicochemical removal of dyes from wastewater: A critical review. Sci. Total Environ. 2018, 640-641, 772–797. [Google Scholar] [CrossRef] [PubMed]
  54. Veza, I.; Spraggon, M.; Fattah, I.M.R.; Idris, M. Response surface methodology (RSM) for optimizing engine performance and emissions fueled with biofuel: Review of RSM for sustainability energy transition. Results Eng. 2023, 18, 101213. [Google Scholar] [CrossRef]
  55. Limousin, G.; Gaudet, J.-P.; Charlet, L.; Szenknect, S.; Barthes, V.; Krimissa, M. Sorption isotherms: A review on physical bases, modeling and measurement. J. Appl. Geochem. 2007, 22, 249–275. [Google Scholar] [CrossRef]
  56. Al-Ghouti, M.A.; Da’ana, D.A. Guidelines for the use and interpretation of adsorption isotherm models: A review. J. Hazard. Mater. 2020, 393, 122383. [Google Scholar] [CrossRef] [PubMed]
  57. Galhetas, M.; Mestre, A.S.; Pinto, M.L.; Gulyurtlu, I.; Lopes, H.; Carvalho, A.P. Chars from gasification of coal and pine activated with K2CO3: Acetaminophen and caffeine adsorption from aqueous solutions. J. Colloid. Interface Sci. 2014, 433, 94–103. [Google Scholar] [CrossRef] [PubMed]
  58. Luján, M.J.; Iborra, M.I.; Mendoza, J.A.; Alcaina, M.I. Pharmaceutical compounds removal by adsorption with commercial and reused carbon coming from a drinking water treatment plant. J. Clean. Prod. 2019, 238, 117866. [Google Scholar] [CrossRef]
  59. Portinho, R.; Zanella, O.; Féris, L. Grape stalk application for caffeine removal through adsorption. J. Environ. Manage. 2017, 202, 178–187. [Google Scholar] [CrossRef] [PubMed]
  60. Rafatullah, M.; Sulaiman, O.; Hashim, R.; Ahmad, A. Adsorption of methylene blue on low-cost adsorbents: A review. J. Hazard. Mater. 2010, 177, 70–80. [Google Scholar] [CrossRef] [PubMed]
  61. Oliveira, M.; Da Silva, M.; Vieira, M. Equilibrium and kinetic studies of caffeine adsorption from aqueous solutions on thermally modified verde-lodo bentonite. Appl. Clay Sci. 2019, 168, 366–373. [Google Scholar] [CrossRef]
  62. Simonin, J.-P. On the comparison of pseudo-first order and pseudo-second order rate laws in the modeling of adsorption kinetics. Chem. Eng. J. 2016, 300, 254–263. [Google Scholar] [CrossRef]
  63. do Nascimento, D.C.; da Silva, M.G.C.; Vieira, M.G.A. Adsorption of propranolol hydrochloride from aqueous solutions onto thermally treated bentonite clay: A complete batch system evaluation. J. Mol. Liq. 2021, 337, 116442. [Google Scholar] [CrossRef]
  64. El-Khaiary, M.I.; Malash, G.F. Common data analysis errors in batch adsorption studies. Hydrometallurgy 2011, 105, 314–320. [Google Scholar] [CrossRef]
  65. Tran, H.N.; You, S.-J.; Hosseini-Bandegharaei, A.; Chao, H.-P. Mistakes and inconsistencies regarding adsorption of contaminants from aqueous solutions: A critical review. Water Res. 2017, 120, 88–116. [Google Scholar] [CrossRef] [PubMed]
  66. Keerthanan, S.; Bhatnagar, A.; Mahatantila, K.; Jayasinghe, C.; Ok, Y.S.; Vithanage, M. Engineered tea-waste biochar for the removal of caffeine, a model compound in pharmaceuticals and personal care products (PPCPs), from aqueous media. Environ. Technol. Innov. 2020, 19, 100847. [Google Scholar] [CrossRef]
  67. Bachmann, S.A.L.; Calvete, T.; Féris, L.A. Caffeine removal from aqueous media by adsorption: An overview of adsorbents evolution and the kinetic, equilibrium and thermodynamic studies. Sci. Total. Environ. 2021, 767, 144229. [Google Scholar] [CrossRef] [PubMed]
  68. Švorc, Ľ. Determination of caffeine: A comprehensive review on electrochemical methods. Int. J. Electrochem. Sci. 2013, 8, 5755–5773. [Google Scholar] [CrossRef]
  69. Sakuma, H.; Tamura, K.; Hashi, K.; Kamon, M. Caffeine adsorption on natural and synthetic smectite clays: Adsorption mechanism and effect of interlayer cation valence. J. Phys. Chem. C 2020, 124, 25369–25381. [Google Scholar] [CrossRef]
Figure 1. Chemical structure and properties of caffeine [29,30].
Colloids 08 00026 g001
Figure 2. XRD patterns of sodium bentonite subjected to thermal treatment. Mt = Montmorillonite, Q = Quarz, Mt* = Meta-montmorillonite.
Colloids 08 00026 g002
Figure 3. FT–IR spectra for sodium bentonite subjected to thermal treatment.
Colloids 08 00026 g003
Figure 4. Thermal analysis for sodium bentonite. (a) TGA–DTG and (b) DSC.
Colloids 08 00026 g004
Figure 5. N2 adsorption–desorption isotherms for sodium bentonite subjected to thermal treatment.
Colloids 08 00026 g005
Figure 6. Effect of contact time on caffeine removal using sodium bentonite subjected to thermal treatment. Conditions: C 0 = 20 mg/L, initial pH = 7.0, stirring speed = 400 rpm and mads = 100 mg.
Colloids 08 00026 g006
Figure 7. Effect of initial pH on caffeine removal using sodium bentonite subjected to thermal treatment. Conditions: C 0 = 20 mg/L, stirring speed = 400 rpm, contact time = 120 min, and mads = 100 mg.
Colloids 08 00026 g007
Figure 8. Effect of stirring speed on caffeine removal using Na–Bent–400. Conditions: C 0 = 20 mg/L, initial pH = 8.0, contact time = 120 min, and mads = 100 mg.
Colloids 08 00026 g008
Figure 9. 3D surface and 2D contour plots for the removal of caffeine on Na–Bent–400.
Colloids 08 00026 g009
Figure 10. Experimental isotherm (symbols) and models fit (dashed lines) for the equilibrium adsorption of caffeine on Na–Bent–400 at 25 °C.
Colloids 08 00026 g010
Figure 11. Adsorbent reuse results. Conditions: C 0 = 20 mg/L, adsorption/desorption pH = 8.0/12.0, and stirring speed = 400 rpm.
Colloids 08 00026 g011
Figure 12. Caffeine adsorption kinetic at 25 °C. (a) PFO (pseudo-first-order), PSO (pseudo-second-order), and Elovich models, (b) Three-region data fit with the IPD (intraparticle diffusion) model. Conditions: pH = 8.0 and stirring speed = 400 rpm.
Colloids 08 00026 g012
Figure 13. Proposed mechanism for caffeine adsorption on Na–Bent–400.
Colloids 08 00026 g013
Table 1. Experimental conditions for caffeine adsorption—preliminary tests.
Contact Time
(min)
pHThermal Treatment
(°C)
Stirring Speed
(rpm)
2–1207.060–500400
t selected 4.0–10.060–500400
t selectedpH selectedT selected400
t selectedpH selectedT selected60–800
t selectedpH selectedT selectedStirring speed selected
Table 2. Experimental range and levels of the variables studied in the experimental design.
VariablesCoded and Non-Coded Levels
−α
−1.1892
−10+1
+1.1892
Adsorbent mass (mg), X120.53080130139.5
Initial caffeine concentration (mg/L), X28.110203031.9
Terms CCD
Replicas axial points2
Replicas central points2
Total tests14
Table 3. Kinetic adsorption models [42].
ModelEquationUnits
PFO q ( t ) = q e ( 1 e k 1 t ) k 1 (1/min)
q e (mg/g)
PSO q ( t ) = q e [ ( k 2 q e t ) / ( 1 + k 2 q e t ) ] k 2 (g/mg min)
q e (mg/g)
Elovich q ( t ) = ( 1 / β ) ln ( 1 + α β t ) β (g/mg)
α (mg/g min)
IPD q ( t ) = k i t + I k i (mg/g min0.5)
I (mg/g)
Table 4. Chemical composition of raw clay and purified bentonite.
Oxide (wt.%)Raw ClayNa–Bent–60Na–Bent–400Montmorillonite *
SiO262.0961.1361.9848.24–65.07
Al2O317.7317.2317.8914.73–24.54
Fe2O39.578.938.980.07–6.87
CaO3.671.801.990.06–3.74
MgO2.992.442.481.64–7.38
K2O1.781.691.850.03–3.33
Na2O0.252.352.340.00–3.87
MnO0.190.210.230.93–2.15
* Range of 40 montmorillonite samples [43].
Table 5. Textural parameters and pHPZC for sodium bentonite subjected to thermal treatment.
SampleSBET
m2/g
SExt
m2/g
Sμp
m2/g
Vμp
cm3/g
V0.99
cm3/g
pHPZC
Na–Bent–6083.152.630.50.01210.01017.6
Na–Bent–20077.848.329.50.01110.09678.3
Na–Bent–30073.646.127.50.01060.09678.7
Na–Bent–40066.740.426.30.00930.08868.8
Na–Bent–50057.131.126.00.00710.06508.9
Table 6. Coded and experimental values for the runs performed and the results obtained for the adsorption of caffeine on Na–Bent–400.
RunValuesResult
CodedExperimentalRemoval (%)
X1X2X1X2Y
1−α020.520.079.99
20080.020.094.79
3+1−1130.010.095.10
4080.031.994.38
5080.031.994.12
6−1−130.010.082.98
7−α020.520.080.60
80−α80.08.189.29
90−α80.08.191.70
100139.520.095.20
11+1+1130.030.095.28
12−1+130.030.084.30
130080.020.094.79
140139.520.095.20
Table 7. Results of regression analysis for the adsorption of caffeine on Na–Bent–400.
SourceSum of Squaresdf aMean SquareF-Valuep-Value
Model449.45589.8971.66<0.0001 b
X1354.991354.99283.02<0.0001 b
X211.27111.278.980.0171 b
X1×20.3210.320.260.6245 c
X1276.66176.6661.11<0.0001 b
X224.8614.863.870.0846 c
Residual10.0381.25
Lack of fit6.9132.303.690.0971 b
Pure Error459.4850.62
R20.9782
Adjusted R20.9645
a degree of freedom, b significant at 95% confidence interval, c non-significant at 95% confidence interval.
Table 8. Caffeine adsorption model validation on Na–Bent–400.
mads
mg
C 0
mg/L
Removal (%)Error
%
ExperimentalPredicted
80.015.091.6493.511.87
100.020.093.4896.050.42
111.821.894.7796.541.77
120.025.091.9796.534.56
Table 9. Parameters for the adsorption isotherm models for caffeine removal on Na–Bent–400.
ModelEquationParameters
Langmuir q e = q m a x K L C e 1 + K L C e K L = 0.069 ± 0.005 L/mg
q m a x = 80.331 ± 2.110 mg/g
R2 = 0.991
Freundlich q e = K F C e 1 / n K F = 10.469 ± 1.780 (mg/g) (L/mg)1/n
n = 2.299 ± 0.234
R2 = 0.912
Redlich–Peterson q e = K R P C e 1 + α R P C e β R P K R P = 4.356 ± 0.104 L/g
α R P = 0.018 ± 0.002 (L/mg)βRP
β R P = 1.241 ± 0.023
R2 = 0.999
Table 10. Parameters for the adsorption kinetic models for caffeine removal on Na–Bent–400.
ModelParameters C 0 ( m g / L )
102230
PFO k 1 (1/min)4.01 ± 0.560.92 ± 0.11.08 ± 0.07
q e (mg/g)3.68 ± 0.048.13 ± 0.1211.59 ± 0.10
R20.8510.8350.925
PSO k 2 (g/mg min)1.86 ± 0.220.18 ± 0.020.16 ± 0.01
q e (mg/g)3.76 ± 0.028.49 ± 0.0811.97 ± 0.06
R20.9420.9380.982
Elovich α × 10 5 (mg/g min)4.13 × 10⁶ ± 1.83 × 106486.54 ± 150.182271.94 ± 1256.11
β (g/mg) 5.33 ± 0.131.16 ± 0.040.93 ± 0.06
R20.9950.9640.928
IPD
Linear zone 1
k i (mg/g min−0.5)
I (mg/g)
R2
0.68 ± 0.032.27 ± 0.104.30 ± 0.40
2.45 ± 0.313.81 ± 0.103.41 ± 0.42
0.9910.9910.958
IPD
Linear zone 2
0.17 ± 0.010.47 ± 0.080.43 ± 0.03
3.23 ± 0.016.53 ± 0.249.74 ± 0.11
0.9910.8880.957
IPD
Linear zone 3
0.03 ± 0.010.071 ± 0,010.05 ± 0.01
3.69 ± 0.018.15 ± 0.0811.64 ± 0.04
0.9650.7050.997
Disclaimer/Publisher’s Note: The statements, opinions and data contained in all publications are solely those of the individual author(s) and contributor(s) and not of MDPI and/or the editor(s). MDPI and/or the editor(s) disclaim responsibility for any injury to people or property resulting from any ideas, methods, instructions or products referred to in the content.

