Abstract
Aging-related processes lead to significant metabolic and structural changes in red blood cells (RBCs) and, as a result, to heterogeneity in cell populations. Using the Percoll linear density gradient, separating the RBC population and obtaining fractions enriched with cells of different ages is possible. Previously, cells from the “light” fraction were characterized by increased deformability. However, the distribution of RBC deformability in subpopulations possessing a different density has not been studied. In this study, we measured the deformability of RBCs from cell fractions characterized by different densities. RBC deformability was determined using a computerized cell flow-properties analyzer, which provides the deformability distribution in a population of 10,000–15,000 cells. Our results demonstrate a strong correlation between the cytosol hemoglobin concentration and the cell deformation indexes. In addition, we show that the “lightest” fraction of RBCs contains the lowest number of deformable and the highest number of highly deformable cells. In contrast, the “dense” fraction is enriched with undeformable RBCs, with a minimal presence of highly deformable cells. In summary, we have shown that RBC fractions depleted or enriched with undeformable cells can be obtained by using a density gradient. However, these fractions are not homogeneous in their deformability properties.
1. Introduction
Blood behaves like a non-Newtonian fluid, and the reason for this is the unique mechanical behavior of red blood cells (RBCs), which are capable of both aggregation and deformation. RBCs are a functional element of the blood, which delivers oxygen and nutrients to the tissues while removing metabolic waste products. It is well known that RBCs survive in the bloodstream for a reasonably precise time interval with a slight accidental loss of up to 110 days [1]. In practice, an individual RBC lifespan varies considerably. In a healthy person with an average RBC lifespan of 115 days, this value can vary from 70 to 140 days [2,3]. Thus, Cohen et al. [2] demonstrated that the mean age of circulating RBCs ranged from 38 to 60 days in healthy subjects.
Over time, significant changes occur in RBC properties [4]. Aging-related processes (that are at least partially due to the exposure of cells to oxidative stress [5,6,7]) lead to significant metabolic and structural changes and involve global biochemical and biophysical alterations, remodeling of the cell membrane, and cytoplasm composition [4,8]. The most visible changes are the decrease in cell volume (MCV) and the elevation of intracellular hemoglobin concentration (MCHC), which ultimately lead to an increase in cell density [9]. Both of these indicators are interrelated, and a decrease in cell volume (caused by cell aging) correlates with an increase in the cytosolic concentration of hemoglobin.
Consequently, the overall RBC population includes cells of various densities. This allows cells to be separated according to their density (and, hence, according to their age) by a relatively simple technique [8,10,11]. One of the classic ways to study the effect of RBCs’ age on their properties is to separate them into fractions using a Percoll gradient [12]. In most cases, the native cell population is divided into three subpopulations (“light,” “medium,” and “dense”) that are enriched in young, mature, and senescent cells, respectively. Several research groups have shown that dividing the initial population of red blood cells (based on their density) produces subpopulations characterized by different levels of biophysical and biochemical features [12,13,14] and hematological indexes [15].
A cell’s ability to deform is essential for its normal movement in the vasculature, especially in microcirculation. In particular, adequate deformability is essential for RBC passage through the capillaries and splenic slits, which are narrower than the red cell, as is well documented in previous studies in vivo [16,17,18,19,20], ex vivo [21] and in vitro [22,23,24,25], and shown by studies using numerical methods [26,27,28]. Specifically, it was shown (by ex vivo perfusion of a human spleen) that splenic clearance correlated positively with increased membrane rigidity [29] and that RBC stiffness can serve as an indicator for macrophages to initiate phagocytosis leading to RBC clearance [30,31]. Furthermore, the deformation of erythrocytes causes the entry of antiadhesive and vasoactive mediators (SNO and ATP) into the bloodstream, which leads to the optimization of blood flow following physiological needs [32,33].
Typically, RBCs are sufficiently deformable, but many pathological conditions are associated with reduced deformability (increased rigidity) [32,34,35,36,37,38]. Nevertheless, the cause-and-effect relationship in these pathologies has only sometimes been clarified. The direct role of impaired RBC deformability in the induction of circulatory disorders and related pathologies has been demonstrated in studies with animal models and humans, showing that low-deformable RBCs impair perfusion and oxygen delivery in peripheral tissues [39,40]. The perfusion of rat mesorectum (ex vivo) with RBCs with impaired deformability markedly increased vascular resistance [41]. Rigid, undeformable RBCs can directly block capillaries [42]. RBCs with low deformability may adversely affect the recruitment of capillaries that are required for adequate oxygen delivery to the tissues [40]. The passage of relatively rigid RBCs, such as aged RBCs, hinders the spleen vasculature, leading to increased splenic RBC sequestration and destruction [29,43,44,45,46,47,48,49].
In general, reducing the deformability of RBCs has a double effect. First, increased RBC stiffness impairs the ability of RBCs to flow through microvessels and capillaries. Second, a decrease in the deformability of red blood cells limits the release of mediators necessary for vaso-regulation [32]. As a result of these two reasons, in several publications, the authors propose to use the deformability of RBCs as a marker to predict the development of several pathologies [22,35,50,51,52,53] and to monitor their severity [54,55].
Without pathological changes, RBCs require a high level of deformability for normal blood circulation. However, during the aging process or under the influence of oxidative or mechanical stress (or other external factors), a change in the state of the cell membrane and cytosol of the cell occurs; in particular, this process is expressed as an increase in membrane rigidity and cytosol viscosity, as well as a change in cell shape [56,57,58]. Bosch et al. [15] demonstrated a decrease in the deformability of RBCs that occurs during their aging process. The authors associate the observed disturbance in the deformability of old erythrocytes with an increase in the MCHC and a decrease in membrane elasticity.
Considering the above, it can be assumed that dividing the RBC population by density should lead to cell subpopulations with different deformability. Indeed, several authors have found that the deformability of cells in the “light” fraction (enriched with young cells) is much higher than in the “dense” fraction (enriched with old cells) [13,15,59]. However, in previous studies [13,15,59], cell deformability was characterized by average values describing the state of the entire subpopulation. In contrast, the deformability distribution among individual cells was not characterized. The presented study compares the distribution of RBC deformability within the three cell subpopulations (“light”, “medium”, and “dense”). We characterized each “dense” fraction of RBCs not only by the median values of the cell elongation ratio but also by the distribution of this parameter. We showed that this distribution depends on the concentration of intracellular hemoglobin in the cell (cell density). In addition, for the first time, we demonstrated that the obtained fractions of RBCs remain heterogeneous in deformability, all containing both undeformable and high-deformable cells.
2. Materials and Methods
2.1. Blood Collection
Similar to a previous study [60,61], blood samples were collected from young, nonsmoker, healthy male volunteers (18–25 years) with blood type O+ to obtain a homogeneous population. Each donor gave informed consent as authorized by the Helsinki Committee (98290, Hadassah Hospital, Jerusalem, Israel). The six drawn samples were separated into three density fractions by Percoll gradient.
2.2. RBC Separation on Percoll
1 mL of a whole blood sample was gently layered on top of 13 mL of a 90% Percoll (Sigma-Aldrich, St. Louis, MO, USA ) mixture (consisting of nine parts of pure Percoll solution and one part of 10× plasma-mimicking buffer (40 mM KCl, 1.4 M NaCl, 7.5 mM MgSO4, 100 mM glucose, 2 mM Glycine, 0.15 mM ZnCl2, 2 mM Sodium Glutamate, 2 mM Alanine, 6 mM Glutamine, 1 mM Arginine, and 200 mM HEPES, pH 7.4 adjusted with Imidazole) supplemented with a final 0.01% BSA and 2 mM CaCl2). RBC separation was performed by 18,514× g centrifugation for 60 min at 30 °C. This procedure was carried out using an Eppendorf Centrifuge 5810R with a F-34-6-38 Rotor (supplemented with specific adapters for 15 mL Falcon tubes). After separation (Figure 1A), three fractions of RBCs enriched with ”young” (“light”; L-fraction, fractions 2–4), “mature” (“medium”; M-fraction, fractions 5–6), or “old” (“dense”; D-fraction, fractions 7–9) cells were collected. The cells were applied for examination after three washes with 1× plasma-mimicking buffer supplemented with 0.1% BSA and 2 mM CaCl2. The control experiment is designed as follows: after the Percoll separation, all fractions were mixed (treated RBCs), and the hematological indexes and deformability were compared with those of the non-separated RBC sample (native cells). The control experiment determined whether the cell population heterogeneity changed after centrifugation with Percoll.
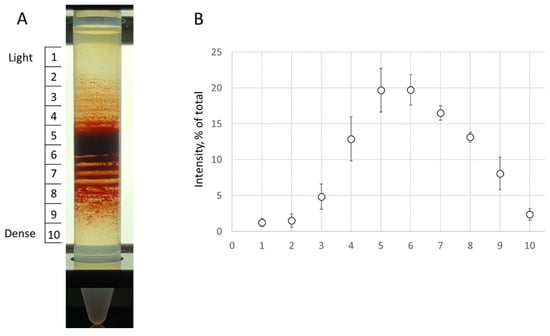
Figure 1.
Percoll density gradients. (A) A representative Percoll gradient from a participant is demonstrated. (B) The RBC content in each station was estimated as a percentage from a sum of all sub-fraction intensity values (represented by the RBC content). The data is presented in mean ± SD.
2.3. Isolation of RBC
RBCs were washed twice in PBS by centrifugation (500× g for 10 min).
2.4. Characterization of MCHC
For each washed RBC sample, the MCHC was determined using the standard protocol on an XP-300 (Sysmex, Kobe, Japan). For this measurement, 50 µL of the RBC suspension in the PBS buffer was sucked into the machine, and the sample was tested automatically. The MCHC is a calculated value obtained by dividing the hemoglobin value by the hematocrit.
2.5. Determination of RBC Deformability
To characterize RBC deformability, we used a computerized cell flow property analyzer (CFA), as described in our previous publications [15] and illustrated by Figure 2A. The CFA consists of a temperature-regulated flow chamber placed under a microscope into which a small amount of sample is inserted. Flow is induced by a syringe pump (Model PHD 2000P, Harvard Apparatus, South Natick, MA, USA). The CFA monitors RBC deformation (under applied shear stress) by visualizing the alteration of their shapes in a flow chamber (microfluidic device) placed under the microscope. The RBC images are transmitted by a microscope connected to a camera (Moticam S6, Motic, Hong Kong) to a computer equipped with software that provides comprehensive and integrative variables (some newly defined) for the characterization of RBC deformability [16]. To characterize RBC deformability, we monitored the elongation of adhered RBCs under the flow-induced shear stress of 3.0 Pa [16].
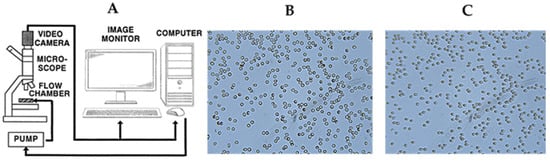
Figure 2.
Illustration of the protocol for determining the deformability of erythrocytes. (A) Scheme of cell flow analyzer (CFA). (B) Image of glass slide-attached RBCs after a 15 min incubation and (C) shape alteration of adherent RBCs under a shear stress of 3.0 Pa following incubation.
Fifty microliters of washed RBC suspension (1%) in PBS (supplemented by 0.5% BSA) was inserted into the microfluidic device and incubated for 15 min under 25 °C (Figure 2B). The cells that adhere to the glass surface (with a naïve surface) are then subjected to flow-induced shear stress of 3.0 Pa (Figure 2C). The change in cell shape is used to assess their deformability.
Thus, we record the deformation (change in shape) of immobile cells, which allows us to do the following:
1. Evaluate the deformation of a large population of RBCs (10,000–15,000 cells) under the influence of equal and constant wall shear stress; 2. Record with high accuracy, for each cell, the value of the elongation ratio (ER), which expresses the alteration of cell shape.
This parameter is calculated from the cells’ axis ratio: ER = a/b, where “a” is the major cellular axis, and “b” is the minor cellular axis. The minimal value of the elongation ratio is 1.0, which characterizes a round RBC. Using an image analysis program, we calculated the ER value for individual cells (Figure 3). The accuracy of the axes’ measurement is about 10%. Therefore, RBCs with ER ≤ 1.1 are defined as ‘undeformable’ cells (UDFCs), which do not deform under high shear stress.
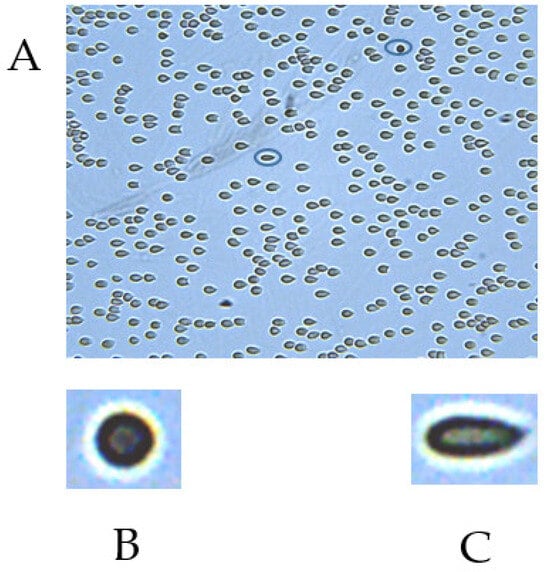
Figure 3.
(A). Image of an RBC field in the CFA flow chamber under a flow-induced shear stress of 3.0 Pa. (B). Undeformable cell (ER = 1). (C). Highly deformable cell (ER = 2.6).
The wall shear stress (τ) is calculated from pressure (P) at the entrance to the flow chamber, measured by a pressure-measuring station (Power Lab 2/20, AD Instruments, Oxford, UK), according to the equation τ = 0.5 × P × h/z, where z and h are the chamber’s length and gap, respectively.
All cell deformability measurements were carried out at a stable wall shear stress of 3.0 Pa. Based on our experience (unpublished data), we chose the magnitude of the applied wall shear stress (3.0 Pa) corresponding to the conditions under which the deformation of the RBCs becomes substantial. Still, their detachment from the glass remains insignificant.
Using image analysis software, we calculated an ER distribution (Figure 4) for a population of 13,000 ± 2500 cells (obtained from 20 to 30 fields). At the next step, from ER distribution (Figure 4A), the following parameters were calculated [16]: the median ER (MER), and the percent of undeformable (%UDFCs, ER ≤ 1.1), low-deformable (%LDFCs, ER ≤ 1.3), and high-deformable cells (%HDFCs, ER ≥ 2.0). We illustrated the scheme for calculating the deformability indices in Figure 4B. The figure shows the cumulative distribution of the cell elongation ratio (ER) in the RBCs’ population and the indicated values of the calculated parameters: the median ER (MER), and the percent of undeformable (%UDFCs, ER ≤ 1.1), low-deformable (%LDFCs, ER ≤ 1.3), and high-deformable cells (%HDFCs, ER ≥ 2.0).
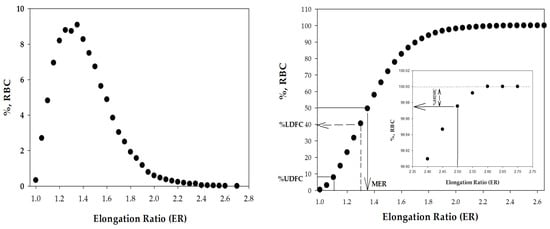
Figure 4.
The distribution of the RBC elongation ratios (ERs) in the population of cells. (A) histogram and (B) cumulative distribution.
2.6. Statistical Analysis
The Shapiro-Wilk test was used to verify the normality of the continuous variable distribution. We used a paired t-test to provide a hypothesis test of the difference between values’ means. Statistical differences were considered significant at p < 0.05. The Pearson coefficient and p-value characterize the significance of the linear regression between the two parameters being tested.
3. Results
3.1. Does the Separation of RBCs on Percoll Cause Alteration in RBC Deformability?
As mentioned, we separated the RBC population into three fractions according to cell density. The cell separation process in Percoll involves both exposure to hydrostatic pressure (caused by centrifugation) and mechanical stress (caused by cell movement in a dense gel medium). Previously, we have shown that both effects, under certain conditions, can affect the properties of cells [62,63]. Therefore, in the first stage, a control experiment was designed to establish whether the cell deformability changed after the separation of RBCs into fractions.
To this end, we performed a series of supplementary experiments comparing the characteristics of native cells and those that underwent Percoll processing (see Section 2). As can be seen from the data given in Table 1, the Percoll separation process does not lead to changes in RBC deformation indices. These data allowed us to conclude that RBC separation in the Percoll gradient does not alter RBC deformability, and we can use this method to separate cells into fractions (subpopulations) according to cell density.

Table 1.
RBC deformability features for control samples (native vs. Percoll control).
3.2. MCHC of Separated RBCs
As demonstrated by the data presented in Figure 5, the separation of native RBCs in the Percoll allowed us to obtain red cell fractions with significantly different values of MCHCs. We demonstrated that the “dense” fraction (D-fraction, bottom of the tube) is characterized by a high MCHC 35.0 ± 0.4 g/dL), while the top layer (L-fraction) of cells has a low value (28.9 ± 0.5 g/dL). For the obtained subpopulations, we characterized cell deformability.
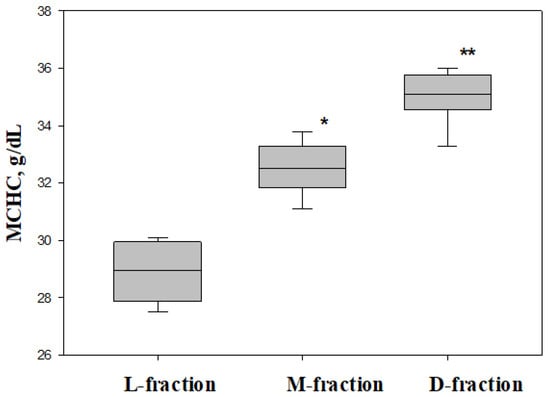
Figure 5.
Intracellular concentration of hemoglobin (MCHC) for three subfractions (L-, M-, and D-fractions) and native cells. * difference between L- and M-fractions (p = 0.0012), ** difference between L- and D-fractions (p = 0.0001).
3.3. Deformability of Separated RBCs
To characterize RBC deformability, we determined the ER distribution for cells from the native population and three subpopulations obtained by separation in the Percoll gradient. As demonstrated in Figure 4, the elevation of RBC density (from L- to M- and D-fractions) is associated with decreasing cell deformability, expressed in the left shift elongation ratio (ER) distribution. The median value of the ER (MER) changed from 1.24 for “dense” fractions to 1.351 for low-density fractions (Figure 6).
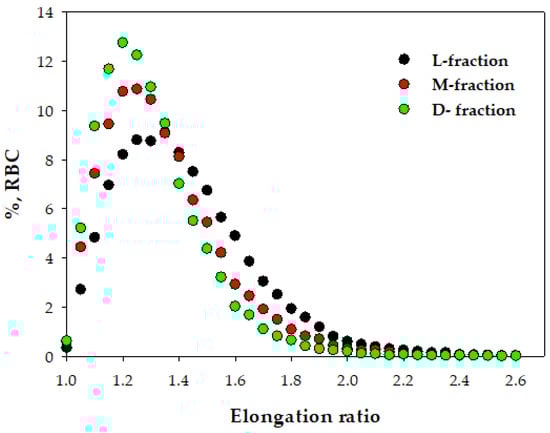
Figure 6.
Deformability of RBCs from three density fractions. Typical distribution of the elongation ratio (ER) in RBC populations for cells from L-, M-, and D-fractions.
As described in the Methods (Figure 1), from the ER cumulative distribution, we calculated a set of indices, such as median elongation ratio (MER) and the relative percentage of high-deformable (%HDFCs), low-deformable (%LDFCs), and undeformable (%UDFCs) cells in the RBC population. Values of these indices for the native population and the three density-based subpopulations are presented in Table 2.
Table 2.
RBC deformability indices for native RBCs and their fractions (L, M, and D), n = 6.
Analysis of the results shown in Table 2 indicates that the L-fraction of cells is enriched with HDFCs, while the percentage of UDFCs and LDFCs is reduced. Conversely, the “dense” fraction is enriched with LDFCs and UDFCs, while the percentage of HDFCs is reduced. However, it is important to note the presence of undeformable cells in the “light” fraction and high-deformable RBCs in the “dense” fraction (see Table 2).
Moreover, we demonstrated (Table 2) that the median elongation ratio (MER) decreases with the elevation of the MCHC (density). This pattern is also proper for each blood sample. As Figure 7 shows, the transition from the “light” to the “dense” fraction is accompanied by a significant decrease in the MER value for all blood samples.
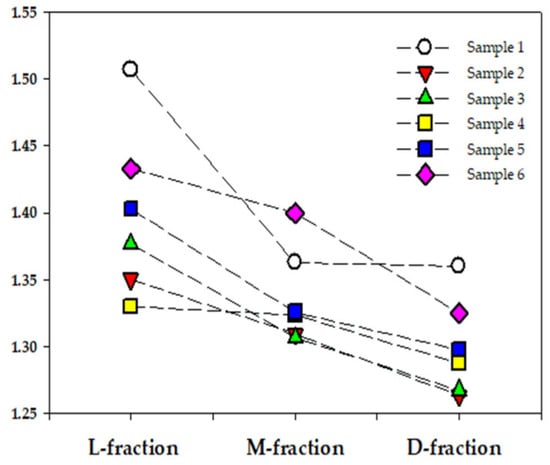
Figure 7.
Median elongation ratio (MER) for three density fractions from six RBC samples (market by different colors).
3.4. Correlation between Deformability of Separated RBCs and MCHC
The data in Table 3 also show a correlation between cell density and deformability. As shown, RBCs’ deformability is correlated with their density (as defined by their MCHC value). Hence, an elevation in the MCHC increased the percentage of low and undeformable cells while the MER and %HDFCs decreased.
Table 3.
Statistical characteristics of linear correlation between MCHCs and RBC deformability features were obtained for six RBC samples.
In general, our results indicate that increased RBC density leads to a deterioration in their deformability.
4. Discussion
RBCs’ primary physiological role is ensuring normal bodily gas exchange [64]. To realize this goal, red blood cells have unique flow-affecting properties, which play a decisive role in blood circulation in health and disease [65]. One of them is RBC deformability, which is the cell’s ability to adapt its shape to constantly changing shear conditions, thereby minimizing its resistance to the flow. This ability of cells to deform is most manifested under capillary flow conditions when rigid RBCs can block capillaries [42] and, as a result, impair tissue oxygen saturation [39,40,66]. In addition, it must be considered that the reduced deformability of cells is one of the major factors causing their removal from the bloodstream, mainly in the spleen [43,44,45,46].
The age-related decrease of RBC deformability is typically related to altering cell morphology, viscoelasticity, and cytosol viscosity elevation [56,57,58,67]. Changes in these RBC features occur for various reasons, the main one being membrane vesiculation.
Due to membrane vesiculation, over the 100–120-day lifespan in the blood, an RBC loses approximately 15–20 [68] or 30% [69] of its volume and 20% of its intracellular hemoglobin [69,70]. In addition, significant changes in the biochemical composition of the cell membrane and its cytosol [69,70,71] can be caused by oxidative stress [72] that accumulates during the cell’s life.
Our study demonstrated that a decrease in RBCs’ deformability, occurring as part of cells’ in vivo aging, is correlated with an elevation in the MCHC (see Table 3). Thus, the alteration of RBC deformability can primarily be related to change in the cytosol’s viscosity (determined by the concentration of intracellular hemoglobin).
Watala et al. [71] studied the association of intracellular viscosity of RBCs and their membranes’ dynamic properties in children with diabetes. The authors demonstrated that the elevation of cytosol viscosity provokes a decrease in red cell deformability. Mohandas and colleagues [72] came to a similar conclusion regarding the relationship between cytosol viscosity and cell deformability when studying the rheological properties of erythrocytes collected from thalassemic patients.
The connection between the MCHC and cell deformability we have demonstrated in this study follows results previously published by other authors [15,73,74]. At the same time, attention should be paid to the fact that separating the RBC population into “light” and “dense” fractions does not produce an unambiguous division between high- and low deformable cell populations. As can be seen from Table 2, undeformable (UDFCs) and low-deformable (LDFCs) cells constitute significant subpopulations in the L-fraction, while the D-fraction contains a significant subpopulation of highly deformable cells. From this observation, we can conclude that the MCHC is not the sole factor determining cells’ deformability.
Thus, we are faced with a certain contradiction: on the one hand, the deformability of RBC correlates with the MCHC value (Table 3) and, on the other hand, in each fraction, there are cells with significantly different abilities to deform (Table 2). What is a possible cause of this phenomenon?
One of the possible explanations for the non-homogeneity of the obtained fractions could be the technical aspects of separating blood samples on a Percoll gradient [11]. Maurer and colleagues [11] linked this effect with the aggregation of RBCs. Authors suggested that the formation of RBC aggregates distorts the density-based separation of cells and leads to the formation of non-homogeneous fractions of RBCs. For this reason, we can assume that fractions of RBCs of various densities can contain cells with a level of deformability that is not characteristic of a given fraction.
Indeed, the literature provides a triad of cellular factors [75,76] that affect its deformability, namely (1) the surface area-to-volume ratio of a cell [76], (2) intracellular viscosity [77], and (3) membrane viscoelasticity [44,45]. These factors are not independent, so a change in the other two accompanies an alteration in the third. Thus, the formation of vesicles causes a reorganization of the RBC membrane due to the loss of several membrane proteins [14,78,79,80] and, as a result, alteration of membrane viscoelasticity [67]. It also causes the membrane to lose part of its surface [81,82] and, consequently, provokes a decrease in the ratio between the cell’s surface area and volume. Finally, vesicle generation causes a decrease in RBC volume and increases the MCHC [15,83] and cytosol viscosity [84]. However, even though all three properties of cells (surface-area-to-volume ratio, intracellular viscosity, and membrane viscoelasticity) are closely interrelated with each other, dividing the cell population by density, as follows from our results, does not lead to obtaining cell fractions that are homogeneous according to other features.
Limitations: As stated above, this article focuses on studying the effect of intracellular hemoglobin concentrations (as the main factor) on cell deformability. We do not consider the influence of other hematological parameters (such as MCV and RDW) here since this is beyond the scope of our paper. A separate publication will discuss the interrelationship between the hematological indexes (MCV, MCH, MCHC, and RDW) and their joint influence on cell deformability.
In summary, we have established that a density gradient allows us to separate the total RBC population into three fractions, differentiated by the content of their undeformable cells. Moreover, we demonstrated a strong correlation between RBC deformability and intracellular Hb concentration. However, the change in the MCHC can only partially explain the difference in cell deformability, and other factors undoubtedly affect this property of erythrocytes.
5. Conclusions
The deformability of RBCs is one of those properties that largely determines the rheology of the blood and, therefore, affects circulation. In the described study, we divided the initial population of RBCs according to their density into three fractions (“light”, “medium”, and “dense”). For each of them, we determined the distribution of cell deformability.
In conclusion, we can summarize our findings as follows:
- Separation of RBCs according to density makes it possible to isolate fractions with different levels of cell deformability. However, these fractions are not homogeneous in their deformability properties.
- All measures of RBC deformability (analyzed in this study) demonstrate a strong correlation with the concentration of cytosolic hemoglobin. However, the established correlation can result from the direct effect of cytosol viscosity on cell deformability or the indirect influence of other cellular factors.
Author Contributions
Conceptualization, G.B.; methodology, G.B. and L.L.; investigation, G.B. and L.L.; data curation, G.B.; writing—original draft preparation, G.B.; writing—review and editing, A.G., D.A.; supervision, G.B.; funding acquisition, G.B. All authors have read and agreed to the published version of the manuscript.
Funding
The Israel Science Foundation funded this research with grant number 341/18.
Data Availability Statement
Data are contained within the article. The data presented in this study are available upon request from the corresponding author.
Acknowledgments
We thank Olga Fredman (Hebrew University, Faculty of Medicine) and B.M. Alyan Muna (Blood Bank, Hadassah University Hospital) for their technical assistance.
Conflicts of Interest
The authors declare no conflict of interest.
References
- Franco, R.S. Measurement of red cell lifespan and aging. Transfus. Med. Hemotherapy 2012, 39, 302–307. [Google Scholar] [CrossRef] [PubMed]
- Cohen, R.M.; Franco, R.S.; Khera, P.K.; Smith, E.P.; Lindsell, C.J.; Ciraolo, P.J.; Palascak, M.B.; Joiner, C.H. Red cell life span heterogeneity in hematologically normal people is sufficient to alter HbA1c. Blood 2008, 112, 4284–4291. [Google Scholar] [CrossRef]
- Mock, D.M.; Matthews, N.I.; Zhu, S.; Strauss, R.G.; Schmidt, R.L.; Nalbant, D.; Cress, G.A.; Widness, J.A. Red blood cell (RBC) survival determined in humans using RBCs labeled at multiple biotin densities. Transfusion 2011, 51, 1047–1057. [Google Scholar] [CrossRef]
- Bogdanova, A.; Kaestner, L.; Simionato, G.; Wickrema, A.; Makhro, A. Heterogeneity of Red Blood Cells: Causes and Consequences. Front. Physiol. 2020, 11, 392. [Google Scholar] [CrossRef] [PubMed]
- Orrico, F.; Laurance, S.; Lopez, A.C.; Lefevre, S.D.; Thomson, L.; Moller, M.N.; Ostuni, M.A. Oxidative Stress in Healthy and Pathological Red Blood Cells. Biomolecules 2023, 13, 1262. [Google Scholar] [CrossRef] [PubMed]
- Remigante, A.; Morabito, R.; Marino, A. Band 3 protein function and oxidative stress in erythrocytes. J. Cell. Physiol. 2021, 236, 6225–6234. [Google Scholar] [CrossRef]
- Massaccesi, L.; Galliera, E.; Corsi Romanelli, M.M. Erythrocytes as markers of oxidative stress related pathologies. Mech. Ageing Dev. 2020, 191, 111333. [Google Scholar] [CrossRef]
- Huang, Y.X.; Wu, Z.J.; Mehrishi, J.; Huang, B.T.; Chen, X.Y.; Zheng, X.J.; Liu, W.J.; Luo, M. Human red blood cell aging: Correlative changes in surface charge and cell properties. J. Cell. Mol. Med. 2011, 15, 2634–2642. [Google Scholar] [CrossRef]
- Cluitmans, J.C.; Hardeman, M.R.; Dinkla, S.; Brock, R.; Bosman, G.J. Red blood cell deformability during storage: Towards functional proteomics and metabolomics in the Blood Bank. Blood Transfus. 2012, 10 (Suppl. 2), s12–s18. [Google Scholar] [CrossRef]
- Bosch, F.H.; Werre, J.M.; Roerdinkholder-Stoelwinder, B.; Huls, T.H.; Willekens, F.L.; Halie, M.R. Characteristics of red blood cell populations fractionated with a combination of counterflow centrifugation and Percoll separation. Blood 1992, 79, 254–260. [Google Scholar] [CrossRef]
- Maurer, F.; John, T.; Makhro, A.; Bogdanova, A.; Minetti, G.; Wagner, C.; Kaestner, L. Continuous Percoll Gradient Centrifugation of Erythrocytes-Explanation of Cellular Bands and Compromised Age Separation. Cells 2022, 11, 1296. [Google Scholar] [CrossRef] [PubMed]
- Bizjak, D.A.; Brinkmann, C.; Bloch, W.; Grau, M. Increase in Red Blood Cell-Nitric Oxide Synthase Dependent Nitric Oxide Production during Red Blood Cell Aging in Health and Disease: A Study on Age Dependent Changes of Rheologic and Enzymatic Properties in Red Blood Cells. PLoS ONE 2015, 10, e0125206. [Google Scholar] [CrossRef]
- Grau, M.; Kuck, L.; Dietz, T.; Bloch, W.; Simmonds, M.J. Sub-Fractions of Red Blood Cells Respond Differently to Shear Exposure Following Superoxide Treatment. Biology 2021, 10, 47. [Google Scholar] [CrossRef] [PubMed]
- D’Alessandro, A.; Blasi, B.; D’Amici, G.M.; Marrocco, C.; Zolla, L. Red blood cell subpopulations in freshly drawn blood: Application of proteomics and metabolomics to a decades-long biological issue. Blood Transfus. 2013, 11, 75–87. [Google Scholar] [CrossRef]
- Bosch, F.H.; Werre, J.M.; Schipper, L.; Roerdinkholder-Stoelwinder, B.; Huls, T.; Willekens, F.L.; Wichers, G.; Halie, M.R. Determinants of red blood cell deformability in relation to cell age. Eur. J. Haematol. 1994, 52, 35–41. [Google Scholar] [CrossRef]
- Barshtein, G.; Pries, A.R.; Goldschmidt, N.; Zukerman, A.; Orbach, A.; Zelig, O.; Arbell, D.; Yedgar, S. Deformability of transfused red blood cells is a potent determinant of transfusion-induced change in recipient’s blood flow. Microcirculation 2016, 23, 479–486. [Google Scholar] [CrossRef]
- Simchon, S.; Jan, K.M.; Chien, S. Influence of reduced red cell deformability on regional blood flow. Am. J. Physiol. 1987, 253, H898–H903. [Google Scholar] [CrossRef]
- Stuart, J.; Johnson, C.S. Rheology of the sickle cell disorders. Bailliere’s Clin. Haematol. 1987, 1, 747–775. [Google Scholar] [CrossRef] [PubMed]
- Stuart, J.; Nash, G.B. Red cell deformability and haematological disorders. Blood Rev. 1990, 4, 141–147. [Google Scholar] [CrossRef]
- Wendelbo, O.; Hervig, T.; Haugen, O.; Seghatchian, J.; Reikvam, H. Microcirculation and red cell transfusion in patients with sepsis. Transfus. Apher. Sci. 2017, 56, 900–905. [Google Scholar] [CrossRef]
- Kang, Y.J.; Lee, S.J. In vitro and ex vivo measurement of the biophysical properties of blood using microfluidic platforms and animal models. Analyst 2018, 143, 2723–2749. [Google Scholar] [CrossRef]
- Man, Y.; Kucukal, E.; An, R.; Watson, Q.D.; Bosch, J.; Zimmerman, P.A.; Little, J.A.; Gurkan, U.A. Microfluidic assessment of red blood cell mediated microvascular occlusion. Lab Chip 2020, 20, 2086–2099. [Google Scholar] [CrossRef]
- Picot, J.; Ndour, P.A.; Lefevre, S.D.; El Nemer, W.; Tawfik, H.; Galimand, J.; Da Costa, L.; Ribeil, J.A.; de Montalembert, M.; Brousse, V.; et al. A biomimetic microfluidic chip to study the circulation and mechanical retention of red blood cells in the spleen. Am. J. Hematol. 2015, 90, 339–345. [Google Scholar] [CrossRef]
- Shevkoplyas, S.S.; Yoshida, T.; Gifford, S.C.; Bitensky, M.W. Direct measurement of the impact of impaired erythrocyte deformability on microvascular network perfusion in a microfluidic device. Lab Chip 2006, 6, 914–920. [Google Scholar] [CrossRef]
- Sosa, J.M.; Nielsen, N.D.; Vignes, S.M.; Chen, T.G.; Shevkoplyas, S.S. The relationship between red blood cell deformability metrics and perfusion of an artificial microvascular network. Clin. Hemorheol. Microcirc. 2014, 57, 275–289. [Google Scholar] [CrossRef] [PubMed]
- Li, H.; Lu, L.; Li, X.; Buffet, P.A.; Dao, M.; Karniadakis, G.E.; Suresh, S. Mechanics of diseased red blood cells in human spleen and consequences for hereditary blood disorders. Proc. Natl. Acad. Sci. USA 2018, 115, 9574–9579. [Google Scholar] [CrossRef]
- Liu, Z.L.; Li, H.; Qiang, Y.; Buffet, P.; Dao, M.; Karniadakis, G.E. Computational modeling of biomechanics and biorheology of heated red blood cells. Biophys. J. 2021, 120, 4663–4671. [Google Scholar] [CrossRef]
- Pivkin, I.V.; Peng, Z.; Karniadakis, G.E.; Buffet, P.A.; Dao, M.; Suresh, S. Biomechanics of red blood cells in human spleen and consequences for physiology and disease. Proc. Natl. Acad. Sci. USA 2016, 113, 7804–7809. [Google Scholar] [CrossRef]
- Safeukui, I.; Buffet, P.A.; Deplaine, G.; Perrot, S.; Brousse, V.; Sauvanet, A.; Aussilhou, B.; Dokmak, S.; Couvelard, A.; Cazals-Hatem, D.; et al. Sensing of red blood cells with decreased membrane deformability by the human spleen. Blood Adv. 2018, 2, 2581–2587. [Google Scholar] [CrossRef] [PubMed]
- Fens, M.H.; Storm, G.; Pelgrim, R.C.; Ultee, A.; Byrne, A.T.; Gaillard, C.A.; van Solinge, W.W.; Schiffelers, R.M. Erythrophagocytosis by angiogenic endothelial cells is enhanced by loss of erythrocyte deformability. Exp. Hematol. 2010, 38, 282–291. [Google Scholar] [CrossRef] [PubMed]
- Sosale, N.G.; Rouhiparkouhi, T.; Bradshaw, A.M.; Dimova, R.; Lipowsky, R.; Discher, D.E. Cell rigidity and shape override CD47’s “self”-signaling in phagocytosis by hyperactivating myosin-II. Blood 2015, 125, 542–552. [Google Scholar] [CrossRef]
- McMahon, T.J. Red Blood Cell Deformability, Vasoactive Mediators, and Adhesion. Front. Physiol. 2019, 10, 1417. [Google Scholar] [CrossRef] [PubMed]
- Racine, M.L.; Dinenno, F.A. Reduced deformability contributes to impaired deoxygenation-induced ATP release from red blood cells of older adult humans. J. Physiol. 2019, 597, 4503–4519. [Google Scholar] [CrossRef] [PubMed]
- Bissinger, R.; Nemkov, T.; D’Alessandro, A.; Grau, M.; Dietz, T.; Bohnert, B.N.; Essigke, D.; Worn, M.; Schaefer, L.; Xiao, M.; et al. Proteinuric chronic kidney disease is associated with altered red blood cell lifespan, deformability and metabolism. Kidney Int. 2021, 100, 1227–1239. [Google Scholar] [CrossRef]
- Ko, E.; Youn, J.M.; Park, H.S.; Song, M.; Koh, K.H.; Lim, C.H. Early red blood cell abnormalities as a clinical variable in sepsis diagnosis. Clin. Hemorheol. Microcirc. 2018, 70, 355–363. [Google Scholar] [CrossRef]
- Mohi, S.M.; Saadon, H.L.; Khalaf, A.A. Laser tweezers as a biophotonic tool to investigate the efficacy of living sickle red blood cells in response to optical deformation. Biophys. Rev. 2021, 13, 173–184. [Google Scholar] [CrossRef] [PubMed]
- Sohn, M.; Lee, J.E.; Ahn, M.; Park, Y.; Lim, S. Correlation of dynamic membrane fluctuations in red blood cells with diabetes mellitus and cardiovascular risks. Sci. Rep. 2021, 11, 7007. [Google Scholar] [CrossRef]
- Stauffer, E.; Poutrel, S.; Cannas, G.; Gauthier, A.; Fort, R.; Bertrand, Y.; Renoux, C.; Joly, P.; Boisson, C.; Hot, A.; et al. Nocturnal Hypoxemia Rather Than Obstructive Sleep Apnea Is Associated With Decreased Red Blood Cell Deformability and Enhanced Hemolysis in Patients With Sickle Cell Disease. Front. Physiol. 2021, 12, 743399. [Google Scholar] [CrossRef]
- Matot, I.; Katz, M.; Pappo, O.; Zelig, O.; Corchia, N.; Yedgar, S.; Barshtein, G.; Bennett-Guerrero, E.; Abramovitch, R. Resuscitation with aged blood exacerbates liver injury in a hemorrhagic rat model. Crit. Care Med. 2013, 41, 842–849. [Google Scholar] [CrossRef]
- Parthasarathi, K.; Lipowsky, H.H. Capillary recruitment in response to tissue hypoxia and its dependence on red blood cell deformability. Am. J. Physiol. 1999, 277, H2145–H2157. [Google Scholar] [CrossRef]
- Kaul, D.K.; Koshkaryev, A.; Artmann, G.; Barshtein, G.; Yedgar, S. Additive effect of red blood cell rigidity and adherence to endothelial cells in inducing vascular resistance. Am. J. Physiol. Heart Circ. Physiol. 2008, 295, H1788–H1793. [Google Scholar] [CrossRef] [PubMed]
- McHedlishvili, G. Disturbed blood flow structuring as critical factor of hemorheological disorders in microcirculation. Clin. Hemorheol. Microcirc. 1998, 19, 315–325. [Google Scholar]
- Warkentin, T.E.; Barr, R.D.; Ali, M.A.; Mohandas, N. Recurrent acute splenic sequestration crisis due to interacting genetic defects: Hemoglobin SC disease and hereditary spherocytosis. Blood 1990, 75, 266–270. [Google Scholar] [CrossRef] [PubMed]
- Mohandas, N.; Chasis, J.A. Red blood cell deformability, membrane material properties and shape: Regulation by transmembrane, skeletal and cytosolic proteins and lipids. Semin. Hematol. 1993, 30, 171–192. [Google Scholar] [PubMed]
- An, X.; Mohandas, N. Disorders of red cell membrane. Br. J. Haematol. 2008, 141, 367–375. [Google Scholar] [CrossRef]
- Huang, S.; Amaladoss, A.; Liu, M.; Chen, H.; Zhang, R.; Preiser, P.R.; Dao, M.; Han, J. In vivo splenic clearance correlates with in vitro deformability of red blood cells from Plasmodium yoelii-infected mice. Infect. Immun. 2014, 82, 2532–2541. [Google Scholar] [CrossRef]
- Cranston, H.A.; Boylan, C.W.; Carroll, G.L.; Sutera, S.P.; Williamson, J.R.; Gluzman, I.Y.; Krogstad, D.J. Plasmodium falciparum maturation abolishes physiologic red cell deformability. Science 1984, 223, 400–403. [Google Scholar] [CrossRef] [PubMed]
- Duez, J.; Holleran, J.P.; Ndour, P.A.; Pionneau, C.; Diakite, S.; Roussel, C.; Dussiot, M.; Amireault, P.; Avery, V.M.; Buffet, P.A. Mechanical clearance of red blood cells by the human spleen: Potential therapeutic applications of a biomimetic RBC filtration method. Transfus. Clin. Biol. 2015, 22, 151–157. [Google Scholar] [CrossRef]
- Klei, T.R.; Meinderts, S.M.; van den Berg, T.K.; van Bruggen, R. From the Cradle to the Grave: The Role of Macrophages in Erythropoiesis and Erythrophagocytosis. Front. Immunol. 2017, 8, 73. [Google Scholar] [CrossRef]
- Lee, S.B.; Kim, Y.S.; Kim, J.H.; Park, K.; Nam, J.S.; Kang, S.; Park, J.S.; Shin, S.; Ahn, C.W. Use of RBC deformability index as an early marker of diabetic nephropathy. Clin. Hemorheol. Microcirc. 2019, 72, 75–84. [Google Scholar] [CrossRef]
- Moon, J.S.; Kim, J.H.; Kim, J.H.; Park, I.R.; Lee, J.H.; Kim, H.J.; Lee, J.; Kim, Y.K.; Yoon, J.S.; Won, K.C.; et al. Impaired RBC deformability is associated with diabetic retinopathy in patients with type 2 diabetes. Diabetes Metab. 2016, 42, 448–452. [Google Scholar] [CrossRef] [PubMed]
- Radosinska, J.; Vrbjar, N. The role of red blood cell deformability and Na,K-ATPase function in selected risk factors of cardiovascular diseases in humans: Focus on hypertension, diabetes mellitus and hypercholesterolemia. Physiol. Res. 2016, 65 (Suppl. 1), S43–S54. [Google Scholar] [CrossRef]
- Tan, J.K.S.; Wei, X.; Wong, P.A.; Fang, J.; Kim, S.; Agrawal, R. Altered red blood cell deformability-A novel hypothesis for retinal microangiopathy in diabetic retinopathy. Microcirculation 2020, 27, e12649. [Google Scholar] [CrossRef]
- Donadello, K.; Piagnerelli, M.; Reggiori, G.; Gottin, L.; Scolletta, S.; Occhipinti, G.; Zouaoui Boudjeltia, K.; Vincent, J.L. Reduced red blood cell deformability over time is associated with a poor outcome in septic patients. Microvasc. Res. 2015, 101, 8–14. [Google Scholar] [CrossRef] [PubMed]
- Moutzouri, A.G.; Skoutelis, A.T.; Gogos, C.A.; Missirlis, Y.F.; Athanassiou, G.M. Red blood cell deformability in patients with sepsis: A marker for prognosis and monitoring of severity. Clin. Hemorheol. Microcirc. 2007, 36, 291–299. [Google Scholar]
- Dao, M.; Lim, C.T.; Suresh, S. Mechanics of the human red blood cell deformed by optical tweezers. J. Mech. Phys. Solids 2003, 51, 2259–2280. [Google Scholar] [CrossRef]
- Kuzman, D.; Svetina, S.; Waugh, R.E.; Zeks, B. Elastic properties of the red blood cell membrane that determine echinocyte deformability. Eur. Biophys. J. Biophy. 2004, 33, 1–15. [Google Scholar] [CrossRef] [PubMed]
- Huisjes, R.; Bogdanova, A.; van Solinge, W.W.; Schiffelers, R.M.; Kaestner, L.; van Wijk, R. Squeezing for Life—Properties of Red Blood Cell Deformability. Front. Physiol. 2018, 9, 656. [Google Scholar] [CrossRef]
- McNamee, A.P.; Richardson, K.; Horobin, J.; Kuck, L.; Simmonds, M.J. Susceptibility of density-fractionated erythrocytes to subhaemolytic mechanical shear stress. Int. J. Artif. Organs 2019, 42, 151–157. [Google Scholar] [CrossRef]
- Barshtein, G.; Gural, A.; Arbell, D.; Barkan, R.; Livshits, L.; Pajic-Lijakovic, I.; Yedgar, S. Red Blood Cell Deformability Is Expressed by a Set of Interrelated Membrane Proteins. Int. J. Mol. Sci. 2023, 24, 12755. [Google Scholar] [CrossRef]
- Barshtein, G.; Livshits, L.; Gural, A.; Arbell, D.; Barkan, R.; Pajic-Lijakovic, I.; Yedgar, S. Hemoglobin Binding to the Red Blood Cell (RBC) Membrane Is Associated with Decreased Cell Deformability. Int. J. Mol. Sci. 2024, 25, 5814. [Google Scholar] [CrossRef]
- Barshtein, G.; Bergelson, L.; Dagan, A.; Gratton, E.; Yedgar, S. Membrane lipid order of human red blood cells is altered by physiological levels of hydrostatic pressure. Am. J. Physiol. 1997, 272, H538–H543. [Google Scholar] [CrossRef]
- Orbach, A.; Zelig, O.; Yedgar, S.; Barshtein, G. Biophysical and Biochemical Markers of Red Blood Cell Fragility. Transfus. Med. Hemother. 2017, 44, 183–187. [Google Scholar] [CrossRef]
- Kuhn, V.; Diederich, L.; Keller, T.S., IV; Kramer, C.M.; Luckstadt, W.; Panknin, C.; Suvorava, T.; Isakson, B.E.; Kelm, M.; Cortese-Krott, M.M. Red Blood Cell Function and Dysfunction: Redox Regulation, Nitric Oxide Metabolism, Anemia. Antioxid. Redox Signal 2017, 26, 718–742. [Google Scholar] [CrossRef]
- Barshtein, G.; Ben-Ami, R.; Yedgar, S. Role of red blood cell flow behavior in hemodynamics and hemostasis. Expert Rev. Cardiovasc. Ther. 2007, 5, 743–752. [Google Scholar] [CrossRef]
- Sakr, Y.; Chierego, M.; Piagnerelli, M.; Verdant, C.; Dubois, M.J.; Koch, M.; Creteur, J.; Gullo, A.; Vincent, J.L.; De Backer, D. Microvascular response to red blood cell transfusion in patients with severe sepsis. Crit. Care Med. 2007, 35, 1639–1644. [Google Scholar] [CrossRef]
- Barshtein, G.; Pajic-Lijakovic, I.; Gural, A. Deformability of Stored Red Blood Cells. Front. Physiol. 2021, 12, 722896. [Google Scholar] [CrossRef]
- Willekens, F.L.; Werre, J.M.; Groenen-Dopp, Y.A.; Roerdinkholder-Stoelwinder, B.; de Pauw, B.; Bosman, G.J. Erythrocyte vesiculation: A self-protective mechanism? Br. J. Haematol. 2008, 141, 549–556. [Google Scholar] [CrossRef]
- Malka, R.; Delgado, F.F.; Manalis, S.R.; Higgins, J.M. In vivo volume and hemoglobin dynamics of human red blood cells. PLoS Comput. Biol. 2014, 10, e1003839. [Google Scholar] [CrossRef]
- Willekens, F.L.; Bosch, F.H.; Roerdinkholder-Stoelwinder, B.; Groenen-Dopp, Y.A.; Werre, J.M. Quantification of loss of haemoglobin components from the circulating red blood cell in vivo. Eur. J. Haematol. 1997, 58, 246–250. [Google Scholar] [CrossRef]
- Watala, C.; Witas, H.; Olszowska, L.; Piasecki, W. The association between erythrocyte internal viscosity, protein non-enzymatic glycosylation and erythrocyte membrane dynamic properties in juvenile diabetes mellitus. Int. J. Exp. Pathol. 1992, 73, 655–663. [Google Scholar]
- Mohandas, N.; Clark, M.R.; Jacobs, M.S.; Shohet, S.B. Analysis of factors regulating erythrocyte deformability. J. Clin. Investig. 1980, 66, 563–573. [Google Scholar] [CrossRef]
- Clark, M.R. Mean corpuscular hemoglobin concentration and cell deformability. Ann. N. Y. Acad. Sci. 1989, 565, 284–294. [Google Scholar] [CrossRef]
- von Tempelhoff, G.F.; Schelkunov, O.; Demirhan, A.; Tsikouras, P.; Rath, W.; Velten, E.; Csorba, R. Correlation between blood rheological properties and red blood cell indices(MCH, MCV, MCHC) in healthy women. Clin. Hemorheol. Microcirc. 2016, 62, 45–54. [Google Scholar] [CrossRef]
- Waugh, R.E.; Narla, M.; Jackson, C.W.; Mueller, T.J.; Suzuki, T.; Dale, G.L. Rheologic properties of senescent erythrocytes: Loss of surface area and volume with red blood cell age. Blood 1992, 79, 1351–1358. [Google Scholar] [CrossRef]
- Renoux, C.; Faivre, M.; Bessaa, A.; Da Costa, L.; Joly, P.; Gauthier, A.; Connes, P. Impact of surface-area-to-volume ratio, internal viscosity and membrane viscoelasticity on red blood cell deformability measured in isotonic condition. Sci. Rep. 2019, 9, 6771. [Google Scholar] [CrossRef]
- Chien, W.; Gompper, G.; Fedosov, D.A. Effect of cytosol viscosity on the flow behavior of red blood cell suspensions in microvessels. Microcirculation 2021, 28, e12668. [Google Scholar] [CrossRef]
- Kriebardis, A.G.; Antonelou, M.H.; Stamoulis, K.E.; Economou-Petersen, E.; Margaritis, L.H.; Papassideri, I.S. Progressive oxidation of cytoskeletal proteins and accumulation of denatured hemoglobin in stored red cells. J. Cell. Mol. Med. 2007, 11, 148–155. [Google Scholar] [CrossRef]
- Salzer, U.; Prohaska, R. Stomatin, flotillin-1, and flotillin-2 are major integral proteins of erythrocyte lipid rafts. Blood 2001, 97, 1141–1143. [Google Scholar] [CrossRef]
- Wilkinson, D.K.; Turner, E.J.; Parkin, E.T.; Garner, A.E.; Harrison, P.J.; Crawford, M.; Stewart, G.W.; Hooper, N.M. Membrane raft actin deficiency and altered Ca2+-induced vesiculation in stomatin-deficient overhydrated hereditary stomatocytosis. Biochim. Biophys. Acta 2008, 1778, 125–132. [Google Scholar] [CrossRef]
- Asaro, R.J.; Zhu, Q.; Cabrales, P. Erythrocyte Aging, Protection via Vesiculation: An Analysis Methodology via Oscillatory Flow. Front. Physiol. 2018, 9, 1607. [Google Scholar] [CrossRef] [PubMed]
- Wei, Q.; Wang, X.; Zhang, C.; Dao, M.; Gong, X. Evolution of surface area and membrane shear modulus of matured human red blood cells during mechanical fatigue. Sci. Rep. 2023, 13, 8563. [Google Scholar] [CrossRef] [PubMed]
- Bosman, G.J. Survival of red blood cells after transfusion: Processes and consequences. Front. Physiol. 2013, 4, 376. [Google Scholar] [CrossRef]
- Zhu, Q.; Salehyar, S.; Cabrales, P.; Asaro, R.J. Prospects for Human Erythrocyte Skeleton-Bilayer Dissociation during Splenic Flow. Biophys. J. 2017, 113, 900–912. [Google Scholar] [CrossRef]
Disclaimer/Publisher’s Note: The statements, opinions and data contained in all publications are solely those of the individual author(s) and contributor(s) and not of MDPI and/or the editor(s). MDPI and/or the editor(s) disclaim responsibility for any injury to people or property resulting from any ideas, methods, instructions or products referred to in the content. |
© 2024 by the authors. Licensee MDPI, Basel, Switzerland. This article is an open access article distributed under the terms and conditions of the Creative Commons Attribution (CC BY) license (https://creativecommons.org/licenses/by/4.0/).