Article

Molecular Dynamics Study on the Lubrication Mechanism of the Phytic Acid/Copper Interface Under Loading Condition

1
School of Physical Science and Technology, Southwest Jiaotong University, Chengdu 610031, China
2
Sichuan Province International Science and Technology Cooperation Base of Functional Materials, College of Medicine, Southwest Jiaotong University, Chengdu 610031, China
3
Special Glass Key Laboratory of Hainan Province, School of Materials Science and Engineering, Hainan University, Haikou 570228, China
*
Authors to whom correspondence should be addressed.
Colloids Interfaces 2025, 9(2), 18; https://doi.org/10.3390/colloids9020018
Submission received: 10 February 2025 / Revised: 15 March 2025 / Accepted: 19 March 2025 / Published: 22 March 2025

Abstract

:
To investigate the lubrication mechanism of phytic acid (PA) solution, a “copper–PA solution–copper” confined model with varying concentrations was established. Molecular dynamics (MD) simulations were employed to model the behavior of compression and the confined shear process. By examining the variations in key parameters such as dynamic viscosity, compressibility, radial distribution function, relative concentration distribution, and velocity distribution of PA solutions under different normal loads or shear rates, we elucidated the lubrication mechanism of PA solutions at the molecular level. The results demonstrate that under standard loading conditions, higher PA concentrations facilitate the formation of denser hydrated layers with decreased compressibility compared to free water, thereby significantly enhancing the load-bearing capacity. The shear stress at the solution–copper interface exhibits a substantial increase as the shear rate rises. This phenomenon originates from shear-driven migration of PA to the copper interface, disrupting the hydration layers and weakening hydrogen bonds. Consequently, this reduction in PA–water interactions amplifies slip velocity differences, ultimately elevating interfacial shear stress. The load-bearing capacity of the PA solution and the interfacial shear stress between the PA and copper are critical factors that influence the lubrication mechanism at the PA/Cu interface. This study establishes a theoretical foundation for the design and application of PA solution as a water-based lubricant, which holds significant importance for advancing the development of green lubrication technology.

Graphical Abstract

1. Introduction

Friction [1] is ubiquitous in daily life and exhibits both advantageous and disadvantageous effects. However, within industrial contexts, friction predominantly presents unfavorable consequence [2,3]. According to statistical data, in industrial applications, approximately 20% of energy consumption is attributed to overcoming friction [4]. Lubrication constitutes a critical component of tribology research. Typically, lubricants are employed to enhance the frictional condition of mating surfaces, thereby reducing frictional resistance and mitigating wear, thus, achieving effective lubrication [5]. Currently, mineral oil-based lubricants [6,7] are predominantly employed in mechanical systems to mitigate friction and wear, thereby enhancing machine performance and longevity while reducing energy consumption [8,9].
Nevertheless, the annual discharge of a substantial quantity of oil-based lubricants into the environment poses significant risks to human health and ecological systems due to their non-biodegradable nature [10,11]. Additionally, concerns over oil depletion and the impending energy crisis have constrained the production of mineral oil-based lubricants [12]. Consequently, there is an increasing impetus to develop environmentally friendly, water-based lubricants [13,14,15,16] as viable alternatives. Water-based lubricants, owing to their advantages of abundant resources, low cost, and compliance with environmental protection requirements, are extensively utilized in metal processing operations such as cutting, grinding, drawing, and rolling, as well as in hydraulic transmission applications [17]. They are progressively substituting oil-based lubricants. Nevertheless, water-based lubricants exhibit certain limitations [18], including significant corrosiveness [19] and inadequate viscosity [20], which compromise the load-bearing capacity of the lubricating film. Therefore, it is imperative to select appropriate additives for water-based lubricants to address these challenges [21]. Phytic acid [22] (PA), also referred to as inositol hexaphosphate [23], is a naturally occurring polyphosphorylated carbohydrate found in various plant sources such as sesame, beans, corn, wheat bran, and brown rice. It has been demonstrated to be non-toxic to both humans and the environment. A PA molecule contains 6 phosphate groups, so it has a strong chelation ability, and it can produce insoluble compounds with metal ions deposited on the metal surface, thus, providing corrosion resistance [24,25,26,27,28]; a PA molecule also contains 12 hydroxyl groups, which can be used as hydrogen bond donors or acceptors to form strong hydrogen bonds with water molecules and form the hydrogen bond network inside the solution. Chen [18] et al. employed a PA solution to lubricate the surface of copper. When the mass fraction of PA in the solution reached 20%, the friction coefficient on the copper surface stabilized below 0.1, demonstrating excellent lubrication performance. This indicates that PA serves as an effective lubricating additive for water-based machinery. However, the specific lubrication mechanisms of PA lubricants and the synergistic effects between PA molecules and other molecules remain poorly understood. Therefore, this paper employs molecular dynamics simulation [28,29,30,31] to investigate these mechanisms from a more microscopic perspective. Given that copper alloys are commonly employed as sliding mechanical components, such as spindle drives in mechanical systems [32,33], lubrication is essential to minimize friction and wear. Therefore, this study continues to select copper as the base material to investigate the lubrication mechanism of PA. When employing molecular dynamics simulations to investigate the lubrication mechanisms of lubricants, the advantages of molecular dynamics are leveraged to elucidate the interaction mechanisms between water-based lubricants and copper interfaces across a broader spectrum of pressure and velocity conditions.

2. Model Establishment and Simulation Details

All calculations are based on the equilibrium molecular dynamics simulation in Materials Studio 2020 (MS). The Visualizer, Amorphous Cell modeling module and Forcite computing module of Materials Studio molecular simulation software are used to complete the research. The COMPASS III force field is utilized to model the interactions between atoms and molecules. The COMPASS force field [34,35,36,37] is a comprehensive computational framework developed from first principles, capable of predicting properties of both gaseous and condensed phases simultaneously. It finds extensive application in both organic and inorganic systems, providing a unified approach to describe diverse material systems. Moreover, it can accurately represent mixtures of these systems.
Using the Visualizer and Amorphous Cell modules in Materials Studio, bulk phase models of PA solutions with varying mass fractions (10%, 15%, 20%, and 30%) were constructed, as illustrated in Figure 1c. Subsequently, the confining pressure was established at standard atmospheric pressure (0.1 MPa) and the temperature was maintained at room temperature (298 K). A molecular dynamics equilibrium simulation of 500 ps was conducted under the NPT ensemble to ensure adequate time for the structural equilibration of the model, thereby obtaining a stable density value. In assessing whether the MD simulation has achieved equilibrium, two primary criteria are considered: first, minimal temperature fluctuation, and second, minimal energy fluctuation. Both should exhibit constancy or slight oscillations around a constant value. Typically, fluctuations in temperature and energy within 5% to 10% of their mean values indicate that the system has reached equilibrium. Figure 2a,b demonstrates that both temperature and energy variations in the system are within this range, suggesting that a simulation duration of 500 ps is adequate for the system to attain equilibrium. The average of the latter half of the simulation data was adopted as the final equilibrium density. Upon establishing the liquid layer of the confined shear model, the model is subsequently constructed based on the density derived from the bulk phase model. The physical property parameters and specific compositions of each model are detailed in Table 1.
To investigate the load-bearing and lubrication mechanisms of PA solution on copper surfaces, copper specimens measuring 3.98 nm × 3.98 nm × 2.17 nm were selected as the upper and lower friction pairs in the confined shear model. The constructed confined shear model is illustrated in Figure 3. When developing the confined shear model, we utilized the experimental model illustrated in Figure 4 as a reference. In order to obtain the global and local minimum energy configurations, eliminate the irrational structure and reduce the internal stress, it is essential to perform geometric optimization and dynamic relaxation of the initial configuration. The upper and lower friction pairs were secured, and the intermediate liquid layer was optimized using a sequential geometric optimization approach that combined the steepest descent method and the conjugate gradient method. The maximum number of iterations was set to 105. Then, the molecular dynamics simulation of 500 ps was performed at room temperature (298 K) and NVT standard ensemble condition, so that the liquid layer in the model could further reach a stable state.
The compression simulation and confined shear simulation were conducted under the NVT ensemble, with the temperature maintained at room temperature. An external force was applied to the top copper layer, as illustrated in Figure 3b. The compression simulation was performed at pressure conditions of 0 MPa, 200 MPa, 400 MPa, 600 MPa, and 800 MPa for a duration of 500 ps. The conformation of the final frame from the compression simulation model, subjected to a normal load of 400 MPa, is utilized as the initial configuration for the subsequent confined shear simulation analysis. Shear velocities of equal magnitude but opposite directions are applied to the upper and lower layers of copper atoms along the X-axis, respectively, as illustrated in Figure 3c. The shear velocities were set at 0.1 Å/ps, 0.7 Å/ps, 1.0 Å/ps, 3.0 Å/ps, and 5.0 Å/ps, respectively. A simulation time of 500 ps was chosen to ensure that the model achieved a sufficiently long relative slip distance during the simulation period. The time step of the above molecular dynamics calculation process is set at 1fs and the cutoff radius is 12.5 Å. The atom-based method is used for the calculation of the van der Waals force, the Ewald method is used for the calculation of electrostatic force, and the Andersen algorithm for temperature control and Berendsen algorithm for pressure control.

3. Results and Discussion

3.1. Bearing Mechanism of PA Solution Under Different Normal Loads

3.1.1. Alteration in Compressibility

At the microscopic scale, liquid water exhibits compressibility [38]. When subjected to pressure, the thickness of the liquid layer initially decreases before stabilizing at a constant value. This change in thickness serves as an indicator of the liquid layer’s response to external pressure. The thickness of the liquid layer under varying pressures was calculated, and the average value of the latter half of each simulation dataset was adopted as the final thickness. This process yielded the variation rule of liquid layer thickness across four groups of confined models. Given that the initial thicknesses of the liquid layers differed, the compression ratios for each concentration were computed, as illustrated in Figure 5. As the concentration of PA molecules in the solution increases, the overall compression rate of the liquid layer gradually decreases. The greater the number of PA molecules in the solution model, the more difficult it becomes to compress the liquid layer. In this paper, we utilize the thickness compression as a metric to characterize the solution’s bearing capacity. Under identical external pressure conditions, a smaller thickness compression indicates a stronger bearing capacity of the solution. This enhanced resistance to compression improves the load-bearing capacity of the liquid layer and consequently enhances the overall bearing capacity of the solution.

3.1.2. Formation of Hydrated Molecules

The formation of hydration molecules between PA molecules and water molecules can be characterized by calculating the hydrogen bonding between PA molecules and water molecules. The hydration molecular layer constitutes a dynamic interfacial layer that is formed via hydrogen bonding interactions between PA and water molecules. As illustrated in the schematic diagram of the PA molecular structure depicted in Figure 1a, the abundance of hydroxyl groups surrounding the PA molecule significantly enhances its hydrophilicity and positively influences the formation of hydrated molecules. In order to explore the strength of this hydrogen bond, OP and OW (hydrogen bond donor and acceptor atoms in PA molecule and water molecule, respectively) were taken as research objects, and the radial distribution function (RDF) curves of OP-OW under different pressures were drawn for the four groups of solution models in the compression simulation process, as shown in Figure 6. The radial distribution function is defined as the probability of finding B particle at the distance r from A particle centered on A particle, which represents the distribution density of one particle in the spatial structure around another particle. The calculation formula is as follows:
g ( r ) = d N 4 π ρ 2
where d N is the number of B particles whose distance from particle A is r to r + d r , and ρ is the average density of particle B .
The maximum interaction length of a hydrogen bond typically ranges from 3 to 3.5 Å. If the first peak in the radial distribution function curve appears within this range, it indicates that a hydrogen bond has formed between the two molecules. Under all pressure conditions, two distinct peaks were observed at approximately 2.6 Å and 5 Å across all four model groups, with the peak at 2.6 Å being particularly pronounced, indicative of hydrogen bonding. Therefore, focusing on the first peak value as the primary subject of analysis, it can be inferred that during the simulation of the confined model, PA molecules form hydrogen bonds with surrounding water molecules, thereby aggregating free water molecules and, subsequently, forming hydrated complexes.
By analyzing the first peak value, it is observed that the position of this peak in the RDF curve remains relatively stable as pressure increases. This suggests that hydrated molecules are not easily compressed during the compression process. It can be inferred that the compressible portion of the solution consists primarily of the relatively loose free water molecular layer outside the hydration shell. As the concentration of PA molecules in the solution increases, the volume of the free water molecular layer decreases. As illustrated in Figure 6d, when the mass fraction of PA reaches 30% and pressure continues to increase, the first peak value of the RDF exhibits less significant changes compared to solutions with other concentrations. This suggests that solutions with higher PA concentrations possess a thicker hydration layer and are less compressible. It is evident that PA and the surrounding water molecules form hydrated complexes via hydrogen bonding. Multiple such hydrated complexes are adsorbed onto the surface of the copper atomic layer, forming a stable hydrate layer that serves as a supporting structure, as illustrated in Figure 6e.

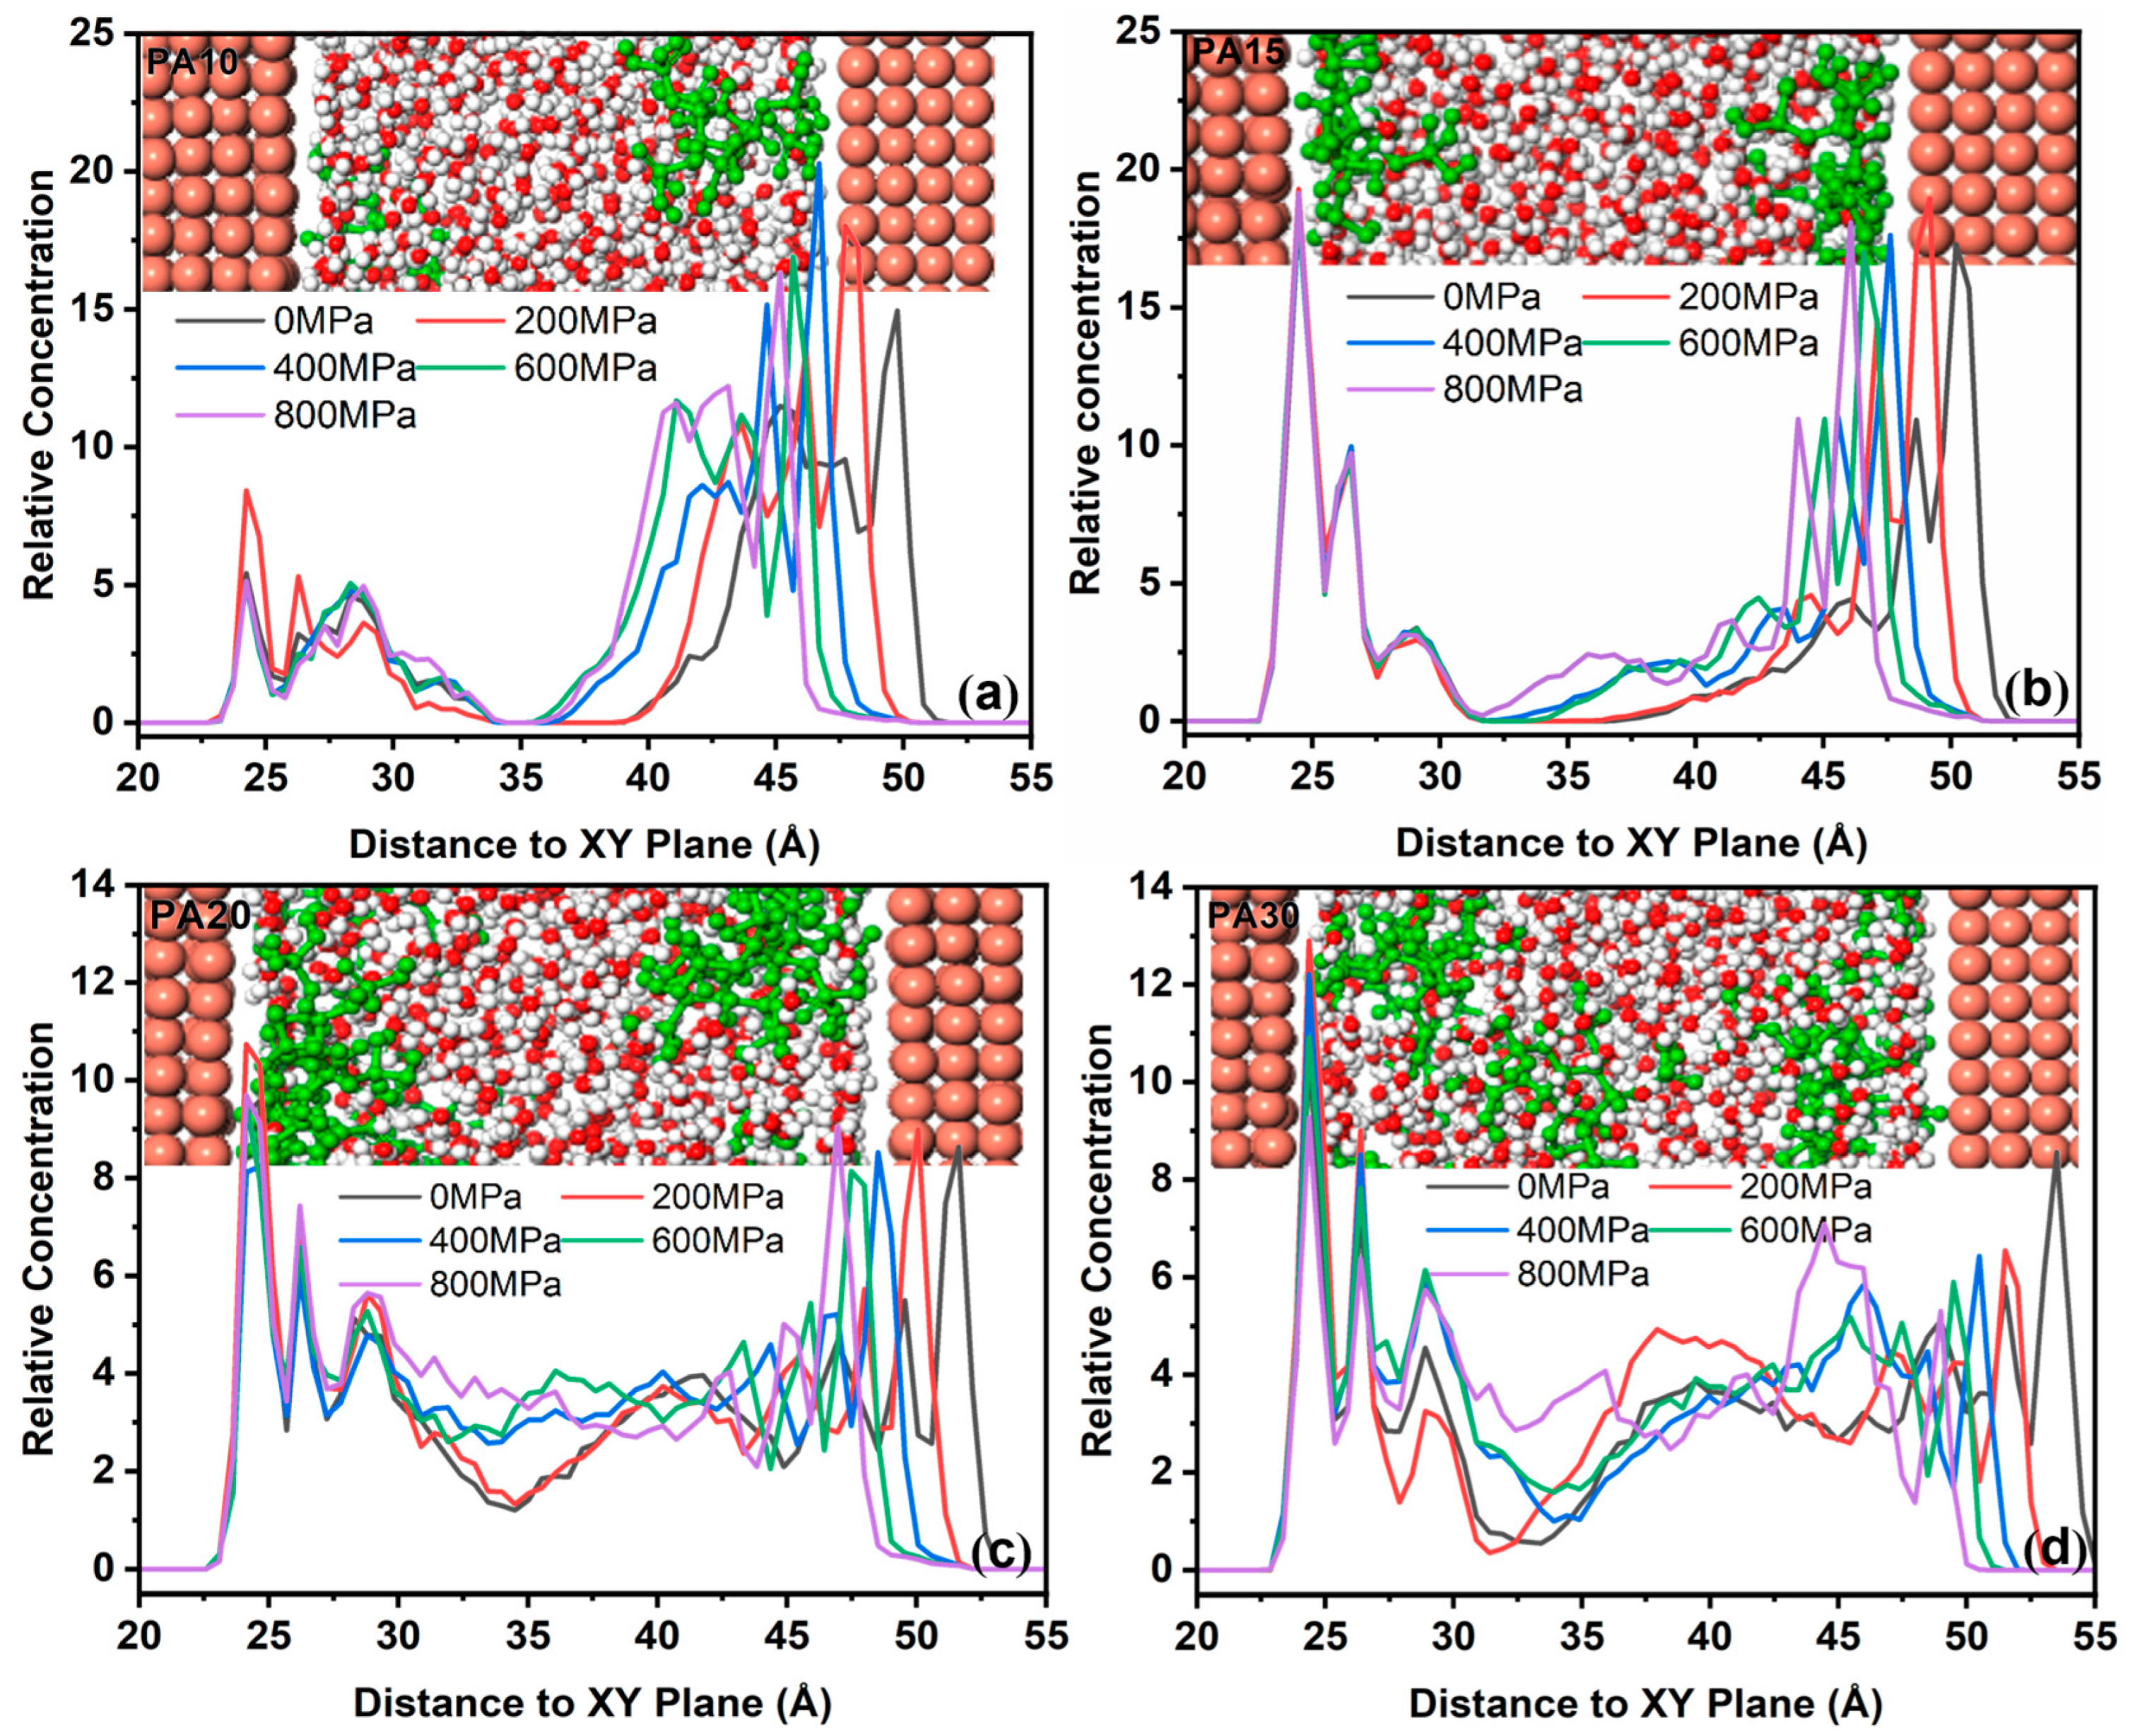
3.1.3. Spatial Distribution of PA Molecules in Solution

To investigate the distribution of PA molecules on the surface of copper, the relative concentration of oxygen atoms in PA molecules along the Z-axis was calculated for four distinct model groups during the compression simulation. The results, as illustrated in Figure 7, depict both the adsorption of PA molecules on the copper atomic layer and their distribution within the intermediate layer. During the compression simulation, a significant proportion of PA molecules were adsorbed onto the surface of the copper atomic layer. Consequently, the relative concentration distribution of oxygen atoms in proximity to the copper surface exhibited a pronounced peak. The PA molecule, which is distributed on the surface of the copper atomic layer, possesses a unique structure containing six phosphate groups and twelve hydroxyl groups. This structure enables it to chelate with copper atoms, forming stable complexes that effectively prevent corrosion on the copper surface. Additionally, the efficient adsorption of PA on the copper surface leads to the formation of a lubricating film. This film prevents direct contact between the rough surfaces of the friction pair, thereby providing lubrication during the friction process. Moreover, PA molecules attract neighboring free water molecules via hydrogen bonding to form hydrated complexes. These hydrated complexes are subsequently adsorbed onto the surface of the copper atomic layer, along with the PA molecules, forming a relatively dense hydration layer. As the concentration of PA increases, the thickness of the hydration layer also increases. Consequently, this layer becomes less compressible, thereby enhancing its load-bearing capacity.

3.2. Lubrication Mechanism of Phytic Acid Solution at Different Shear Rates

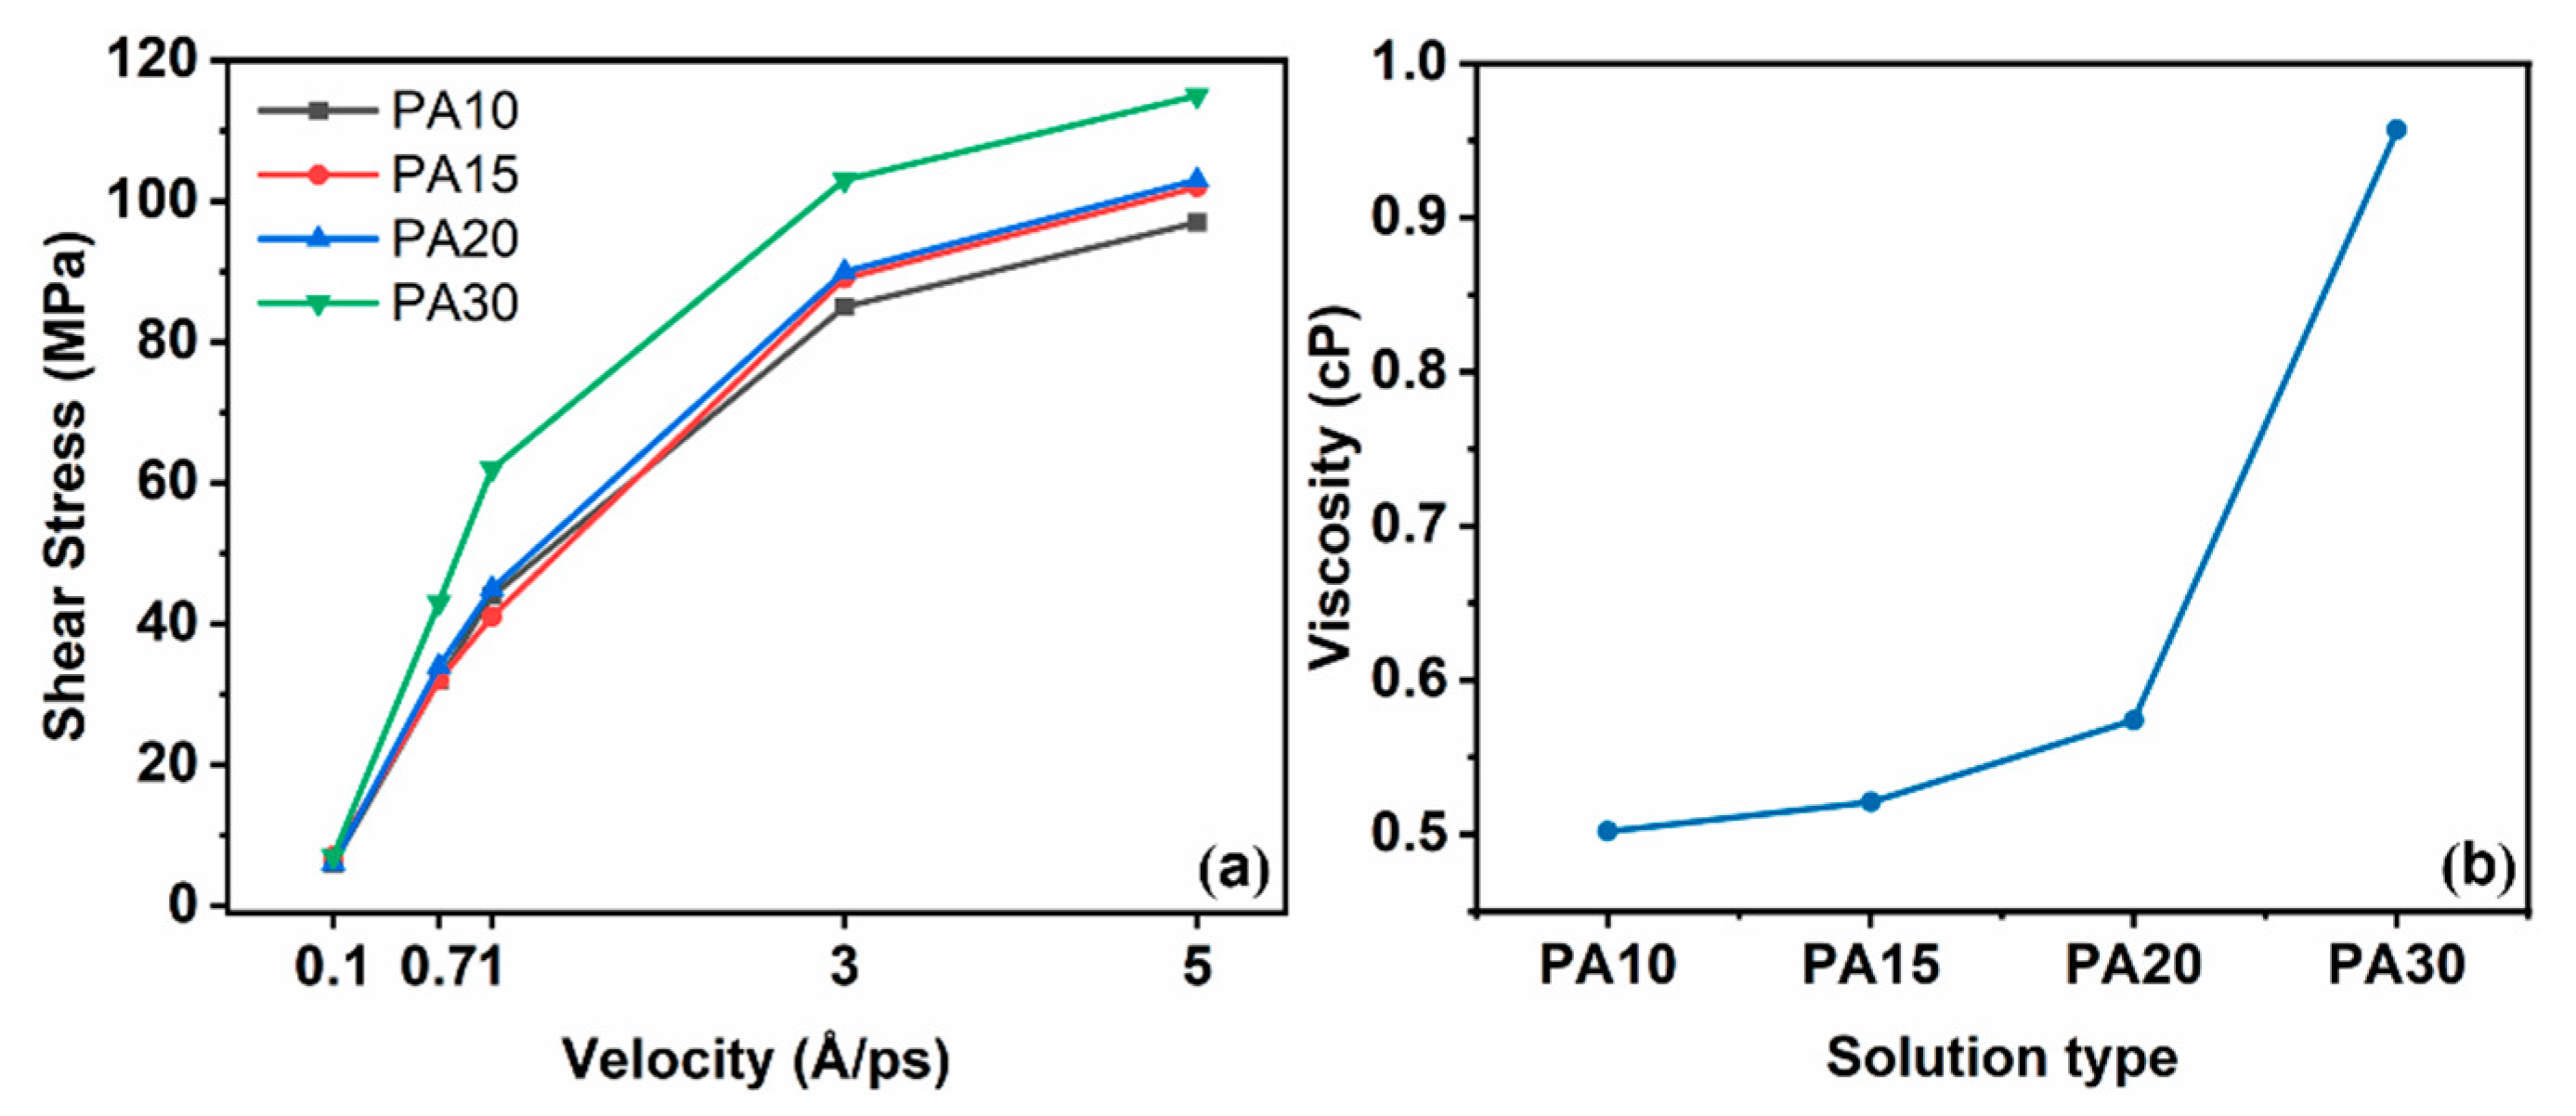
3.2.1. Relationship Between Shear Stress and Shear Rate

The magnitude of the interfacial shear stress was determined through confined shear simulations. In this paper, the shear stress is the tangential force parallel to the contact interface between PA solution and copper. Figure 8a illustrates the variations in shear stress across different models at various shear velocities. It is evident that an increase in shear velocity corresponds to a proportional increase in shear stress. At low shear rates (0.1 Å/ps, 0.7 Å/ps, 1.0 Å/ps), the shear stress of the solution exhibited minimal variation with respect to the molecular concentration of PA when the mass fraction was 10%, 15%, and 20%. However, at all tested velocities, the shear stress of the solution containing a 30% mass fraction of PA showed a significant increase compared to solutions with lower PA concentrations. To elucidate this phenomenon, the dynamic viscosity of the PA solution was calculated, and the results are presented in Figure 8b. As the concentration of PA increased, the dynamic viscosity of the solution progressively rose, which ultimately resulted in an increase in shear stress within the solution. According to the previous analysis, it can be concluded that the number of PA molecules in the model is too small, and the liquid layer is not conducive to the bearing capacity, which will lead to the direct contact of friction pairs during the actual friction process, resulting in the increase in friction. The excessive number of PA molecules increases the dynamic viscosity of the solution, which is not conducive to shear, resulting in increased shear stress. Hence, when assessing the concentration of PA in the lubricant, it is imperative to take into account the solution’s load-bearing capacity as well as the impact of its dynamic viscosity on the lubrication performance.

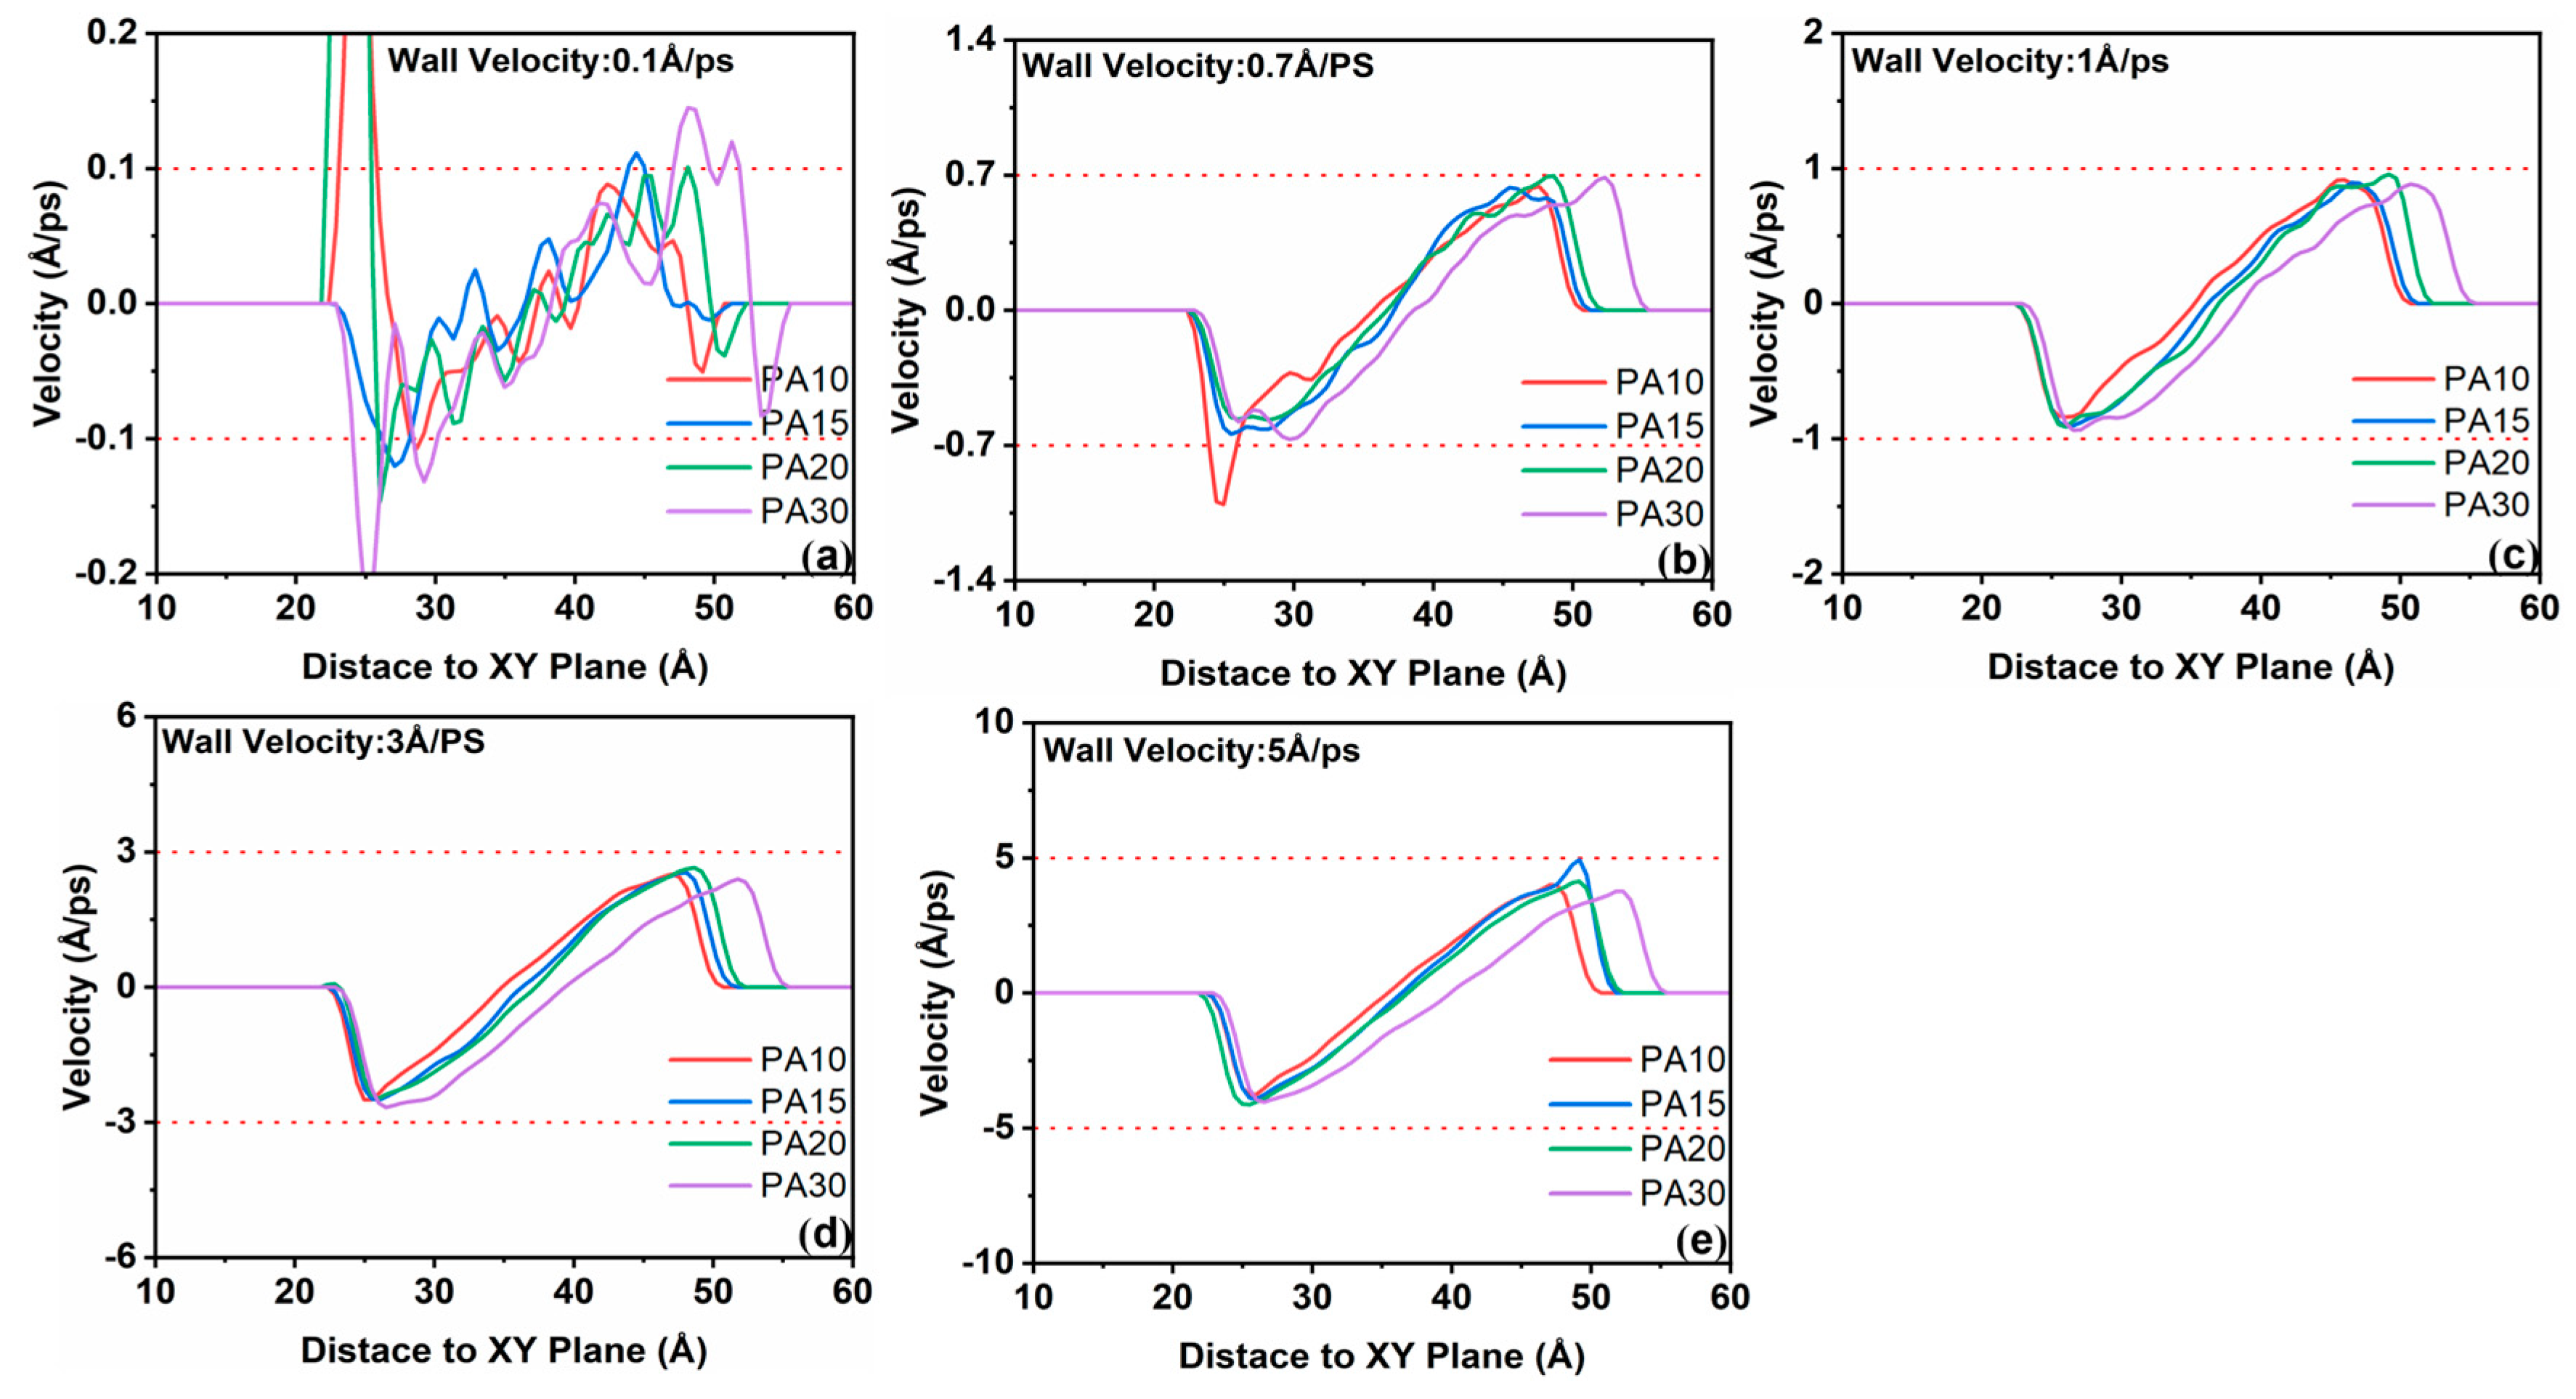
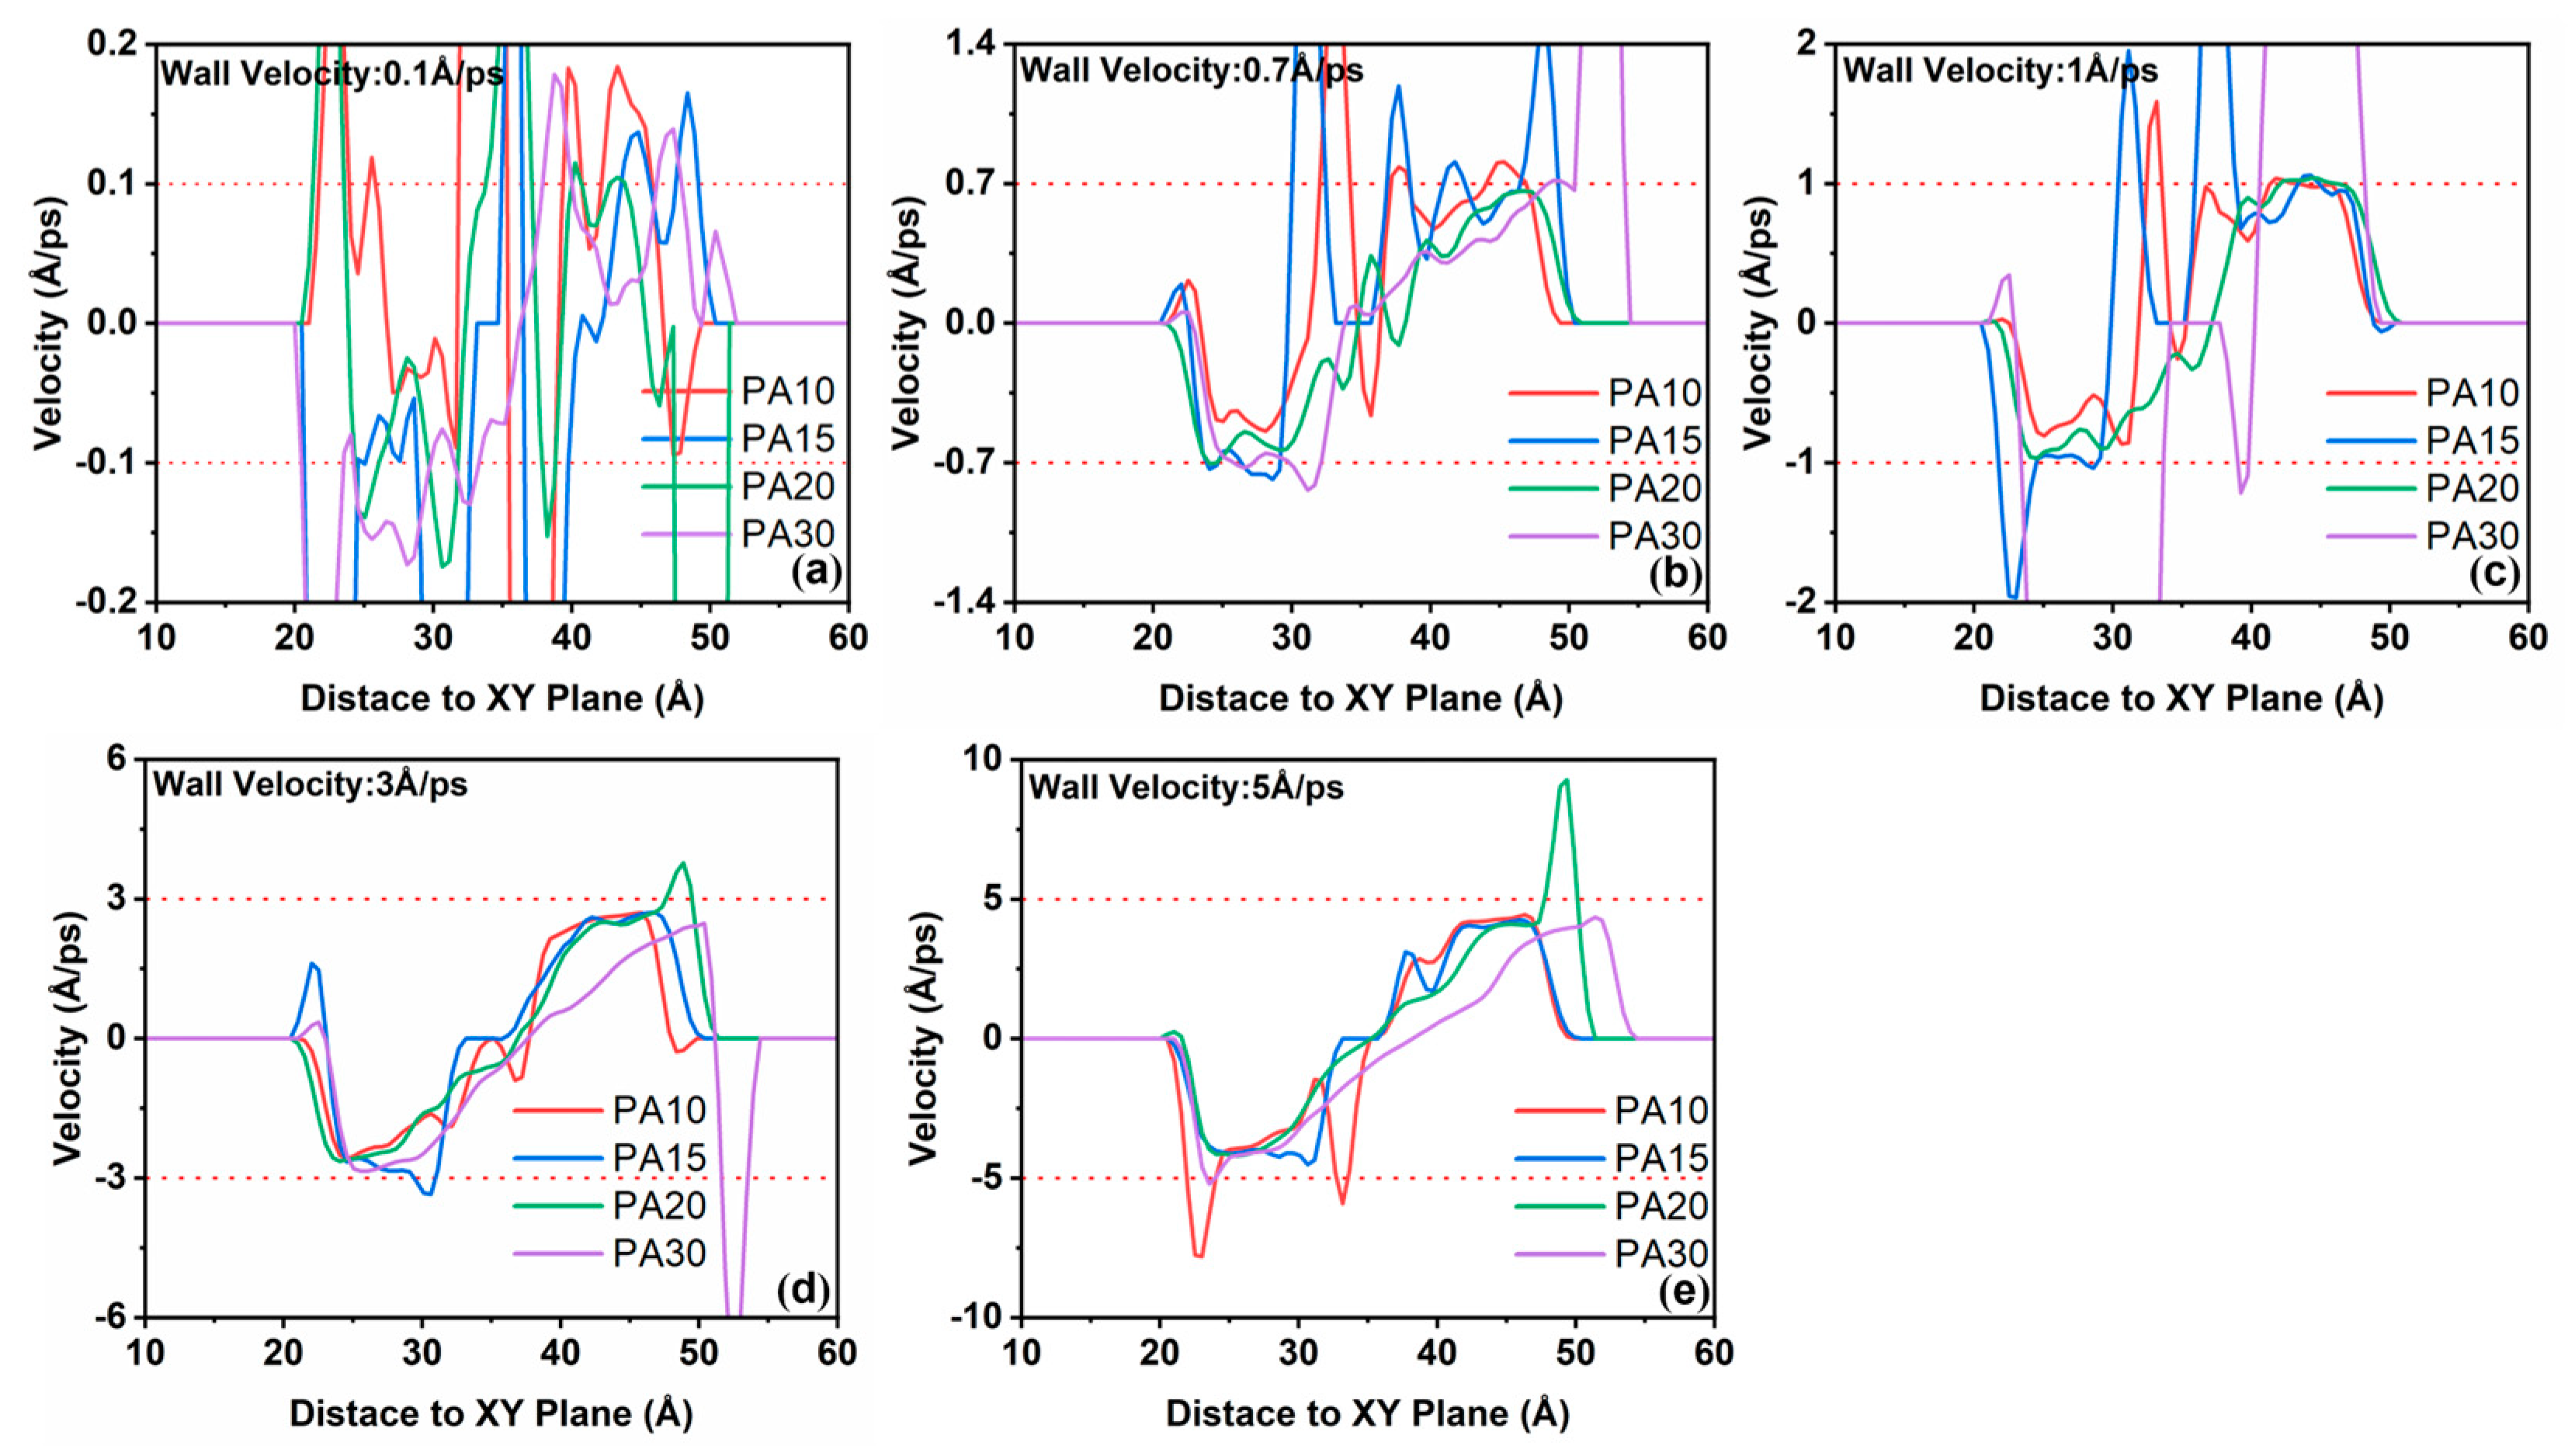
3.2.2. Influence of Velocity Difference Between Water and PA Molecules on Shear Stress

From the above analysis, it is evident that the shear stress in each model exhibits a significant increase as shear velocity rises. In this study, we examined the velocity distribution of molecules adjacent to the copper atomic layer. Specifically, the longitudinal distribution curves of the translational velocities of OW and OP atoms were utilized to characterize the motion of water molecules and PA molecules.
Under varying shear rates, the longitudinal distribution curves of the average translational velocity of OW atoms in each model are presented in Figure 9. The reference line in the figure denotes the velocity of the copper atomic layer. The vertical distance between each point on the curve and its corresponding position on the reference line indicates the velocity difference between water molecules and the copper atomic layer at that specific location. Points on the curve that are closer to the reference line signify a smaller velocity difference between water molecules and the copper atomic layer at that position, whereas points farther from the reference line indicate a larger velocity difference. The analysis reveals that as the position approaches the central region of the liquid phase layer, the velocity difference between water molecules and the copper atom layer becomes more pronounced. Simultaneously, with an increase in shear velocity, the velocity difference between water molecules and the copper atom layer becomes significantly larger, resulting in a smoother curve. Therefore, apart from the water molecules adjacent to the surface of the copper atomic layer, a significant velocity difference is observed between the water molecules in other regions, particularly those near the midsection of the liquid layer, and the copper atomic layer. This velocity difference increases with the shear velocity.
The velocity distribution of PA molecules is one of the important factors affecting the shear stress, which can reflect the distribution of PA molecules in solution during confined shear from another aspect. Under varying shear rates, Figure 10 illustrates the longitudinal distribution curve of the average velocity of OP atoms within PA molecules for each model. It is observed that the velocity difference between the PA molecules and the copper atomic layer is smaller compared to that between OW and the copper atomic layer, indicating a higher degree of synchronization between the PA molecules and the copper atomic layer. The strong adsorption effect of PA molecules on the copper atomic layer results in a close and stable association between PA molecules and the copper surface. During the confined shear simulation, PA molecules consistently move in synchrony with the copper atomic layer, indicating that a stable adsorption film of PA molecules forms on the copper surface. With the increase in shear velocity, the velocity of OP atom in the middle of the liquid layer of the model with PA mass fraction of 10% and 15% approaches to 0. The PA molecules originally distributed in the intermediate layer are pulled towards the copper atomic layer due to the increase in velocity, causing the PA molecules to be partially filled with water molecules. In contrast, in the solution with 20% and 30% PA mass fraction, the above phenomenon is not obvious due to the large number of PA molecules. Due to the significant velocity difference between water molecules and PA molecules, the water molecules initially adsorbed to PA molecules via hydrogen bonds are able to overcome the constraints imposed by the PA molecules and become free water molecules. This results in a reduction in the volume of hydrated PA molecules that play a bearing role in the solution. As the shear rate increases, the number of hydrogen bonds within the hydrated layer diminishes. This reduction leads to an increased velocity difference between the hydrated layer at the copper interface and the velocity at the center, consequently increasing the velocity gradient. According to the shear stress calculation formula [39]:
τ = μ d u d y
where τ is the shear stress, μ denotes the dynamic viscosity coefficient, and d u d y signifies the velocity gradient. It is evident that a greater d u d y results in higher shear stress.

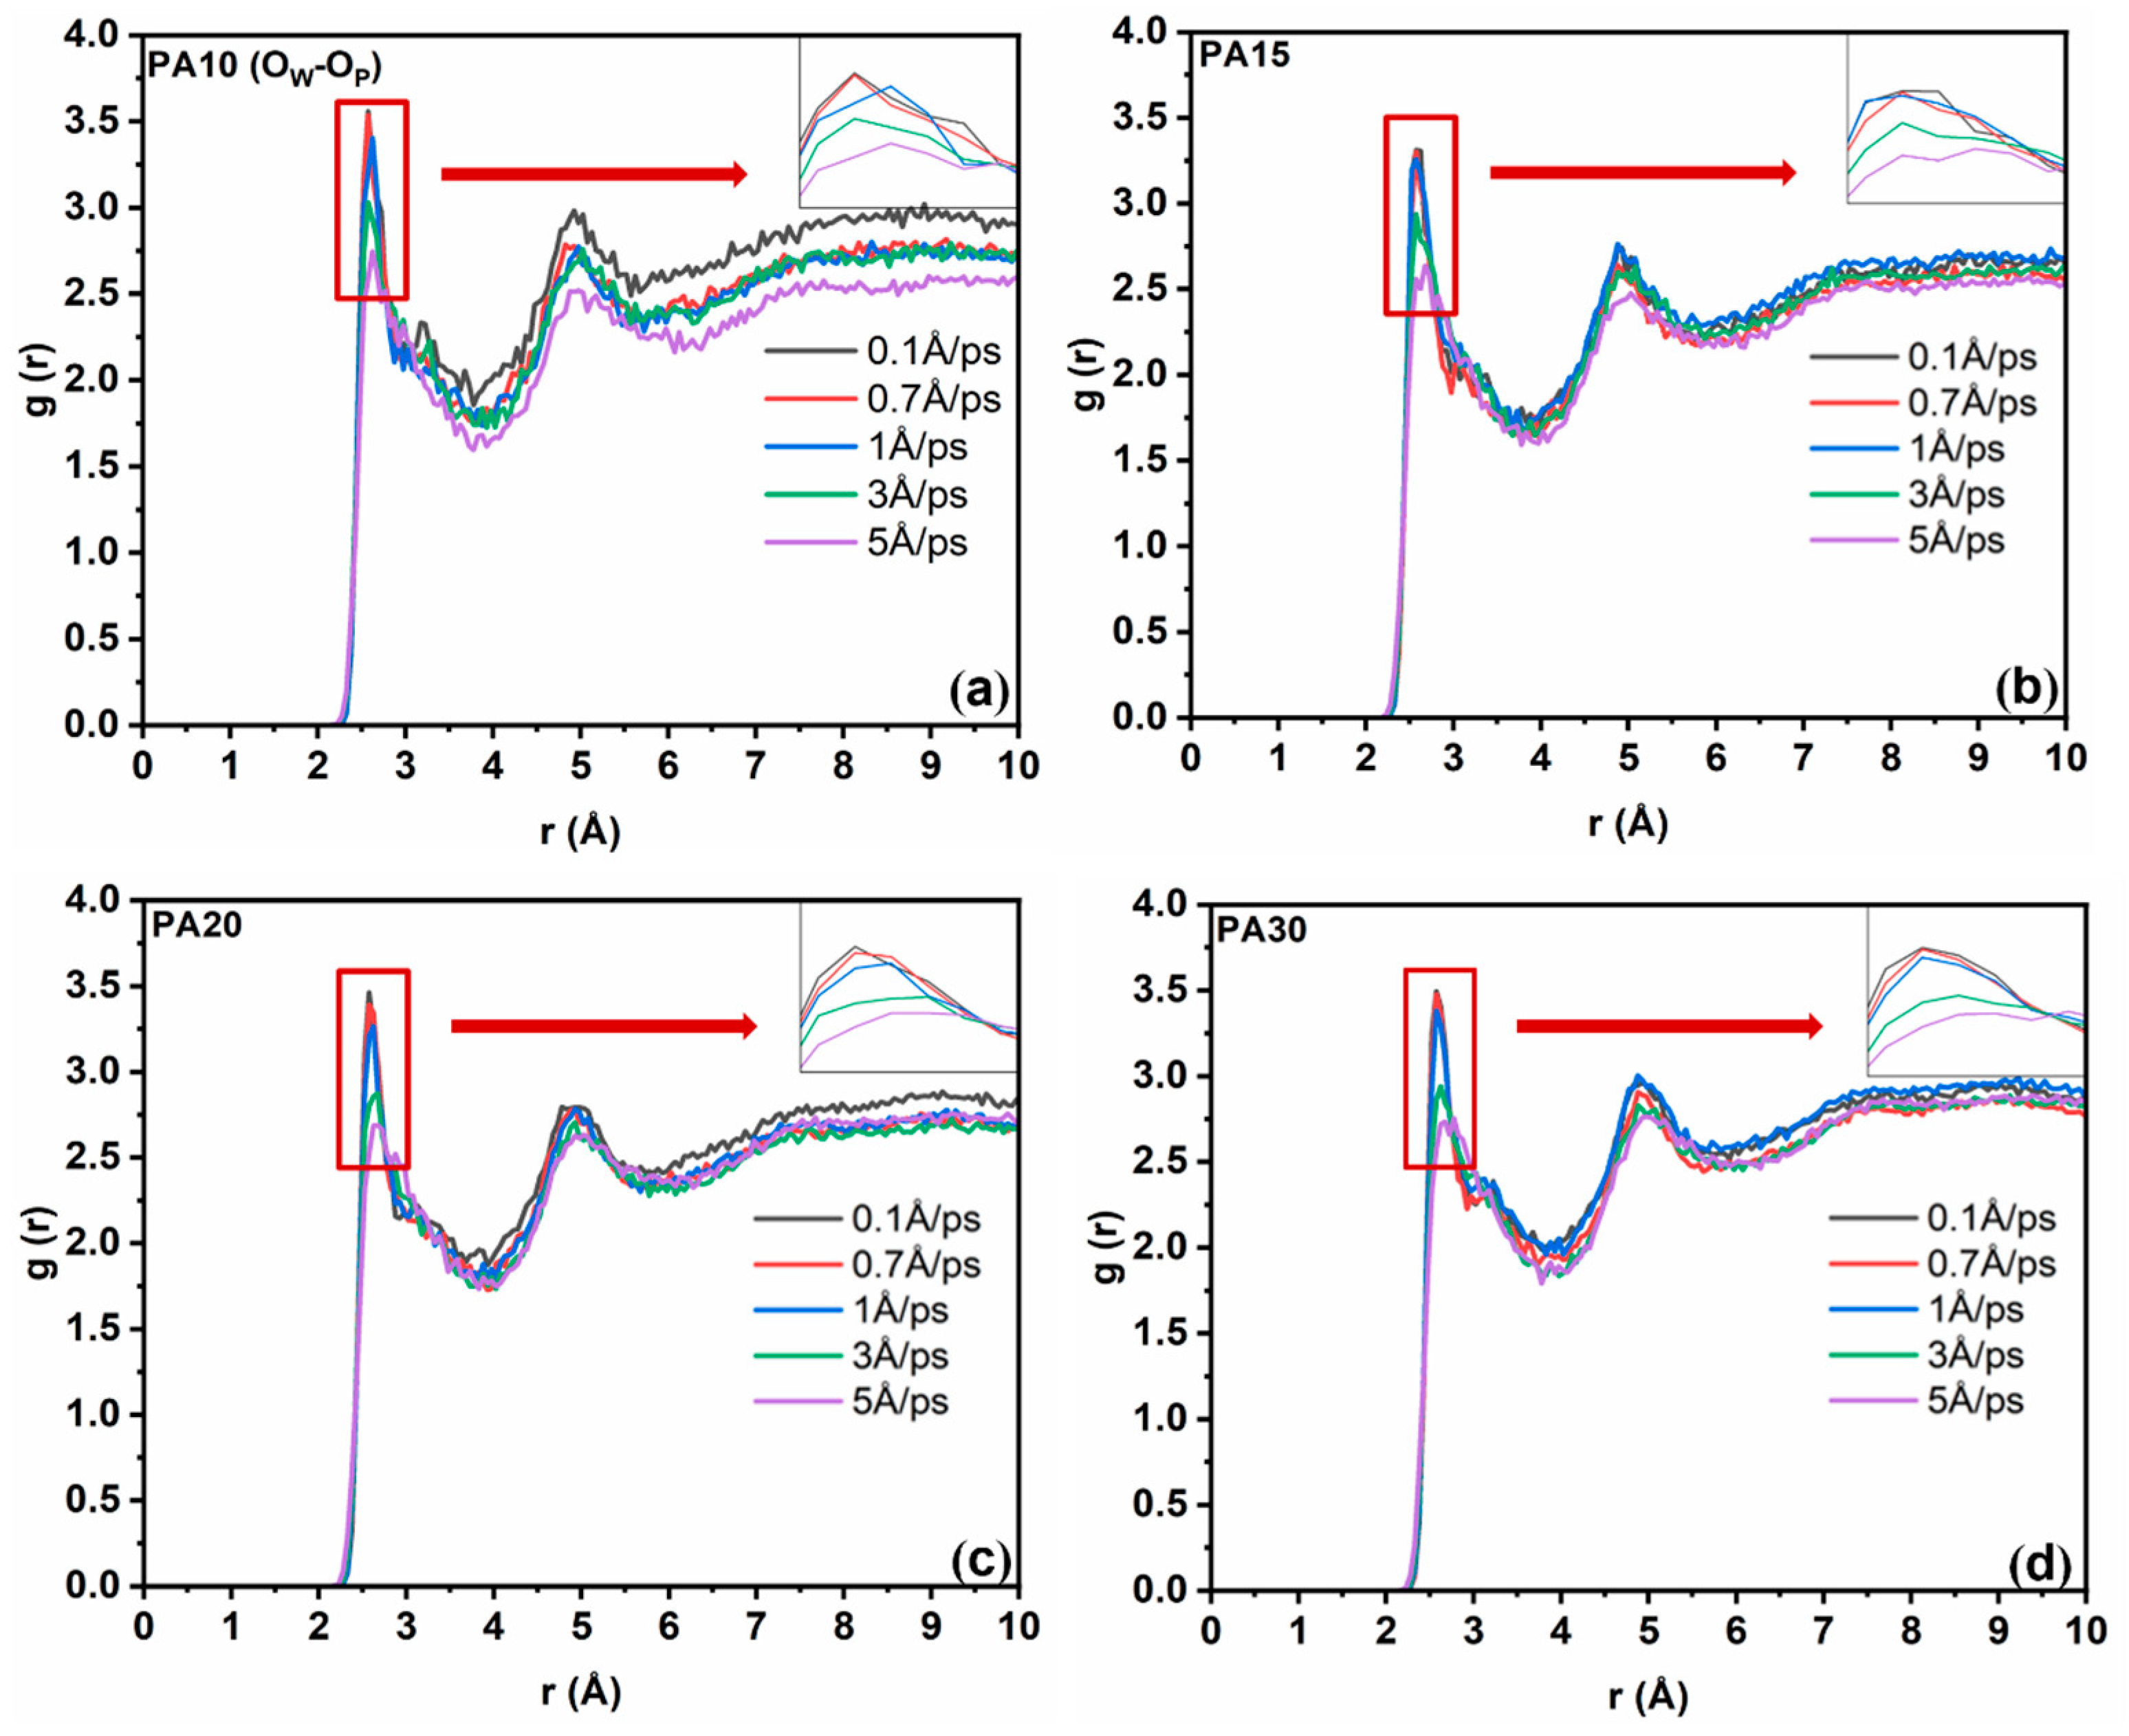
3.2.3. Influence of Confined Shear on Intermolecular Interactions Within the Liquid Layer

The strength of the interaction between PA molecules and water molecules is a critical factor influencing the rheological properties of PA solutions. This interaction, which manifests as hydrogen bonding between the molecules, can be quantitatively characterized through radial distribution functions and interaction energy calculations. The RDF curve of H-bond donor acceptor atom OP-OW during the confined shear simulation of four solution models is shown in Figure 11.
The magnitude of the first peak value of the RDF curve reflects the hydrogen bond strength in the solution. In all the four solution models, the magnitude of the first peak value of the RDF curve decreases with the increase in the shear rate, indicating that the hydrogen bond strength in the solution decreases with the increase in the shear rate. Based on the preceding analysis, it is observed that shear stress exhibits a positive correlation with increasing shear rate, whereas hydrogen bond strength within the solution demonstrates an inverse relationship with shear rate. Consequently, it can be inferred that there exists a negative correlation between shear stress and hydrogen bond strength; specifically, as hydrogen bond strength diminishes, shear stress correspondingly increases.
To further investigate the shear thinning effect of the PA solution, we calculated the interaction energy between PA molecules and water molecules during the simulation process. This analysis aims to explore how the strength of hydrogen bonds changes with varying shear rates, as illustrated in Figure 12a. Interaction energy is a measure of the interaction energy between different components in the mixed system, which can quantitatively characterize the interaction force between molecules, and its calculation formula is as follows:
E i n t = E F l u i d E W a t e r E P A
E i n t denotes the interaction energy, while E F l u i d signifies the total energy of the liquid layer within the confined shear model. E W a t e r and E P A correspond to the energies of the water molecule ensemble and the PA molecule ensemble in the liquid layer, respectively. As illustrated in Figure 12a, as the concentration of PA molecules in the solution increases, the interaction between PA molecules and water molecules becomes progressively stronger (in terms of absolute value). Across various shear rates, the interaction for all four model groups consistently decreases with increasing shear rate. It is evident that as the number of PA molecules increases, the strength of internal hydrogen bonds progressively intensifies. Additionally, an increase in shear rate leads to a pronounced shear-thinning effect. This phenomenon results in a reduction in the viscoelastic properties of the PA solution as shear rate increases, thereby diminishing its load-bearing capacity and elevating shear stress.
At the same time, we also computed the interaction energy between the PA solution and the copper interface, with the results presented in Figure 12b. The calculation formula is presented as follows:
E i n t = E t o t a l E F l u i d E C u
E i n t denotes the interaction energy between the PA solution and the copper interface, while E t o t a l signifies the total energy of the entire confined shear model. E F l u i d refers to the energy of the solution within the confined shear model, E C u correspond to the energy of copper metal in the confined shear model.
The interaction energy between the PA solution and the copper surface decreases as the shear rate increases; however, this trend is less pronounced compared to the decrease in interaction energy between PA molecules and water molecules with increasing shear rate. Consequently, the primary reason for the increase in interfacial shear stress between the PA solution and copper as the shear rate increases is the weakening of the interaction between PA molecules and water molecules. This reduction in interaction leads to an increased velocity gradient between the two phases, which ultimately manifests as an elevation in shear stress.

4. Conclusions

In this study, through molecular dynamics simulation, the bearing mechanism of phytic acid water-based lubricant on the surface of copper under different normal pressure loads and lubrication mechanism under different shear rate loads were systematically discussed, and the following conclusions were drawn:
(1)
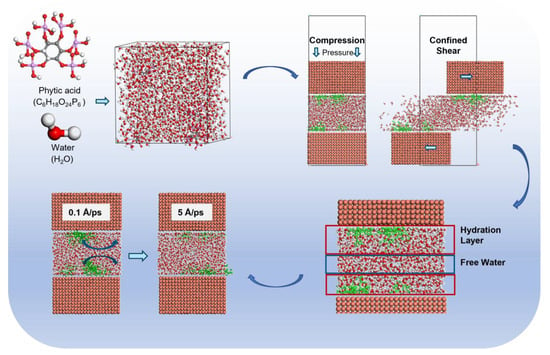
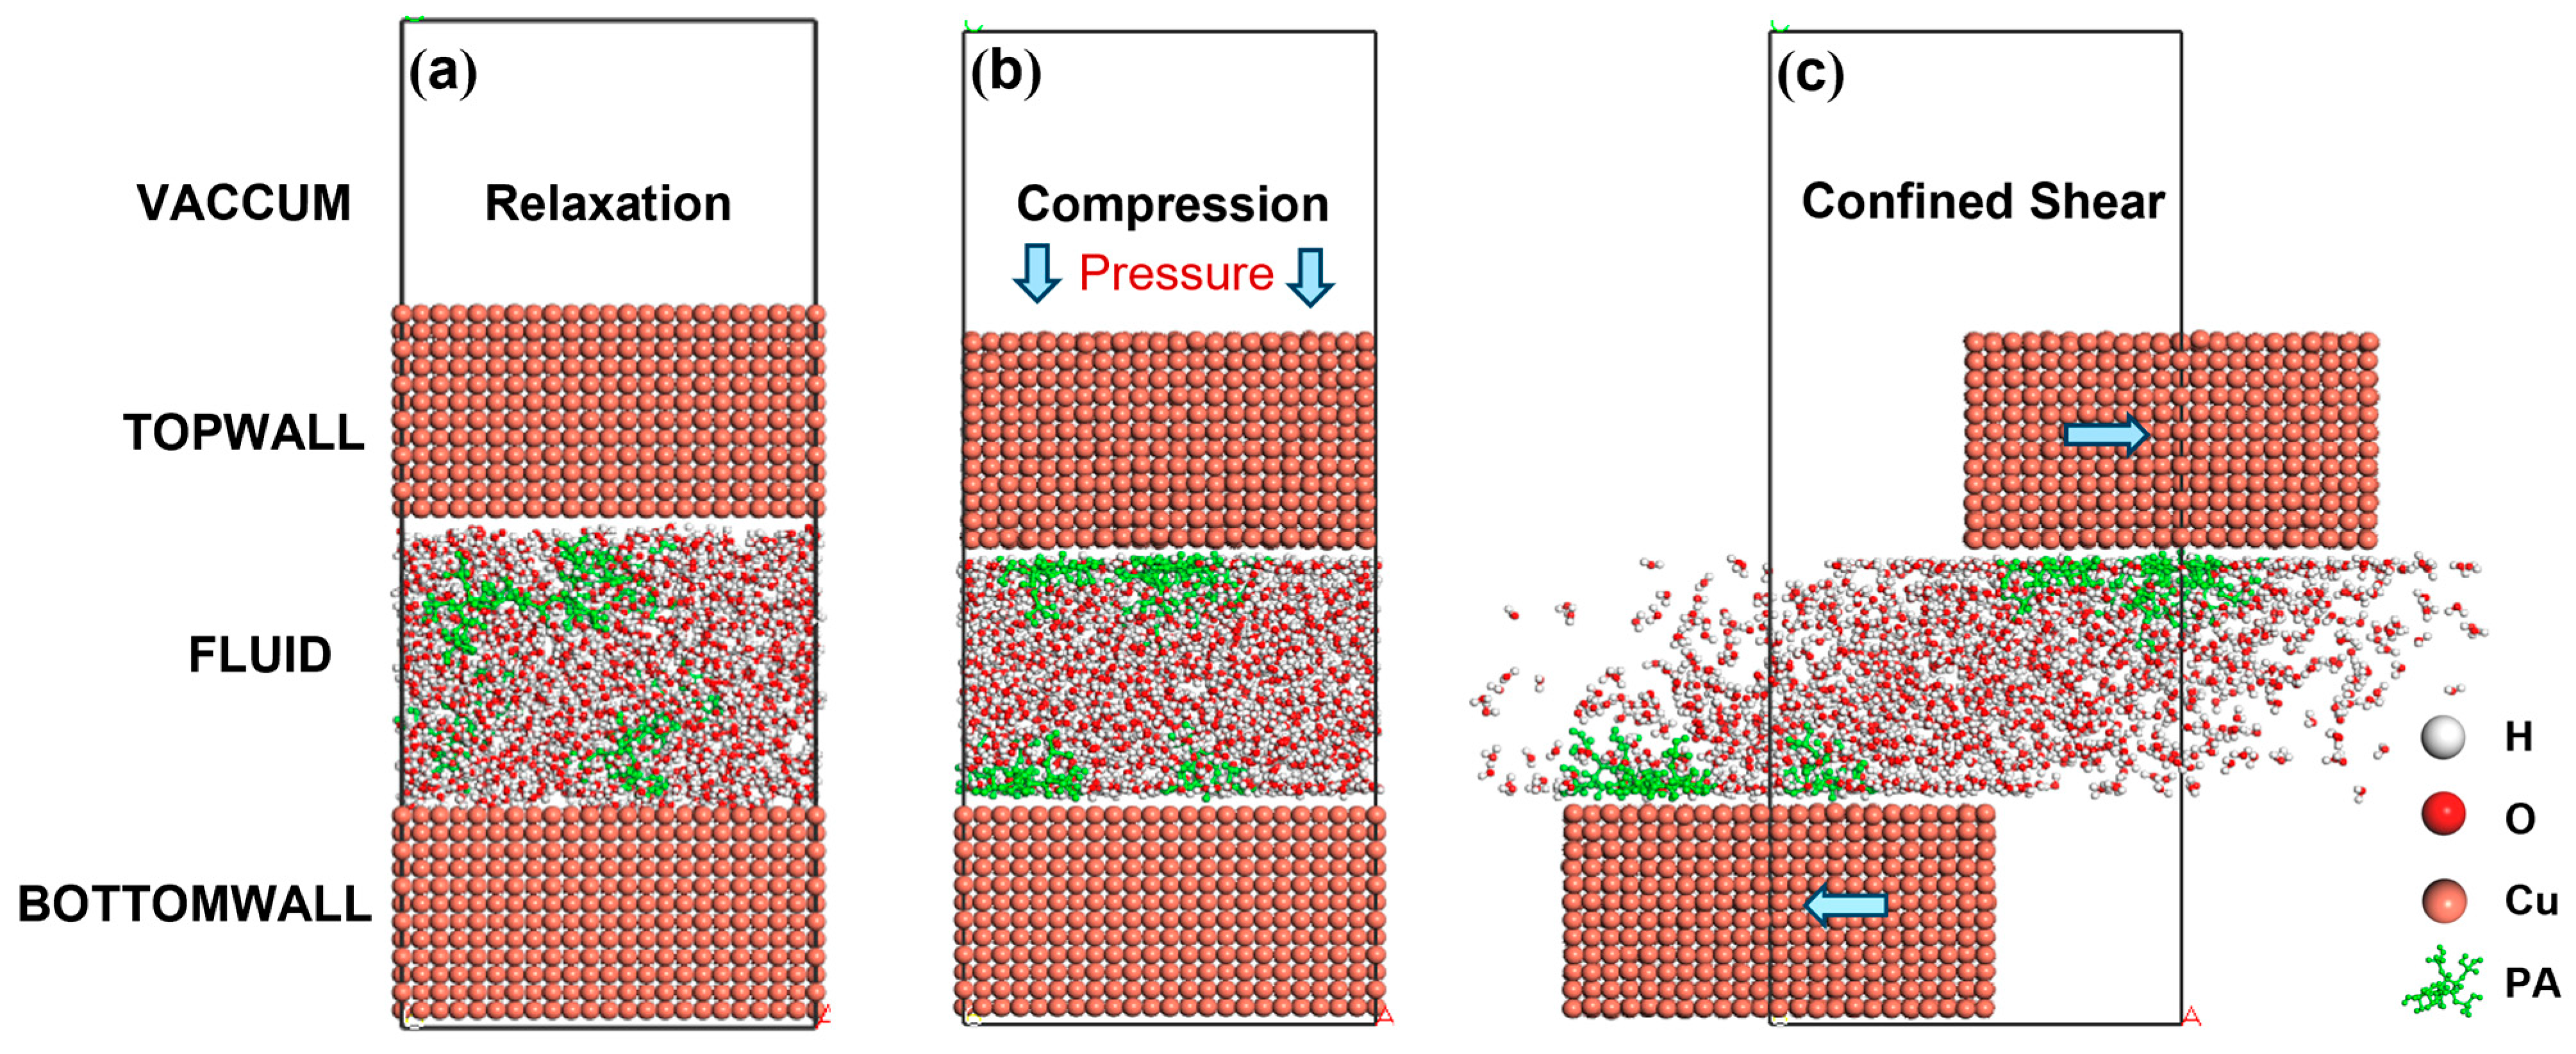
In PA solution, the compressibility of the liquid layer is negatively correlated with the number of PA molecules. This phenomenon occurs because PA molecules can adsorb tightly onto the surface of the copper atomic layer, forming a stable hydration layer through hydrogen bonding with water molecules. Consequently, in the liquid phase layer, a distribution pattern of PA hydration layer-free water–PA hydration layer emerges. In the compression simulation process, the layer of free water molecules is compressed due to the stable interaction between PA molecules and water molecules. An increase in the number of PA molecules results in a thicker hydration layer within the liquid phase, making it more resistant to compression. Consequently, the compression rate is reduced;
(2)
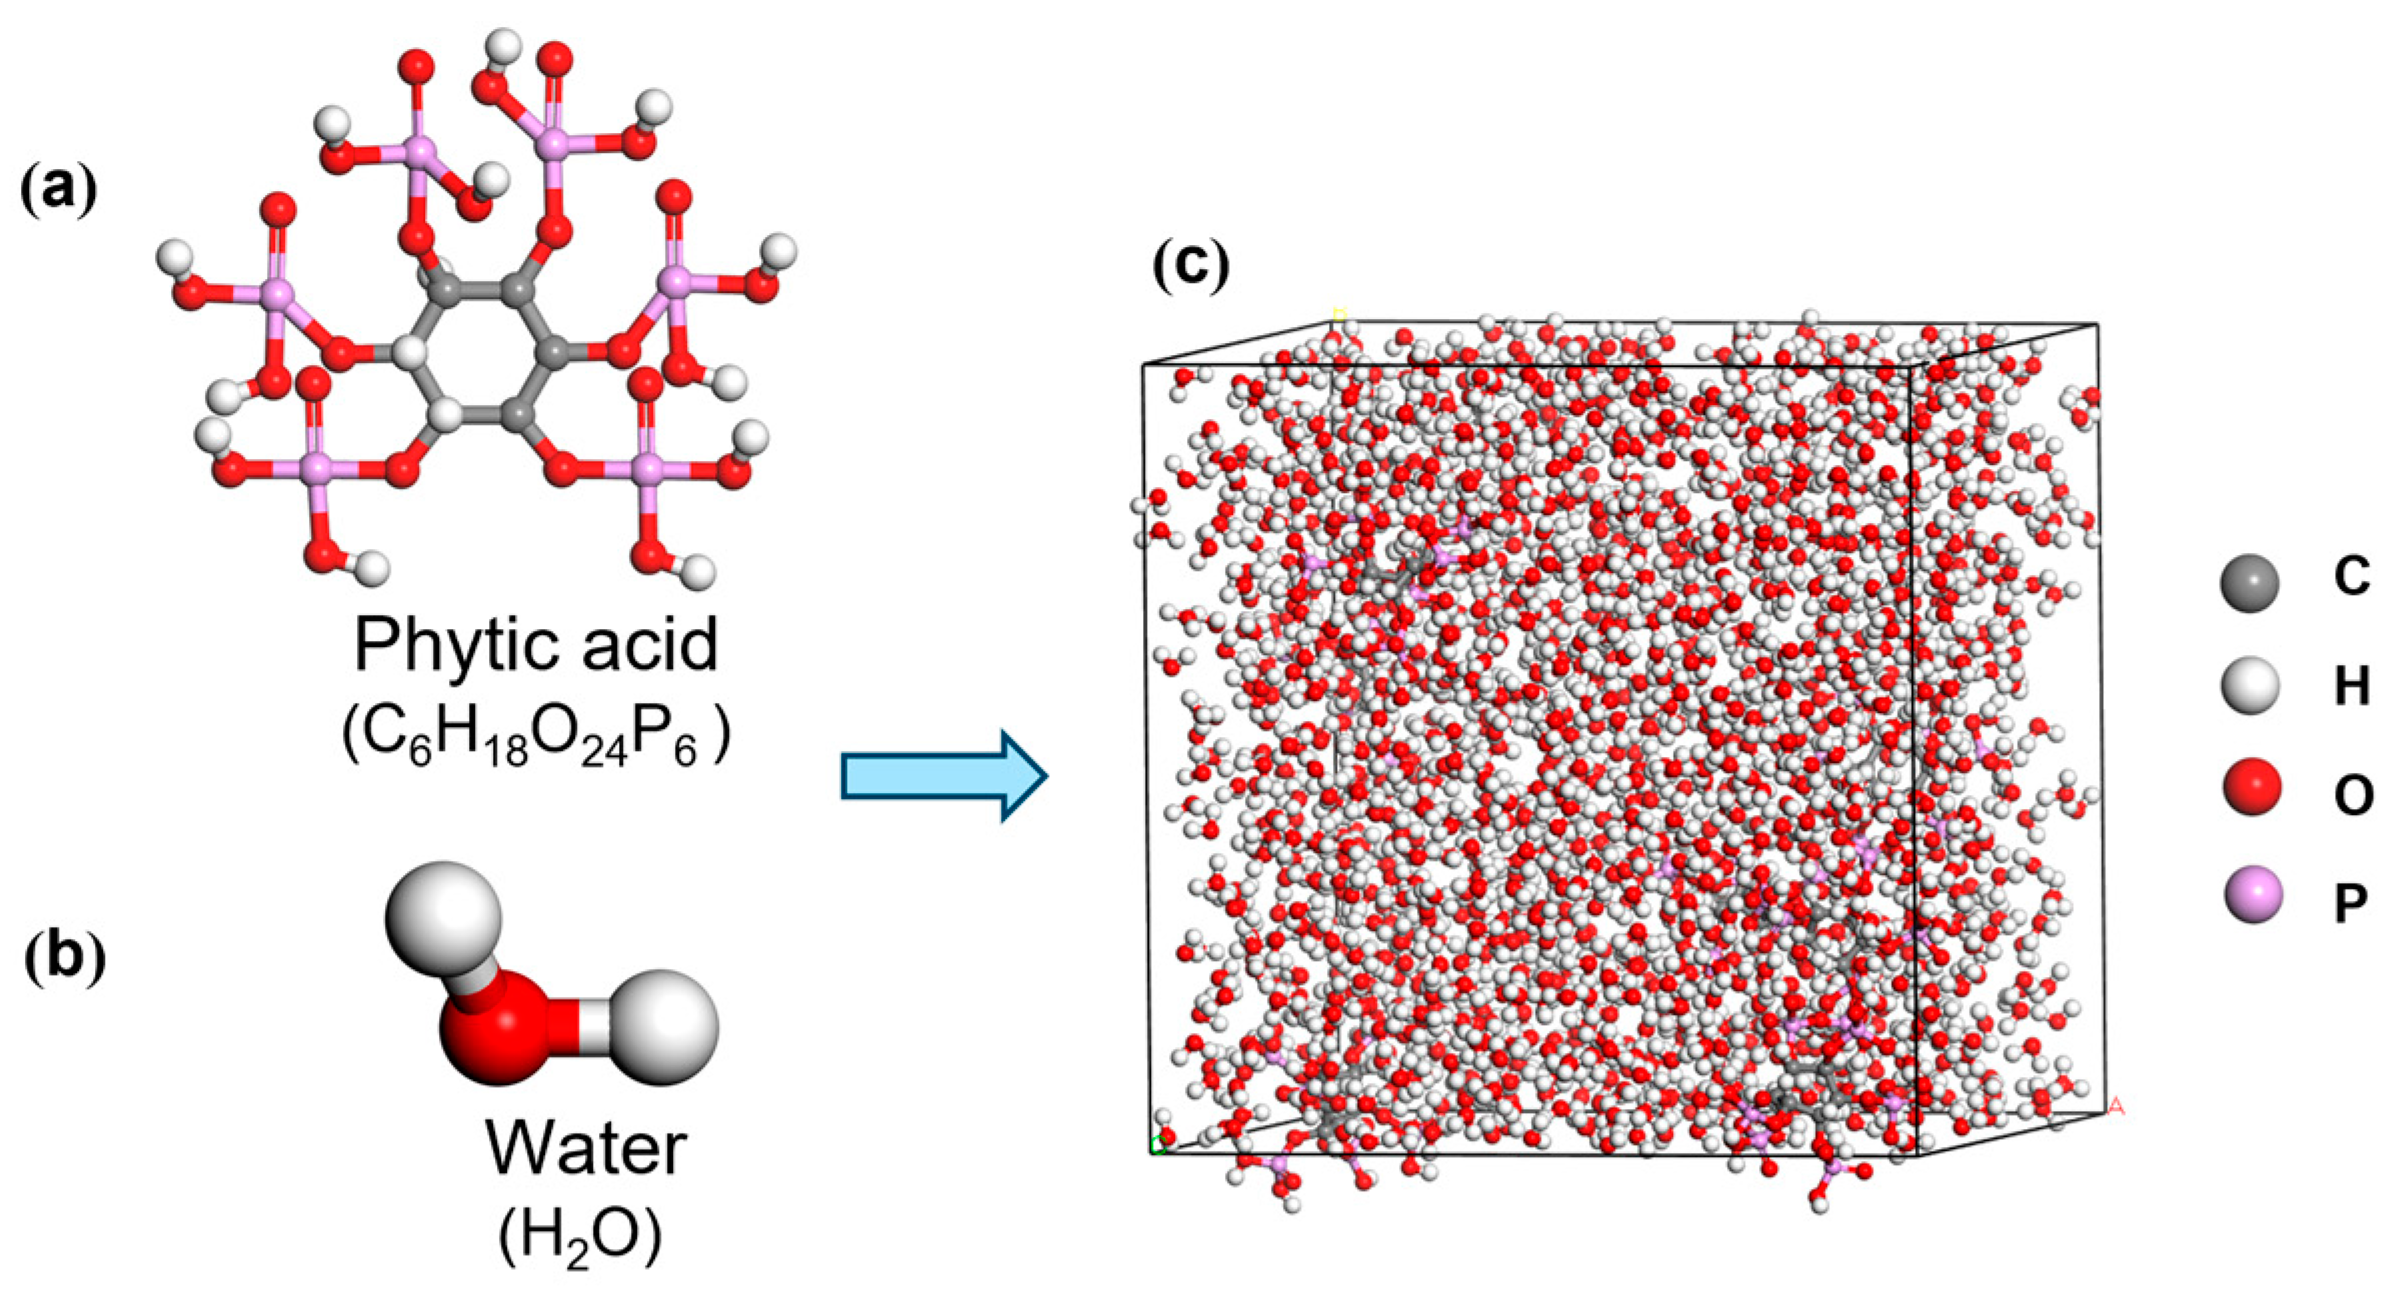
Due to the unique molecular structure of PA molecules (each molecule contains six phosphate groups and twelve hydroxyl groups), the PA molecule chelates with the metal to form an insoluble complex that replaces the water molecule in its original place. This effectively prevents water-induced corrosion on the copper surface;
(3)
In the confined shear simulation process, with the increase in shear velocity, a pronounced velocity discrepancy emerges between PA molecules and water molecules, leading to an elevation in interfacial shear stress. the strength of hydrogen bonds formed between PA and water molecules diminishes as the shear rate increases, leading to a shear-thinning effect in the PA solution, which compromises the load-bearing capacity of the liquid layer.
The results of this study are helpful to further understand the bearing and lubrication mechanism of PA solution on copper surface and provide theoretical support for engineering applications in related fields. Future studies will further explore the behavior of PA solutions on other material surfaces and optimize relevant models to improve the accuracy of simulations.

Author Contributions

M.G.: writing—original draft, methodology, software, and data curation. D.X.: conceptualization, writing—review and editing. X.W.: validation, resources. F.J.: formal analysis and funding acquisition. F.W.: visualization and investigation. Y.L.: supervision and project administrations. All authors have read and agreed to the published version of the manuscript.

Funding

This work was supported by Sichuan Science and Technology Program, China (2025YFHZ0211).

Data Availability Statement

The original contributions presented in the study are included in the article; further inquiries can be directed to the corresponding authors.

Conflicts of Interest

The authors declare no conflicts of interest.

References

  1. Sotres, J.; Arnebrant, T. Experimental Investigations of Biological Lubrication at the Nanoscale: The Cases of Synovial Joints and the Oral Cavity. Lubricants 2013, 1, 102–131. [Google Scholar] [CrossRef]
  2. Holmberg, K.; Erdemir, A. The impact of tribology on energy use and CO2 emission globally and in combustion engine and electric cars. Tribol. Int. 2019, 135, 389–396. [Google Scholar] [CrossRef]
  3. de Paula, F.H.M.; de Freitas, F.A.; Nunes, D.G.; Iglauer, S.; Gramatges, A.P.; Nascimento, R.S.V.; Lachter, E.R. Alkyl glyceryl ethers as water-based lubricant additives in mixtures with xanthan gum. Colloids Surf. A Physicochem. Eng. Asp. 2022, 634, 127881. [Google Scholar] [CrossRef]
  4. Holmberg, K.; Erdemir, A. Influence of tribology on global energy consumption, costs and emissions. Friction 2017, 5, 263–284. [Google Scholar] [CrossRef]
  5. Wood, R.J.K. Marine wear and tribocorrosion. Wear 2017, 376, 893–910. [Google Scholar] [CrossRef]
  6. Fu, Y.Q.; Bachelor, A.W.; Loh, N.L.; Tan, K.W. Effect of lubrication by mineral and synthetic oils on the sliding wear of plasma nitrided AISI 410 stainless steel. Wear 1998, 219, 169–176. [Google Scholar] [CrossRef]
  7. Wu, H.; Jia, F.; Li, Z.; Lin, F.; Huo, M.; Huang, S.; Sayyar, S.; Jiao, S.; Huang, H.; Jiang, Z. Novel water-based nanolubricant with superior tribological performance in hot steel rolling. Int. J. Extrem. Manuf. 2020, 2, 025002. [Google Scholar] [CrossRef]
  8. Li, W.; Kumara, C.; Luo, H.; Meyer, H.M., III; He, X.; Ngo, D.; Kim, S.H.; Qu, J. Ultralow Boundary Lubrication Friction by Three-Way Synergistic Interactions among Ionic Liquid, Friction Modifier, and Dispersant. Acs Appl. Mater. Interfaces 2020, 12, 17077–17090. [Google Scholar] [CrossRef]
  9. Wang, W.; Zhang, G.; Xie, G. Ultralow concentration of graphene oxide nanosheets as oil-based lubricant additives. Appl. Surf. Sci. 2019, 498, 143683. [Google Scholar] [CrossRef]
  10. Haus, F.; German, J.; Junter, G.A. Primary biodegradability of mineral base oils in relation to their chemical and physical characteristics. Chemosphere 2001, 45, 983–990. [Google Scholar] [CrossRef]
  11. Delgado, M.A.; Quinchia, L.A.; Spikes, H.A.; Gallegos, C. Suitability of ethyl cellulose as multifunctional additive for blends of vegetable oil-based lubricants. J. Clean. Prod. 2017, 151, 1–9. [Google Scholar] [CrossRef]
  12. Rahman, M.H.; Warneke, H.; Webbert, H.; Rodriguez, J.; Austin, E.; Tokunaga, K.; Rajak, D.K.; Menezes, P.L. Water-Based Lubricants: Development, Properties, and Performances. Lubricants 2021, 9, 73. [Google Scholar] [CrossRef]
  13. Deng, M.; Li, J.; Zhang, C.; Ren, J.; Zhou, N.; Luo, J. Investigation of running-in process in water-based lubrication aimed at achieving super-low friction. Tribol. Int. 2016, 102, 257–264. [Google Scholar] [CrossRef]
  14. Ren, H.; Zeng, H.; Sun, C.; Yang, J.; Luo, X.; Li, J.; Li, B.; Sheng, W. Polymer Brush-Functionalized MoS2 as a Water-Based Lubricant Additive. Macromol. Rapid Commun. 2024, 46, e2400793. [Google Scholar] [CrossRef] [PubMed]
  15. Ding, H.; Yang, X.; Xu, L.; Li, M.; Li, S.; Zhang, S.; Xia, J. Analysis and comparison of tribological performance of fatty acid-based lubricant additives with phosphorus and sulfur. J. Bioresour. Bioprod. 2020, 5, 134–142. [Google Scholar]
  16. Liu, M.; Yao, Y.; Tian, B.; Cui, K.; Wen, P.; Dong, R.; Fan, M. Robust lubricity and multifunctional water-based lubrication system induced by ionic liquids with its interfacial self-assembly behavior and unique hydration structure. Chem. Eng. J. 2025, 509, 161216. [Google Scholar] [CrossRef]
  17. Kreivaitis, R.; Gumbyte, M.; Kupcinskas, A.; Treinyte, J.; Kazancev, K.; Sendzikiene, E. Studying the Tribological Properties of Coffee Oil-Loaded Water-Based Green Lubricant. Appl. Sci. 2023, 13, 6336. [Google Scholar] [CrossRef]
  18. Chen, W.; Fu, X.; Cao, L.; Gao, S.; Wan, Y. Ultralow friction of copper by a green water-based lubricant containing phytic acid. J. Mol. Liq. 2021, 338, 116704. [Google Scholar] [CrossRef]
  19. Xiong, L.; He, Z.; Han, S.; Tang, J.; Wu, Y.; Zeng, X. Tribological properties study of N-containing heterocyclic imidazoline derivatives as lubricant additives in water-glycol. Tribol. Int. 2016, 104, 98–108. [Google Scholar] [CrossRef]
  20. Wang, Y.; Yu, Q.; Cai, M.; Shi, L.; Zhou, F.; Liu, W. Synergy of lithium salt and non-ionic surfactant for significantly improved tribological properties of water-based fluids. Tribol. Int. 2017, 113, 58–64. [Google Scholar] [CrossRef]
  21. Chen, W.; Amann, T.; Kailer, A.; Ruehe, J. Macroscopic Friction Studies of Alkylglucopyranosides as Additives for Water-Based Lubricants. Lubricants 2020, 8, 11. [Google Scholar] [CrossRef]
  22. Wan, Y.; Yu, Y.; Gao, S.; Gao, J. Low friction of phytic acid as a water-based lubricant additive. Ind. Lubr. Tribol. 2017, 69, 1085–1090. [Google Scholar] [CrossRef]
  23. Chen, A.; Arai, Y. Functional Group Specific Phytic Acid Adsorption at the Ferrihydrite-Water Interface. Environ. Sci. Technol. 2019, 53, 8205–8215. [Google Scholar] [CrossRef]
  24. Li, C.-C.; Guo, X.-Y.; Shen, S.; Song, P.; Xu, T.; Wen, Y.; Yang, H.-F. Adsorption and corrosion inhibition of phytic acid calcium on the copper surface in 3wt% NaCl solution. Corros. Sci. 2014, 83, 147–154. [Google Scholar] [CrossRef]
  25. Shi, H.; Han, E.-H.; Liu, F.; Kallip, S. Protection of 2024-T3 aluminium alloy by corrosion resistant phytic acid conversion coating. Appl. Surf. Sci. 2013, 280, 325–331. [Google Scholar] [CrossRef]
  26. Yang, H.F.; Feng, J.; Liu, Y.L.; Yang, Y.; Zhang, Z.R.; Shen, G.L.; Yu, R.Q. Electrochemical and surface enhanced Raman scattering spectroelectrochemical study of phytic acid on the silver electrode. J. Phys. Chem. B 2004, 108, 17412–17417. [Google Scholar] [CrossRef]
  27. El-Lateef, H.M.A.; El-Sayed, A.-R.; Mohran, H.S.; Shilkamy, H.A.S. Corrosion inhibition and adsorption behavior of phytic acid on Pb and Pb–In alloy surfaces in acidic chloride solution. Int. J. Ind. Chem. 2019, 10, 31–47. [Google Scholar] [CrossRef]
  28. Gao, X.; Zhao, C.; Lu, H.; Gao, F.; Ma, H. Influence of phytic acid on the corrosion behavior of iron under acidic and neutral conditions. Electrochim. Acta 2014, 150, 188–196. [Google Scholar] [CrossRef]
  29. Zhao, P.; Zhou, X.; Yang, Y.; Wang, C.; Wang, C.; Liang, H.; Li, C.; Ren, H. Molecular dynamics simulation study of the effect of molecular structure of warm mix additive on lubricating properties. Constr. Build. Mater. 2023, 407, 133529. [Google Scholar] [CrossRef]
  30. Ma, Q.; Qi, P.; Dong, G. An experimental and molecular dynamics study of the superlubricity enabled by hydration lubrication. Appl. Surf. Sci. 2021, 553, 149590. [Google Scholar] [CrossRef]
  31. Liu, Y.; Zhang, H.; Jiang, Y.; Wang, X.; Luo, Y.; Zhu, X. Probing tribological properties of DLC film deposited on plunger surface of sucker-rod pump based on molecular dynamics simulation. Appl. Phys. A 2023, 129, 599. [Google Scholar] [CrossRef]
  32. Guo, X.; Zhang, X.; Ma, L.; Li, Y.; Le, J.; Fu, Z.; Lu, L.; Zhang, D. Understanding the adsorption of imidazole corrosion inhibitor at the copper/water interface by ab initio molecular dynamics. Corros. Sci. 2024, 236, 112237. [Google Scholar] [CrossRef]
  33. Ma, L.; Lian, J.; Ma, X.; Bai, S.; Ma, L.; Zhao, J. A study on the tribological behavior of water-based nanolubricant during corrugated rolling of copper plates. Int. J. Adv. Manuf. Technol. 2023, 129, 1513–1526. [Google Scholar] [CrossRef]
  34. Xu, Z.; Xiong, Z.; Gong, M.; Zeng, Q.; Hong, J.; Fan, J. Molecular dynamics-based study of the modification mechanism of asphalt by graphene oxide. J. Mol. Model. 2023, 29, 368. [Google Scholar] [CrossRef]
  35. Luo, L.; Chu, L.; Fwa, T.F. Molecular dynamics analysis of moisture effect on asphalt-aggregate adhesion considering anisotropic mineral surfaces. Appl. Surf. Sci. 2020, 527, 146830. [Google Scholar] [CrossRef]
  36. Sun, H. COMPASS: An ab initio force-field optimized for condensed-phase applications-Overview with details on alkane and benzene compounds. J. Phys. Chem. B 1998, 102, 7338–7364. [Google Scholar] [CrossRef]
  37. Chen, X.; Chen, Y.; Cui, J.; Li, Y.; Liang, Y.; Cao, G. Molecular dynamics simulation and DFT calculation of “green” scale and corrosion inhibitor. Comput. Mater. Sci. 2021, 188, 110229. [Google Scholar] [CrossRef]
  38. Honorio, T.; Masara, F.; Benboudjema, F. Heat capacity, isothermal compressibility, isosteric heat of adsorption and thermal expansion of water confined in C-S-H. Cement 2021, 6, 100015. [Google Scholar] [CrossRef]
  39. Boster, K.A.S.; Cai, S.; Ladrón-de-Guevara, A.; Sun, J.; Zheng, X.; Du, T.; Thomas, J.H.; Nedergaard, M.; Karniadakis, G.E.; Kelley, D.H. Artificial intelligence velocimetry reveals in vivo flow rates, pressure gradients, and shear stresses in murine perivascular flows. Proc. Natl. Acad. Sci. USA 2023, 120, e2217744120. [Google Scholar] [CrossRef]
Figure 1. Structural model: (a) PA molecular; (b) water molecule; (c) PA solution.
Colloids 09 00018 g001
Figure 2. (a) Variation in temperature with simulation time; (b) variation in energy with simulation time.
Colloids 09 00018 g002
Figure 3. Establishment of the confined shear model, (a) the optimized initial model; (b) the compression model; (c) the confined shear model.
Colloids 09 00018 g003
Figure 4. The proposed lubrication model for IP molecules [18]. IP6 in the quoted figure is PA in this paper.
Colloids 09 00018 g004
Figure 5. Changes in thickness compressibility of liquid layer under different external pressures.
Colloids 09 00018 g005
Figure 6. (ad) Radial distribution function curve between oxygen atoms (OW) in water and oxygen atoms (OP) in PA during compression simulation, (e) The distribution of hydrated layers and free water in the liquid layer.
Colloids 09 00018 g006
Figure 7. Relative concentration distribution of oxygen atoms in PA molecules in the solution model during compression simulation, (a) 10wt% PA solution; (b) 15wt% PA solution; (c) 20wt% PA solution; (d) 30wt% PA solution.
Colloids 09 00018 g007
Figure 8. (a) The shear stress varies with the shear rate during the confined shear process under various shear rates; (b) dynamic viscosity of PA solutions at different concentrations.
Colloids 09 00018 g008
Figure 9. Longitudinal distribution of average velocity of OW atoms under various shear rates, (a) 0.1 Å/ps; (b) 0.7 Å/ps; (c) 1.0 Å/ps; (d) 3.0 Å/ps; (e) 5.0 Å/ps.
Colloids 09 00018 g009
Figure 10. Longitudinal distribution of average velocity of OP atoms under various shear velocities, (a) 0.1 Å/ps; (b) 0.7 Å/ps; (c) 1.0 Å/ps; (d) 3.0 Å/ps; (e) 5.0 Å/ps.
Colloids 09 00018 g010
Figure 11. RDF curve of OP-OW during confined shear simulation, (a) 10 wt% PA solution; (b) 15 wt% PA solution; (c) 20 wt% PA solution; (d) 30 wt% PA solution.
Colloids 09 00018 g011
Figure 12. (a) Interaction energy between PA molecule and water molecule under shear rate in four groups of models; (b) interaction energy between PA solution and copper interface.
Colloids 09 00018 g012
Table 1. Physical property parameters, size and composition of each model.
Solution
Type
Wt%
(PA)
Density
ρ (g/cm3)
Model Size
3)
Num. of Water Molecules (nw)Num. of PA Molecules (nPA)
PA10101.021035.7 × 35.7 × 35.714004
PA15151.056136.1 × 36.1 × 36.114007
PA20201.100536.3 × 36.3 × 36.3140010
PA30301.173537.0 × 37.0 × 37.0140016
Disclaimer/Publisher’s Note: The statements, opinions and data contained in all publications are solely those of the individual author(s) and contributor(s) and not of MDPI and/or the editor(s). MDPI and/or the editor(s) disclaim responsibility for any injury to people or property resulting from any ideas, methods, instructions or products referred to in the content.

