Article

Surfactants Adsorption onto Algerian Rock Reservoir for Enhanced Oil Recovery Applications: Prediction and Optimization Using Design of Experiments, Artificial Neural Networks, and Genetic Algorithm (GA)

by
Kahina Imene Benramdane
1,
Mohamed El Moundhir Hadji
2,
Mohamed Khodja
3,
Nadjib Drouiche
4,
Bruno Grassl
5 and
Seif El Islam Lebouachera
5,*
1
Laboratory of Reaction Engineering, Faculty of Mechanical Engineering and Process Engineering, University of Science and Technology Houari Boumediene, BP 62, Algiers 16111, Algeria
2
Water, Environment and Sustainable Development Laboratory, Faculty of Technology, Blida 1 University, Blida 09000, Algeria
3
SONATRACH, Algerian Petroleum Institute, Avenue 1 Novembre, Boumerdes 35000, Algeria
4
Division CCSM, Centre de Recherche en Technologie Semi-Conducteurs Pour L’Energétique, N2, Bd Dr. Frantz Fanon, P.O. Box 140, Alger Sept Merveilles, Alger 16038, Algeria
5
UMR IPREM (Institut des Sciences Analytiques et de Physico-Chimie Pour l’Environnement et les Matériaux), Université de Pau et des Pays de l’Adour, CNRS, Technopôle Helioparc, 2 Avenue du Président Pierre Angot, 64053 Pau, France
*
Author to whom correspondence should be addressed.
Colloids Interfaces 2025, 9(2), 19; https://doi.org/10.3390/colloids9020019
Submission received: 21 February 2025 / Revised: 11 March 2025 / Accepted: 19 March 2025 / Published: 25 March 2025

Abstract

:
This study investigates the adsorption of surfactants on Algerian reservoir rock from Hassi Messaoud. A new data generation method based on a design of experiments (DOE) approach has been developed to improve the accuracy of adsorption modeling using artificial neural networks (ANNs). Unlike traditional data acquisition methods, this approach enables a methodical and structured exploration of adsorption behavior while reducing the number of required experiments, leading to improved prediction accuracy, optimization, and cost-effectiveness. The modeling is based on three key parameters: surfactant type (SDS and EOR ASP 5100), concentration, and temperature. The dataset required for ANN training was generated from a polynomial model derived from a full factorial design (DOE) established in a previous study. Before training, 32 different ANN configurations were evaluated by varying learning algorithms, adaptation functions, and transfer functions. The best-performing model was a cascade-type network employing the Levenberg–Marquardt learning function, learngdm adaptation, tansig activation function for the hidden layer, and purelin for the output layer, achieving an R2 of 0.99 and an MSE of 6.84028 × 10⁻⁹. Compared to DOE-based models, ANN exhibited superior predictive accuracy, with a performance factor (PF/3) of 0.00157 and the same MSE. While DOE showed a slight advantage in relative error (9.10 × 10⁻⁵% vs. 1.88 × 10⁻⁴% for ANN), ANN proved more effective overall. Three optimization approaches—ANN-GA, DOE-GA, and DOE-DF (desirability function)—were compared, all converging to the same optimal conditions (SDS at 200 ppm and 25 °C). This similarity between the various optimization techniques confirms the strength of genetic algorithms for optimization in the field of EOR and that they can be reliably applied in practical field operations. However, ANN-GA exhibited slightly better convergence, achieving a fitness value of 2.3247.

Graphical Abstract

1. Introduction

Energy is a key driver of economic development, and oil remains a crucial resource to meet global demand. However, many mature reservoirs have reached a stage where conventional extraction techniques are no longer sufficient. Enhanced oil recovery (EOR) offers an advanced approach to extracting additional oil when traditional methods, such as natural reservoir pressure or water and gas injection, become ineffective [1,2]. Enhanced oil recovery (EOR) has emerged as an advanced solution to maximize oil production when traditional techniques, such as relying on natural reservoir pressure or injecting water and gas, become insufficient [3,4,5,6]. Despite these advances, a significant amount of oil remains trapped in the pores of reservoir rock due to capillary forces, which hold the oil in microscopic spaces, and its high viscosity, which impedes flow. Using gases, chemicals, and thermal energy, EOR has evolved into a diverse set of techniques designed to optimize oil displacement and improve extraction efficiency [3,7,8].
To overcome the challenge of residual oil trapped in reservoirs, enhanced oil recovery (EOR) techniques are designed to alter the physical and chemical properties of the reservoir, improving oil mobility and facilitating its flow toward production wells. These techniques include thermal, chemical, and gas-based processes, such as CO2 injection or hydrocarbon gas injection, each tailored to the specific reservoir conditions. Among them, surfactant injection stands out as a particularly promising approach. Due to their amphiphilic nature, surfactants effectively reduce the interfacial tension between water and oil [9,10,11,12,13,14]. This reduction enhances oil dispersion in water, thereby improving mobilization and boosting extraction efficiency. This method is especially beneficial in heterogeneous or complex reservoirs, where oil is often confined in hard-to-reach zones [15,16,17,18,19,20,21].
While surfactants show great promise in enhancing oil recovery, their practical application is not without challenges. The effective use of surfactants in EOR is hindered by challenges related to their adsorption onto rock surfaces. Excessive surfactant adsorption reduces their concentration in the aqueous phase, diminishing their ability to modify interfacial properties and ultimately lowering their effectiveness in the recovery process [22,23]. Surfactant adsorption mechanisms are complex and influenced by multiple factors, including the chemical composition of the surfactant, the mineralogical properties of the rock, temperature, pH, and the ionic strength of the surrounding medium. Therefore, a deep understanding of these mechanisms and optimization of operational conditions becomes obligatory for the enhancement of the efficiency of the whole EOR process [24,25].
To overcome these challenges, modeling and optimization techniques are employed to maximize the effectiveness of surfactants in EOR applications. ANN techniques have proven particularly effective in capturing the complex, nonlinear relationships between input variables and surfactant adsorption [26]. Since these models rely directly on experimental data, they have demonstrated a strong ability to predict adsorption behavior with high accuracy [27]. Although ANN provides accurate predictions of surfactant adsorption, it does not inherently determine the optimal input conditions. The integration of GA ensures an optimal combination of parameters to maximize adsorption efficiency under given constraints. Genetic algorithms (GAs), inspired by natural selection, complement ANNs by efficiently exploring vast solution spaces to optimize surfactant performance [28]. Through key mechanisms such as selection, which identifies the best-performing solutions; crossover, which combines features of parent solutions to generate new ones; and mutation, which introduces random variations, GAs effectively navigate complex and nonlinear solution spaces [26]. When integrated with ANNs, GA-based systems form a powerful framework for both modeling and optimizing surfactant adsorption in EOR processes [29,30].
Several studies have been conducted to model enhanced oil recovery (EOR) processes using ANNs, with a particular focus on various EOR techniques, such as surfactant and polymer injection, which are designed to enhance the efficiency of these recovery methods. For instance, Ahmed F. Belhaj et al. conducted a comprehensive study on the adsorption behavior of two surfactants, alkyl polyglucoside (APG) and alkyl ether carboxylate (AEC), on rock surfaces under harsh reservoir conditions. They employed ANNs to model and predict these complex phenomena, analyzing experimental data on both individual and binary surfactant adsorption while simulating the effects of key parameters such as temperature. The ANNs showed a strong correlation with the experimental data, with an R2 of 0.9915 and 0.9926 for APG and AEC, respectively, confirming their accuracy in predicting adsorption behaviors and significantly reducing the time and costs associated with experimentation [31]. Similarly, SeyedehRahaMoosavi et al. also used ANNs to forecast the final oil recovery, RF/, and injection quality (Q) during a CO2 injection combined with surfactants. The following were the anionic Bio-Terge AS-40, the non-ionic Triton X-100, the cationic Stephantex VT-90, and the alpha-olefin sulfonate AOS C14/16 that were tested against the brine. The ANNs considered MLP and RBF were trained using 214 experimental records with six normalized input parameters, including porosity, permeability, and injected volume. These models demonstrated excellent performance, achieving an R2 above 0.997 with remarkably low RMSE [32]. In addition, the work of Qian Sun et al. focused on developing ANNs to predict and optimize polymer flooding projects in the context of EOR. Two models were designed: one to predict the temporal responses of projects, such as final oil recovery (RF), and one to predict injection quality (Q). ANNs were trained with synthetic data generated from high-fidelity numerical simulations, including rock and fluid properties and injection configurations. The RBF-based model was able to produce an R2 of 0.9991 and a root mean square error of 0.0092 against the injection quality (Q), while similar results were obtained for the final recovery, RF, with an R2 value of 0.9991 and an RMSE of 0.0197. Both of these indicate the efficiency and swiftness with which ANNs are able to provide reliable estimates [33]. Lastly, Si Le Van et al. proposed an innovative approach to using ANNs to model and evaluate the performance of alkali–surfactant–polymer (ASP) flooding in viscous oil reservoirs. Utilizing a dataset generated from representative numerical simulations of typical projects, they optimized the ANN through a rigorous training, validation, and testing process with a 50%–20%–30% data split. The optimized network exhibited high predictive accuracy, achieving an R2 of 0.986 and an RMSE of 1.63% in forecasting the performance of the studied scenarios [34].
These studies highlight the power of artificial neural networks (ANNs) in accurately predicting complex behaviors, such as surfactant adsorption, and the efficiency of enhanced recovery techniques based on experimental data.
The main objective of this study is to predict and optimize surfactant adsorption using artificial neural networks (ANNs) based on three key parameters: surfactant type (SDS and EOR ASP 5100), surfactant concentration, and temperature, with the goal of determining the equilibrium adsorption capacity (Qe). To achieve this, experimental data were generated from a polynomial model derived from a full factorial design (DOE) established in a previous study, serving as the foundation for training the ANN. To enhance the network’s performance, 32 mathematical models were evaluated, exploring various neural network architectures and function combinations, including transfer and activation functions. The optimization of operational parameters was then carried out by coupling genetic algorithms with both ANN (ANN-GA) and a full factorial design (DOE-GA). Finally, a comprehensive comparative analysis was performed between the two predictive models (ANN and DOE) and the optimization methods (ANN-GA and DOE-GA) while also incorporating optimization based on the desirability factor (DOE-DF). This analysis aimed to identify the most effective approach for predicting and optimizing surfactant adsorption in enhanced oil recovery (EOR) processes.

2. Materials and Methods

2.1. Surfactants

Sodium dodecyl sulfate (SDS), an anionic surfactant with 98% purity and a molecular weight of 288 g/mol, was supplied by Merck (Darmstadt, Germany). In parallel, EOR ASP 5100, an industrial surfactant specifically designed for enhanced oil recovery, was provided by Solvay (Brussels, Belgium). The surfactant solutions were prepared with distilled water at concentrations ranging from 200 to 800 ppm for both SDS and EOR ASP 5100. To prepare these solutions, the appropriate amounts of surfactants were dissolved in 100 mL of distilled water using a magnetic stirrer (Thermo Fisher Scientific, Waltham, MA, USA) to ensure complete homogenization. These two surfactants were used in the experiments [35].

2.2. Sample Preparation and Batch Adsorption

The rock samples from the sandstone reservoir of Hassi Messaoud, located in southern Algeria, were crushed, washed with distilled water, and dried, then sieved into 4 μm fractions to obtain a uniform size. After grinding, the samples were washed again, decanted, and dried before being used for static adsorption experiments. Batch adsorption tests were then carried out in the laboratory, where a determined volume of surfactant solution was brought into contact with the rock under agitation at 130 rpm for several hours to reach equilibrium. Based on the equilibrium concentration and the initial concentration of the surfactant, the amount of surfactant adsorbed was calculated, providing precise results with a margin of error of 4% for all experiments. To minimize experimental errors, special attention was given to preventing any contamination of the solutions and ensuring thorough homogenization of the mixtures. Knowing the equilibrium concentration and the initial concentration of the surfactant, the amount of surfactant adsorbed can be calculated as follows:
A d s o r b e d   s u r f a c t a n t   ( Q e ) = m s o l u t i o n C 0 C m s a n d s t o n e 10 3
where Qe represents the adsorption of the surfactant on the rock surface at equilibrium (mg/g of rock), msolution denotes the total mass of the solution in the initial volume (g), C0 corresponds to the initial concentration of the surfactant in the solution before equilibrium (mg/L), C indicates the concentration of the surfactant in the aqueous solution after equilibrium (mg/L), and msandstone is the total mass of the crushed sandstone [32].

2.3. XRD and BET Analysis

X-ray diffraction (XRD) analysis was performed using a PANalytical diffractometer (PANalytical, Almelo, The Netherlands), covering a wide range of Bragg angles (2θ ranging from 2° to 70°). The collected data were processed using High Score Plus software (Version 3.0.5) and a CuKα source (λ = 1.54186 Å) to determine the semi-quantitative composition of the samples. Additionally, the specific surface area of the rock samples was determined using the Brunauer–Emmett–Teller (BET) method with an Autosorb-3b analyzer (Quantachrome, Boynton Beach, FL, USA). Nitrogen adsorption was used to measure the surface area after the sandstone powder had been pre-dried at 120 °C to remove any traces of water and adsorbed substances [35].

2.4. Modeling Methods

2.4.1. Full Factorial Design (DOE) Modeling

In this study, a full factorial design 23 was employed, leading to a total of eight experiments to assess the effects of three factors on the equilibrium adsorption capacity (Qe) of the surfactants SDS and EOR ASP 5100 on Hassi Messaoud rock. The selected factors were surfactant type (X1), surfactant concentration (X2), and temperature (X3), as these parameters play a crucial role in surfactant retention within porous media [36,37,38]. The response variable (Y) corresponds to the equilibrium adsorption capacity Qe (mg/g) (see Table 1).
To model the effects of these three factors and their interactions, the following mathematical equation was applied [39,40]:
y = a 0 + a 1 X 1 + a 2 X 2 + a 3 X 3 + a 12 X 1 X 2 + a 13 X 1 X 3 + a 23 X 2 X 3
where y represents the response (equilibrium adsorption capacity Qe); a0 is the overall mean; a1, a2, and a3 are the coefficients for the individual effects of each factor; and a12, a13, and a23 capture the interaction effects between the factors [40].
In a previous study, this design was developed and extensively detailed to optimize the experimental parameters [35]. In the present research, we leveraged this design to train an artificial neural network (ANN), allowing for the modeling of complex relationships between the experimental variables and the adsorption response.

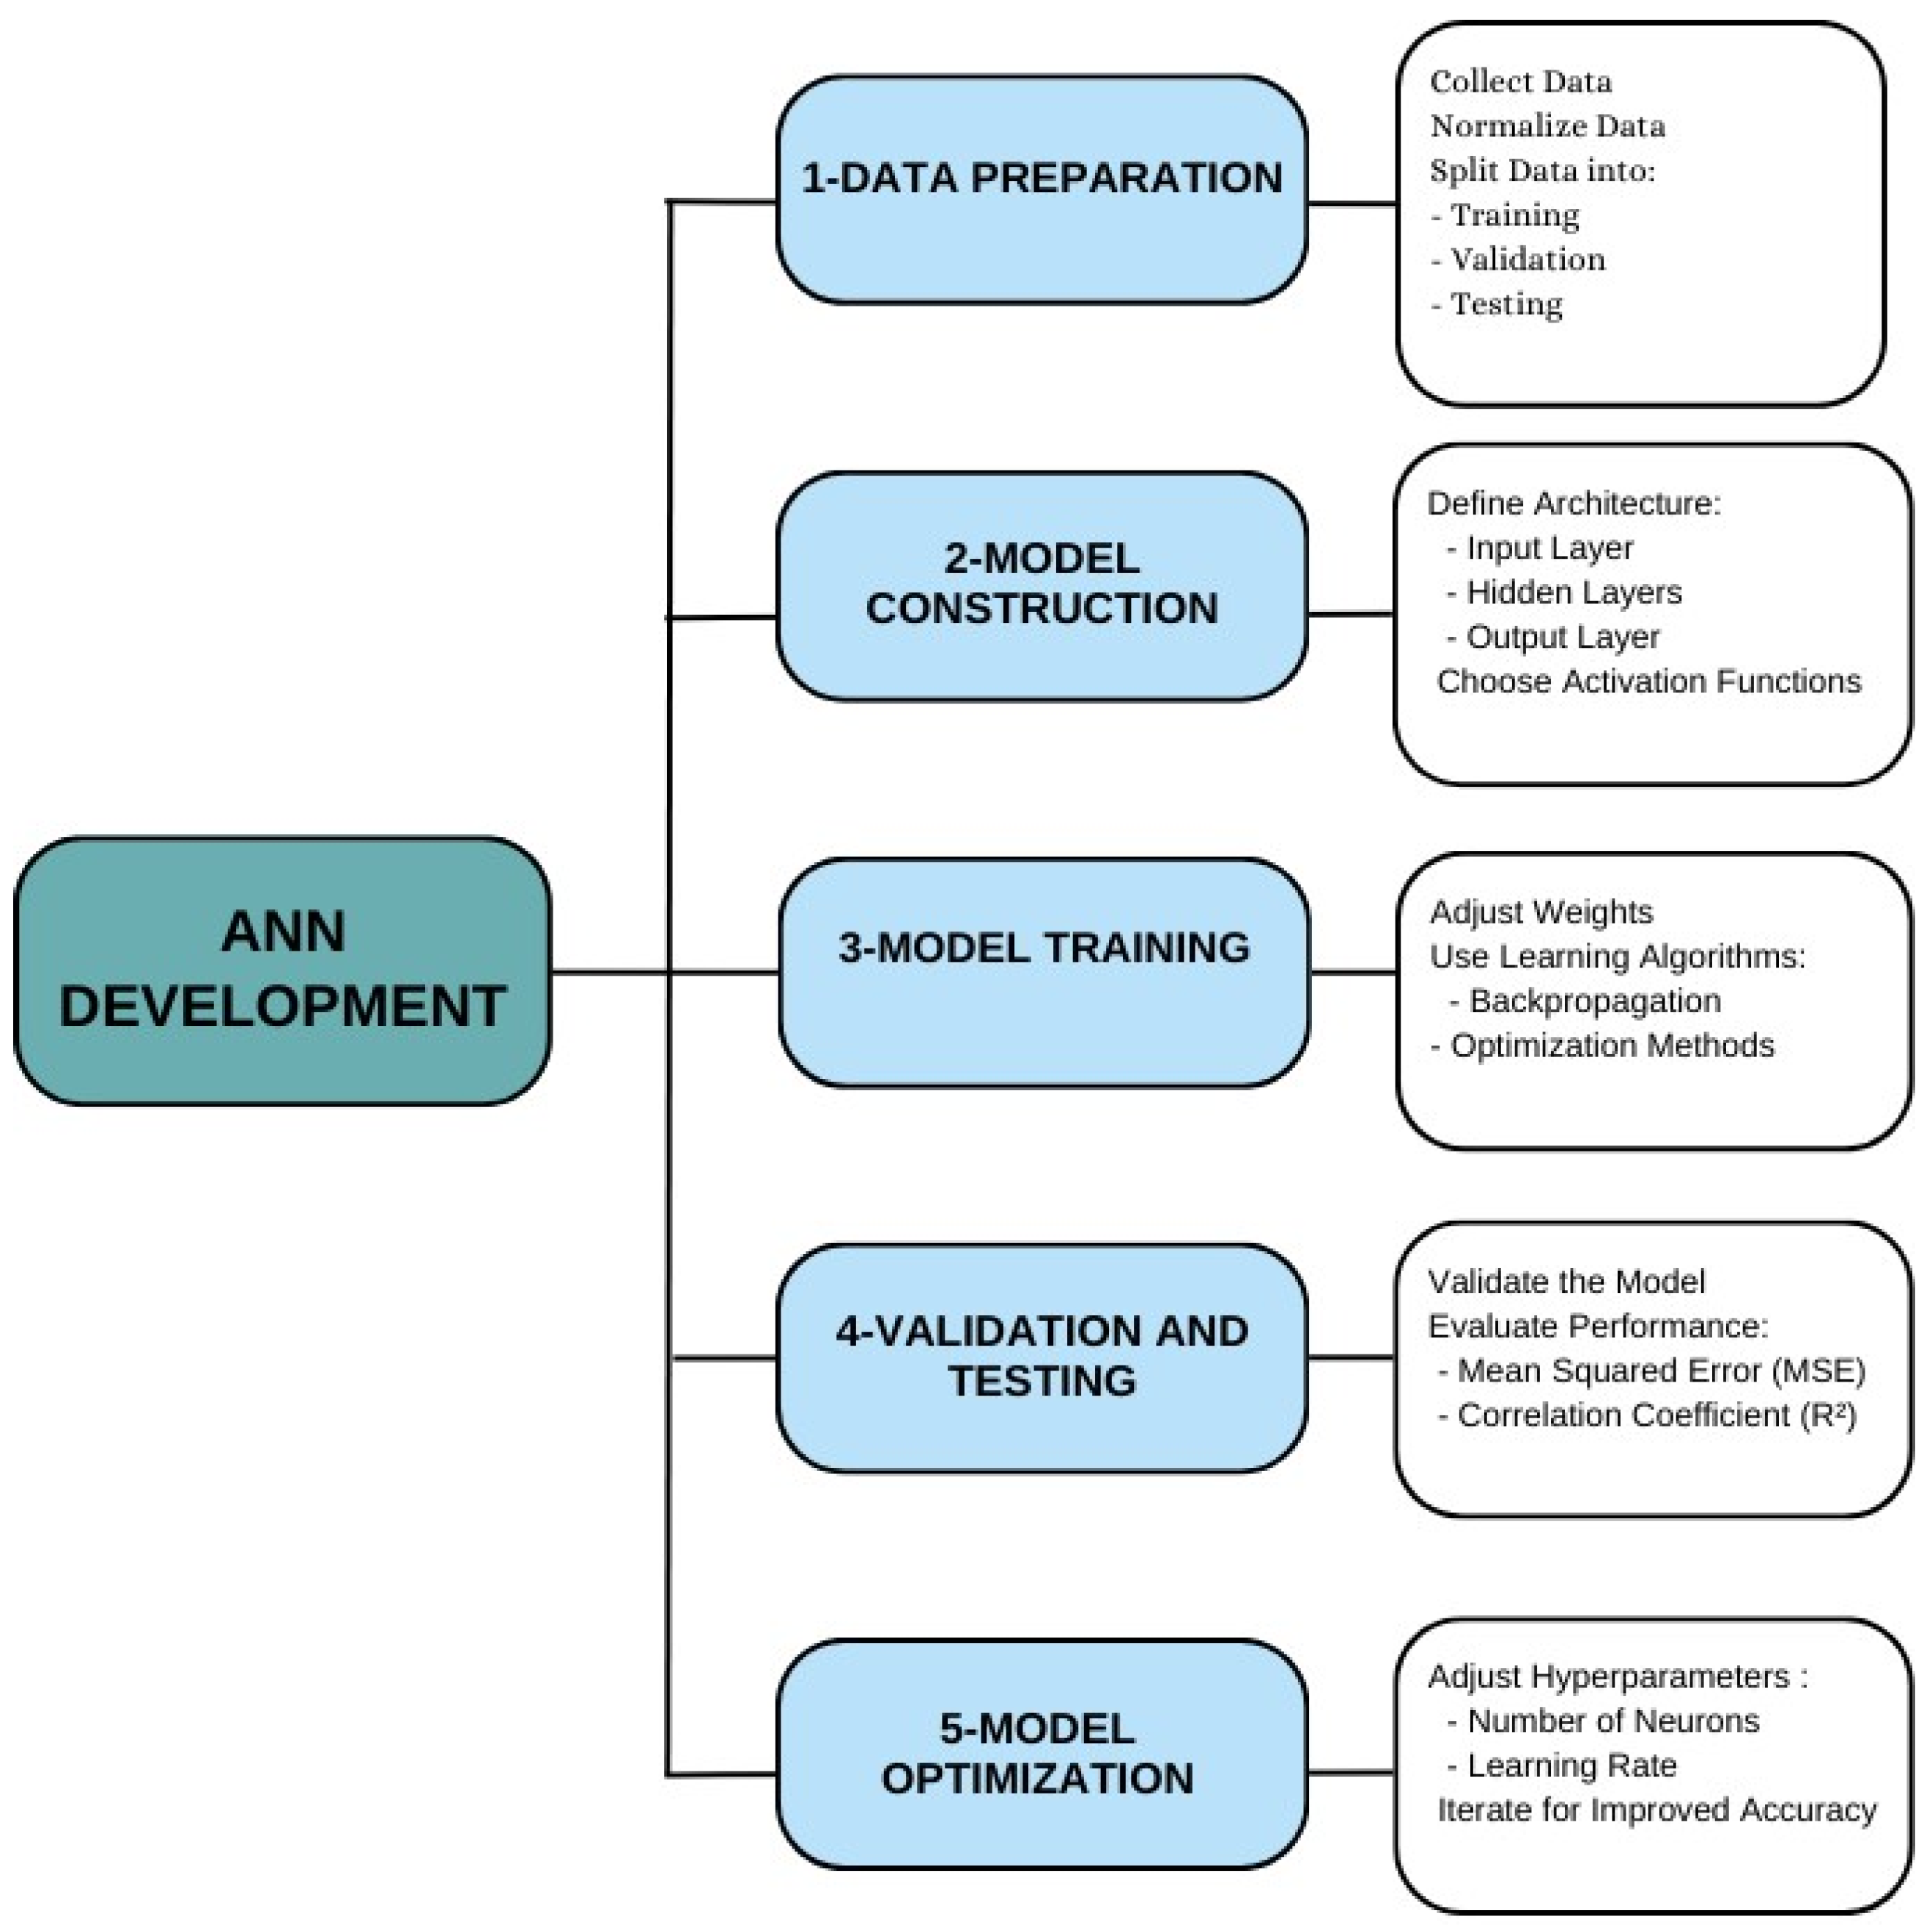
2.4.2. ANN Modeling Development

Artificial neural networks (ANNs) are powerful tools for analyzing experimental datasets and modeling complex nonlinear relationships between input and output variables [41,42]. Given the intricate relationships observed in surfactant adsorption studies, ANNs were employed in this research to capture and model these complexities effectively. Its implementation follows several key steps, as illustrated in Figure 1, ranging from data preparation to the optimization of network parameters to produce accurate and reliable models [43].
Inspired by the human brain, an ANN processes information through interconnected artificial neurons. Each neuron receives data via weighted connections, where each connection has a specific weight. In this study, the input variables (X1, X2, and X3) were processed by the input layer, which applied an activation function before transmitting the data to the subsequent hidden layers. These layers allow the ANN to establish intricate relationships between input variables and the adsorption response (Qe) [44,45]. The ANN layers capture nonlinear relationships by applying hierarchical transformations to the data using transfer and nonlinear activation functions. These components enable the neural network to effectively learn and model complex interactions between input and output variables.
The neurons in the hidden layers first perform a calculation, which consists of summing the weighted inputs (Equation (3)). Next, an activation function is applied to this sum. Finally, the results are sent to the next layer. This iterative process allows the network to learn complex nonlinear relationships, making it particularly well suited for modeling complex systems [46].
S i j   = W 0   + [ n i w i j X i ]
where n is the number of input elements, Xi is the value of the neuron output of the previous layer, Wij is the weight value between neuron i and neuron j, and W0 is the bias.
To predict the system outputs, the production equation of a three-layer network (input, hidden, and output) is used. This equation combines the weights and activation functions of the neurons (Equation (4)) [46].
Y k = f k j = 1 m w j k × f i i = 1 n x i × w i j + w 0
where Yk is one of the outputs of the system, fk and fi are successively the functions activation of the neuron k of the output layer and the neuron j of the hidden layer, Wjk and Wij are successively the weights between the same neuron and the k-th exit neuron and the weight between the i-th neuron and the j-th neuron, W0 is the bias. Weights and biases are iteratively adjusted during the training process to minimize the error between predicted and actual outputs [47]. The general structure of the ANN, consisting of input, hidden, and output layers, is shown in Figure 2. Each layer’s neurons establish relationships between the input variables and the output response.
In this study, we explored various neural network architectures and tested multiple function combinations to optimize model performance. Specifically, Feed Forward and Cascade Forward networks were evaluated alongside different learning algorithms and transfer functions to determine the most effective configurations. A summary of the tested architectures, algorithms, and functions is provided in Table 2 [48].
The performance of Feed Forward Backpropagation and Cascade Forward Backpropagation was evaluated using the mean squared error (MSE) (Equation (5)) and the correlation coefficient (R) (Equation (6)) [49,50,51].
M S E = 1 Q i = 1 i = Q ( y i , p r e d y i , e x p ) 2
R 2 = 1 i = 1 i = Q y p , i y e x p , i 2 i = 1 i = Q y p , i y m 2
where Q is the number of data points, yp represents the network prediction, yexp is the experimental response, ym is the mean of the experimental values, and i is the data index.

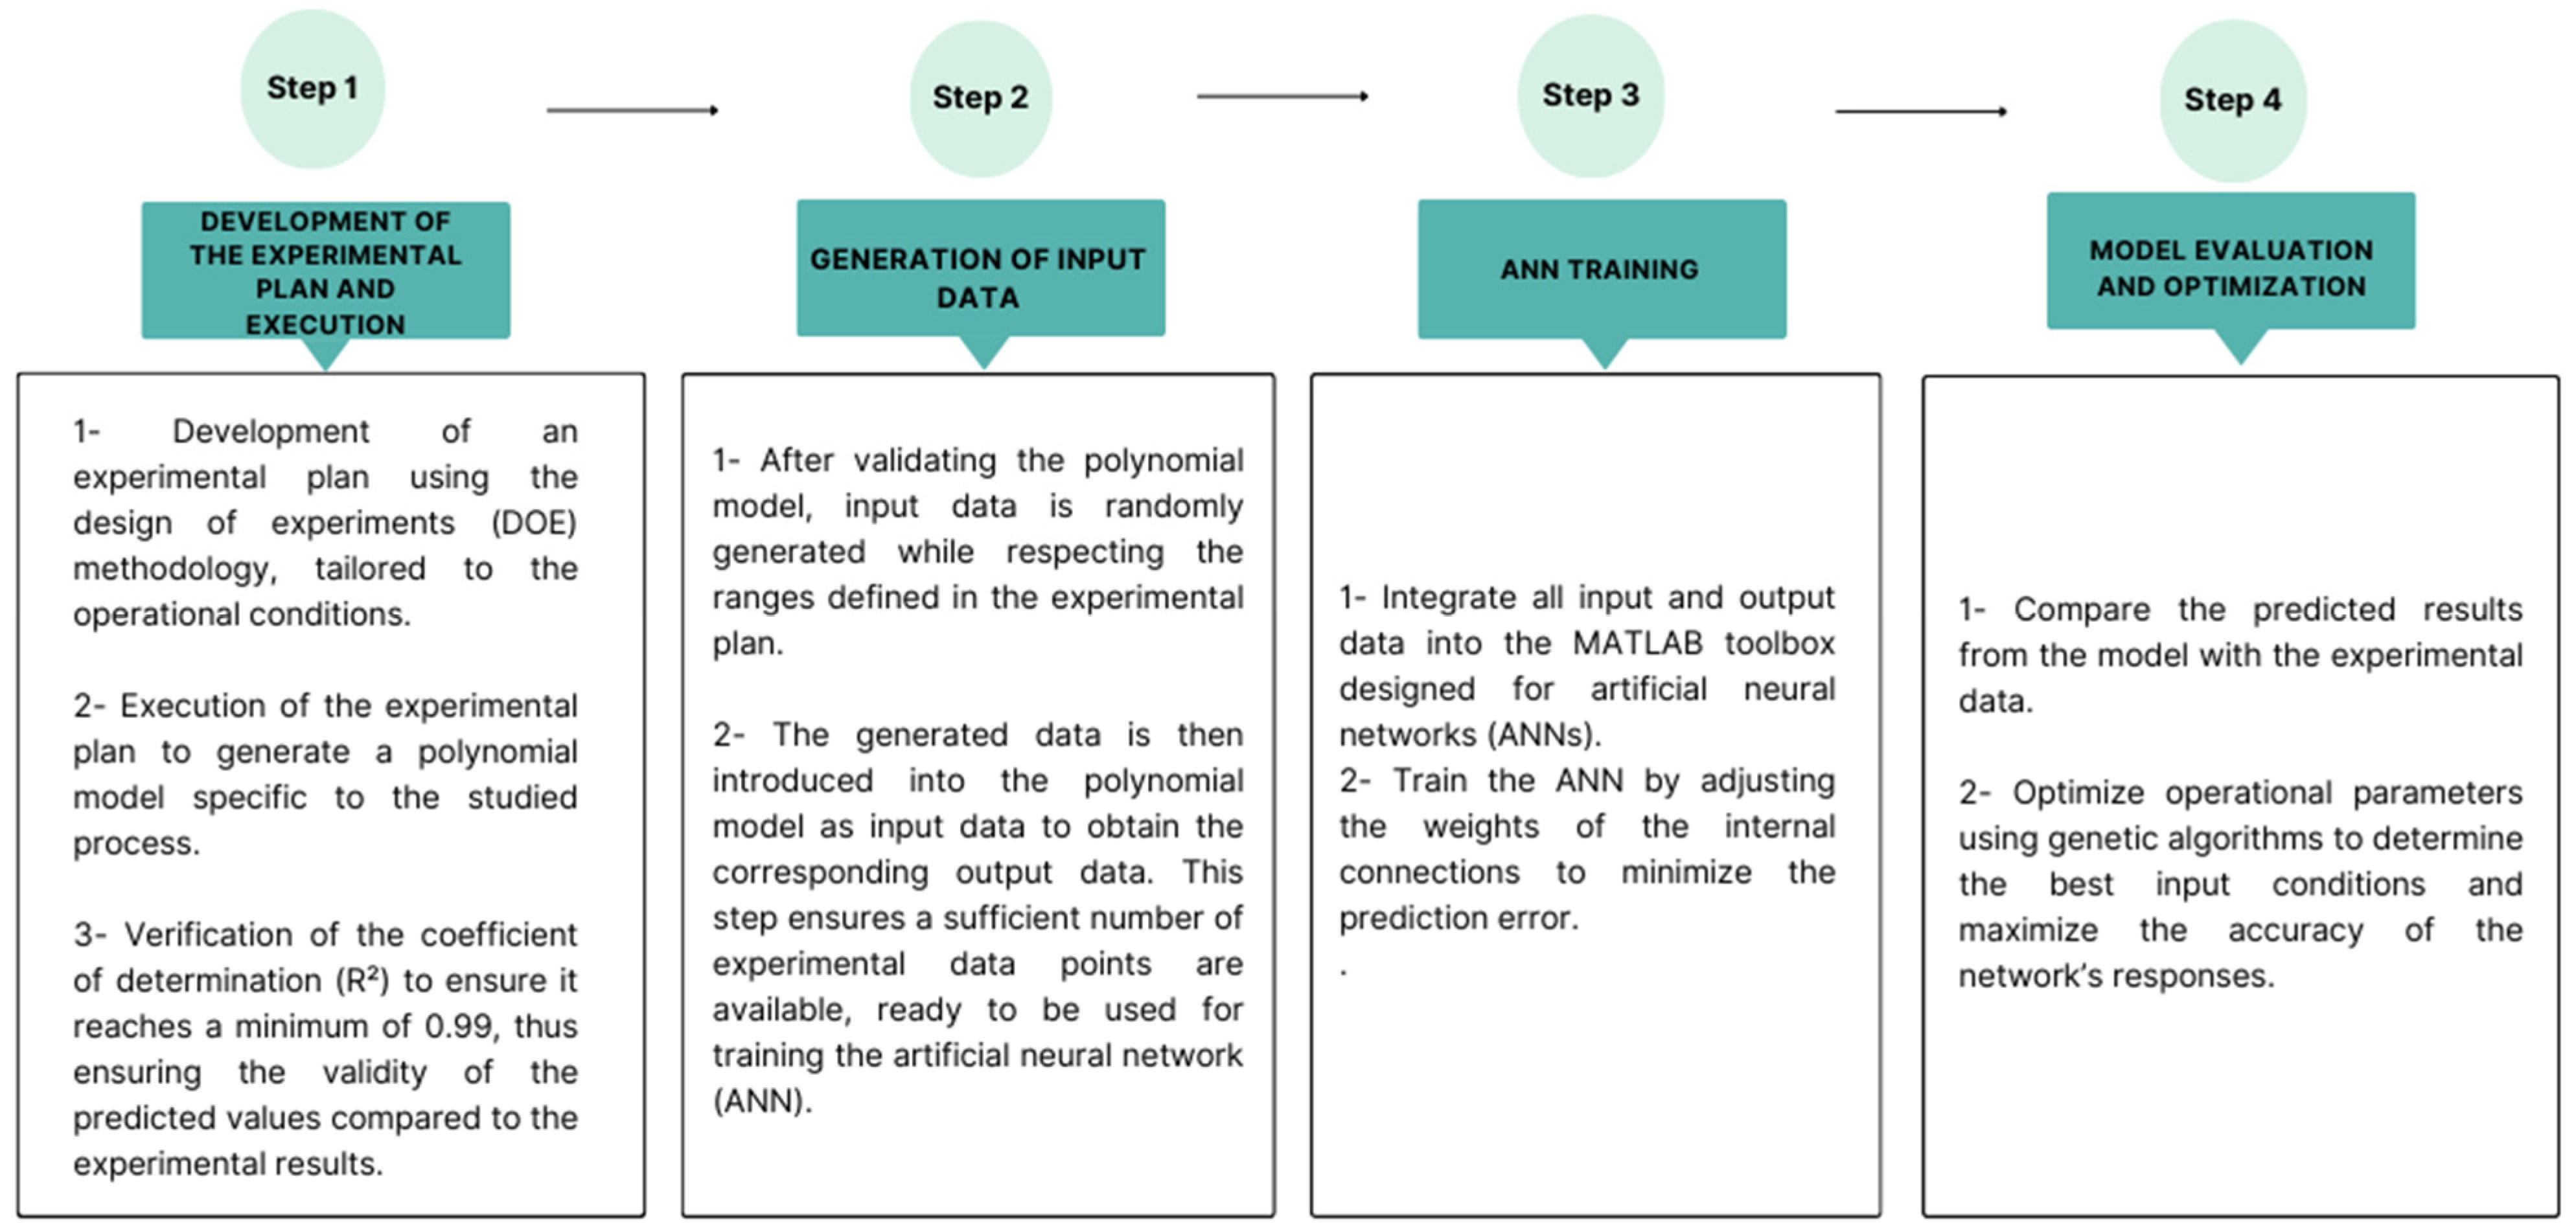
2.5. Data Generation for Network Training

To develop an effective artificial neural network (ANN) model, it is essential to identify the input and output variables, define the experimental space, and collect sufficient data to enable reliable learning and avoid errors related to overfitting.
However, practical constraints such as time and budget often limit the number of experiments that can be conducted. To address these challenges and maximize data acquisition within these constraints, we employed a design of experiments (DOE) approach to develop a polynomial model. This model enabled the generation of a sufficient dataset for training the ANN. The methodology follows a systematic structure, as outlined in Figure 3, ensuring robust data preparation for the ANN training process.
This approach aims to minimize laboratory-scale manipulations while accurately modeling experimental responses. It begins with the development of an experimental design to establish a polynomial model that predicts responses based on predefined factors. These predicted responses must closely align with experimental results, achieving a coefficient of determination (R2) of at least 99%. Once validated, the model generates input variables based on defined factor levels, which are then processed through the polynomial model to obtain corresponding output variables. The compiled results are subsequently used to train the artificial neural network (ANN) via the nntool in MATLAB (version: R2015a)
In this study, we applied this approach using a full factorial design (DOE); however, any experimental design capable of generating a polynomial model could be employed to implement this method.

2.6. GA Optimization

The genetic algorithm (GA) model is based on Darwinian evolutionary theory, where a population of solutions evolves to reach an optimal solution. In this study, two distinct approaches are used to optimize surfactant adsorption at equilibrium [52,53,54,55]: ANN-GA and DOE-GA. The ANN-GA approach combines an artificial neural network with the genetic algorithm, where the trained ANN model serves as the fitness function to guide the optimization. The DOE-GA approach, on the other hand, employs a full factorial design, using the genetic algorithm to optimize the results predicted by the polynomial model derived from the experimental design [56].
The evolutionary process in the genetic algorithm (GA), utilized in both the ANN-GA and DOE-GA approaches, is driven by three key mechanisms: selection, which identifies the fittest individuals; crossover, which generates new solutions by combining parent characteristics; and mutation, which introduces diversity to prevent premature convergence. These mechanisms play a crucial role in optimizing surfactant adsorption. The experimental data establish constraints for the input variables by defining their minimum and maximum values. While there is no universal method for configuring GA parameters, key factors such as population size, mutation rate, selection method, and crossover type were fine-tuned based on the collected data [57,58]. This adjustment ensures efficient convergence and minimizes error in both optimization approaches. The hybrid optimization, combining the design of experiments (DOE), artificial neural networks (ANNs), and genetic algorithms, is illustrated in Figure 4.
The computer codes for optimizing genetic algorithms were developed using MATLAB. Specific constraints were imposed during the optimization process: in both the ANN-GA and DOE-GA approaches, X1 was fixed at −1 (representing the surfactant SDS) or +1 (representing EOR ASP 5100), while X2 and X3 were allowed to vary between −1 and +1. The parameter values used are listed in Table 3.

3. Results and Discussion

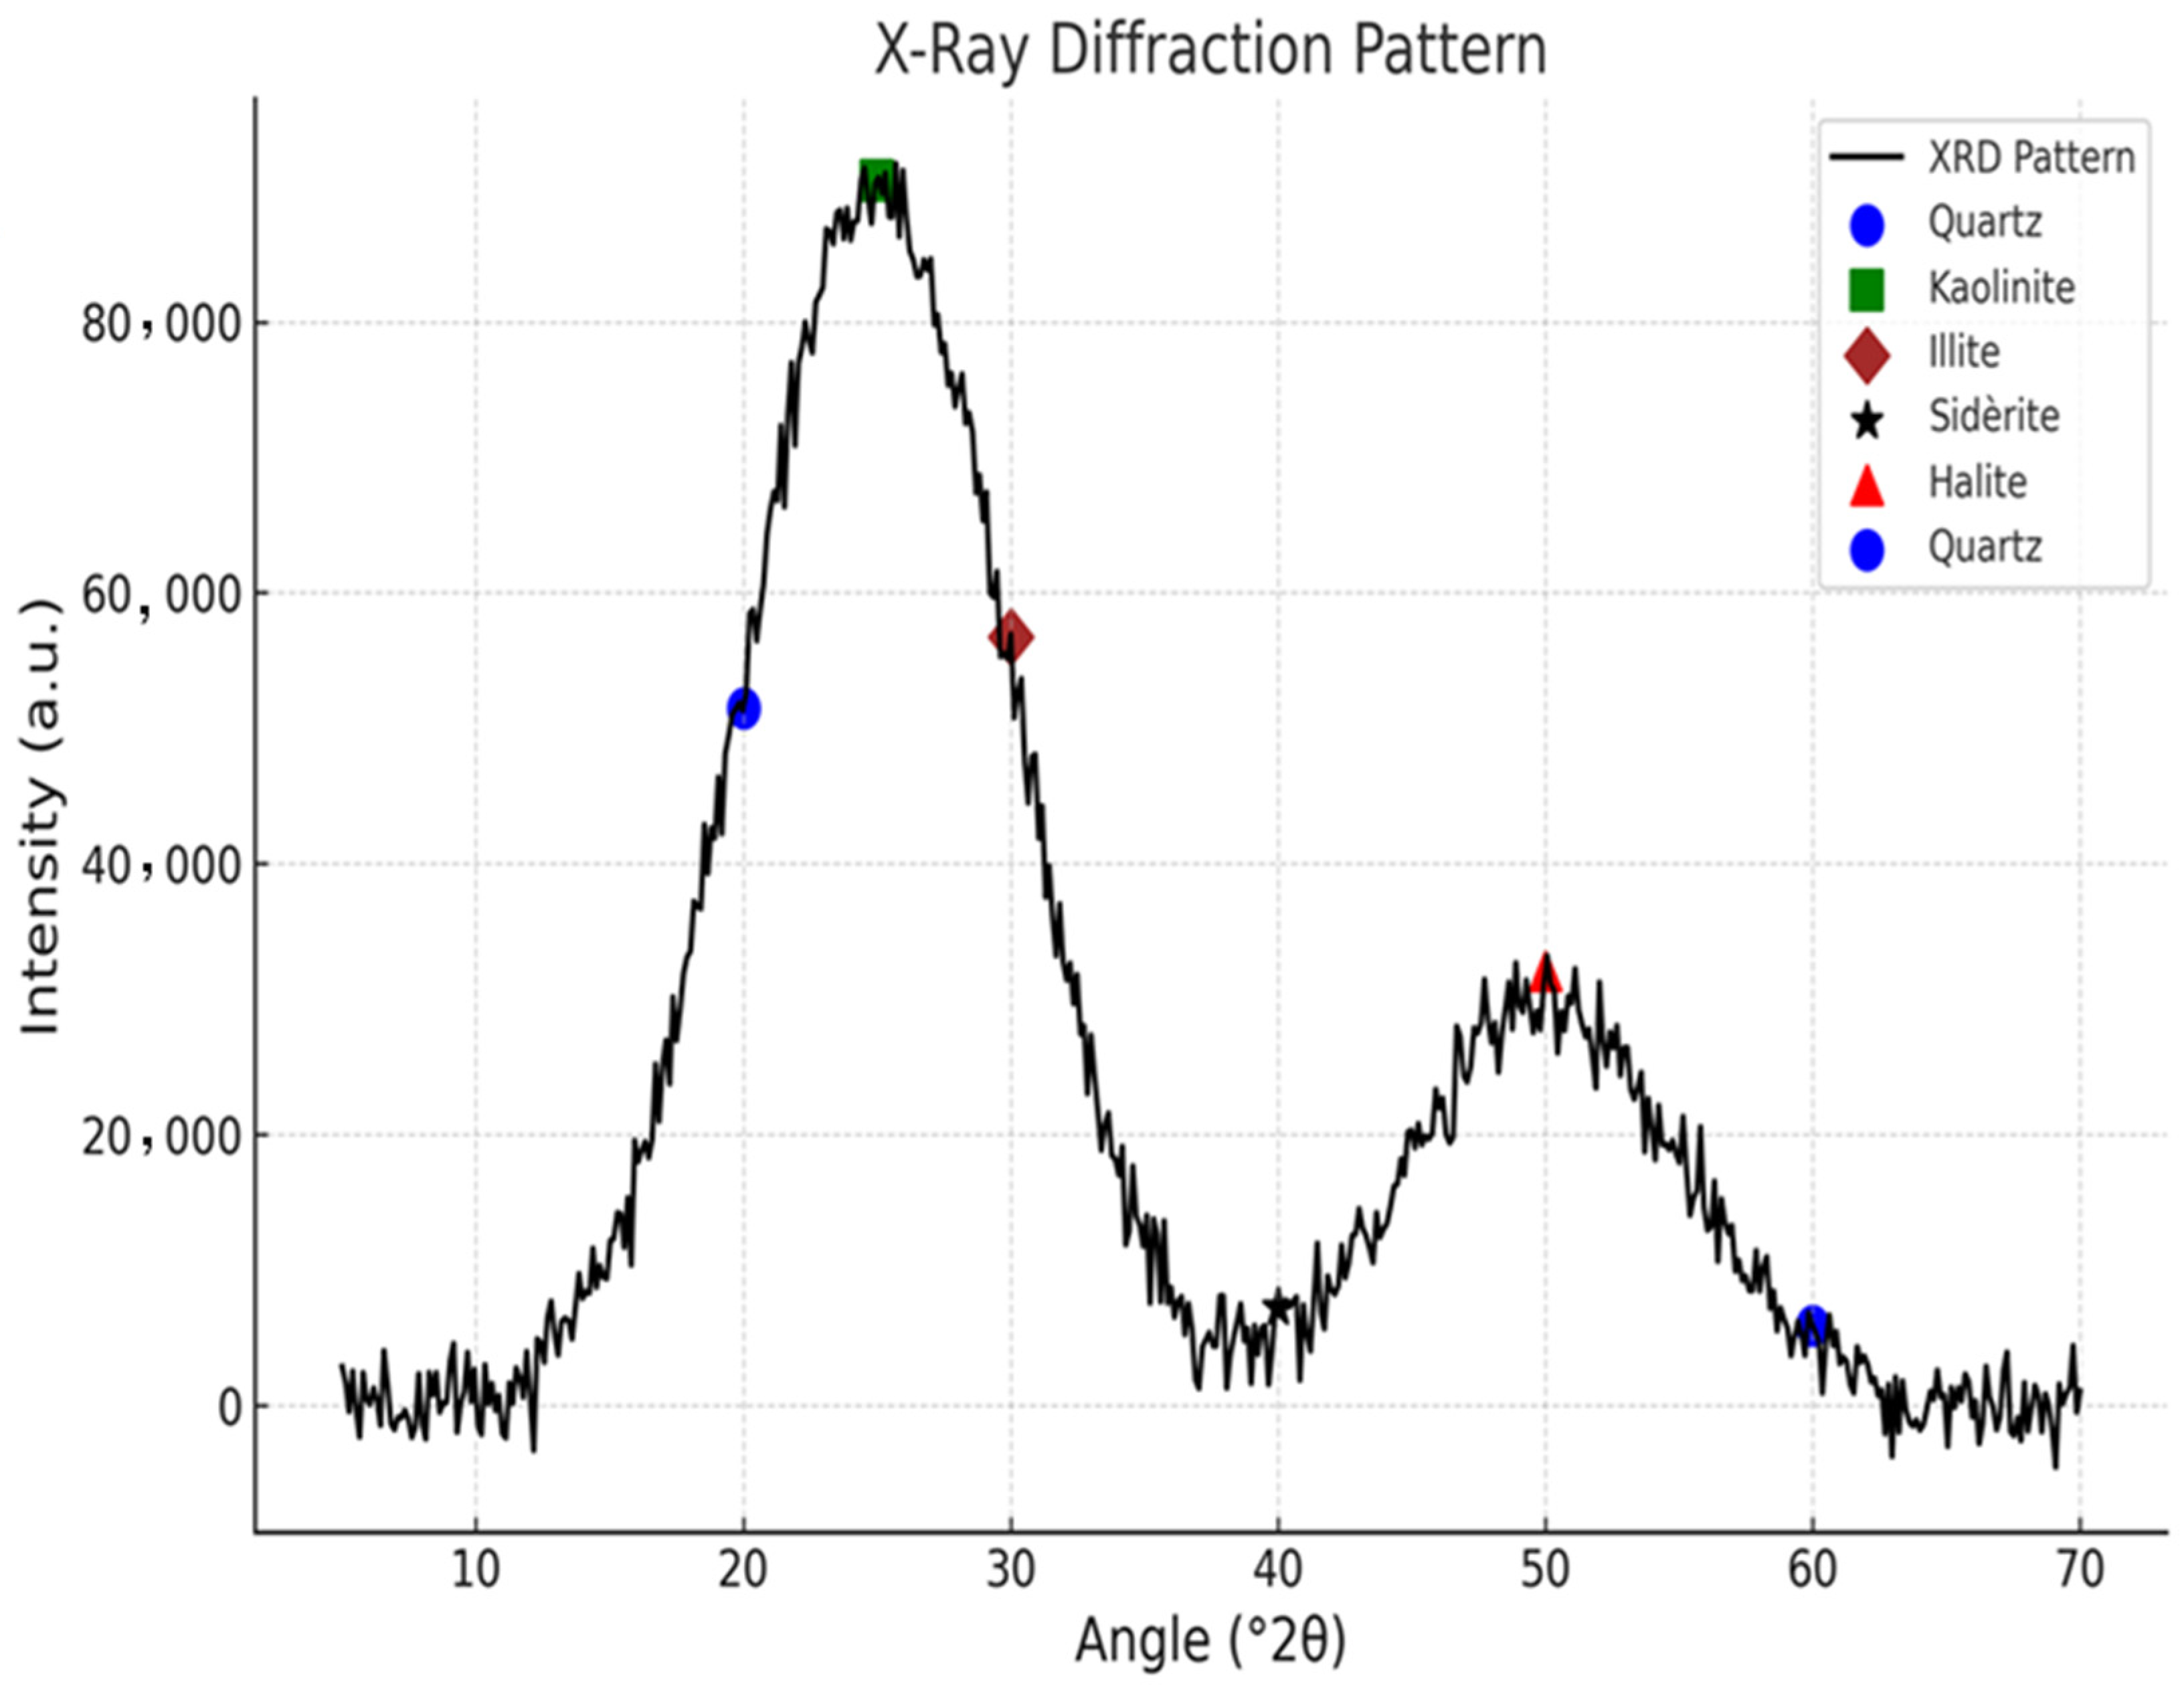
3.1. Characterization Analysis

The XRD pattern shown in Figure 5 presents the X-ray diffraction profile for the Hassi Messaoud rock, with a dominant peak around 26° (2θ), which indicates a high concentration of quartz (SiO2), consistent with a quartz content of 84.64% in the chemical analysis. This suggests a predominantly siliceous surface, which is expected to influence the adsorption behavior of surfactants due to the electrostatic interactions between the surfactant molecules and the mineral surface. The presence of secondary minerals such as kaolinite and illite may also contribute to adsorption through additional surface charges and specific interactions. Other lower-intensity peaks correspond to the presence of secondary minerals such as kaolinite, illite, siderite, and halite. Regarding the BET analysis, the specific surface area of the rock, measured under a nitrogen environment, is 5.71 m2/g, which provides insight into the available adsorption sites. A larger surface area generally favors higher adsorption capacities, as it increases the contact between the surfactant molecules and the rock surface. These factors collectively impact the efficiency of surfactant adsorption, which is crucial for enhanced oil recovery applications. These analyses were published in a previous work [35].

3.2. Prediction with Factorial Design of Experiments
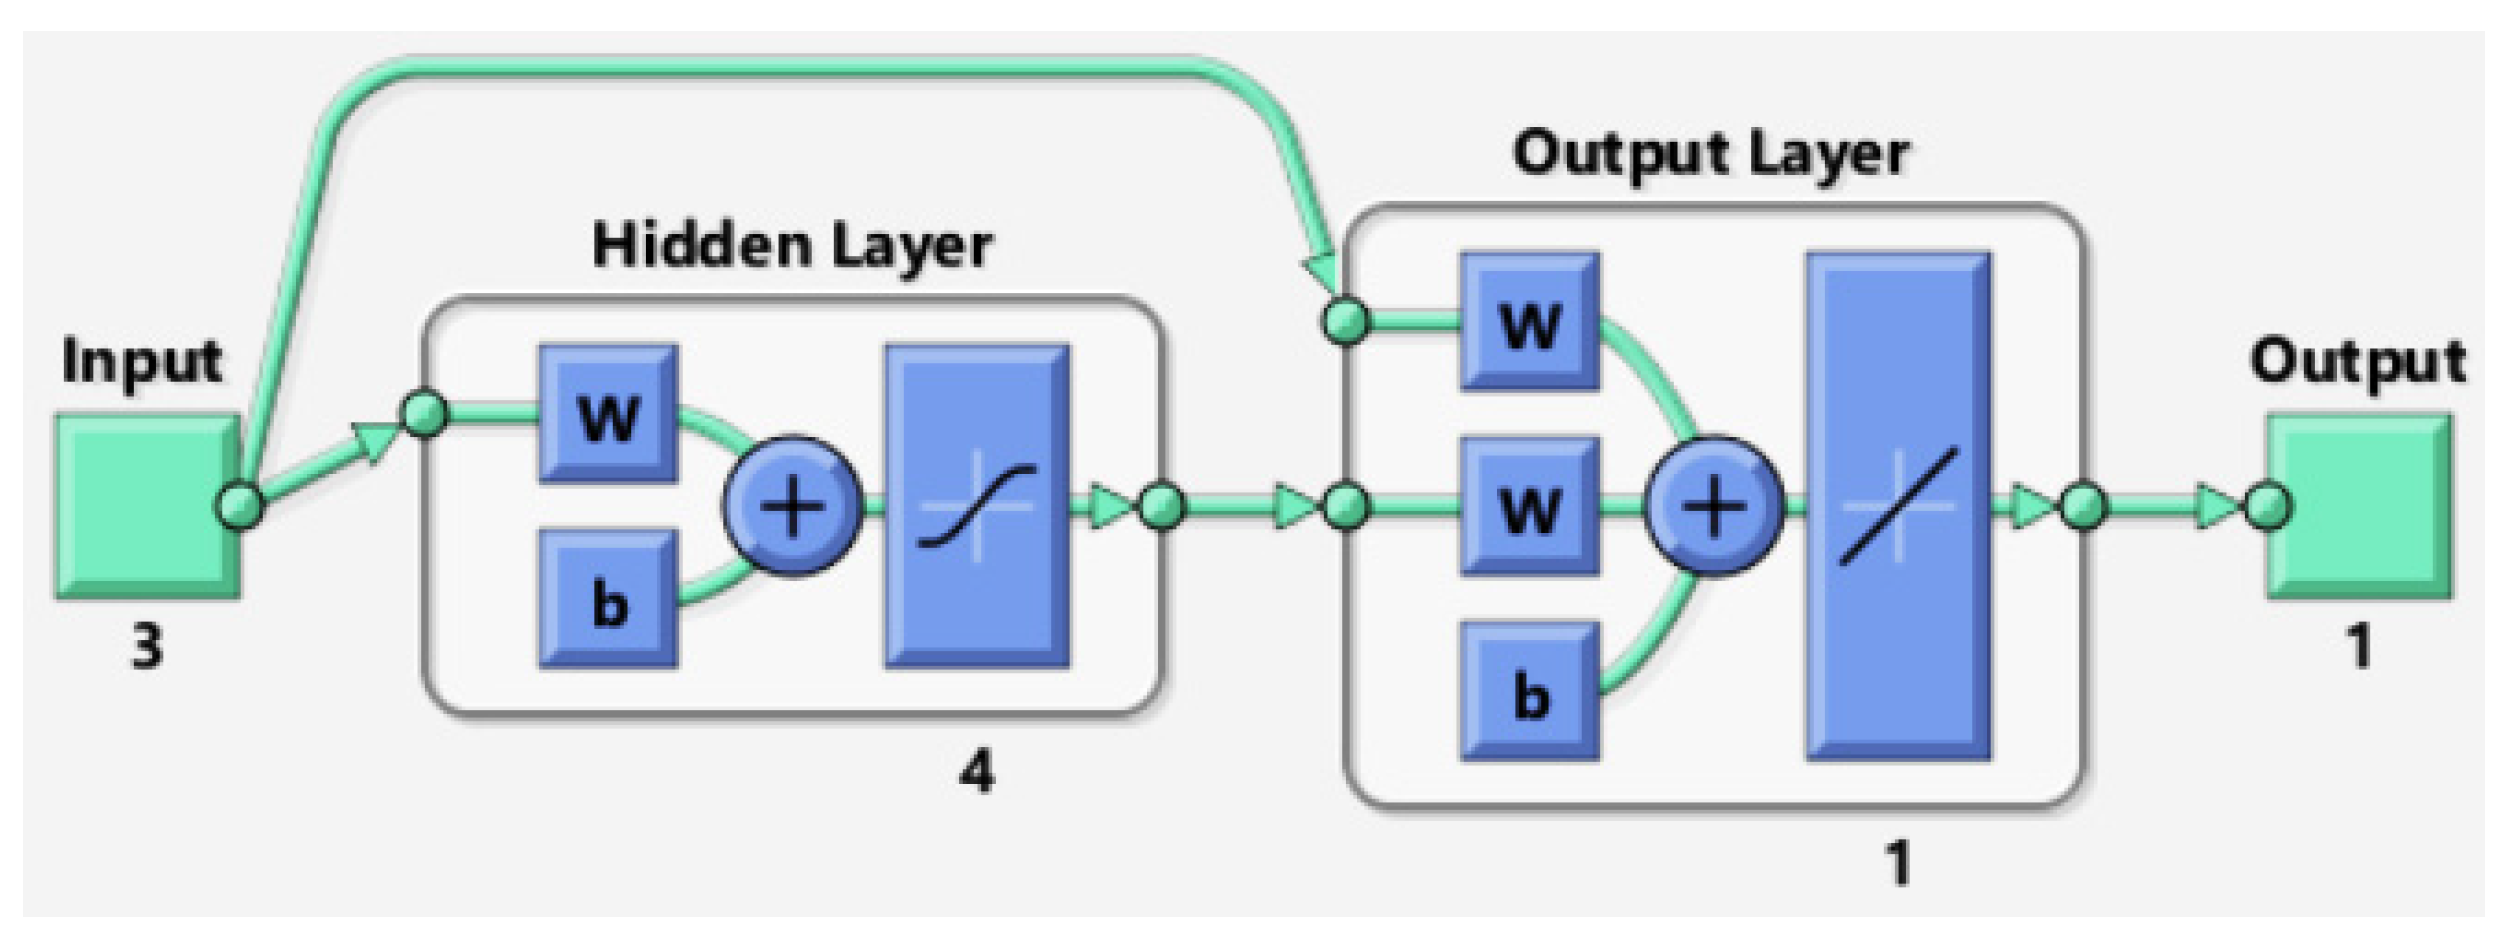
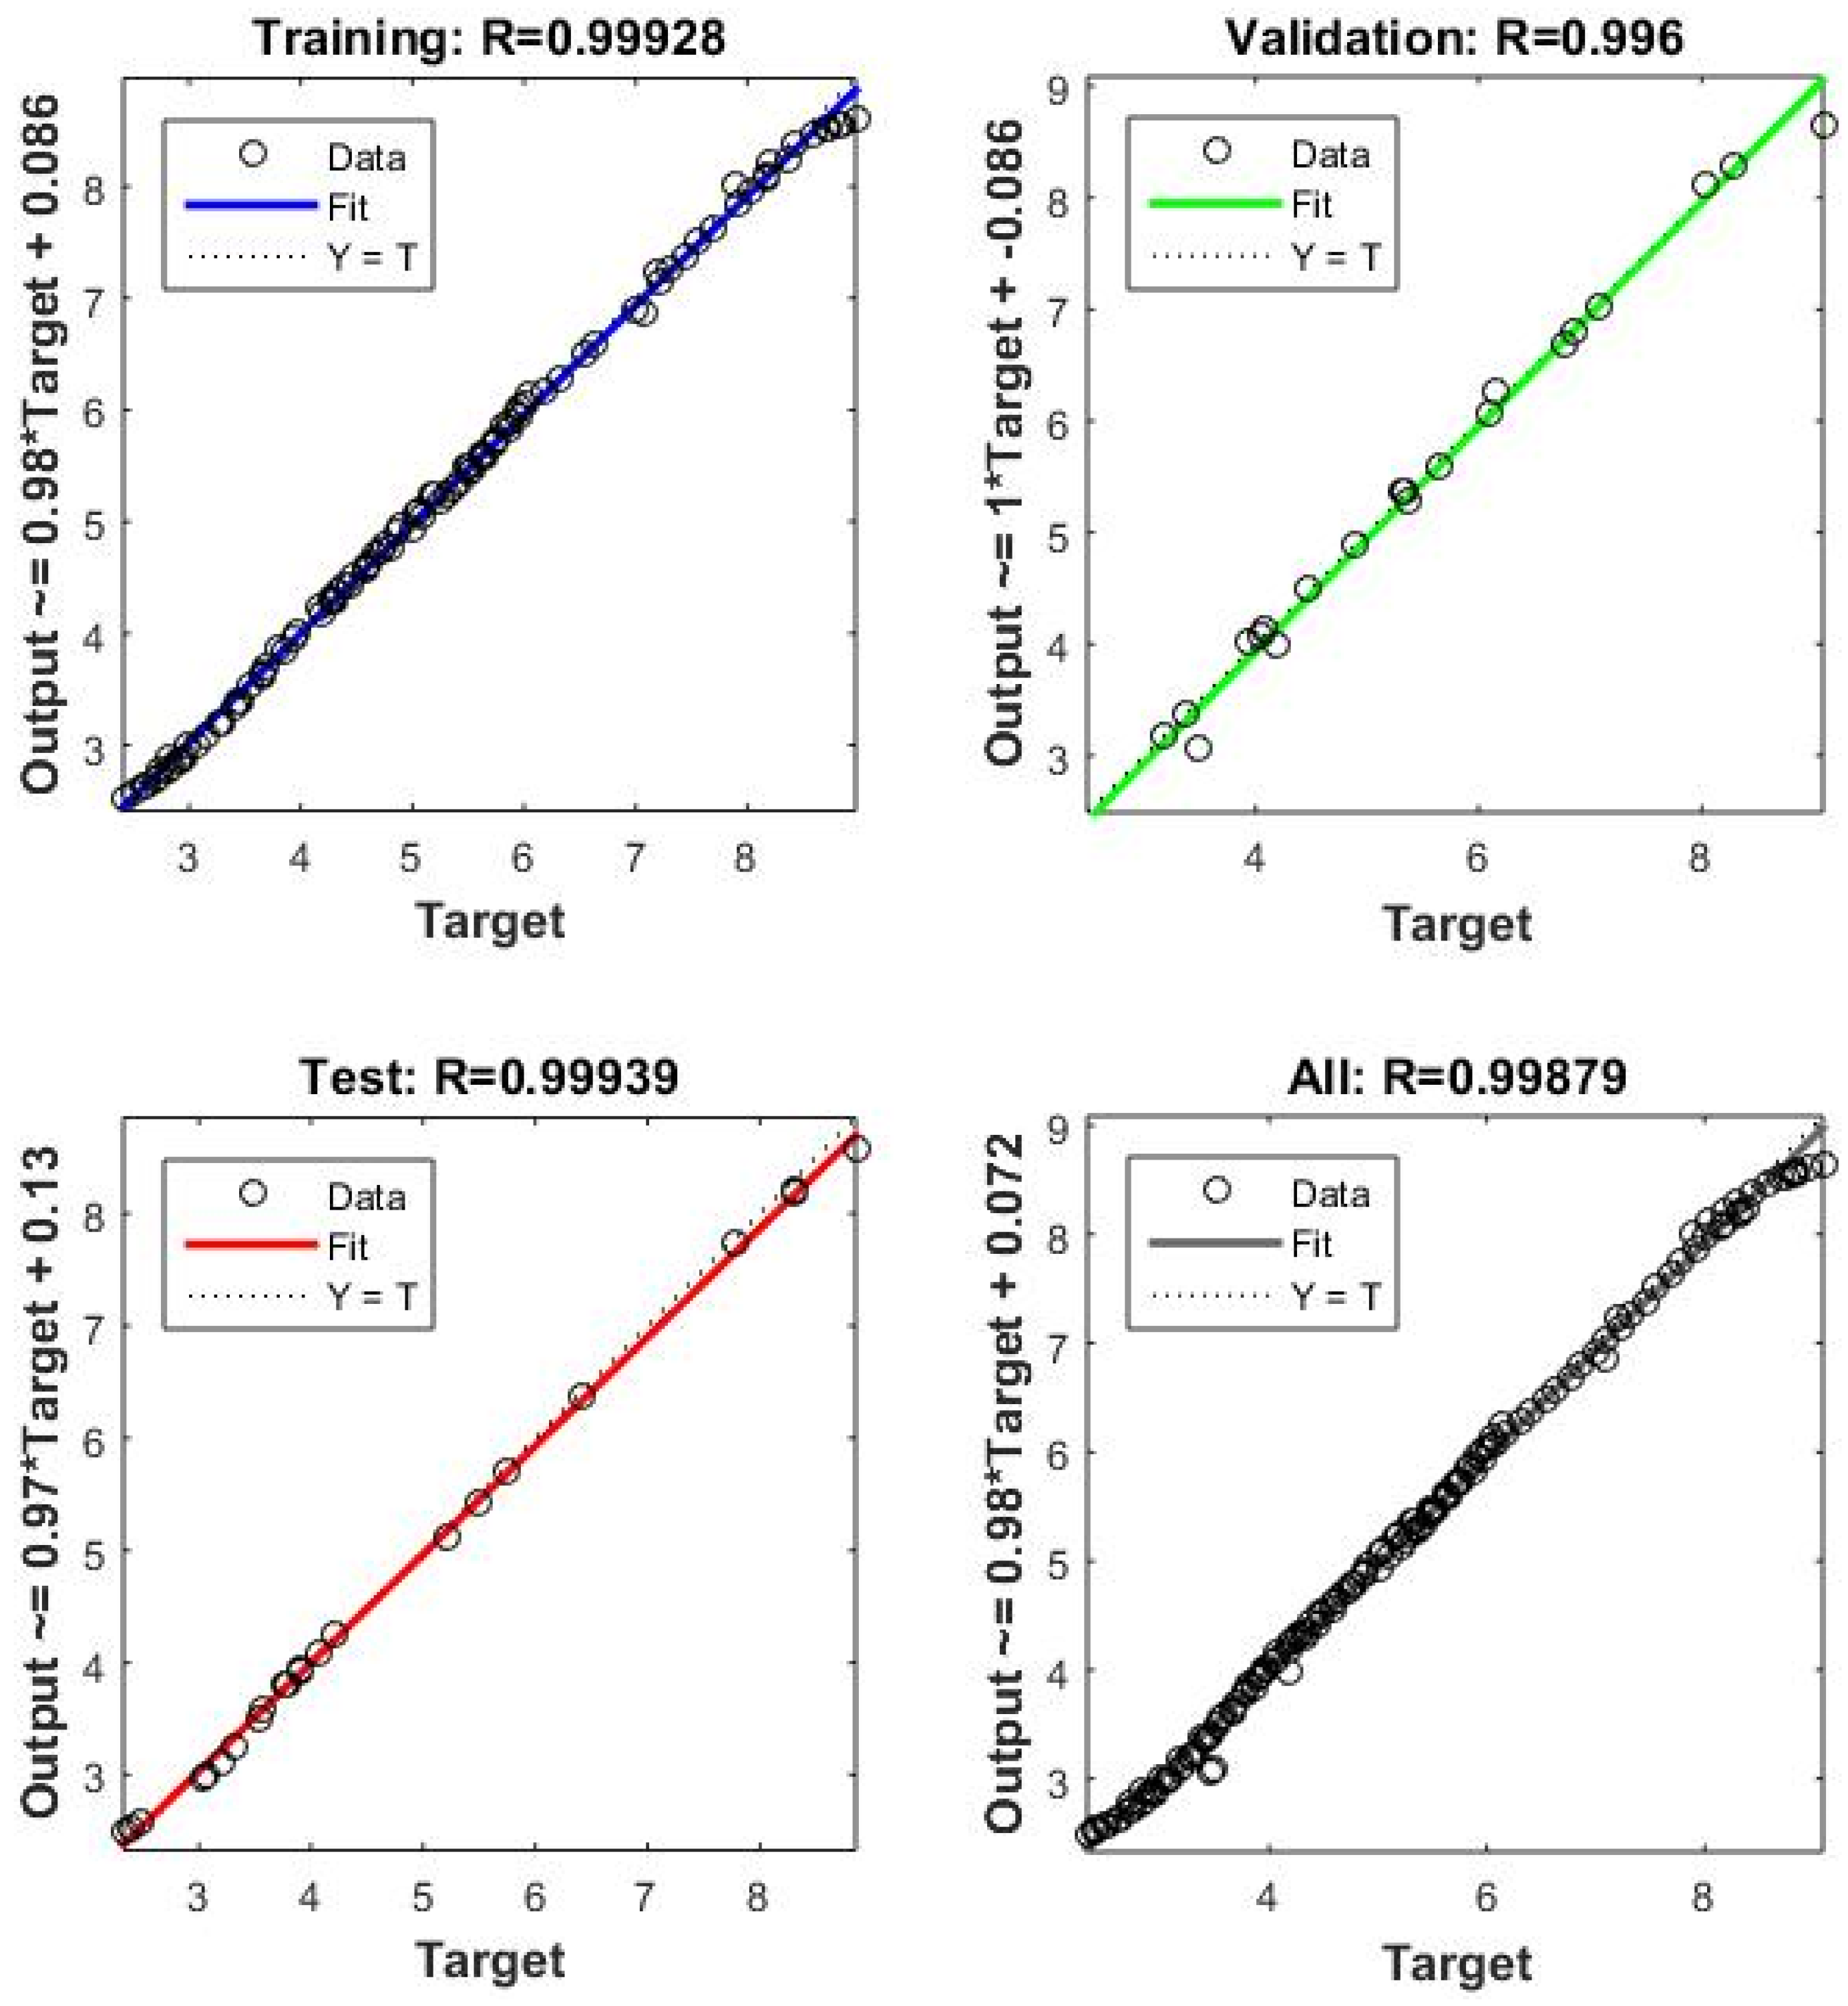
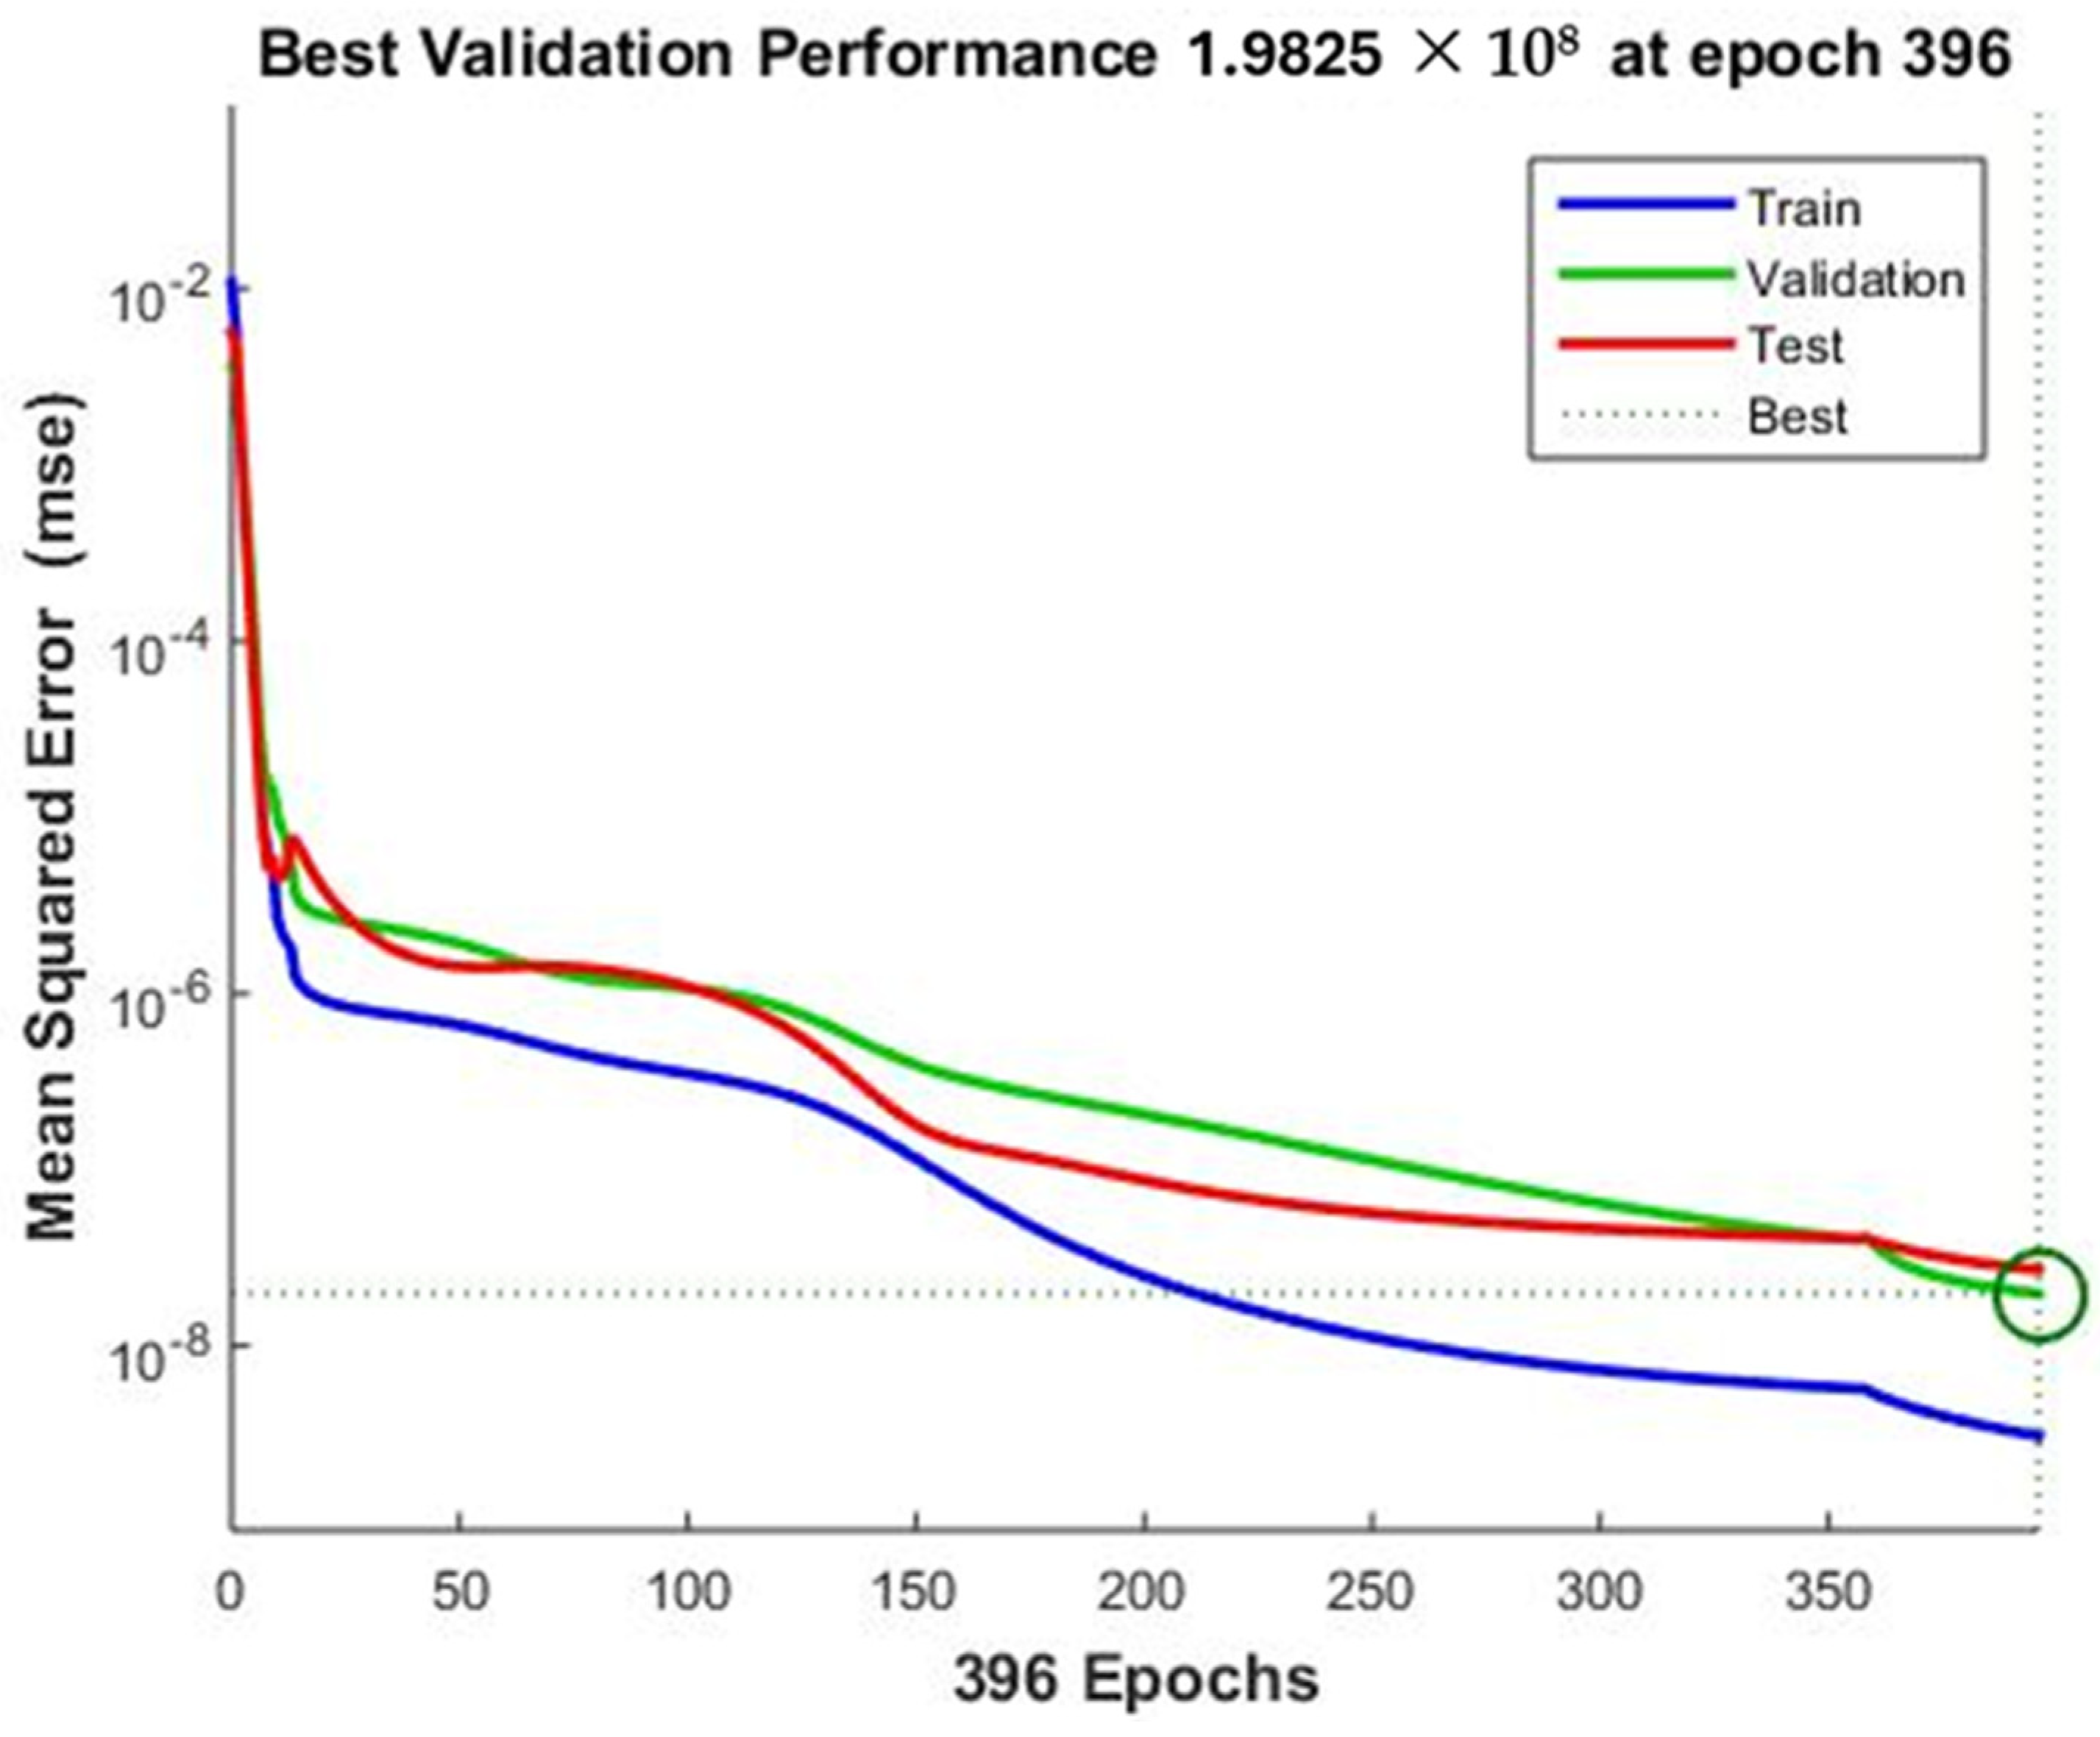
A full factorial experimental design was used to collect the data necessary for training the artificial neural network (ANN). This approach was based on the work developed by Lebouachera et al., who initially focused on analyzing the effects of factors on responses. In our study, we adapted their polynomial model to generate the data required for ANN training. Once optimized, this approach aims to improve both the accuracy and efficiency of the ANN training process [35]. We applied the polynomial model developed by Lebouachera et al. to express the relationship between the input variables and the measured response, as shown in the following:
       Q e m g g = 4.8647625 + ( 0.8340125 X 1 ) + ( 1.7596875 X 2 ) + ( 0.7846875 X 3 ) + ( 0.6303375 X 1 X 2 ) + ( 0.0066375 X 1 X 3 ) + ( 0.2054625 X 2 X 3 )
According to Lebouachera et al., the model exhibits a very high coefficient of determination (R2). The high R2 value of 99.58% and the adjusted R2 of 99.28% indicate that the model effectively correlated the response with the studied parameters [35]. While the high R2 (99.58%) and adjusted R2 (99.28%) values indicate a strong correlation between the model and the experimental data, such a high level of fit can sometimes suggest overfitting, where the model captures not only the true relationship but also noise or minor fluctuations in the data. To mitigate this risk, we relied on an adjusted R2 value, which accounts for the number of predictors and provides a more reliable measure of the model’s generalization capability. Additionally, cross-validation techniques or external validation with independent data can be considered to further assess the model’s robustness. In our case, the ANN training process, which follows the polynomial model, helps in refining the predictive accuracy while reducing overfitting risks.
Subsequently, it was essential to generate values within the defined study range. To achieve this, all input parameter values were carefully selected within the appropriate intervals, as shown in Table 1. One of the main challenges encountered was that the polynomial model used to predict and describe the relationships between factors and responses was expressed in coded values. This introduced complexity in both manipulation and interpretation. To generate a usable dataset and extract modeled responses from the polynomial equation, we developed a specific conversion formula (Equation (8)) to transform uncoded values into coded values:
X c = x m i n + x n x i × I c I n
where Xc is the value in coded units, Xmin is the minimum value in coded units, Xn is the chosen value in uncoded units, Xi is the initial value in uncoded units, Ic is the interval between coded units, and In is the interval between uncoded units.
By converting the values, we generated datasets that accurately reflected the experimental conditions, ensuring consistency with the polynomial model. This approach enabled us to obtain reliable and precise responses based on the experimental design. The final results are presented in Table 4.
A total of 76 experiments were generated. Of these, 70% were used for training, 15% for validation, and 15% for testing. All input and output data were then integrated into the “nntool” toolbox of MATLAB, which is designed for developing and analyzing artificial neural networks.

3.3. ANN Modeling

After generating a dataset based on the predictions of our polynomial model, we used 76 data points to train an artificial neural network. Two ANN architectures were explored: Feed Forward Backpropagation and Cascade Forward Backpropagation [42]. To optimize training, we tested two training functions (trainlm and trainscg) alongside two learning adaptation functions (learngd and learngdm). The hidden layer utilized tansig and logsig transfer functions, while the output layer incorporated purelin and logsig, as detailed in Table 2. This approach resulted in 32 distinct models, each with a unique combination of algorithms and functions (Table 2). To ensure consistency, the number of neurons in the hidden layer was fixed at 12 across all models [46,59].
According to Table 5, which summarizes the different algorithms used for ANN modeling of equilibrium adsorption capacity along with the corresponding MSE and R2 values, the cascade-type neural network emerged as the most effective configuration. This model employed the Levenberg–Marquardt learning function with learngdm adaptation, tansig as the hidden layer transfer function, and purelin for the output layer. It achieved an impressive MSE of 8.90312 × 10⁻⁷ and an R2 of 0.99, demonstrating exceptional accuracy. These results highlight the robustness of the Levenberg–Marquardt algorithm in minimizing error and the adaptability of the learngdm function, making this approach highly suitable for precise predictions in adsorption studies.
The next step in optimizing the functions and network architecture involves determining the optimal number of hidden neurons [60]. To strike a balance between computational efficiency and model complexity, we evaluated a range from 1 to 12 neurons. Table 6 presents the impact of the number of hidden neurons on the ANN model’s performance. Identifying the optimal configuration is expected to enhance predictive accuracy while minimizing the risk of overfitting.
The optimal architecture for the artificial neural network (ANN) model was found to have four neurons in the hidden layer. This configuration achieved an MSE of 6.84028 × 10⁻⁹ and an R2 of 0.99, demonstrating excellent predictive accuracy. The selection of 4 neurons was based on a performance evaluation of architectures ranging from 1 to 12 neurons. Beyond four neurons, the model could show signs of overfitting, while fewer neurons could lead to underfitting. This configuration provided the best balance between accuracy and generalization. Figure 6 presents the schematics of the optimal neural networks used in this study, generated using MATLAB.
Figure 7 presents the correlation between the model’s predicted outputs and the target values for the training, validation, and test phases, as well as for the complete dataset. The graph shows that the correlation coefficient (R) remains consistently close to 1 across all phases of training, validation, and testing, as well as for the overall dataset. This high correlation signifies an excellent alignment between the model’s predictions and the actual values, indicating that the model successfully captures the underlying relationships between the input variables and the target values, thereby ensuring reliable and accurate predictions [61,62].
Figure 8, which illustrates the performance graph, depicts the progression of the mean squared error (MSE) as a function of the number of training epochs. The error gradually decreases for the training, validation, and test sets, indicating continuous model improvement. The stabilization of the green curve (validation) after epoch 386 suggests that the model reached its optimal validation point at this stage, with an MSE of 1.9825 × 10⁻⁸. After 386 epochs, the ANN model reaches its stabilization point, indicating that the network has correctly learned the relationships between the inputs and the output. This point ensures an optimal balance between learning and the model’s ability to predict the data accurately without overfitting [62,63].
The error histogram in Figure 9 illustrates the distribution of the differences between the predicted and actual values for the artificial neural network model across the training, validation, and test datasets. Most errors are concentrated around zero, indicating strong model performance and predictions that closely match the actual targets. The maximum error is approximately 0.001957, while the minimum error is around 0.08264, demonstrating that even the largest deviations remain relatively low. These results suggest that the model is well-fitted and generalizes effectively to unseen data, as evidenced by the low errors observed in both the validation and test sets [63].
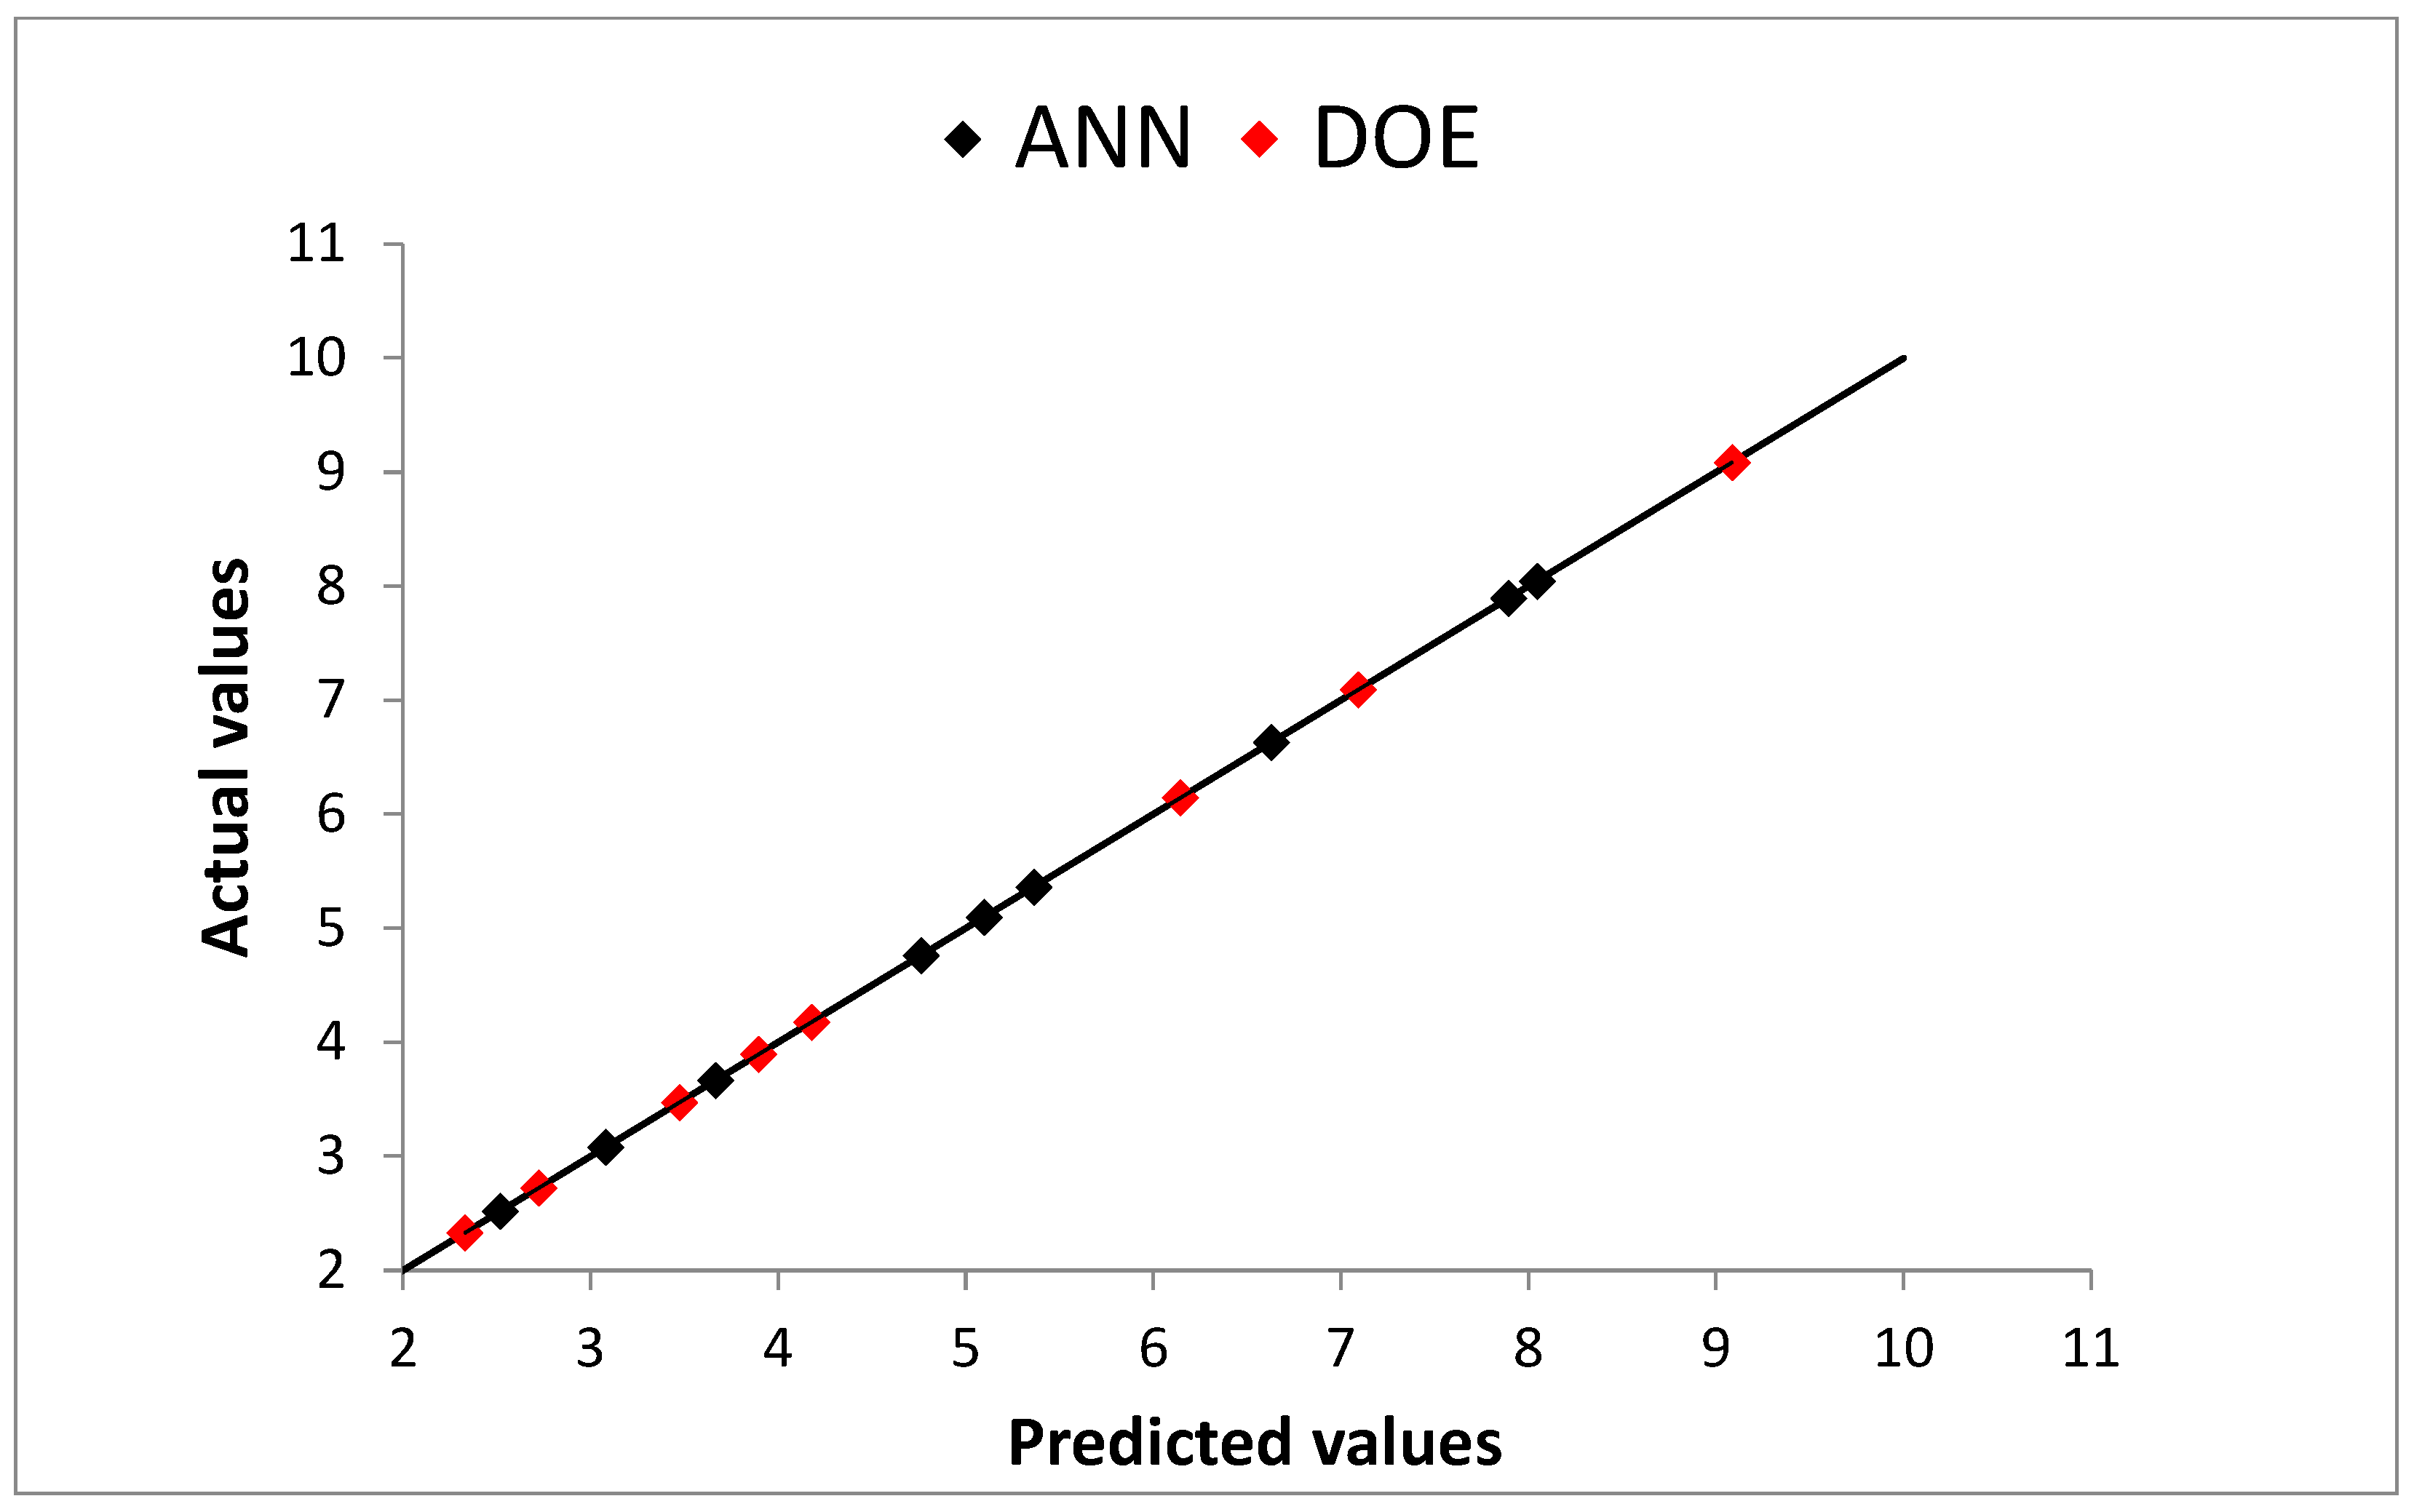
  • Comparison of the developed DOE and ANN models
A comparative analysis was conducted between the two developed models of artificial neural networks (ANNs) and the full factorial design of experiments (DOE) to model the adsorption of surfactants on Algerian rock. Figure 10 illustrates the performance comparison for predicting the equilibrium adsorption capacity (Qe) based on both predicted and experimental responses. The results indicate a minimal difference between the two methods, highlighting their reliability in accurately modeling surfactant adsorption.
To enhance this comparative analysis, several statistical indicators were utilized, including the performance factor (PF/3) (Equation (10)), relative error (RE) (Equation (9)), coefficient of determination (R2) (Equation (6)), and mean squared error (MSE) (Equation (5)). These metrics provide a precise evaluation of each model’s reliability and consistency in predicting adsorption behavior relative to the experimental data [64].
R E = 1 n E i P i i E i × 100
P F 3 = 100 γ 1 + V A B + C V 100 3
where n represents the number of data sets used, E represents the actual experimental data, and P represents the data predicted by the model. The PF/3 is a composite metric that integrates three different statistical measures, as follows:
Coefficient of Variation (CV): Measures the relative variability of the data with respect to the mean.
C V = 1 n ( P i   E i ( P i E i P i 2 ) ) 2 P ¯ × 100
Gamma Factor (γ): An indicator of the model’s fit quality, which can vary depending on the context.
l o g 10 γ = 1 n l o g 10 P i E i l o g 10 P i E i ¯ 2
Variance of Absolute Bias (VAB): Assesses the dispersion of absolute biases between the experimental data and the model’s predictions.
V A B = 1 n P i E i P i / E i E i / P i 2 E i P i P i / E i E i / P i
Table 7 presents a comparative analysis of the statistical indicators for the full factorial design of experiments (DOE) and artificial neural networks (ANNs). Both methods achieve a high coefficient of determination (R2 = 0.99), indicating a strong fit to the experimental data. However, while the DOE exhibits slightly better accuracy in terms of relative error, the ANN outperforms in key metrics such as the performance factor (PF/3 = 0.001570579) and mean squared error (MSE = 6.84028 × 10⁻⁹). These results highlight ANN’s superior ability to model complex relationships with higher precision, making it a more reliable choice for predicting surfactant adsorption behavior.

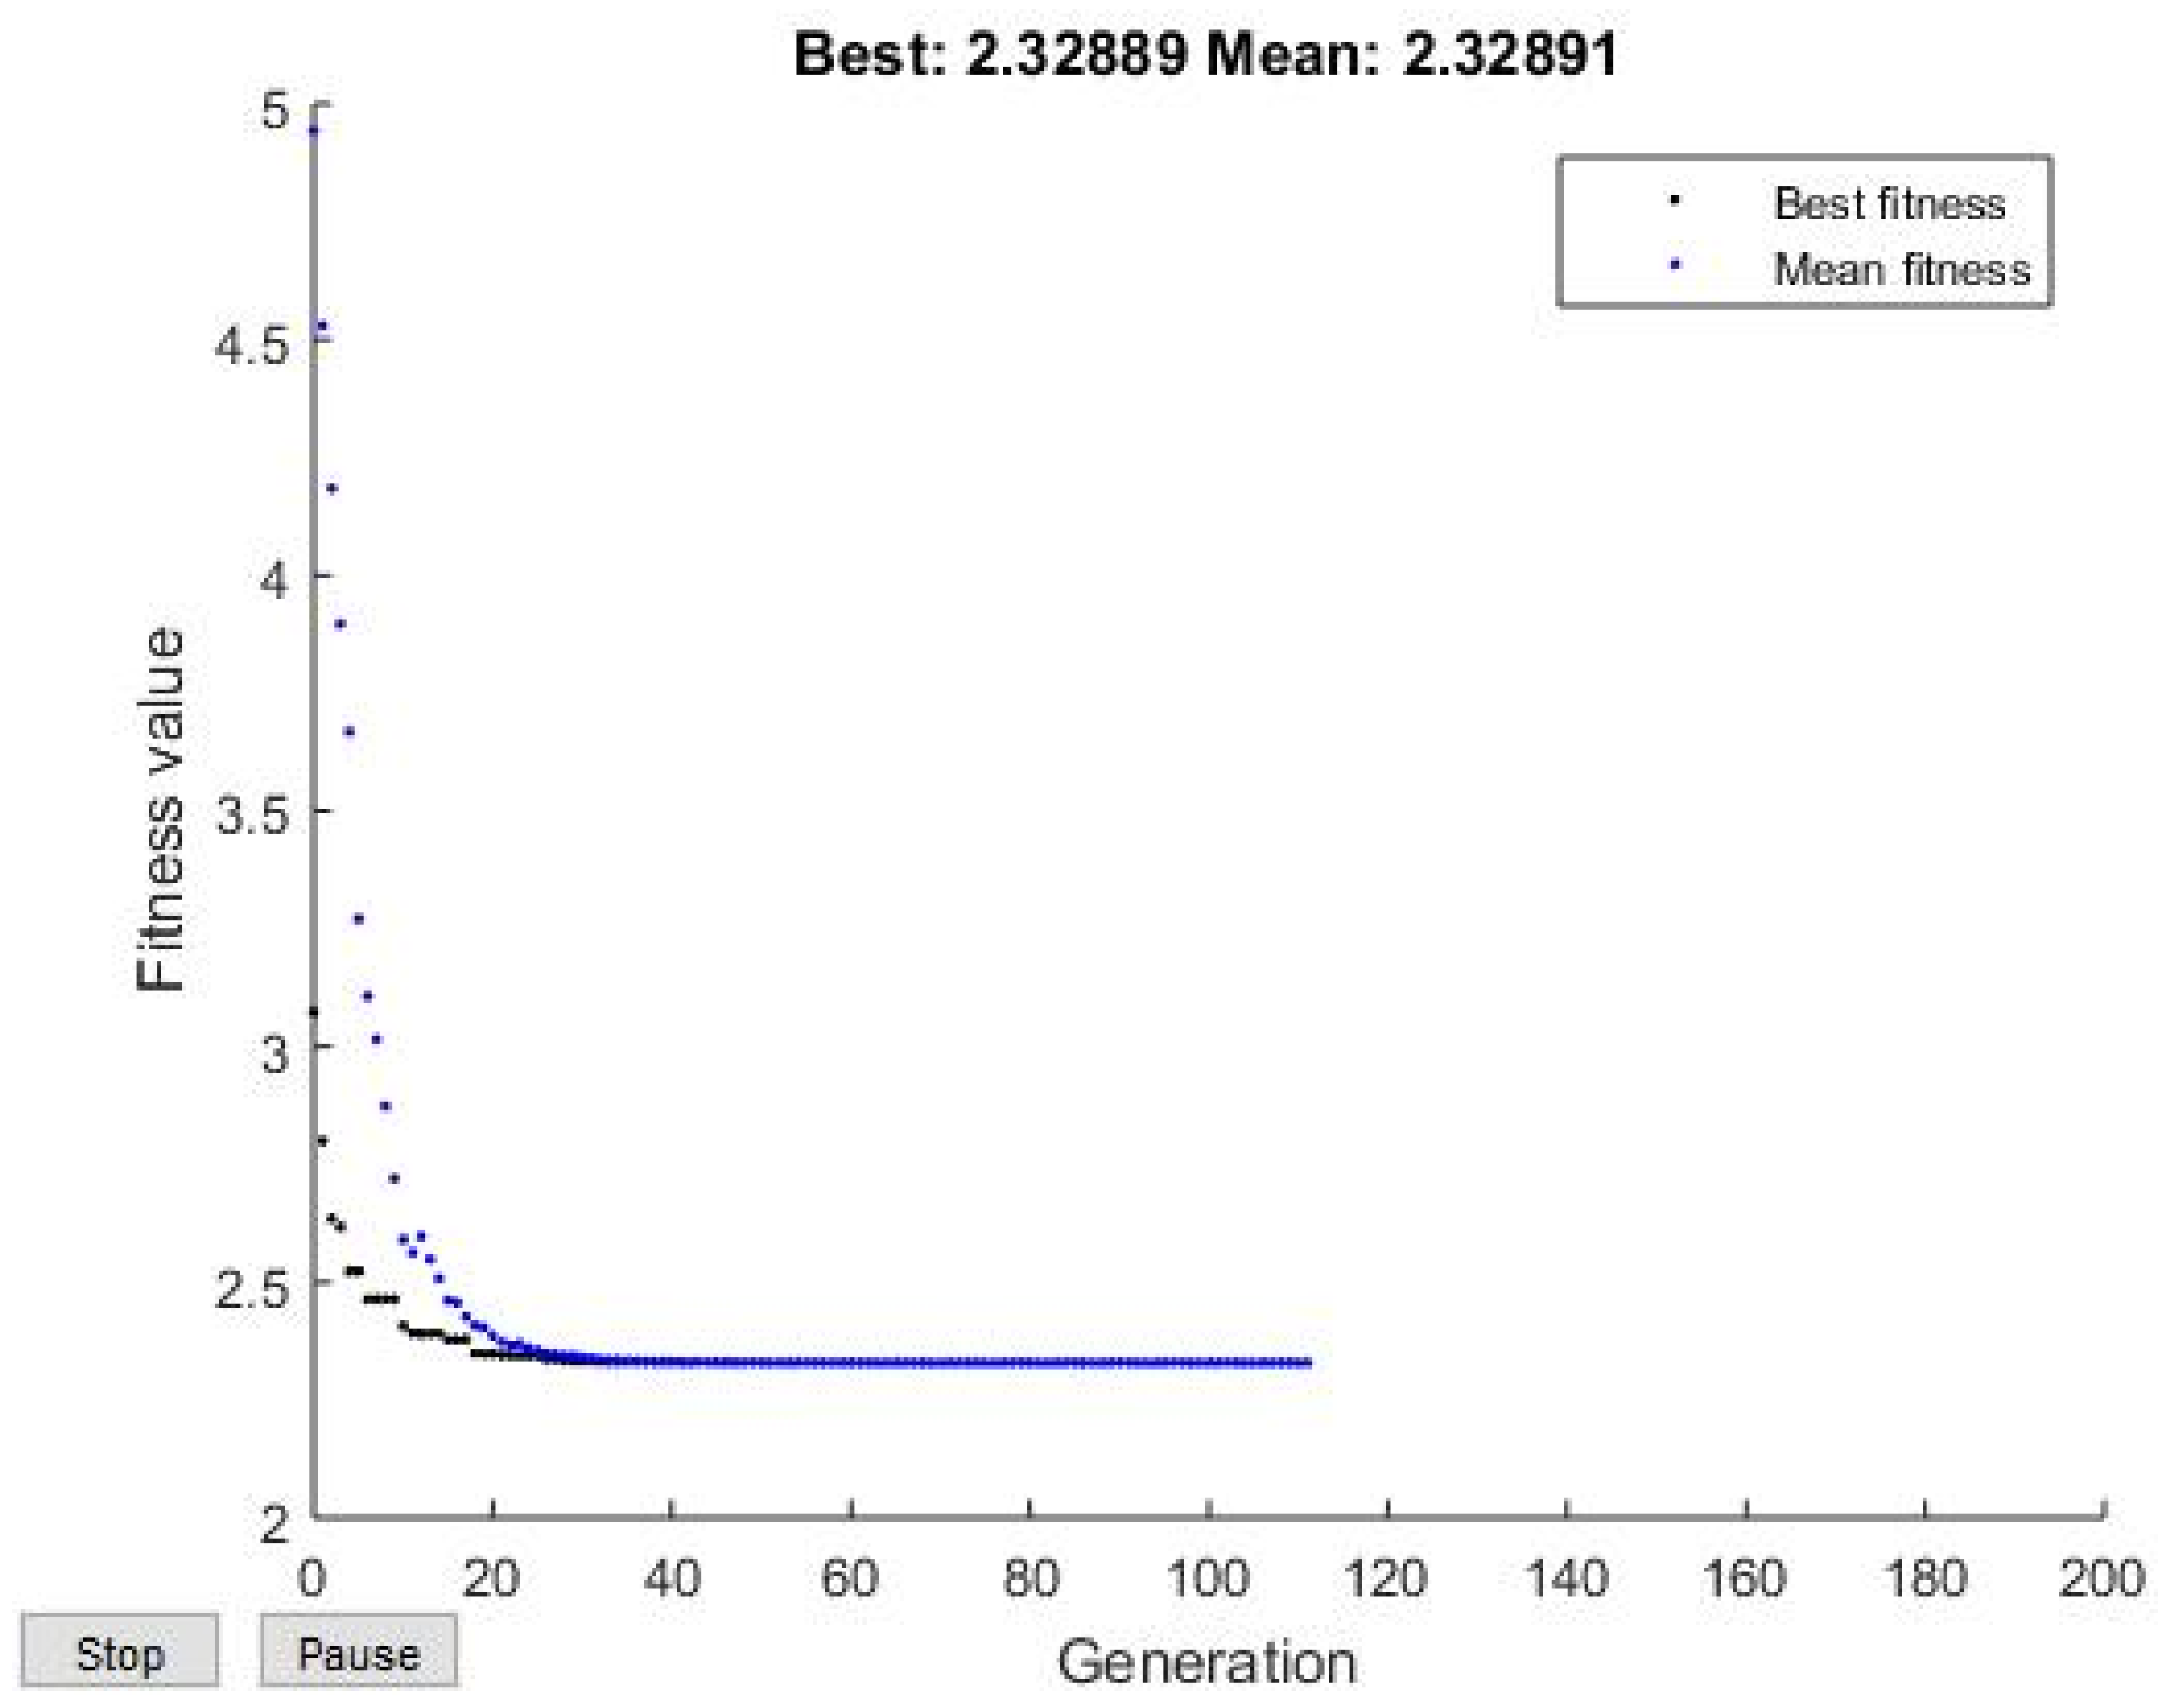
3.4. GA Optimization

Three distinct approaches were employed to optimize the adsorption process: ANN coupled with a genetic algorithm (ANN-GA), DOE combined with a genetic algorithm (DOE-GA), and DOE integrated with a numerical method based on the desirability function (DOE-DF). For optimization using ANN-GA, the final trained ANN model was used as the fitness function. In the case of DOE-GA optimization, the fitness function was formulated as a polynomial equation, where the response Qe is calculated as a function of the variables X1, X2, and X3.
Figure 11 and Figure 12 illustrate the evolution of fitness values over generations for the DOE-GA and ANN-GA models. In both cases, significant improvements in fitness were observed during the initial generations, followed by rapid stabilization. Both models reached convergence after approximately 20–30 generations, indicating the efficiency of the genetic algorithm. The small difference between the best fitness value and the average fitness further confirms the reliability of both methods.
For both optimization methods, the optimal adsorption conditions were obtained using sodium dodecyl sulfate (SDS) at a concentration of 200 ppm and a temperature of 25 °C (uncoded values). Additionally, a third optimization approach, developed by Lebouachera et al. [35], utilized the desirability function of Derringer and Suich (1980), a widely applied method for multi-response optimization in industrial applications [65]. This method focused on minimizing the adsorption capacity (Qe). According to the results obtained from the prediction profiler function, the optimal conditions were found to be a surfactant concentration of 200 ppm and a temperature of 25 °C, yielding a predicted Qe of 2.3289 mg/g with a desirability value of 0.942118.
  • Comparison between DOE-GA, ANN-GA, and DOE-DF
The comparison of the three optimization methods—DOE-GA, ANN-GA, and DOE-DF—reveals that they all converge toward the same optimal adsorption conditions: an SDS concentration of 200 ppm and a temperature of 25 °C. As shown in Table 8, the predicted values for each approach are remarkably close: 2.32889 for DOE-GA, 2.3247 for ANN-GA, and 2.3289 for DOE-DF. This similarity in results confirms the effectiveness of genetic algorithms (GAs) in optimizing input parameters, regardless of the model used.
Given this convergence, our choice fell on ANN-GA, not due to a significant difference in optimization but rather because of its superior predictive capability. Although the response predicted by ANN-GA is slightly lower than those obtained with DOE-GA and DOE-DF, this difference remains minimal and does not diminish the efficiency of the other methods. Thus, all approaches remain viable, and the choice of one over another depends on the specific requirements of the studied problem.

4. Conclusions

This study successfully achieved its primary objective of predicting and optimizing the adsorption of surfactants on an Algerian reservoir rock from Hassi Messaoud. Artificial neural networks (ANNs) were employed to model the adsorption process, focusing on three key parameters: surfactant type (SDS and EOR ASP 5100), surfactant concentration, and temperature. Following the prediction phase, operational parameters were optimized using genetic algorithms (GAs).
The prediction using ANN was conducted in several stages. First, data were generated from a polynomial model established in a previous study. This dataset enabled effective training of the neural network, leading to precise predictions of adsorption responses.
The network’s performance was then evaluated by testing 32 mathematical models. The best-performing model employed the cascade-type neural network, the Levenberg–Marquardt learning function with learngdm adaptation, tansig as the hidden layer transfer function, and purelin for the output layer. With an optimal configuration of four neurons in the hidden layer, this model achieved an exceptional MSE of 6.84028 × 10⁻⁹ and an R2 of 0.99 without overfitting, as confirmed by performance analysis on training, validation, and test sets.
It sounds like all three optimization methods, ANN-GA, DOE-GA, and DOE-DF, converged on the same optimal conditions, which reinforces the robustness of the findings. The minimal differences in predicted adsorption values suggest that all approaches are valid, though ANN-GA demonstrated slightly lower predictions. Given that ANN-GA and DOE-GA achieved rapid convergence within 20–30 generations, it highlights the efficiency of the genetic algorithm in optimizing surfactant adsorption.
Artificial neural networks (ANNs) trained using the design of experiments (DOE) approach have proven highly effective in capturing complex, nonlinear relationships with remarkable accuracy. Their adaptability to experimental data makes them a powerful predictive tool for adsorption processes, significantly reducing both time and laboratory costs. In terms of optimization, each method demonstrated distinct advantages. ANN-GA excelled in handling intricate relationships with superior precision and adaptability, while DOE-GA and DOE-DF provided mathematically structured solutions that are more straightforward and easier to implement in practical applications.
The results obtained in this study provide valuable insights for the oil industry, particularly in optimizing surfactant adsorption processes in EOR. This approach not only enhances the accuracy of adsorption predictions but also facilitates the optimization of operating conditions for key influencing parameters. Moreover, it significantly reduces the reliance on costly and time-consuming laboratory experiments by offering a systematic and efficient predictive framework.
However, the main limitation of ANN and ANN-GA models lies in their dependence on specific reservoir conditions. Variations in key factors such as rock type or other reservoir characteristics require retraining the model, rendering previous versions obsolete and limiting their direct applicability to different geological settings. Additionally, while ANN or ANN-GA excels in prediction and identifying optimal conditions, despite techniques designed to improve the interpretability of ANNs, such as SHAP (Shapley Additive Explanations), saliency maps, and LIME (Local Interpretable Model-agnostic Explanations), artificial neural networks (ANNs) are often perceived as “black boxes” that are difficult to exploit due to the complexity of their internal mechanisms, making it difficult to interpret results in a physically meaningful way. This lack of transparency presents a significant challenge when a deeper understanding of the underlying mechanisms is essential.

Author Contributions

Methodology, K.I.B. and S.E.I.L.; Formal analysis, K.I.B.; Investigation, K.I.B. and S.E.I.L.; Resources, M.E.M.H., S.E.I.L., M.K., N.D. and B.G.; Writing—original draft, K.I.B.; Visualization, K.I.B.; Project administration, S.E.I.L. All authors have read and agreed to the published version of the manuscript.

Funding

This research received no external funding.

Data Availability Statement

The original contributions presented in this study are included in the article. Further inquiries can be directed to the corresponding author.

Conflicts of Interest

Author Mohamed Khodja is employed by the company SONATRACH. The remaining authors declare that the research was conducted in the absence of any commercial or financial relationships that could be construed as a potential conflict of interest.

References

  1. Bauer, N.; Calvin, K.; Emmerling, J.; Fricko, O.; Fujimori, S.; Hilaire, J.; Eom, J.; Krey, V.; Kriegler, E.; Mouratiadou, I.; et al. Shared Socio-Economic Pathways of the Energy Sector–Quantifying the Narratives. Glob. Environ. Chang. 2017, 42, 316–330. [Google Scholar] [CrossRef]
  2. Bridge, G.; Özkaynak, B.; Turhan, E. Energy Infrastructure and the Fate of the Nation: Introduction to Special Issue. Energy Res. Soc. Sci. 2018, 41, 1–11. [Google Scholar] [CrossRef]
  3. Muggeridge, A.; Cockin, A.; Webb, K.; Frampton, H.; Collins, I.; Moulds, T.; Salino, P. Recovery Rates, Enhanced Oil Recovery and Technological Limits. Phil. Trans. R. Soc. A 2014, 372, 20120320. [Google Scholar] [CrossRef] [PubMed]
  4. Leach, A.; Mason, C.F.; van‘t Veld, K. Co-Optimization of Enhanced Oil Recovery and Carbon Sequestration. Resour. Energy Econ. 2011, 33, 893–912. [Google Scholar] [CrossRef]
  5. Tiong, A.C.Y.; Tan, I.S.; Foo, H.C.Y.; Lam, M.K.; Ben Mahmud, H.; Lee, K.T. A Mini-Investigation on Enhanced Oil Recovery Evolution (2007–2020). MATEC Web Conf. 2023, 377, 01015. [Google Scholar] [CrossRef]
  6. Vasilenko, V.A.; Vasilenko, V.A.; Skichko, E.A.; Sakharov, D.A.; Safarov, R.R.; Gordienko, M.G.; Oleinik, A.V. An Analysis of the Intellectual Property Market in the Field of Enhanced Oil Recovery Methods. Designs 2021, 5, 1. [Google Scholar] [CrossRef]
  7. Nikolova, C.; Gutierrez, T. Use of Microorganisms in the Recovery of Oil from Recalcitrant Oil Reservoirs: Current State of Knowledge, Technological Advances and Future Perspectives. Front. Microbiol. 2020, 10, 2996. [Google Scholar] [CrossRef]
  8. Lebouachera, S.E.I.; Balamane-Zizi, O.; Boublia, A.; Ghriga, M.A.; Hasanzadeh, M.; Hadri, H.E.; Tassalit, D.; Khodja, M.; Grassl, B.; Drouiche, N. Understanding the Factors Affecting the Adsorption of Surface-Active Agents onto Reservoir Rock in Chemical Enhanced Oil Recovery Applications: A Comprehensive Review. Chem. Afr. 2024, 7, 2283–2306. [Google Scholar] [CrossRef]
  9. Nazar, M.F.; Shah, S.S.; Khosa, M.A. Microemulsions in Enhanced Oil Recovery: A Review. Pet. Sci. Technol. 2011, 29, 1353–1365. [Google Scholar] [CrossRef]
  10. Negin, C.; Ali, S.; Xie, Q. Most Common Surfactants Employed in Chemical Enhanced Oil Recovery. Petroleum 2017, 3, 197–211. [Google Scholar] [CrossRef]
  11. Hosseini-Nasab, S.M.; Zitha, P.L.J.; Mirhaj, S.A.; Simjoo, M. A New Chemical-Enhanced Oil Recovery Method? Colloids Surf. A Physicochem. Eng. Asp. 2016, 507, 89–95. [Google Scholar] [CrossRef]
  12. Ar-Raihan, M.H.; Salsabila, R.; Adharis, A.; Ratri, P.J.; Mayangsari, T.R. Analysis of Surfactant and Polymer Behavior on Water/Oil Systems as Additives in Enhanced Oil Recovery (EOR) Technology through Molecular Dynamics Simulation: A Preliminary Study. J. Earth Energy Eng. 2023, 12, 27–39. [Google Scholar] [CrossRef]
  13. Sampora, Y.; Juwono, A.L.; Haryono, A.; Irawan, Y. Study of Synthesis Polyethylene Glycol Oleate Sulfonated as an Anionic Surfactant for Enhanced Oil Recovery (EOR). J. Phys. Conf. Ser. 2017, 909, 012078. [Google Scholar] [CrossRef]
  14. Koreh, P.; Lashkarbolooki, M.; Peyravi, M.; Al-Saedi, H. Applying membrane technology for preparing low salinity for hybrid nanofluid, surfactant, and alkaline enhanced oil recovery process. J. Fuel 2025, 390, 134713. [Google Scholar] [CrossRef]
  15. Maia, K.C.B.; Densy dos Santos Francisco, A.; Moreira, M.P.; Nascimento, R.S.V.; Grasseschi, D. Advancements in Surfactant Carriers for Enhanced Oil Recovery: Mechanisms, Challenges, and Opportunities. ACS Omega 2024, 9, 36874–36903. [Google Scholar] [CrossRef]
  16. Gbadamosi, A.; Patil, S.; Al Shehri, D.; Kamal, M.S.; Hussain, S.M.S.; Al-Shalabi, E.W.; Hassan, A.M. Recent Advances on the Application of Low Salinity Water flooding and Chemical Enhanced Oil Recovery. Energy Rep. 2022, 8, 9969–9996. [Google Scholar] [CrossRef]
  17. Thakur, G. Enhanced Recovery Technologies for Unconventional Oil Reservoirs. J. Pet. Technol. 2019, 71, 66–69. [Google Scholar] [CrossRef]
  18. Massarweh, O.; Abushaikha, A.S. A Review of Recent Developments in CO2 Mobility Control in Enhanced Oil Recovery. Petroleum 2022, 8, 291–317. [Google Scholar] [CrossRef]
  19. Lebouachera, S.E.I.; Chemini, R.; Khodja, M.; Grassl, B.; Tassalit, D.; Drouiche, N. Experimental Investigations of SDS Adsorption on the Algerian Rock Reservoir: Chemical Enhanced Oil Recovery Case. Res. Chem. Intermed. 2018, 44, 7665–7690. [Google Scholar] [CrossRef]
  20. Alhassawi, H.; Romero-Zerón, L. Novel Surfactant Delivery System for Controlling Surfactant Adsorption onto Solid Surfaces. Part II: Dynamic adsorption tests. Can. J. Chem. Eng. 2015, 93, 1371–1379. [Google Scholar] [CrossRef]
  21. Lebouachera, S.; Boublia, A.; Hadji, M.; Ghriga, M.A.; Tassalit, D.; Khodja, M.; Grassi, B.; Drouiche, N. Mini-review on the evaluation of thermodynamic parameters for surfactants adsorption onto rock reservoirs: cEOR applications. J. Chem. Pap. 2025, 79, 655–666. [Google Scholar] [CrossRef]
  22. Al-Azani, K.; Abu-Khamsin, S.; Kamal, M.S.; Shirish, P.; Shakil Hussain, S.M.; Norrman, K. Enhanced Oil Recovery in Heterogeneous Carbonate Rocks Using a Gemini Surfactant under Harsh Conditions. J. Energy Fuels 2025, 39, 3433–3445. [Google Scholar] [CrossRef]
  23. Belhaj, A.F.; Elraies, K.A.; Mahmood, S.M.; Zulkifli, N.N.; Akbari, S.; Hussien, O.S. The effect of surfactant concentration, salinity, temperature, and pH on surfactant adsorption for chemical enhanced oil recovery: A review. J. Petrol. Explor. Prod. Technol. 2020, 10, 125–137. [Google Scholar] [CrossRef]
  24. Bhui, U.K.; Sanyal, S.; Saha, R.; Rakshit, S.; Pal, S.K. Steady-State and Time-Resolved Fluorescence Spectroscopic Study of Petroleum Crudes in Aqueous-Surfactant Solutions: Its Implications for Enhanced Oil Recovery (EOR) during Surfactant Flooding. Fuel 2018, 234, 1081–1088. [Google Scholar] [CrossRef]
  25. Ma, L.; Xu, P.; Wang, L.; Xia, K.; Du, H.; Gao, R.; Chen, Z. Study on Anionic–Nonionic Mixed Surfactant for Enhanced Oil Recovery in a Hypersaline Reservoir. RSC Adv. 2024, 14, 552–559. [Google Scholar] [CrossRef]
  26. Prasad, T.; Raj, S.; Kundu, D. Artificial Neural Network Framework for the Selection of Deep Eutectic Solvents Promoted Enhanced Oil Recovery by Interfacial Tension Reduction Mechanism. Energy 2024, 307, 132602. [Google Scholar] [CrossRef]
  27. Javadi, A.; Moslemizadeh, A.; SheikholMoluki, V.; Fathianpour, N.; Mohammadzadeh, O.; Zendehboudi, S. A Combination of Artificial Neural Network and Genetic Algorithm to Optimize Gas Injection: A Case Study for EOR Applications. J. Mol. Liq. 2021, 339, 116654. [Google Scholar] [CrossRef]
  28. Chen, G.; Fu, K.; Liang, Z.; Sema, T.; Li, C.; Tontiwachwuthikul, P.; Idem, R. The Genetic Algorithm Based Back Propagation Neural Network for MMP Prediction in CO2-EOR Process. Fuel 2014, 126, 202–212. [Google Scholar] [CrossRef]
  29. Weile, D.S.; Michielssen, E. Genetic Algorithm Optimization Applied to Electromagnetics: A Review. IEEE Trans. Antennas Propagat. 1997, 45, 343–353. [Google Scholar] [CrossRef]
  30. Sangwan, K.S.; Saxena, S.; Kant, G. Optimization of Machining Parameters to Minimize Surface Roughness Using Integrated ANN-GA Approach. Procedia CIRP 2015, 29, 305–310. [Google Scholar] [CrossRef]
  31. Belhaj, A.F.; Elraies, K.A.; Alnarabiji, M.S.; Abdul Kareem, F.A.; Shuhli, J.A.; Mahmood, S.M.; Belhaj, H. Experimental Investigation, Binary Modelling and Artificial Neural Network Prediction of Surfactant Adsorption for Enhanced Oil Recovery Application. Chem. Eng. J. 2021, 406, 127081. [Google Scholar] [CrossRef] [PubMed]
  32. Moosavi, S.R.; Wood, D.A.; Ahmadi, M.A.; Choubineh, A. ANN-Based Prediction of Laboratory-Scale Performance of CO2-Foam Flooding for Improving Oil Recovery. Nat. Resour. Res. 2019, 28, 1619–1637. [Google Scholar] [CrossRef]
  33. Sun, Q.; Ertekin, T. Screening and Optimization of Polymer Flooding Projects Using Artificial-Neural-Network (ANN) Based Proxies. J. Pet. Sci. Eng. 2020, 185, 106617. [Google Scholar] [CrossRef]
  34. Le Van, S.; Chon, B. Artificial Neural Network Model for Alkali-Surfactant-Polymer Flooding in Viscous Oil Reservoirs: Generation and Application. Energies 2016, 9, 1081. [Google Scholar] [CrossRef]
  35. Lebouachera, S.E.I.; Chemini, R.; Khodja, M.; Grassl, B.; AbdelfetahGhriga, M.; Tassalit, D.; Drouiche, N. Experimental Design Methodology as a Tool to Optimize the Adsorption of New Surfactant on the Algerian Rock Reservoir: cEOR Applications. Eur. Phys. J. Plus 2019, 134, 436. [Google Scholar] [CrossRef]
  36. Barati, A.; Najafi, A.; Daryasafar, A.; Nadali, P.; Moslehi, H. Adsorption of a New Nonionic Surfactant on Carbonate Minerals in Enhanced Oil Recovery: Experimental and Modeling Study. Chem. Eng. Res. Des. 2016, 105, 55–63. [Google Scholar] [CrossRef]
  37. Yuan, N.; Wang, S.; Yu, Y.; Chen, C.; Shiau, B.-J.; Harwell, J.H. Expanded Salinity Window of Middle-Phase Microemulsions and Reduced Surfactant Adsorption by Hydrotrope. Langmuir 2023, 39, 17175–17189. [Google Scholar] [CrossRef]
  38. Mohd Musa, M.S.; Gopalan, P.Y.; Yekeen, N.; Al-Yaseri, A. Influence of Henna Extracts on Static and Dynamic Adsorption of Sodium Dodecyl Sulfate and Residual Oil Recovery from Quartz Sand. ACS Omega 2023, 8, 13118–13130. [Google Scholar] [CrossRef]
  39. Goupy, J.; Creighton, L. Introduction to Design of Experiments with JMP Examples, 3rd ed.; SAS Institute: Cary, NC, USA, 2007. [Google Scholar]
  40. Jha, A.K.; Sit, N. Comparison of Response Surface Methodology (RSM) and Artificial Neural Network (ANN) Modelling for Supercritical Fluid Extraction of Phytochemicals from Terminalia Chebula Pulp and Optimization Using RSM Coupled with Desirability Function (DF) and Genetic Algorithm (GA) and ANN with GA. Ind. Crops Prod. 2021, 170, 113769. [Google Scholar] [CrossRef]
  41. Kumar, S.S.; Prasad, C.D.; Hanumanthappa, H.; Choudhary, R.K.; Sollapur, S.B. Numerical analysis of thermal spray coatings using artificial neural networks (ANN) overview. Int. J. Interact. Des. Manuf. 2025, 19, 1533–1548. [Google Scholar] [CrossRef]
  42. Tabatabaei, S.M.; Attari, N.; Panahi, S.A.; Asadian-Pakfar, M.; Sedaee, B. EOR Screening Using Optimized Artificial Neural Network by Sparrow Search Algorithm. Geoenergy Sci. Eng. 2023, 229, 212023. [Google Scholar] [CrossRef]
  43. Jani, D.B.; Mishra, M.; Sahoo, P.K. Application of Artificial Neural Network for Predicting Performance of Solid Desiccant Cooling Systems–A Review. Renew. Sustain. Energy Rev. 2017, 80, 352–366. [Google Scholar] [CrossRef]
  44. Kalam, S.; Yousuf, U.; Abu-Khamsin, S.A.; Waheed, U.B.; Khan, R.A. An ANN Model to Predict Oil Recovery from a 5-Spot Waterflood of a Heterogeneous Reservoir. J. Pet. Sci. Eng. 2022, 210, 110012. [Google Scholar] [CrossRef]
  45. Ahmadi, M.A. Developing a Robust Surrogate Model of Chemical Flooding Based on the Artificial Neural Network for Enhanced Oil Recovery Implications. Math. Probl. Eng. 2015, 2015, 706897. [Google Scholar] [CrossRef]
  46. Benramdane, I.K.; Nasrallah, N.; Amrane, A.; Kebir, M.; Trari, M.; Fourcade, F.; Assadi, A.A.; Maachi, R. Optimization of the Artificial Neuronal Network for the Degradation and Mineralization of Amoxicillin Photoinduced by the Complex Ferrioxalate with a Gradual and Progressive Approach of the Ligand. J. Photochem. Photobiol. A Chem. 2021, 406, 112982. [Google Scholar] [CrossRef]
  47. Moradi, M.J.; Khaleghi, M.; Salimi, J.; Farhangi, V.; Ramezanianpour, A.M. Predicting the Compressive Strength of Concrete Containing Metakaolin with Different Properties Using ANN. Measurement 2021, 183, 109790. [Google Scholar] [CrossRef]
  48. Abbasi, M.; Soleymani, A.R.; Parsa, J.B. Degradation of Rhodamine B by an Electrochemical Ozone Generating System Consist of a Ti Anode Coated with Nanocomposite of Sn–Sb–Ni Oxide. Process Saf. Environ. Prot. 2015, 94, 140–148. [Google Scholar] [CrossRef]
  49. Ahmed, H.U.; Abdalla, A.A.; Mohammed, A.S.; Mohammed, A.A. Mathematical Modeling Techniques to Predict the Compressive Strength of High-Strength Concrete Incorporated Metakaolin with Multiple Mix Proportions. Clean. Mater. 2022, 5, 100132. [Google Scholar] [CrossRef]
  50. Khataee, A.R.; Kasiri, M.B. Artificial Neural Networks Modeling of Contaminated Water Treatment Processes by Homogeneous and Heterogeneous Nanocatalysis. J. Mol. Catal. A Chem. 2010, 331, 86–100. [Google Scholar] [CrossRef]
  51. Asteris, P.G.; Lemonis, M.E.; Le, T.-T.; Tsavdaridis, K.D. Evaluation of the Ultimate Eccentric Load of Rectangular CFSTs Using Advanced Neural Network Modeling. Eng. Struct. 2021, 248, 113297. [Google Scholar] [CrossRef]
  52. Amar, M.N.; Zeraibi, N.; Ghahfarokhi, A.J. Applying Hybrid Support Vector Regression and Genetic Algorithm to Water Alternating CO2 Gas EOR. Greenh. Gases Sci. Technol. 2020, 10, 613–630. [Google Scholar] [CrossRef]
  53. Emera, M.K.; Sarma, H.K. Use of Genetic Algorithm to Estimate CO2–Oil Minimum Miscibility Pressure—A Key Parameter in Design of CO2 Miscible Flood. J. Pet. Sci. Eng. 2005, 46, 37–52. [Google Scholar] [CrossRef]
  54. Liu, D.; Agarwal, R.; Li, Y. Numerical Simulation and Optimization of CO2 Enhanced Shale Gas Recovery Using a Genetic Algorithm. J. Clean. Prod. 2017, 164, 1093–1104. [Google Scholar] [CrossRef]
  55. Shende, A.S.; Joshi, T.J.; Rao, P.S. Process Optimization of Microwave-Assisted Aqueous Extraction of Tannins and Saponins from Malabar Spinach (Basella alba) Leaves Using ANN-GA and RSM Methodology. Meas. Food 2024, 13, 100117. [Google Scholar] [CrossRef]
  56. HemmatEsfe, M.; Alidoust, S. Modeling and Precise Prediction of Thermophysical Attributes of Water/EG Blend-Based CNT Nanofluids by NSGA-II Using ANN and RSM. Arab. J. Sci. Eng. 2021, 46, 6423–6437. [Google Scholar] [CrossRef]
  57. HemmatEsfe, M.; Saedodin, S.; Bahiraei, M.; Esfandeh, S. Preliminary Feasibility Study on Using a Nano-Composition in Enhanced Oil Recovery Process: Neural Network Modeling. Neural Comput. Appl. 2021, 33, 10111–10127. [Google Scholar] [CrossRef]
  58. Halima, D.; Djelloul, B.; Mehdi, G.; Camel, T.; Ali, B.; Bouchra, B. Solar Radiation Estimation Based on a New Combined Approach of Artificial Neural Networks (ANN) and Genetic Algorithms (GA) in South Algeria. CMC 2024, 79, 4725–4740. [Google Scholar] [CrossRef]
  59. NabizadehChianeh, F.; Basiri Parsa, J.; RezaeiVahidian, H. Artificial Neural Network Modeling for Removal of Azo Dye from Aqueous Solutions by Ti Anode Coated with Multiwall Carbon Nanotubes. Environ. Prog. Sustain. Energy 2017, 36, 1778–1784. [Google Scholar] [CrossRef]
  60. KiannejadAmiri, M.; GhorbanzadeZaferani, S.P.; SarmastiEmami, M.R.; Zahmatkesh, S.; Pourhanasa, R.; SadeghiNamaghi, S.; Klemeš, J.J.; Bokhari, A.; Hajiaghaei-Keshteli, M. Multi-Objective Optimization of Thermophysical Properties GO Powders-DW/EG Nf by RSM, NSGA-II, ANN, MLP and ML. Energy 2023, 280, 128176. [Google Scholar] [CrossRef]
  61. Onu, C.E.; Nwabanne, J.T.; Ohale, P.E.; Asadu, C.O. Comparative Analysis of RSM, ANN and ANFIS and the Mechanistic Modeling in Eriochrome Black-T Dye Adsorption Using Modified Clay. S. Afr. J. Chem. Eng. 2021, 36, 24–42. [Google Scholar] [CrossRef]
  62. Igwegbe, C.A.; Mohmmadi, L.; Ahmadi, S.; Rahdar, A.; Khadkhodaiy, D.; Dehghani, R.; Rahdar, S. Modeling of Adsorption of Methylene Blue Dye on Ho-CaWO4 Nanoparticles Using Response Surface Methodology (RSM) and Artificial Neural Network (ANN) Techniques. MethodsX 2019, 6, 1779–1797. [Google Scholar] [CrossRef] [PubMed]
  63. Gomez, C.; Ruiz, D.; Cely, M. Specialist System in Flow Pattern Identification Using Artificial Neural Networks. J. Appl. Eng. Sci. 2023, 21, 285–299. [Google Scholar] [CrossRef]
  64. Hasanzadeh, M.; Farahani, M.D.; Far, H.S.; Lebouachera, S.E.I. Modeling of Textile Dye Removal from Aqueous Solution with a Zr-MOF Framework: Design of Experiments and Artificial Neural Network Approaches. Emergent Mater. 2024, 7, 2583–2593. [Google Scholar] [CrossRef]
  65. Derringer, G.; Suich, R. Simultaneous Optimization of Several Response Variables. J. Qual. Technol. 1980, 12, 214–219. [Google Scholar] [CrossRef]
Figure 1. Workflow for developing and optimizing artificial neural networks.
Colloids 09 00019 g001
Figure 2. Neural network structure.
Colloids 09 00019 g002
Figure 3. Steps for planning and data generation for ANN modeling combined with DOE.
Colloids 09 00019 g003
Figure 4. Hybrid optimization framework combining design of experiments (DOE) and artificial neural networks (ANNs) with genetic algorithms.
Colloids 09 00019 g004
Figure 5. XRD model of the Hassi Messaoud rock [35].
Colloids 09 00019 g005
Figure 6. ANN optimized structure.
Colloids 09 00019 g006
Figure 7. Correlations between predicted outputs and target values across training, validation, and test phases.
Colloids 09 00019 g007
Figure 8. Epoch-wise mean squared error (MSE) for training, validation, and test sets, with best validation performance highlighted.
Colloids 09 00019 g008
Figure 9. Error histograms for an artificial neural network (ANN) using training, validation, and test datasets.
Colloids 09 00019 g009
Figure 10. Comparisons of experimental and predicted values by ANN and RSM models for equilibrium adsorption (Qe).
Colloids 09 00019 g010
Figure 11. Variations in fitness value between generations during ANN-GA optimization.
Colloids 09 00019 g011
Figure 12. Variations in fitness value between generations during DOE-GA optimization.
Colloids 09 00019 g012
Table 1. Factors and levels used in the factorial design 23 [35].
FactorsLow level (−1)Highlevel (+1)
X1 (Surfactant choice)SDSEOR ASP 5100
X2 (Concentration of surfactant)200800
X3 (Temperature in °C)2580
Table 2. Neural network types, algorithms, and functions for modeling and optimization.
Network TypesFeed Forward Backpropagation
Cascade Forward Backpropagation
Training functionTrainscg
TrainLM
Adaptation learning functionlearngd
learngdm
Transfer function for Hidentansig
logsig
Transfer function for output layertansig
purelin
Number of neurons in the hidden layer12
Table 3. Parameter settings for ANN-GA and DOE-GA.
Population size50
Number of generation200
Crossover fraction0.8
Mutation rate0.01
Table 4. Data collection: generated input variables and polynomial-predicted responses.
NInputOutput
1SurfactantConcentration of surfactantTemperatureQe
2uncoded valuecoded valueuncoded valuecoded valueuncoded valuecoded value
3SDS−1200−125−12.3288125
4EOR ASP 51001200−125−12.7228875
5SDS−1800125−14.1765875
6EOR ASP 51001800125−17.0920125
7SDS−1200−18013.4739875
8EOR ASP 51001200−18013.8946125
9SDS−180018016.1436125
10EOR ASP 5100180018019.0855875
11SDS−1220−0.9333333326−0.963636362.41172445
12EOR ASP 51001220−0.9333333326−0.963636362.89032718
13SDS−1240−0.8666666728−0.890909092.51745014
14EOR ASP 51001240−0.8666666728−0.890909093.08106332
15SDS−1260−0.830−0.818181822.62516818
16EOR ASP 51001260−0.830−0.818181823.27379182
17SDS−1280−0.7333333332−0.745454552.73487859
18EOR ASP 51001280−0.7333333332−0.745454553.46851268
19SDS−1300−0.6666666734−0.672727272.84658136
20EOR ASP 51001300−0.6666666734−0.672727273.66522591
21SDS−1320−0.636−0.62.9602765
22EOR ASP 51001320−0.636−0.63.8639315
23SDS−1340−0.5333333338−0.527272733.075964
24EOR ASP 51001340−0.5333333338−0.527272734.06462945
25SDS−1360−0.4666666740−0.454545463.19364386
26EOR ASP 51001400−0.3333333344−0.309090914.6786775
27SDS−1420−0.2666666746−0.236363643.55863764
38EOR ASP 51001420−0.2666666746−0.236363644.88734491
Colloids 09 00019 i001Colloids 09 00019 i001Colloids 09 00019 i001Colloids 09 00019 i001Colloids 09 00019 i001Colloids 09 00019 i001Colloids 09 00019 i001Colloids 09 00019 i001
69EOR ASP 510017600.86666667670.527272738.28126423
70SDS−17700.9690.65.62494475
71EOR ASP 510017700.9690.68.43554225
72SDS−17800.93333333710.672727275.737231
73EOR ASP 510017800.93333333710.672727278.59081645
74SDS−17850.95730.745454555.82913822
75EOR ASP 510017850.95730.745454558.70470038
76SDS−17900.96666667750.818181825.92154352
Table 5. ANN algorithm results.
Network
No.
Network
Type
Training
Function
Adaptation
Learning
Function
Transfer FunctionOutput (Qe)
Hidden
Layer
Output
Layer
MSER2
1Feed Forward Backpropagationtrainlmlearngdtansigpurelin0.001922560.999718645
2tansig0.0497686990.992988724
3logsigpurelin0.0006548510.996762602
4tansig0.0001043530.999984644
5learngdmtansigpurelin0.0133020130.998028686
6tansig0.0010473640.999845396
7logsigpurelin0.0206780070.997024576
8tansig0.011793530.998244096
9trainscglearngdtansigpurelin0.0109653780.998402231
10tansig0.027878140.995591963
11logsigpurelin0.0596029250.991226048
12tansig0.0311013680.995437096
13learngdmtansigpurelin0.0012707030.999812559
14tansig0.0143806390.997867883
15logsigpurelin0.0143686150.997889598
16tansig0.0830675050.987482642
17Cascade Forward Back propagationtrainlmlearngdtansigpurelin0.0003097740.999954487
18tansig0.0322587790.995362984
19logsigpurelin0.0048877210.99927919
20tansig9.10106 × 10−60.999998662
21learngdmtansigpurelin8.90312×10−70.999999869
22tansig0.0002541150.9999626
23logsigpurelin0.0013042550.999809106
24tansig0.0006344890.99990587
25trainscglearngdtansigpurelin0.0046478790.999318984
26tansig0.0250802240.996315409
27logsigpurelin0.0044594360.99934599
28tansig0.0155442250.997674503
29learngdmtansigpurelin0.1911942340.970380954
30tansig0.004949060.999252877
31logsigpurelin0.0420683850.993766037
32tansig0.0091954510.998631633
Table 6. Effect of the number of hidden neurons on the ANN model performance.
Number of NeuronsMSER2
10.0098539749560.998539413722
20.0051771827350.999239763890
30.0000369984290.999994569068
40.0000000068400.999999998995
50.0000000084520.999999999611
60.0000000879570.999999987078
70.0000037392250.999999450701
80.0000006684540.999999901797
90.0000001711510.999999974857
100.0000008903120.999999869212
110.2831428383890.958860619811
120.0619869214140.990618200261
Table 7. Comparison of the statistical indicators for DOE and ANN.
DOEANN
γ 1.000141.000016
CV0.0100220.00165
VAB0.0001320.000015
PF/30.012120.00157
Coefficient of determination (R2)0.990.99
Relative error (%)9.10927 × 10−51.87966 × 10−4
MSE2.37656 × 10−76.84028 × 10⁻⁹
Table 8. Comparison of optimization methods for surfactant adsorption in EOR.
Optimization MethodsDOE-GAANN-GADOE-DF
Optimum conditionsSDS, 200 ppm, and 25 °C
Predicted response2.328892.32472.3289
Disclaimer/Publisher’s Note: The statements, opinions and data contained in all publications are solely those of the individual author(s) and contributor(s) and not of MDPI and/or the editor(s). MDPI and/or the editor(s) disclaim responsibility for any injury to people or property resulting from any ideas, methods, instructions or products referred to in the content.

