Systematic Review

Cognitive Neuroimaging Studies on Poverty and Socioeconomic Status Differences in Children and Families across the World: Translational Insights for Next Decade’s Policy, Health, and Education

by
Shanine Kamgang
1,2,†,
Meghan Lord
1,2,
Aanchal Mishra
1,2 and
Amedeo D’Angiulli
1,2,*,†
1
Department of Neuroscience, Carleton University, Ottawa, ON K1S 5B6, Canada
2
Neuroscience, Imagination, Cognition and Emotion, Research (NICER) Lab, Carleton University, Ottawa, ON K1S 5B6, Canada
*
Author to whom correspondence should be addressed.
These authors contributed equally to this work.
Clin. Transl. Neurosci. 2023, 7(3), 24; https://doi.org/10.3390/ctn7030024
Submission received: 31 May 2023 / Revised: 9 August 2023 / Accepted: 16 August 2023 / Published: 25 August 2023
(This article belongs to the Section Neuroimaging)

Abstract

:
This systematic review and meta-analysis of global peer-reviewed neuroimaging findings preliminarily assessed the magnitude of effect sizes (ES) of the influences of family poverty/low socioeconomic status (SES) on children’s neurocognition and whether these were consistently detrimental. The literature search (Web of Science; PUBMED; MEDLINE: PSYCNET; GOOGLE SCHOLAR; SCIENCEDIRECT) included 66 studies from 1988 to 2022; 85% of the studies included were conducted in Western, high-income nations. Bayesian models, corrected by study sizes and variances, revealed ESs were heterogeneous across countries and measurements. Bayesian and standard hypothesis testing indicated high and low SES groups showed similar behavioral performances in neuroimaging-concurrent tasks. Except for Magnetic Resonance Imaging studies, ESs were small-to-intermediate with modest reliability. The strongest ESs were found for attention, mathematical performance, language, and cortical volume, followed by intermediate ESs for reading and socioemotional processes. Differentials in resting activity and connectivity, working memory, and executive functions yielded small effects. A bibliometric analysis showed a significant proportion of the literature attributed neurocognitive deficits to low SES, despite overlooking the under-representativity of non-Western and low-income countries, potential influences of racial/ethnic differences, and measurement sensitivity/specificity discrepancies. To reach United Nations Sustainable Development Goals, policies and interventions should consider regional, structural, or environmental ecologies beyond the individual, critically probing implicit deficit attributions.

1. Introduction

UNICEF (2022) estimates that there are currently one billion children living in multidimensional poverty, lacking access to food, shelter, education, and healthcare [1]. Up until 2019, the declining trend of extreme poverty, defined by the World Bank Group as the number of people living on less than USD 2.15 per day, was interrupted by the global COVID-19 pandemic [2]. As a result, the global rate of extreme poverty increased by 0.9% since 2019 [2]. Poverty is a major determinant of health [3], impacting children’s health in many areas, including that of brain development [4]. Numerous publications have reported links between socioeconomic status and poverty and various neurodevelopmental outcomes relating to brain activity [5,6,7], brain structure [8,9,10], and cognition [9,11,12] using a variety of neuroimaging methods, including structural magnetic resonance imaging (sMRI), functional magnetic resonance imaging (fMRI), near-infrared spectroscopy (NIRS), electroencephalography (EEG), and event-related potentials (ERP).
Studies employing MRI methods of data collection often investigate brain structural and functional outcomes such as cortical thickness, cortical surface area, and cortical gray and white matter volumes (CV) in specific regions [13]. Reported findings have provided evidence for SES-related differences in regional gray matter [14,15], including in the hippocampus, the orbitofrontal cortex, and the anterior cingulate cortex [16].
Functional MRI is often utilized to assess changes in cerebral venous oxygen levels (also known as the BOLD signal) of subjects in resting states or undergoing various cognitive tasks, and fMRI data are indicative of functional neural activity and functional connectivity associated with a particular task [13]. Some fMRI and EEG studies have detected SES-related differences in functional connectivity in infants [17], toddlers [18], and individuals in late childhood and adolescence [19].
NIRS methods utilize the different light absorption and scattering properties of deoxygenated and oxygenated hemoglobin as an indirect measure of task-related regional brain activity [13]. NIRS studies have found SES-related differences in prefrontal activity during joint attention tasks in preschool children [20], in prefrontal activity during executive function tasks [21], and in frontal functional connectivity during working memory tasks in children aged four to seven years old [22].
The activity measured via the EEG is a summation of the excitatory and inhibitory postsynaptic potentials of large groups of neurons firing synchronously and is classified into five main frequency bands: alpha, beta, theta, delta, and gamma [23]. Functional and resting brain activity are inferred from changes in cerebral electrical activity [13]. A 2019 EEG study found SES-related differences in resting-state alpha and theta power in late childhood and adolescence [24], whereas another 2016 study failed to find significant associations between resting-state frontal EEG power and SES at birth [25], suggesting that SES-related differences arise later in childhood.
An ERP is a very small voltage spike derived from a continuous EEG signal that can be elicited by a wide variety of sensory, cognitive, or motor events or stimuli [26] and is used to make inferences about information processing [13]. ERP studies have found SES-related differences in ERP differentiation in adolescents [27] and in P3b amplitudes during a go/no go task in 4–5-year-old children [28].
Thus, in developmental neuroimaging research, the methods outlined above are used to examine the regional anatomical and functional properties of the brain and to assess neural correlates of various developmental cognitive outcomes, including language, reading, math, socio-emotional states, executive function, attention, and working memory. Behavioral assessments of cognitive outcomes are conducted with various methods, including but not limited to the widely used comprehensive cognitive assessment batteries such as the Wechsler Intelligence Scale for Children (WISC) [29,30,31], the Developmental Neuropsychological Assessment (NESPY) [32,33,34], the Child Behavior Checklist (CBCL) [35,36,37], and the Kaufman Assessment Battery for Children (KABC) [38,39].
Creating policies and programs aimed at mitigating the harmful impacts of poverty should be a priority. Such intervention strategies should be well-informed with scientifically sound and valid empirical data. Recently, the domain of developmental neuroscience and poverty has emerged for this purpose [4], and researchers have generated key empirical findings using a variety of techniques, including neuroimaging [4]. However, a large portion of neuroimaging findings in our domain of interest are generated in affluent Western regions. There is a lack of relevant child neuroimaging data originating from low-income countries for a number of reasons, including that international efforts for brain research are restricted to high-income countries since they benefit most from improving already existing technologies, and researchers in low- and middle-income countries have significantly reduced access to suitable research tools [40], like the latest state-of-the-art expensive neuroimaging equipment for example. Therein lies the following major question in brain development and poverty research: is it appropriate to use findings and interpretations generated in affluent Western regions to understand the effects of SES and poverty worldwide? Moreover, it is also important to consider the so-called implicit deficit attribution, a type of individualistic interpretation connected with Western-centric worldviews [41] further described in the next section. Since the data are mostly from high-income Western countries, it would be important to determine whether findings and interventions in the present field reflect a mainstream consensus that individual trait deficits are the key mediators of poverty and low SES on neurocognitive development.

Deficit Thinking and the Turn to Implicit Deficit Attribution

Implicit deficit stems from deficit thinking. At its core, deficit thinking is characterized by the attribution of a person’s failures to supposed internal deficits without considering systemic determinants [42]. The deficit thinking model posits that such deficits arise from genetics, culture and class, and family and community dysfunction [42,43]. Essentially, it is an approach that “blames the victim” by removing accountability from historically oppressive structures and practices [42]. According to Richard Valencia, deficit thinking theories are rooted in racism and classism. Indeed, one of the first, quite extreme instances of genetic deficit thinking took root during the 1600s, when the notion that sub-Saharan Africans were biologically inferior to Caucasians was used to justify the enslavement of the former group [44]. Since then, other forms of deficit thinking have arisen, such as class deficit thinking and cultural deficit thinking. Among the most pervasive examples of class deficit thinking is the belief that long-term poverty breeds cognitive deprivation, motivational deficits, and ignorance [43]. Likewise, cultural deficit thinking is marked by terms such as “culturally deprived” and “culturally disadvantaged” [42,43,45] and even the more current (supposedly neutral) terms “at risk” [42,43]. Deficit thinking models uphold the notion that economically disadvantaged people, or those from racial minority groups are intellectually inept, and such notions impact them in many areas of their lives, including that of healthcare and education, and overall create major obstacles in the road to dismantle long-standing inequalities [46]. As a matter of fact, deficit thinking has been shown to thrive in past and current educational systems [47] by informing curricula and shaping educational interventions that historically promoted school segregation by race/ethnicity [44] and socioeconomic status [42]. For instance, a 2017 report authored by York University Professor Dr. Carl James in the Canadian province of Ontario found that Black students, along with low-income students, were disproportionally streamed into “applied” paths as opposed to “academic” paths, greatly hindering their chances of graduation and post-secondary educational attainment [48]. It was only in 2021 that the Ontario government made the decision to end the practice of academic streaming.
Although deficit thinking has been denounced by scholars, it remains implicitly present in the scientific literature due to its protean nature [42]. Indeed, deficit thinking has taken on different forms over time, molding itself to fit whichever ideas are the most conventional in a given epoch [42]. Given the current “culture of poverty” debate, it is no surprise that the recent scientific literature on the impacts of SES and poverty have employed deficit attribution language. Indeed, SES-related brain differences are often interpreted as deficits [49], and findings are interpreted in a manner that potentially attributes implicit behavioral and cognitive deficits to individuals living in poverty and/or in low SES environments, a notion that has been examined elsewhere in the context of developmental cognitive neuroscience as implicit deficit attribution (see [50]).
In this paper, we present a multi-mixed method (qualitative and quantitative) inquiry into this undercurrent trend. Our study was designed to determine the extent to which data generated in prevalently Western high-income countries work as a guiding framework to understand the effects of poverty and low socioeconomic status across the globe by addressing the following research questions:
  • How strong are the reported effects of poverty and socioeconomic status on brain development outcomes, and are they the same in rich and less affluent countries?
  • Are the effects of family poverty or low socioeconomic status on neurocognition, as reflected by neuroimaging results, consistently found to be detrimental (i.e., adverse outcome in the direction of low-SES/poor group)?
  • Are the effects interpreted mainly in relation to an implicit-deficit attribution or in relation to a structural or environmental set of ecological factors beyond the individual children and families?
Given poverty and low socioeconomic status are considered as major determinants of poor health globally [3], our approach could offer an important first step in assessing their impacts on brain structure and functions via global neuroimaging through a valid and reliable test. Moreover, quantifying instances in which the effects of family poverty and low SES on neurocognition are not detrimental will give insight into mechanisms of resilience shown by low SES children, and will lend support to the use of strength-based approaches in this domain of research, in addition to challenging implicit deficit attribution. Lastly, advocating for an interpretation of findings that considers systemic determinants will contribute to better informing and customizing interventions for children in poor communities across the globe. Thus, our objectives are aligned with UNICEF’s sustainable development goals, specifically those relating to the quality of education and reduced inequalities.

2. Materials and Methods

This meta-analytic review was conducted in accordance with guidelines established by the PRISMA protocol for Network Meta-Analyses [51,52,53]. The protocol is schematized in Figure 1.

2.1. Eligibility Criteria

Studies included in the analysis had to fulfill all of the following inclusion criteria: 1. Articles, review articles, and meta-analyses published between 1900 and 2022; 2. Peer-reviewed literature; 3. Focus on primary indices of socioeconomic status and/or poverty; 4. Healthy and developmentally typical children (where the denomination “children” was defined by age criteria used by the authors); 5. Neuroimaging data; 6. Outcome on brain development and/or cognition. Search criteria are detailed in Table 1.

2.2. Information Sources and Search Strategy

The literature search for papers on child neuroimaging and socioeconomic status and poverty was carried out on three main databases: Web of Science, PubMed, and Scopus. Web of Science databases included Web of Science Core Collection, BIOSIS Citation Index, KCI-Korean Journal Database, MEDLINE, and SciELO Citation Index. PubMed databases included MEDLINE, PubMed Central (PMC), and Bookshelf. Final consultation of papers published between 1900 and 2022 occurred on 21 February 2022 in Web of Science and PubMed and on 27 May 2022 in Scopus. All specific search terms are reported in Table 1 below.
Table 1. Search criteria for PubMed, Web of Science, and Scopus.
KeywordsSearch Interfaces/Platforms
PubMedWeb of ScienceScopus
Socioeconomic status1 (socioeconomic status)
2 (ses)
1 Socioeconomic status
2 SES
1socioeconomic status
2 ses
Poverty3 (poverty)3 poverty 3 poverty
Children4 (child *) 4 (child *)4 (child *)
Neuroimaging5 (neuroimage *)
6 (eeg)
7 (erp)
8 (mri)
9 (fmri)
5 neuroimag*
6 EEG
7 ERP
8 MRI
9 fMRI
5 neuroimag *
6 eeg
7 erp
8 mri
9 fmri
Combination terms(5 OR 6 OR 7 8 OR 9) AND (1 OR 2 OR 3) AND 4TS = 4 AND TS = (1 OR 2 OR 3) AND TS = (5 OR 6 OR 7 OR 8 OR 9)TITLE-ABS-KEY (1 OR 2 OR 3) AND TITLE-ABS-KEY 4 AND TITLE-ABS-KEY (5 OR 6 OR 7 OR 8 OR 9)

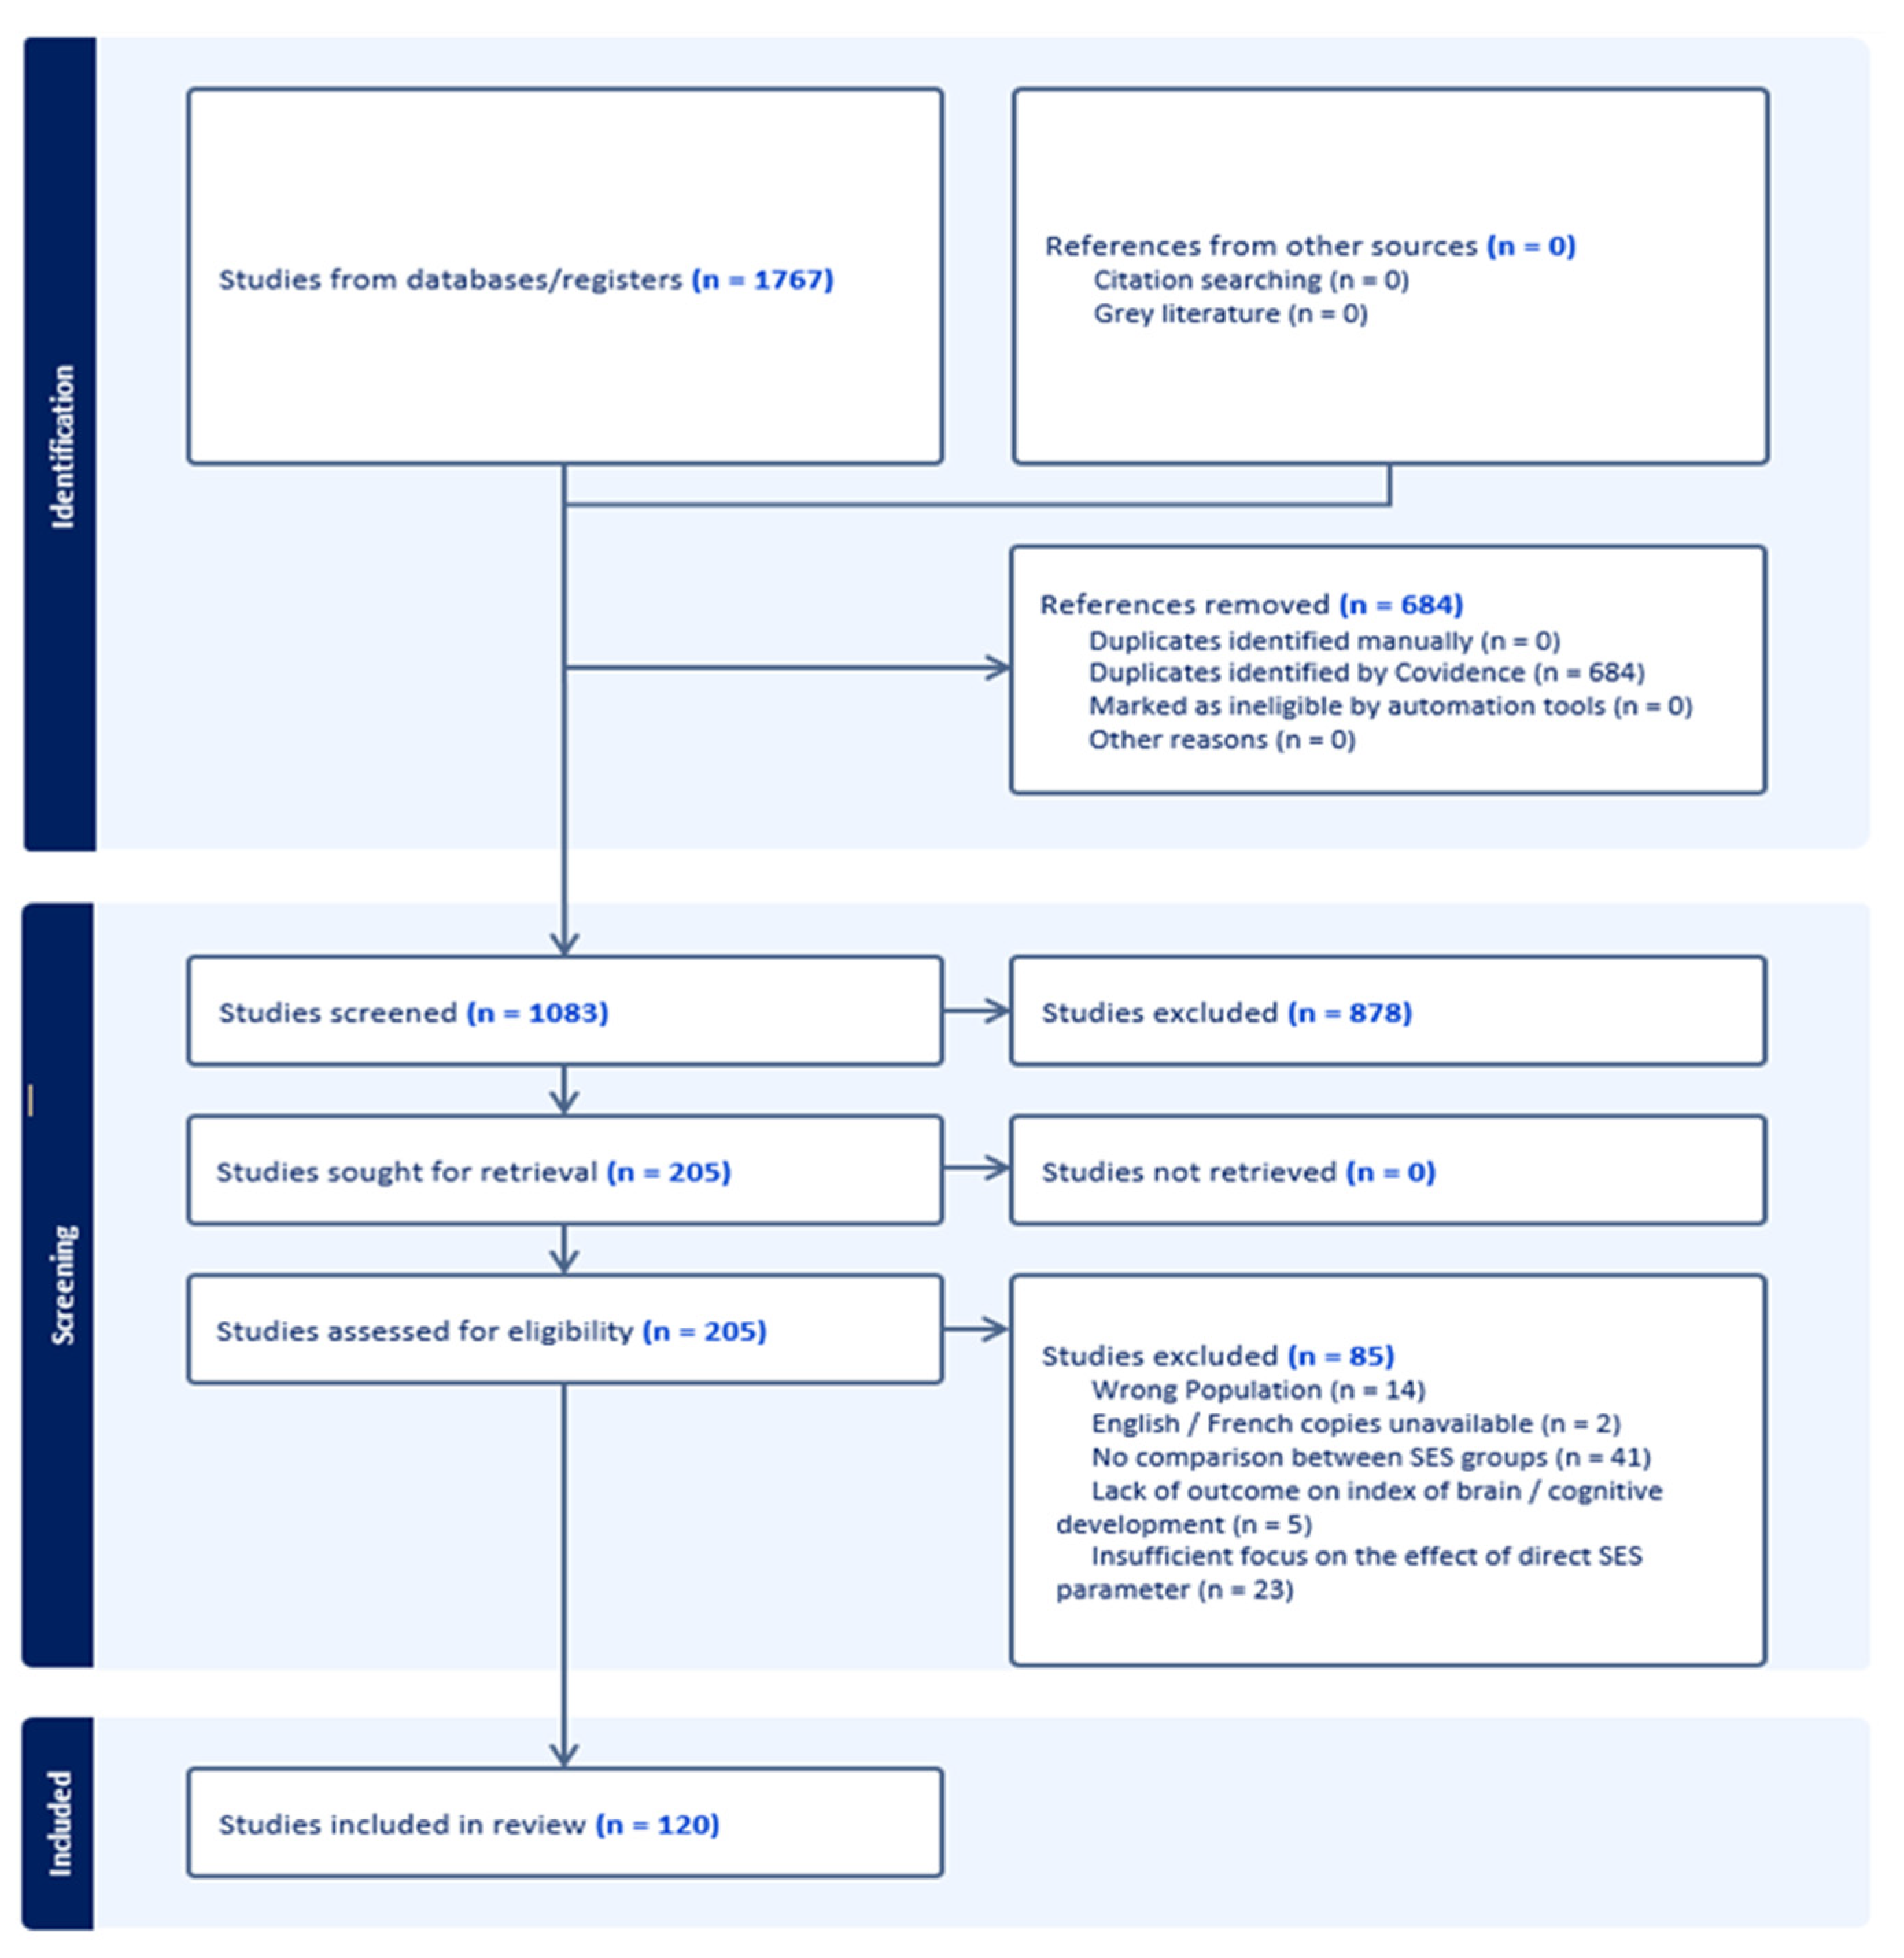
2.3. Selection Process

The final set of papers collected from Web of Science, PubMed, and Scopus was imported to Covidence, a systematic literature review management and streamlining software (see covidence.org). Covidence automatically removed duplicates. To ensure clarity and validity of selection criteria, three reviewers independently assessed document titles and abstracts from a sample of 24 randomly selected papers, discussed inconsistencies, and reached a consensus. Next, the full dataset was split into three sections each assigned to a reviewer, all of whom independently assessed document titles and abstracts within their section and determined whether they met the inclusion criteria of the review. Only studies investigating the effects of primary indices of SES/poverty on outcomes of brain development and/or cognition in developmentally typical children using neuroimaging techniques for data collection were included. If a document’s abstract was inaccessible, it was screened by its title alone.
Krippendorff’s alpha test was used to score inter-rater reliability before and after a consensus was reached. We chose to use Krippendorff’s alpha coefficient as a measure of inter-rater reliability because it has been reported as one of the most reliable measures of inter-rater agreement since it not only accounts for chance but can be used with nominal data rated by more than two judges [54]. Kα = 0.000 denotes an absence of reliability, and Kα = 1.000 denotes perfect reliability. According to Krippendorff, Kα should be equal to or greater than 0.800 for acceptable reliability [55]. Our pre-consensus inter-rater reliability coefficient was high (Kα = 0.8733), suggesting that the raters had a high agreement rate, even before reaching a consensus. After a discussion, the judges refined the inclusion criteria and reached a consensus, as reflected by the post-consensus reliability coefficient of 1.000, indicating perfect reliability.
After the document title and abstract screening were completed, full texts of the remaining documents were either automatically retrieved by the Covidence software or manually retrieved by the reviewers using Carleton University’s Omni library. Full-text documents were independently assessed by the reviewers and excluded from the dataset if they met even one of the following exclusion criteria: 1. English or French copies of the document are unavailable, 2. Insufficient focus on the effect of primary index of SES, 3. Lack of comparative statistical data between different SES groups, 4. Lack of outcome on brain development or cognition, and 5. Wrong population (a population other than developmentally typical children). Uncertainty about the inclusion of a document was resolved via a discussion between the three reviewers and, if necessary, advice from the principal investigator.

2.4. Data Collection Process

The standard data extraction template provided by Covidence was customized to include sections for reporting the first author, year of publication, document title, document’s Digital Object Identifier (DOI), the country in which the study was conducted, the study’s aim, the chosen neuroimaging technique, population characteristics and design, the intervention and/or exposure variables, the outcome variables, the comparisons, the main findings, and the author’s possible conflicts of interest. The reviewers started the data extraction process by independently extracting data from a randomly selected sample of ten documents. Inconsistencies were discussed and resolved, and additional sections for acronyms and data analysis plan were added to the data extraction worksheet to familiarize reviewers with unfamiliar acronyms and contextualize the statistical data, respectively. The rest of the dataset underwent data extraction using the updated worksheet. There was no need to confirm any data; hence, no corresponding authors were contacted for further information. No automation tools were used in this process.
Reviewers sought statistical data for any outcome relating to brain development and/or cognition, including but not limited to executive function, attention, memory, language, reasoning, inhibitory control, cortical volumes and structures, brain activation, functional organization, and functional connectivity. When reviewers encountered studies with multiple outcomes on child brain development and/or cognition, they reported results for all outcomes, making sure to categorize them as neuroimaging data if they were collected using neuroimaging techniques and non-imaging data if they were collected using other than neuroimaging. In studies employing multivariate models of analyses, only specific results of the main effects of SES and poverty predictor variables on the aforementioned brain development and cognition outcome variables from the most complete model were reported. In cases where authors reported unstandardized and standardized results from the same trials, only the standardized results were reported.
Reviewers sought data for the following predictor variables: parental education, maternal and paternal education, family and household income, income-to-needs ratio, neighborhood SES, area deprivation index, community-level socioeconomic disadvantage, and other primary indices of SES and poverty. Participant and sample characteristics such as age, sex, and initial and final sample size were collected. Types of imaging techniques used in each study were also collected.

2.5. Synthesis Methods

Studies eligible for synthesis were those that fulfilled the criterium for comparative statistical data between SES groups on outcomes of cognitive and brain development in the form of t-tests, correlations, regressions, ANOVAs, and so forth, in addition to all the aforementioned selection criteria.
The statistical data collected in Covidence was imported to Microsoft Excel, where they were first converted to Pearson’s correlation coefficients using Robert Rosenthal’s procedure [56] and then standardized using Fisher’s r to z conversion. Next, mean effect size and p-value were computed for each study, both weighted by the sample size associated with each test. If applicable, mean effect sizes and p-values were separately computed for imaging and non-imaging behavioral data. Finally, the mean effect sizes and p-values were imported to SPSS for analysis. A Z to p transformation was executed in SPSS, which generated one-tailed and two-tailed p-values for each study. Corrected mean effect sizes were also computed using a modified version of the inverse variance weighting procedure (i.e., the weights were scaled in natural logarithms to facilitate interpretation and express the results of the application of correction as correlation coefficients rather than as an arbitrary scale).
In the data analysis conducted in SPSS, predictor variables included country, continental region, country income level, neuroimaging technique, and developmental outcome. The outcome variables were mean effect size (measured with the absolute and corrected Pearson’s correlation coefficient) and the mean significance level (measured with the absolute and corrected p-value) associated with each study. To provide visual representations of heterogeneity of mean effect sizes and significance values, bar graphs displaying absolute and corrected mean effect sizes (with error bars) for each predictor variable were created (with absolute coefficients displayed in the Top panel of the figures and corrected coefficients displayed in the Bottom panel of the figures). Similarly, bar graphs displaying absolute and corrected mean two-tailed p-values (with error bars) for each predictor variable were created (with absolute p-values displayed in the Top panel of the figures and corrected p-values displayed in the Bottom panel of the figures). Then, a Bayesian One-Way ANOVA weighted by study sample size was conducted for each predictor variable, using mean effect size and mean two-tailed p-value as outcome variables. One-way Bayesian ANOVAs on corrected mean effect sizes and corresponding p-values were also computed in an effort to account for differences in study sample sizes and to allow for meaningful comparisons between uneven numbers of studies across levels of predictor variables [56]. Each output includes an estimated Bayes Factor indicating whether there is significant evidence of statistical heterogeneity across levels of the given predictor variable, and the associated hypothesis testing p-value. The results of Bayes factor analysis testing for evidence of Null vs. Alternative hypothesis ratio were interpreted using the classic Jeffreys scale [57]. As a significance threshold for hypothesis testing, we adopted the more liberal threshold of 0.10 in order to balance the probabilities of Type I and II errors embedded in the original studies [58].
Additionally, a bibliometric analysis was conducted using Vosviewer in order to quantify instances of implicit deficit attribution within the dataset. Vosviewer is a software that uses an ensemble of algorithms to extract bibliographic information from a given set of publications and outputs a multitude of scientometric networks and maps, offering an in-depth understanding of the data [59]. For the purposes of this study, a co-occurrence key term network displaying the links between the most prevalent keywords (extracted from document titles and abstracts) was created to visualize instances of implicit deficit attribution.

3. Results

3.1. Descriptive Results

Out of the subset of 66 papers included in this analysis, only ten studies were conducted in the lower-middle (India and Pakistan) to upper-middle income countries (Brazil, China, Mexico, and Venezuela), while the other 56 were conducted in high-income countries (Australia, Canada, France, Italy, Japan, Spain, the United Kingdom, and the United States) as defined by the 2023 World Bank Analytical Classifications [60]. In total, 49 of the papers (74.2%) were published in North America, seven were published in Latin America, five were published in Europe, and the five remaining papers were published in South Asian and Pacific regions. A total of 14 countries contributed to the literature on developmental neuroimaging and differential SES effects, as indicated by the results of our search on Web of Science, Scopus, and PubMed.

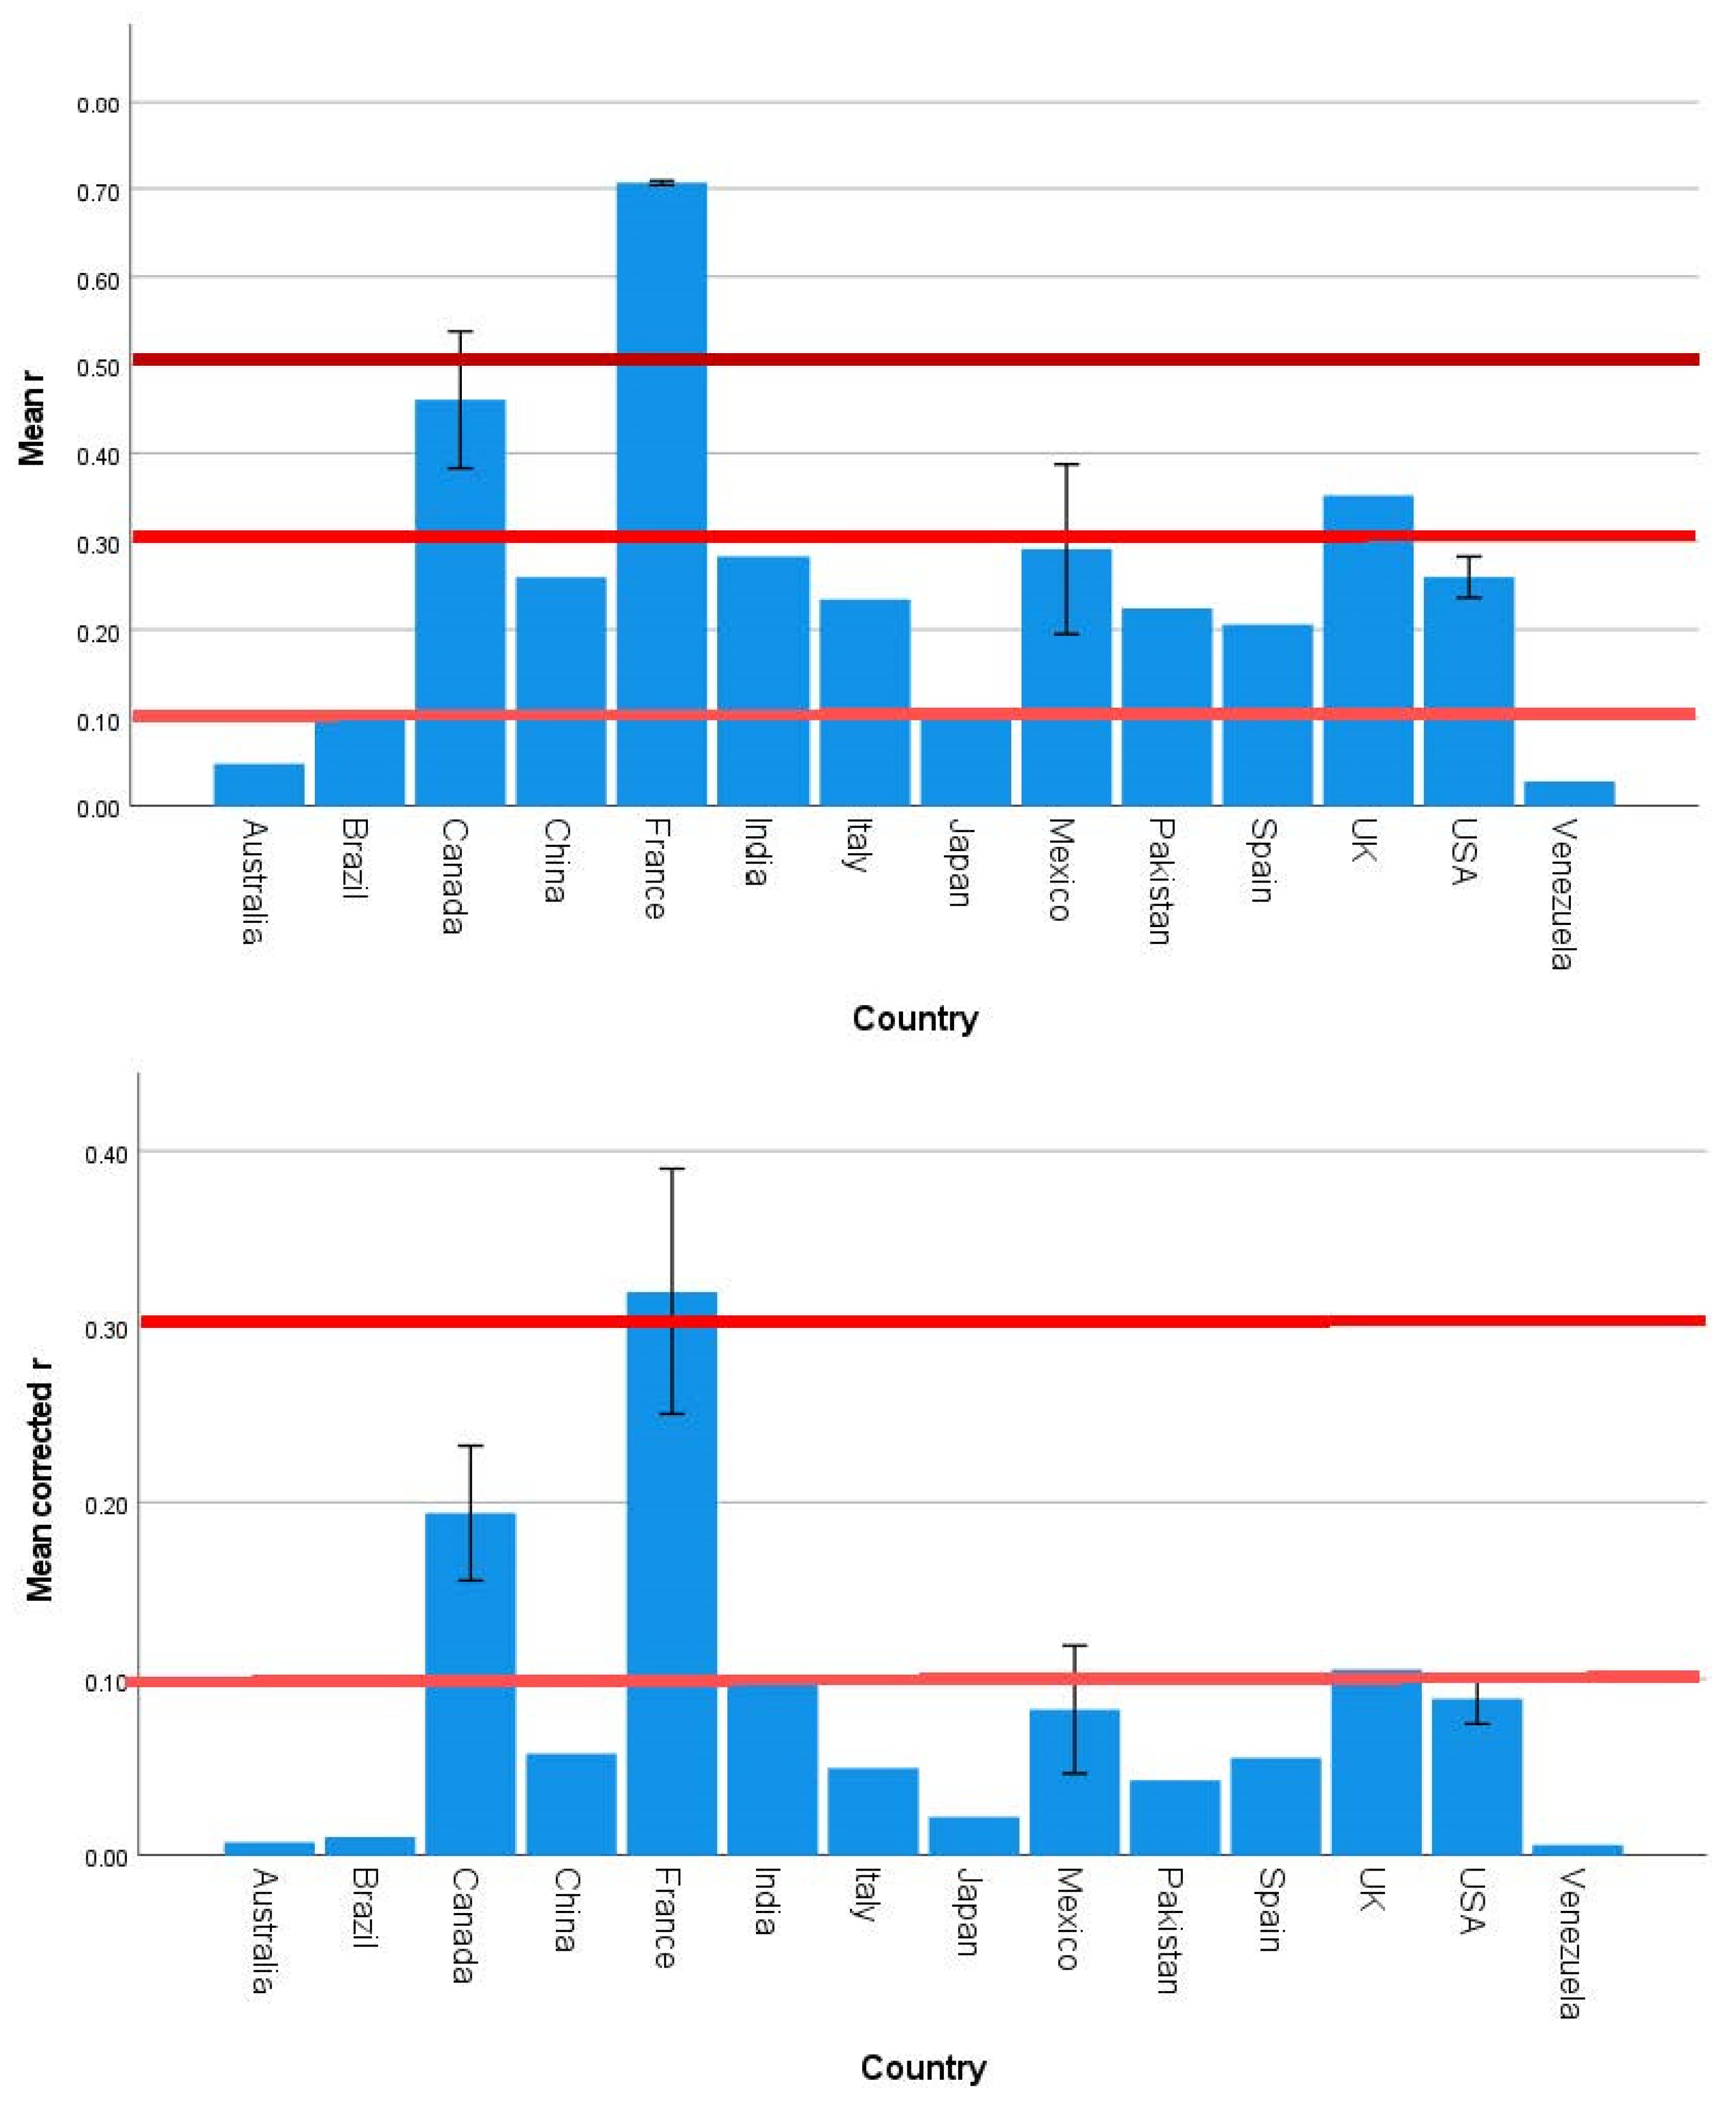
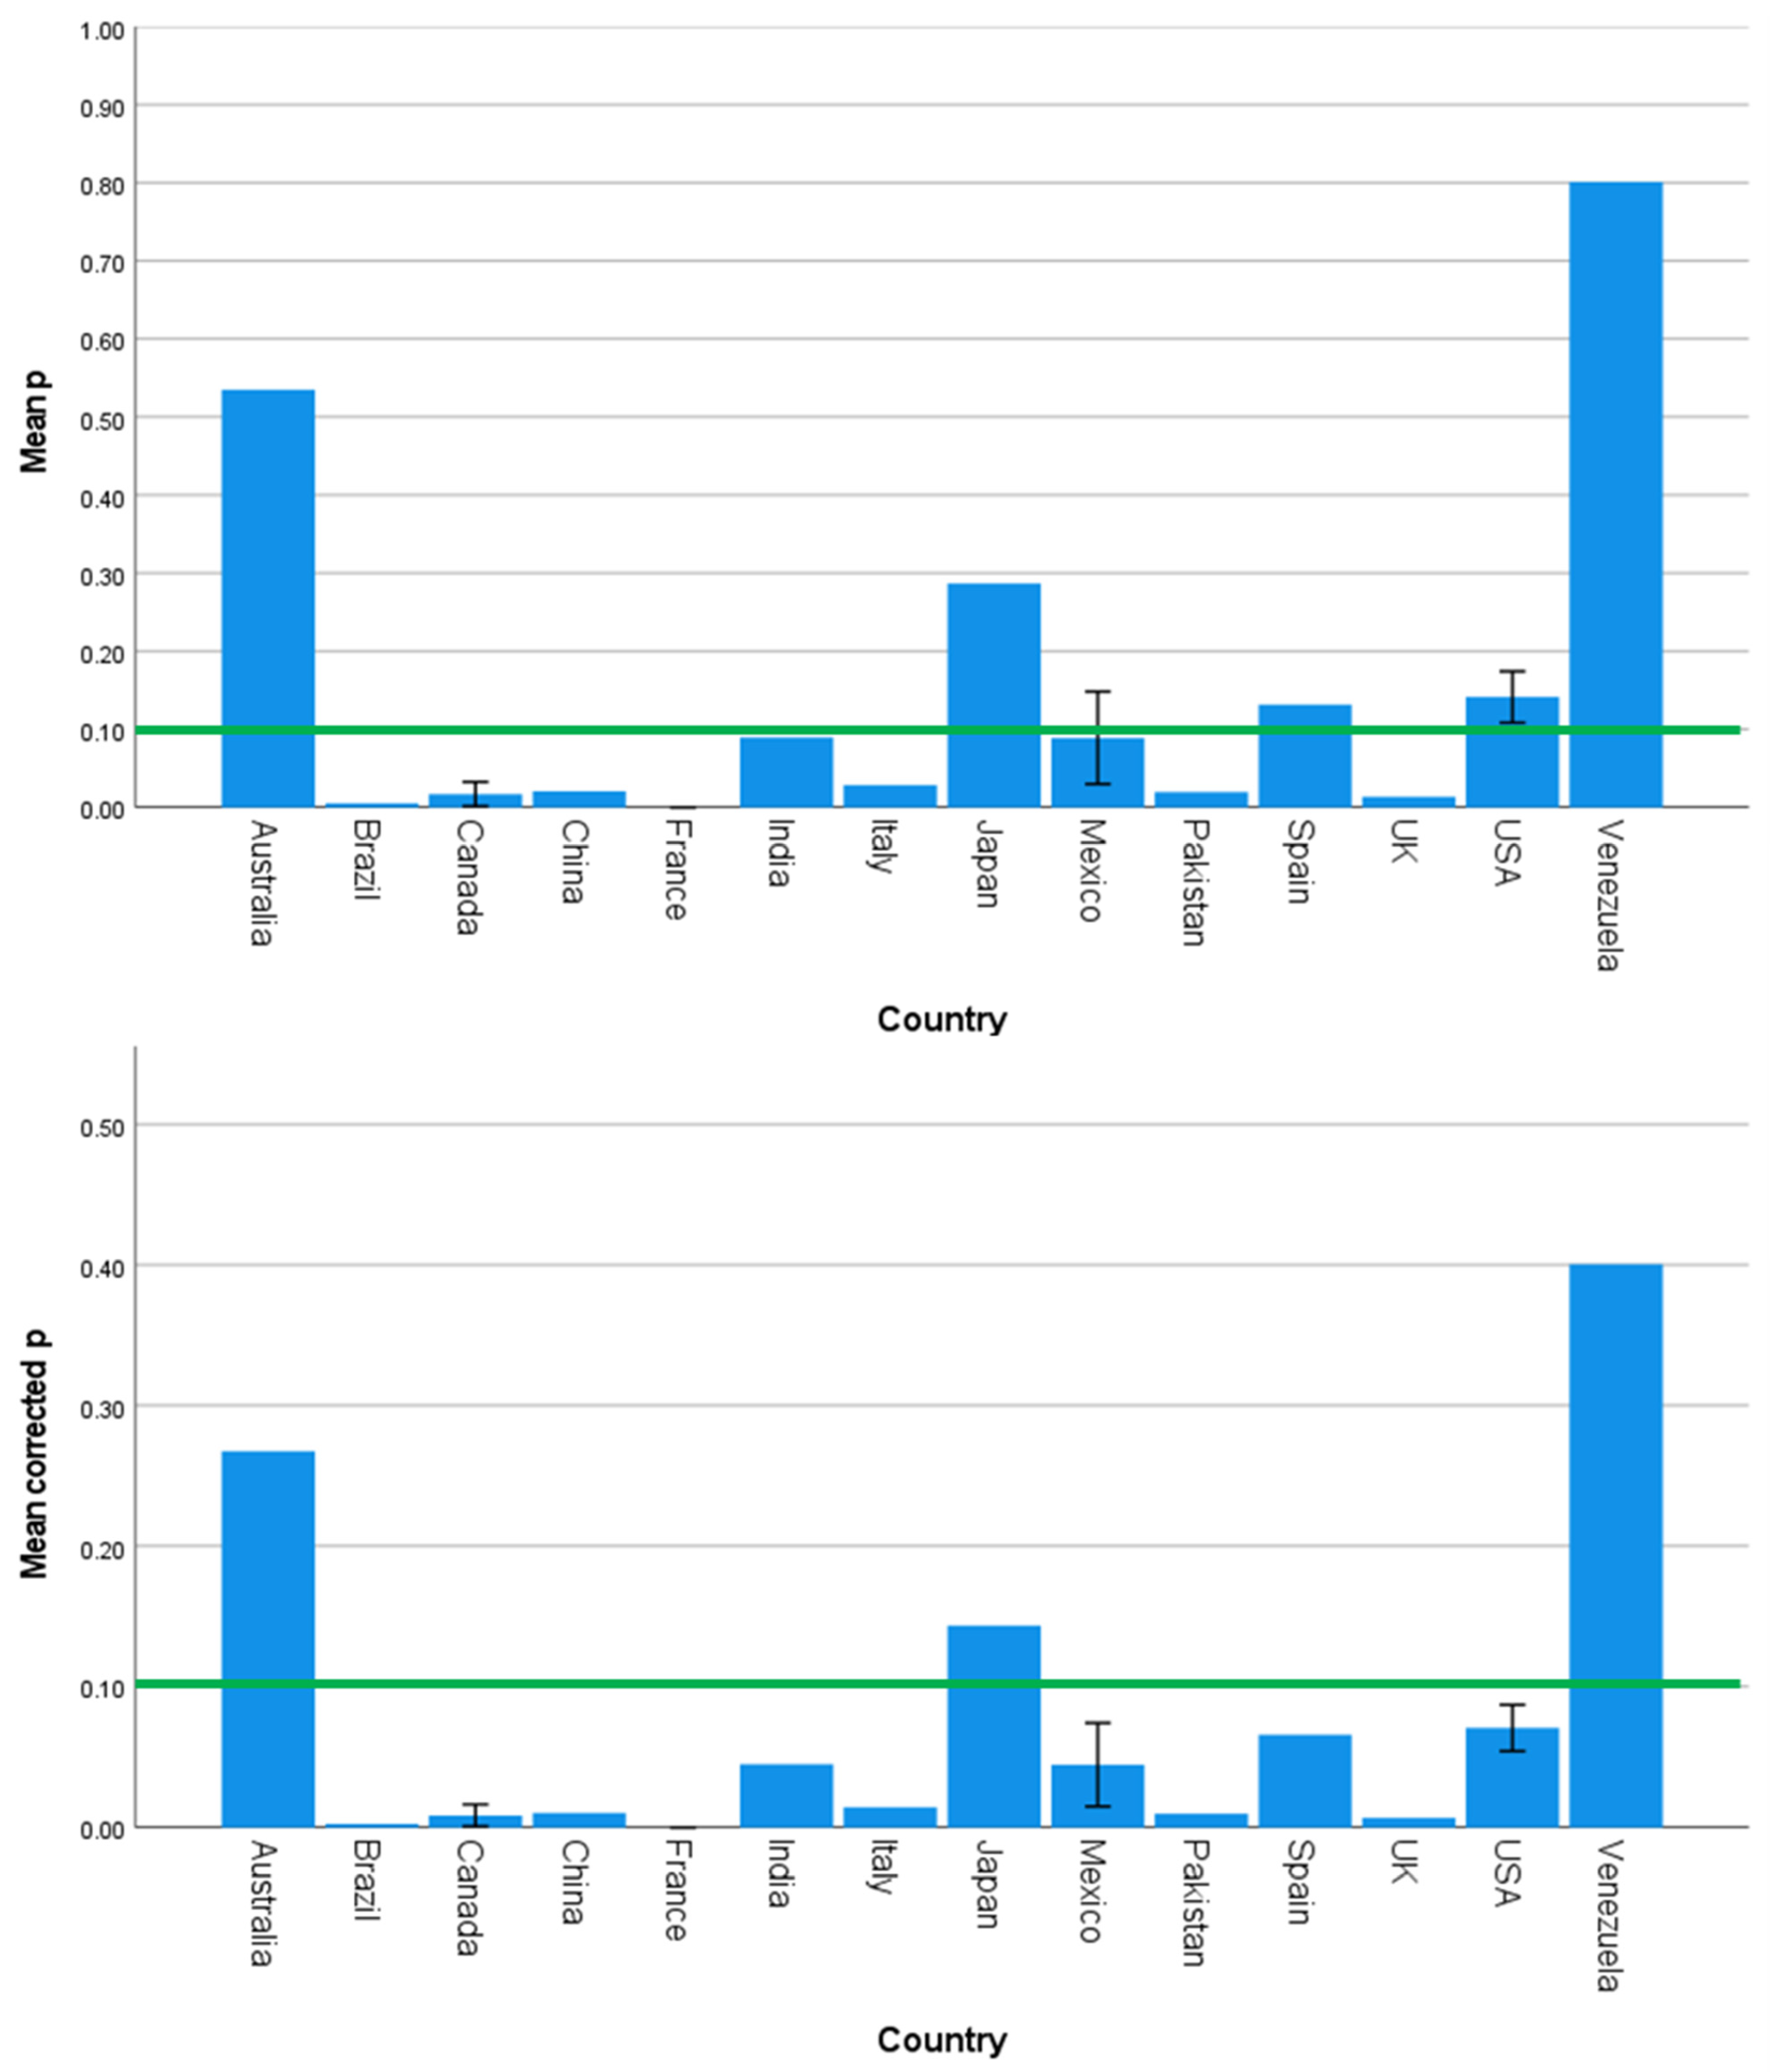
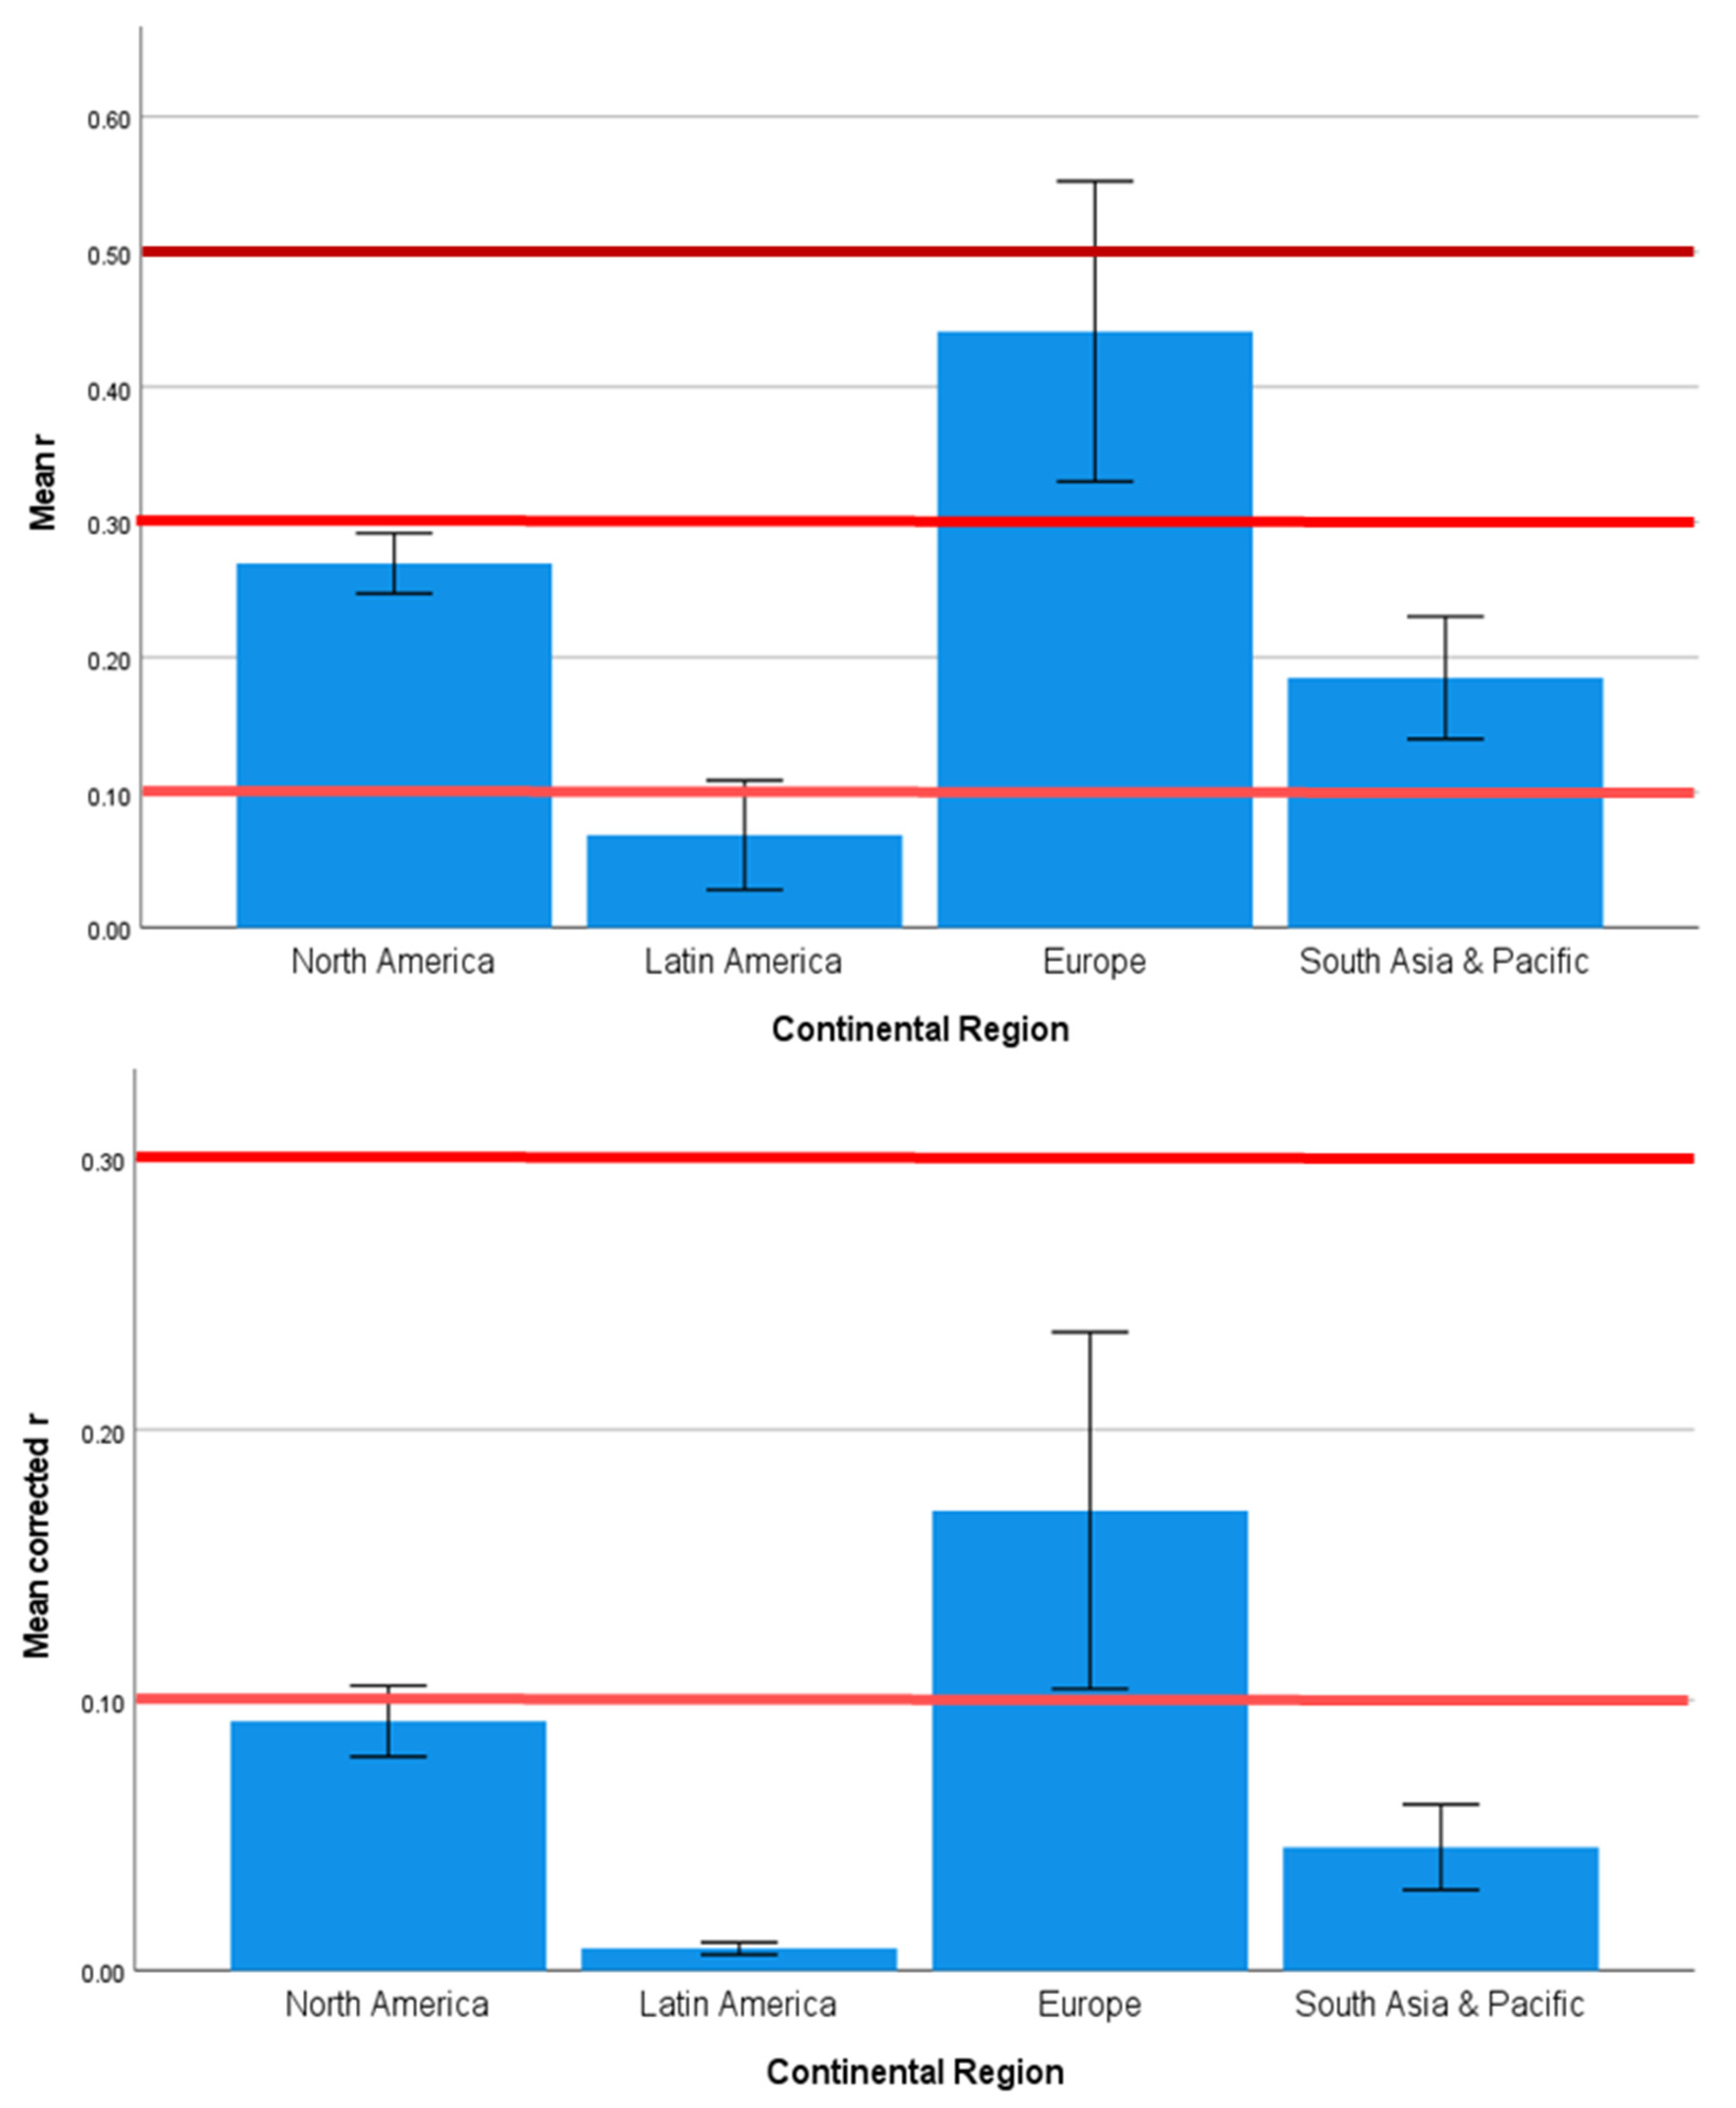
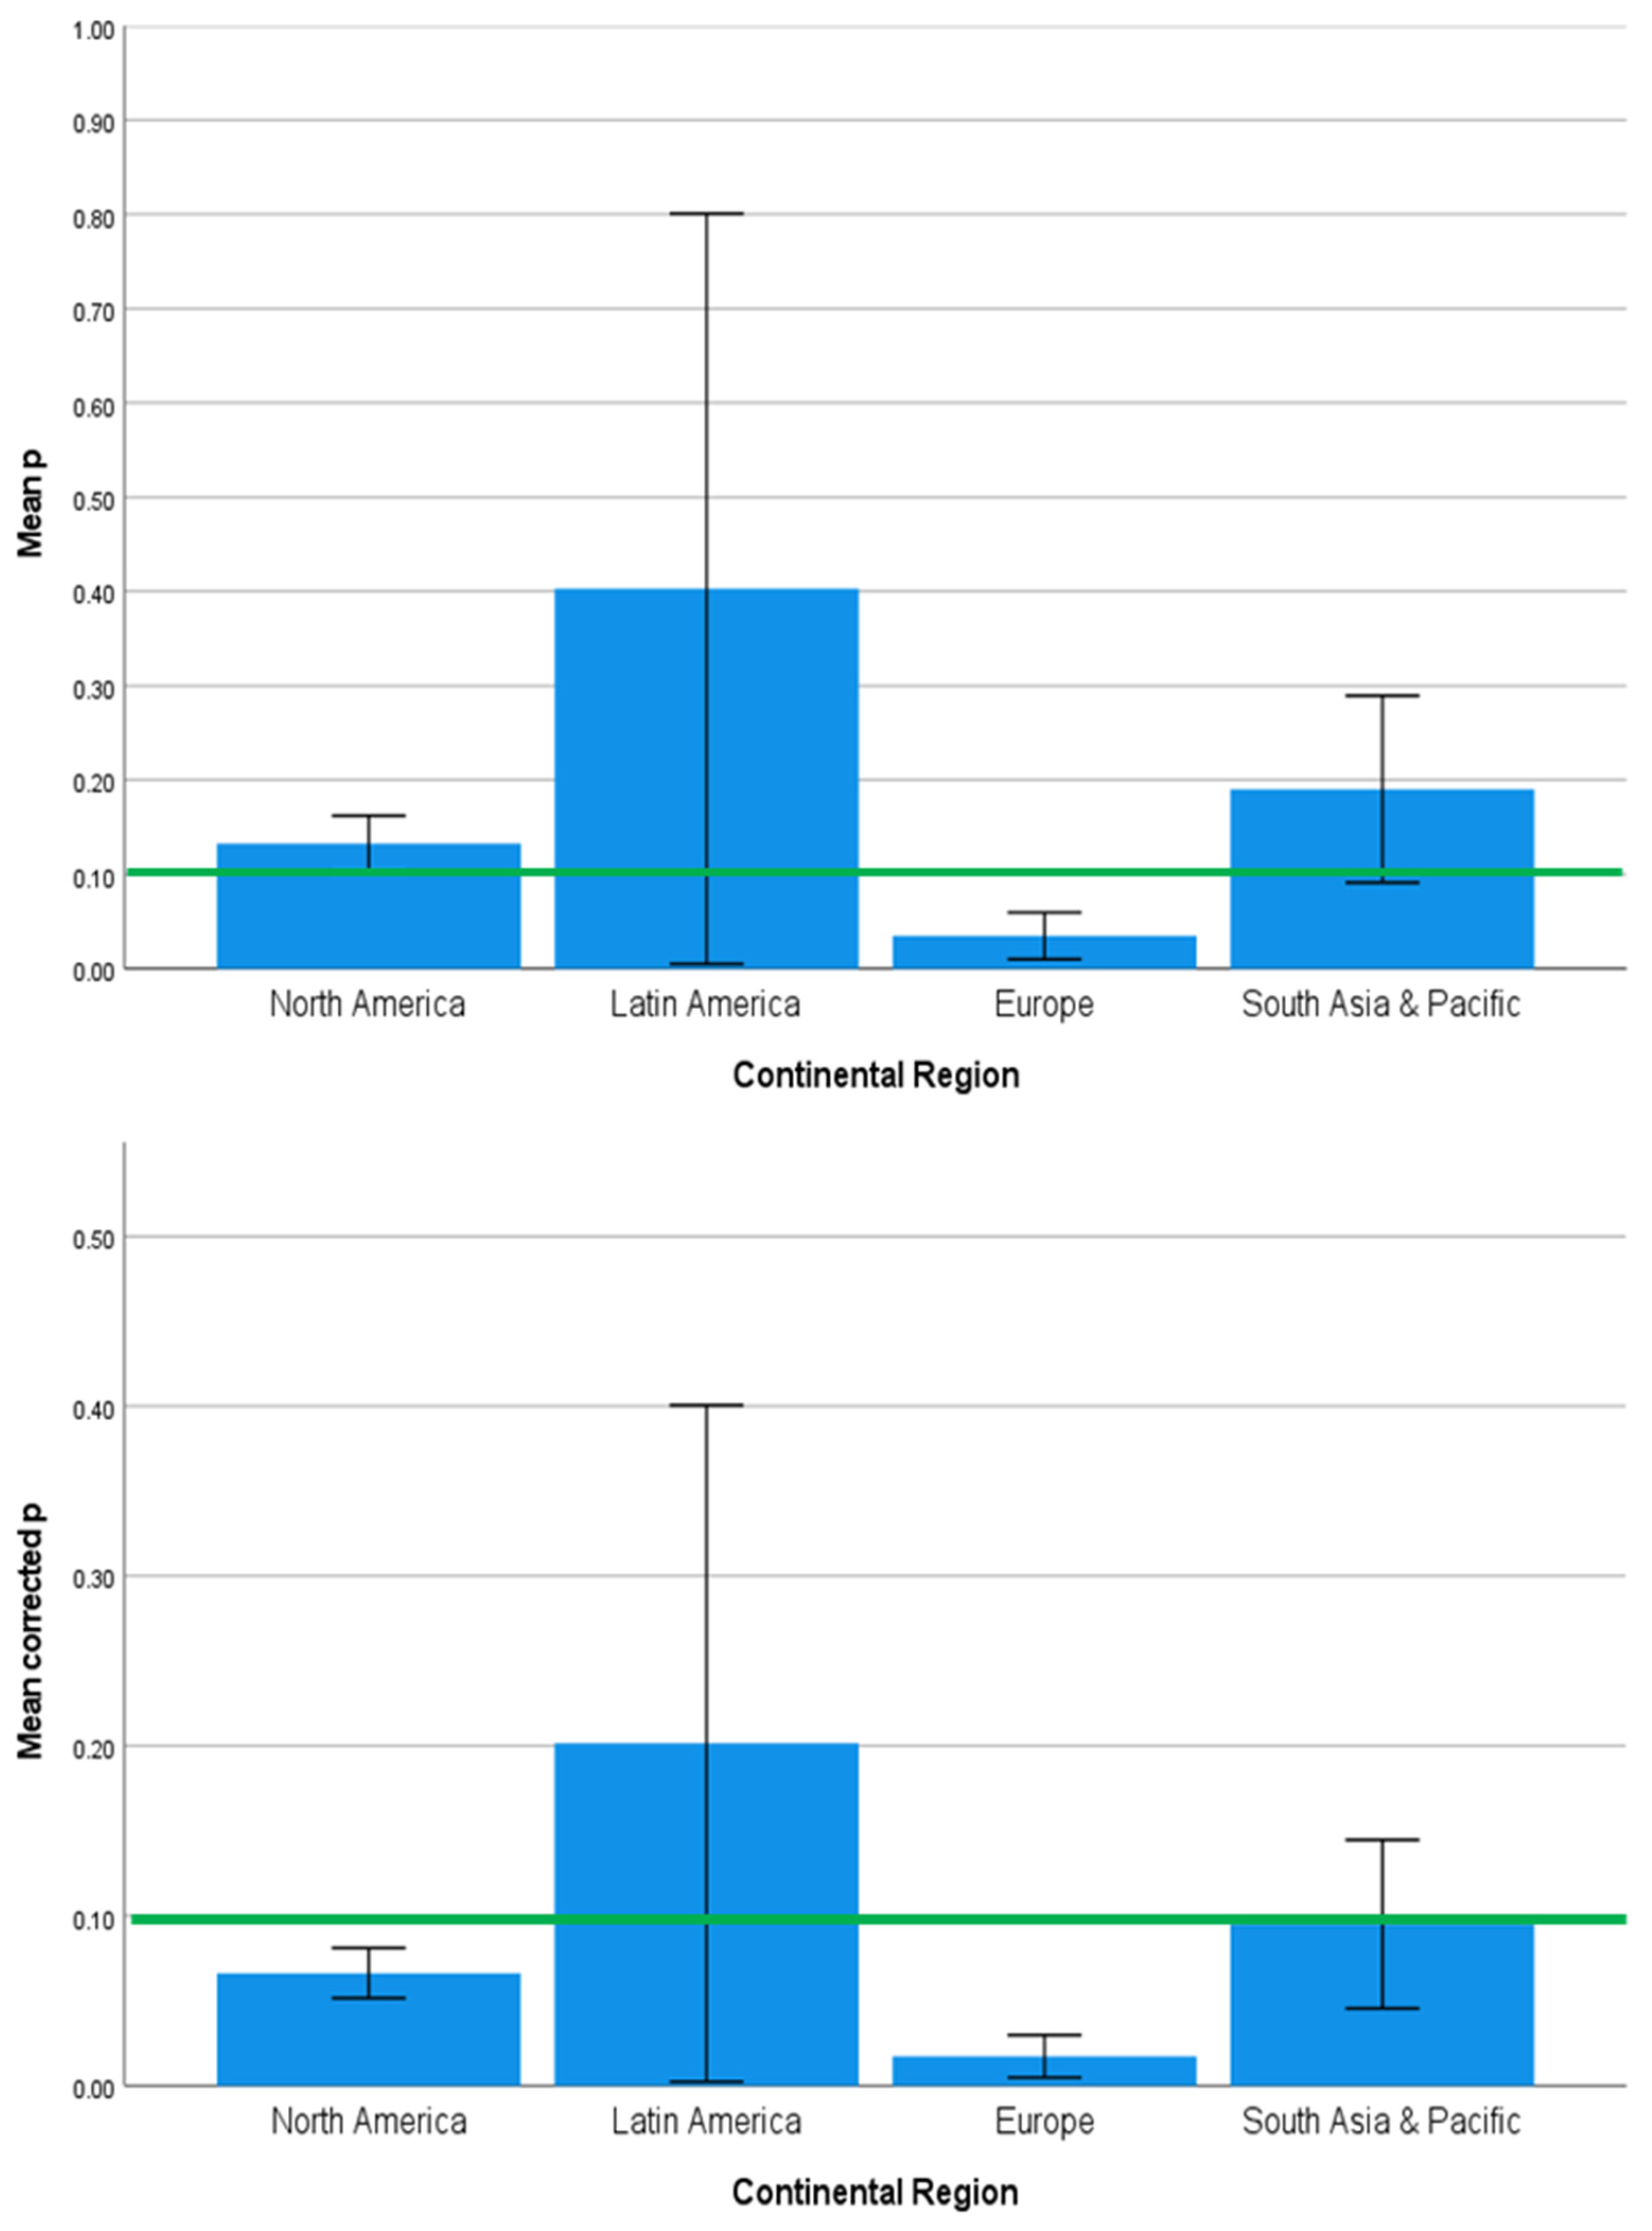
3.2. Strength and Significance of the Direct Effects of SES on Brain Development Outcomes Vary across Countries, Continents, and Country Income Level

The results displayed in the top panel of Figure 2 suggest that there is heterogeneity in the strengths of the main effects of SES and poverty on brain development outcomes in children across countries, with France showing extremely strong effects, Canada and UK showing large effects, Australia and Venezuela showing small effects, and the remaining countries showing intermediate effects. The bottom panel of Figure 2 with the corrected mean effect sizes shows a similar pattern of heterogeneity, albeit with smaller mean effect sizes. A One-way Bayesian ANOVA on the absolute effect sizes weighted by study sample size (BF = 0.000, Model: F(13,52) = 1.585, p = 0.120) revealed extremely strong evidence for the alternative hypothesis, i.e., that there is statistical heterogeneity in the unstandardized mean effect sizes across countries. Similarly, results displayed in the top panel of Figure 3 suggest that the corresponding absolute mean p-values are also heterogeneous across countries, with Brazil, Canada, China, France, India, Italy, Pakistan, and the UK falling below the significance threshold denoted by the green reference line in Figure 3, and Australia, Japan, Mexico, Spain, USA, and Venezuela with mean p-values failing to reach statistical significance. The bottom panel with the corrected significance values displays a similar pattern heterogeneity, with Australia, Japan, and Venezuela being the only countries failing to reach the significance threshold. A one-way Bayesian ANOVA weighted by study sample sizes (BF = 0.000, Model: F(13,52) = 1.532, p = 0.137) revealed extremely strong evidence of statistical heterogeneity among absolute mean p-values by country.
When comparing the absolute mean effect sizes and significance values at the continental level, we found that Europe showed large main effects of SES, whereas the remaining continental regions showed intermediate effects (Figure 4, top panel), and only the mean p-values associated with findings generated in Europe reached significance (Figure 5, top panel). The pattern of heterogeneity remained when mean effect sizes were corrected, but the strength of the effects diminished, with Europe showing intermediate effects and the remaining continental regions showing small effects (Figure 4, bottom panel). Likewise, the distribution of corrected p-values remained similar though smaller than their absolute counterparts, resulting in North America and Europe reaching significance. A one-way Bayesian ANOVA provided strong evidence of statistical heterogeneity among the absolute main effect sizes (BF = 0.076, Model: F(3,62) = 2.357, p = 0.080) and very strong evidence of statistical heterogeneity in absolute mean p-values (BF = 0.017, Model: F(3,62) = 1.270, p = 0.293) across continents. One-way Bayesian ANOVAs on corrected mean effect sizes and corrected p-values across countries (Effect sizes: BF = 0.000, Model: F(13,52) = 1.571, p = 0.124; p-values: BF = 0.000, Model: F(13,52) = 1.538, p = 0.135) and continents (Effect sizes: BF = 0.097, Model: F(3,62) = 2.342, p = 0.082; p-values: BF = 0.008, Model: F(3,62) = 1.316, p = 0.277) yielded similar results.
To determine whether the direct effects of SES differed as a function of country income level, we compared effect sizes and p-values by country income level. Absolute mean effect size coefficients (Figure 6, top panel) for lower-middle-, upper-middle-, and high-income countries were all intermediate, suggesting a lack of statistical heterogeneity. When considering the absolute p-values, the only studies to reach significance were those published in lower-middle-income countries (Figure 7, top panel). Plotting corrected mean effect sizes and corresponding significance values against country income level showed similar patterns, albeit with smaller effect sizes and significance values, and with both low-middle-income and high-income countries reaching significance as a result. Despite the overlap displayed in Figure 6 panels, the results of a one-way Bayesian ANOVA (BF = 0.019; Model: F(2,63) = 0.272, p = 0.763) revealed very strong evidence of statistical heterogeneity among absolute mean effect sizes and strong evidence of statistical heterogeneity among absolute mean p-values (BF = 0.055, Model: F(2,63) = 1.385, p = 0.2583) across levels of country income. The results of a one-way Bayesian ANOVA on corrected mean effect sizes (BF = 0.018, Model: F(2,63) = 0.285, p = 0.753) and on corrected mean significance values (BF = 0.025; Model: F(2,63) = 1.449, p = 0.243) were similar.

3.3. Are the Main Effects of SES Always Detrimental?

Using p < 0.10 as our significance threshold, we considered the number of studies that yielded significant findings and those that did not. We found that 43 papers yielded findings that reached significance, whereas the findings from the 23 remaining papers did not. When considering the effect sizes associated with behavioral performance concurrent to imaging tasks (present in 23 papers), we found that 11 out of 23 papers yielded results reaching significance, with the remaining 12 papers failing to reach significance. A non-parametric Bayesian test of independence testing for differences between studies that yielded significant effects and those with effects that failed to reach significance revealed moderate evidence of homogeneity between the two sets of data (BF = 0.292), suggesting that behavioral performance in neuroimaging tasks did not differ as a function of SES.

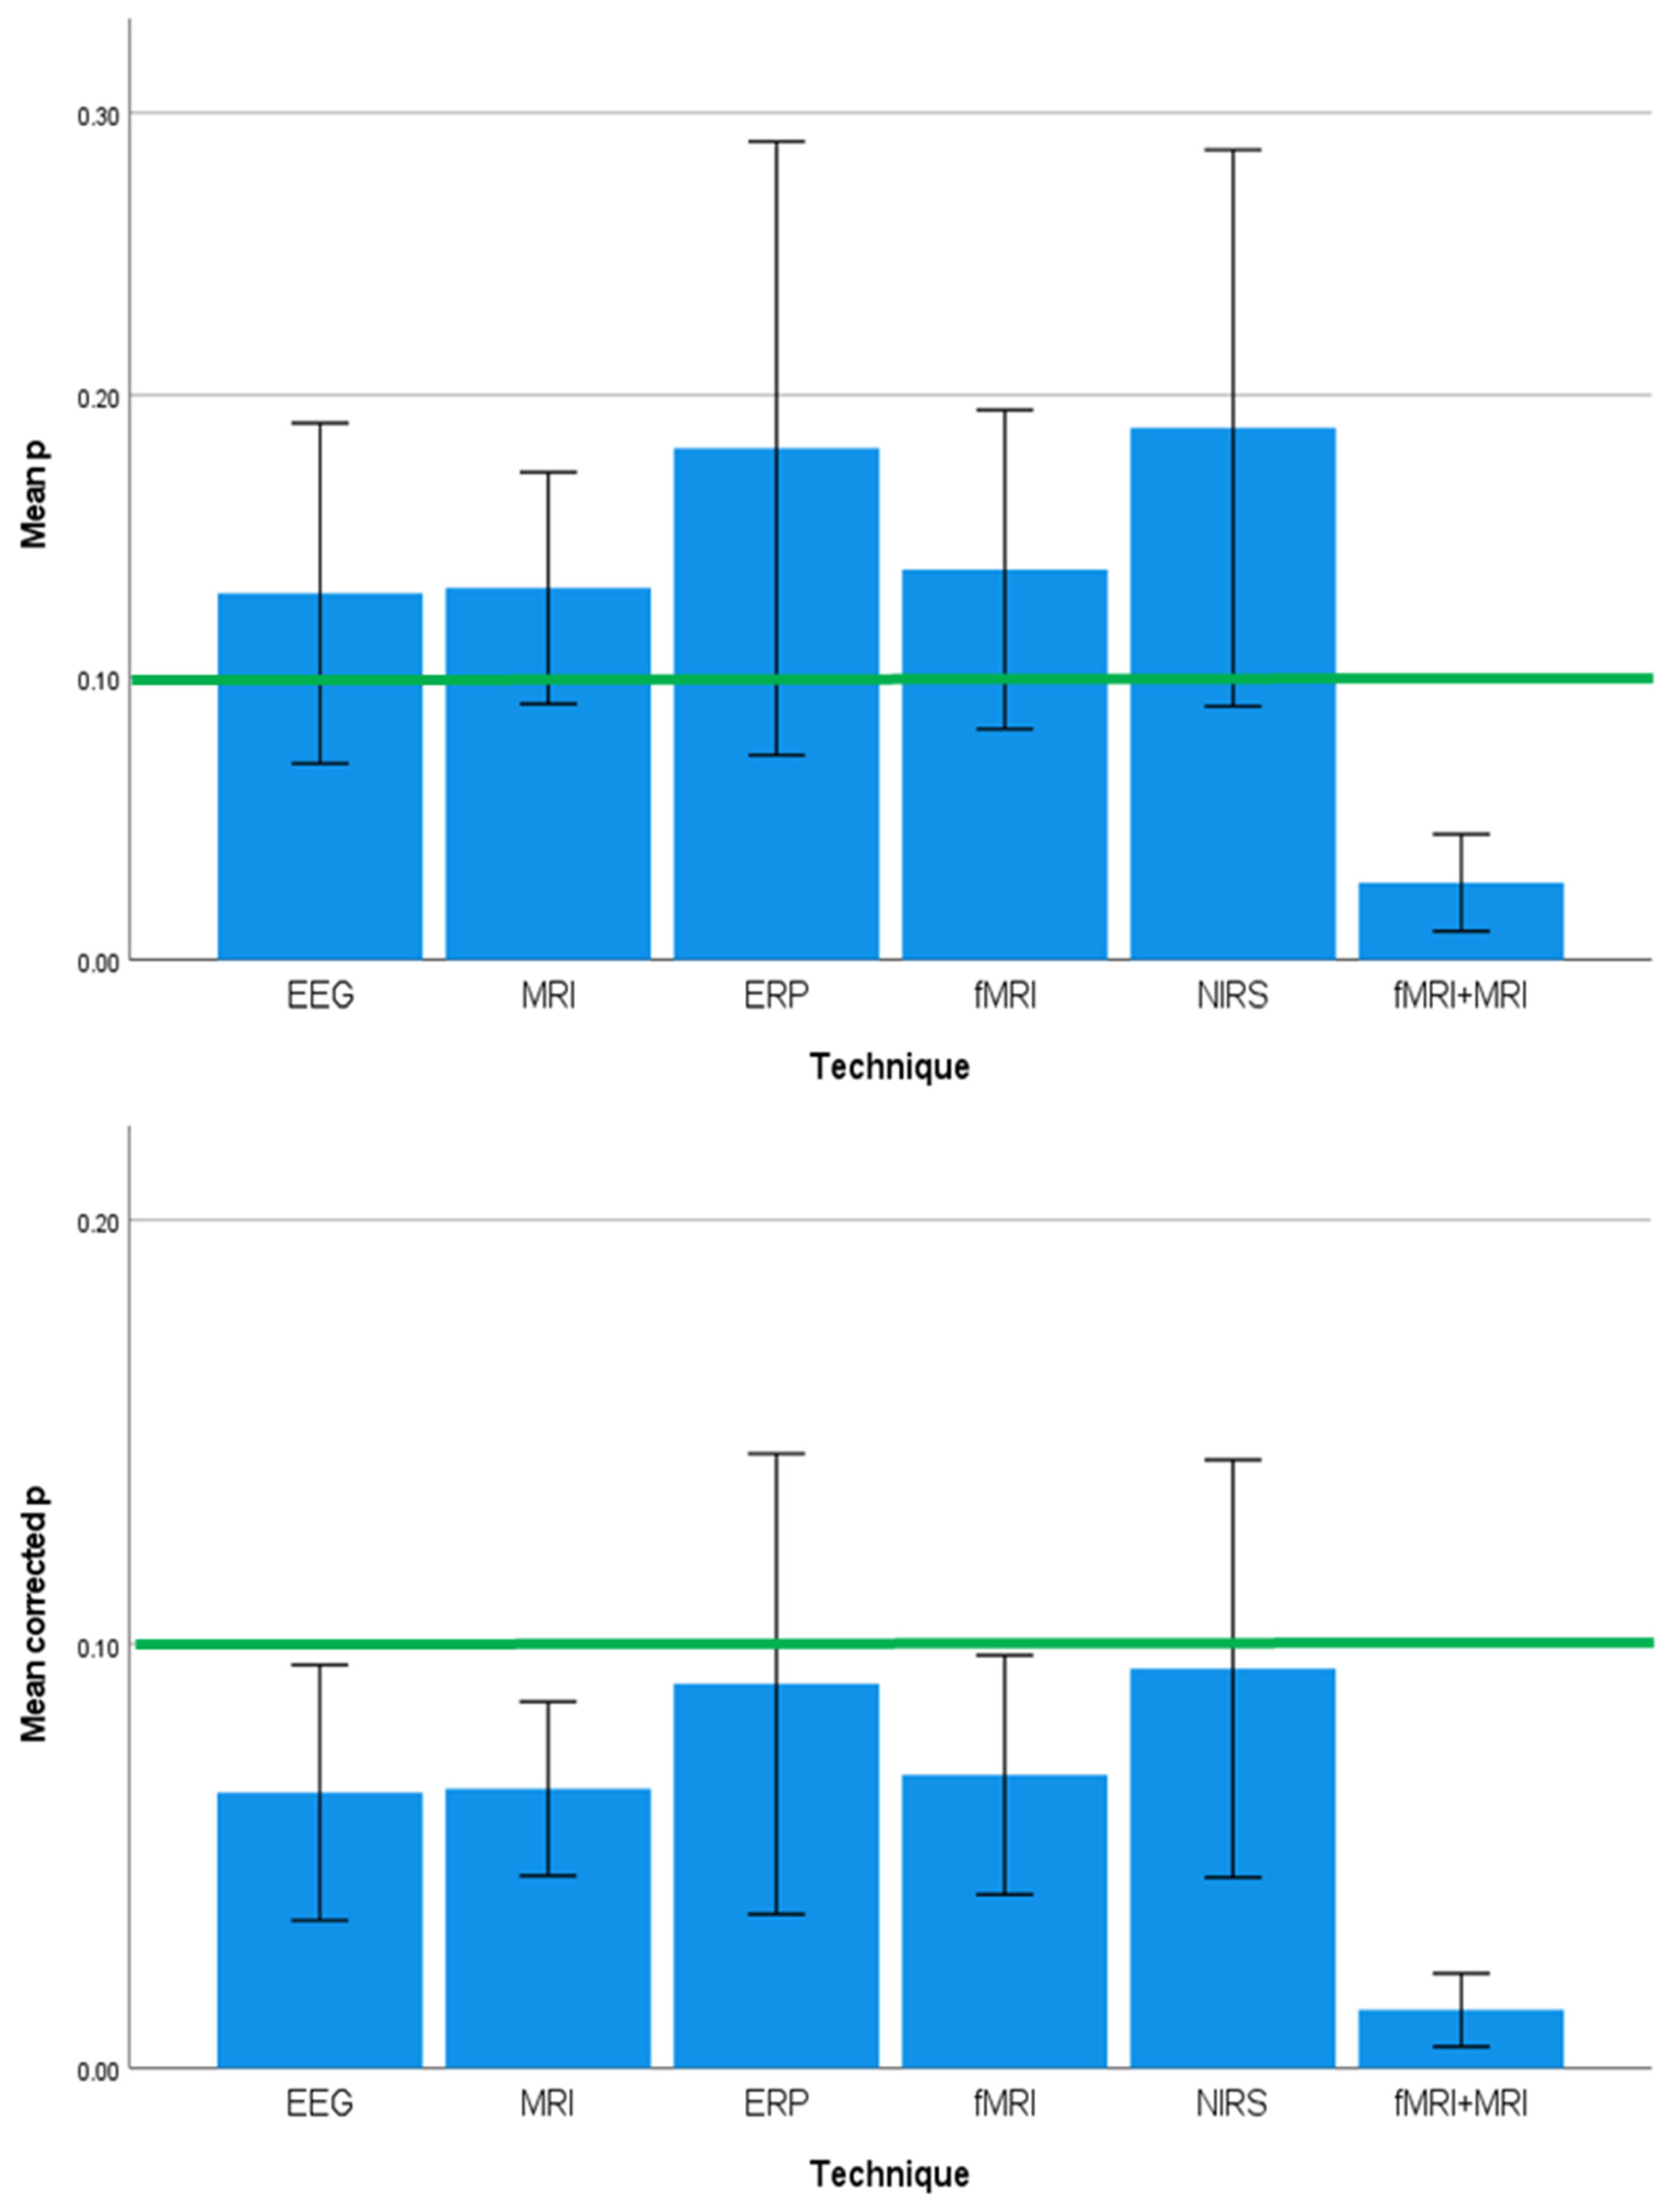
3.4. Effect Sizes and Significance Levels Differ by Neuroimaging Technique

Within the 66 studies included in our database, structural Magnetic Resonance Imaging (MRI) seemed the technique of choice, with 21 studies employing the technique for neuroimaging data collection, followed closely by functional MRI (fMRI) with 20 publications, the electroencephalogram (EEG: 13 studies), Event-Related Potentials (ERP: eight studies), Near InfraRed Spectroscopy (NIRS: two studies), and two papers combined functional and structural MRI for brain data collection. Studies employing a combination of fMRI and MRI techniques yielded large effect sizes, as shown in Figure 8. When considering absolute mean effect sizes and mean p-values, ERP, EEG, and fMRI studies yielded intermediate effects, and MRI and NIRS studies yielded small effects (Figure 8, top panel). At the neuroimaging technique level, the only studies to reach significance were those that combined fMRI and MRI (Figure 9, top panel), which could be indicative of the statistical reliability of their corresponding results. These patterns were replicated when corrected mean effect sizes and corresponding significance values were plotted against neuroimaging technique, albeit with diminished effect sizes and significance values. As a result, all but two techniques (ERP and NIRS) fell below the significance threshold. A One-Way Bayesian ANOVA provided moderate evidence of statistical heterogeneity in absolute mean effect sizes (BF = 0.161, Model: F(5,60) = 3.161, p = 0.013) and extremely strong evidence of statistical heterogeneity among absolute mean significance values (BF = 0.000, Model: F(5,60) = 0.335, p = 0.890) across neuroimaging techniques. A one-way Bayesian ANOVA on corrected mean effect sizes (BF = 0.065; Model: F(5,60) = 3.122, p = 0.014) and corresponding significance values (BF = 0.000; Model: F(5,60) = 0.349, p = 0.881) yielded smaller Bayesian Factors, suggesting a higher degree of statistical heterogeneity in corrected mean effect sizes and corresponding p-values.

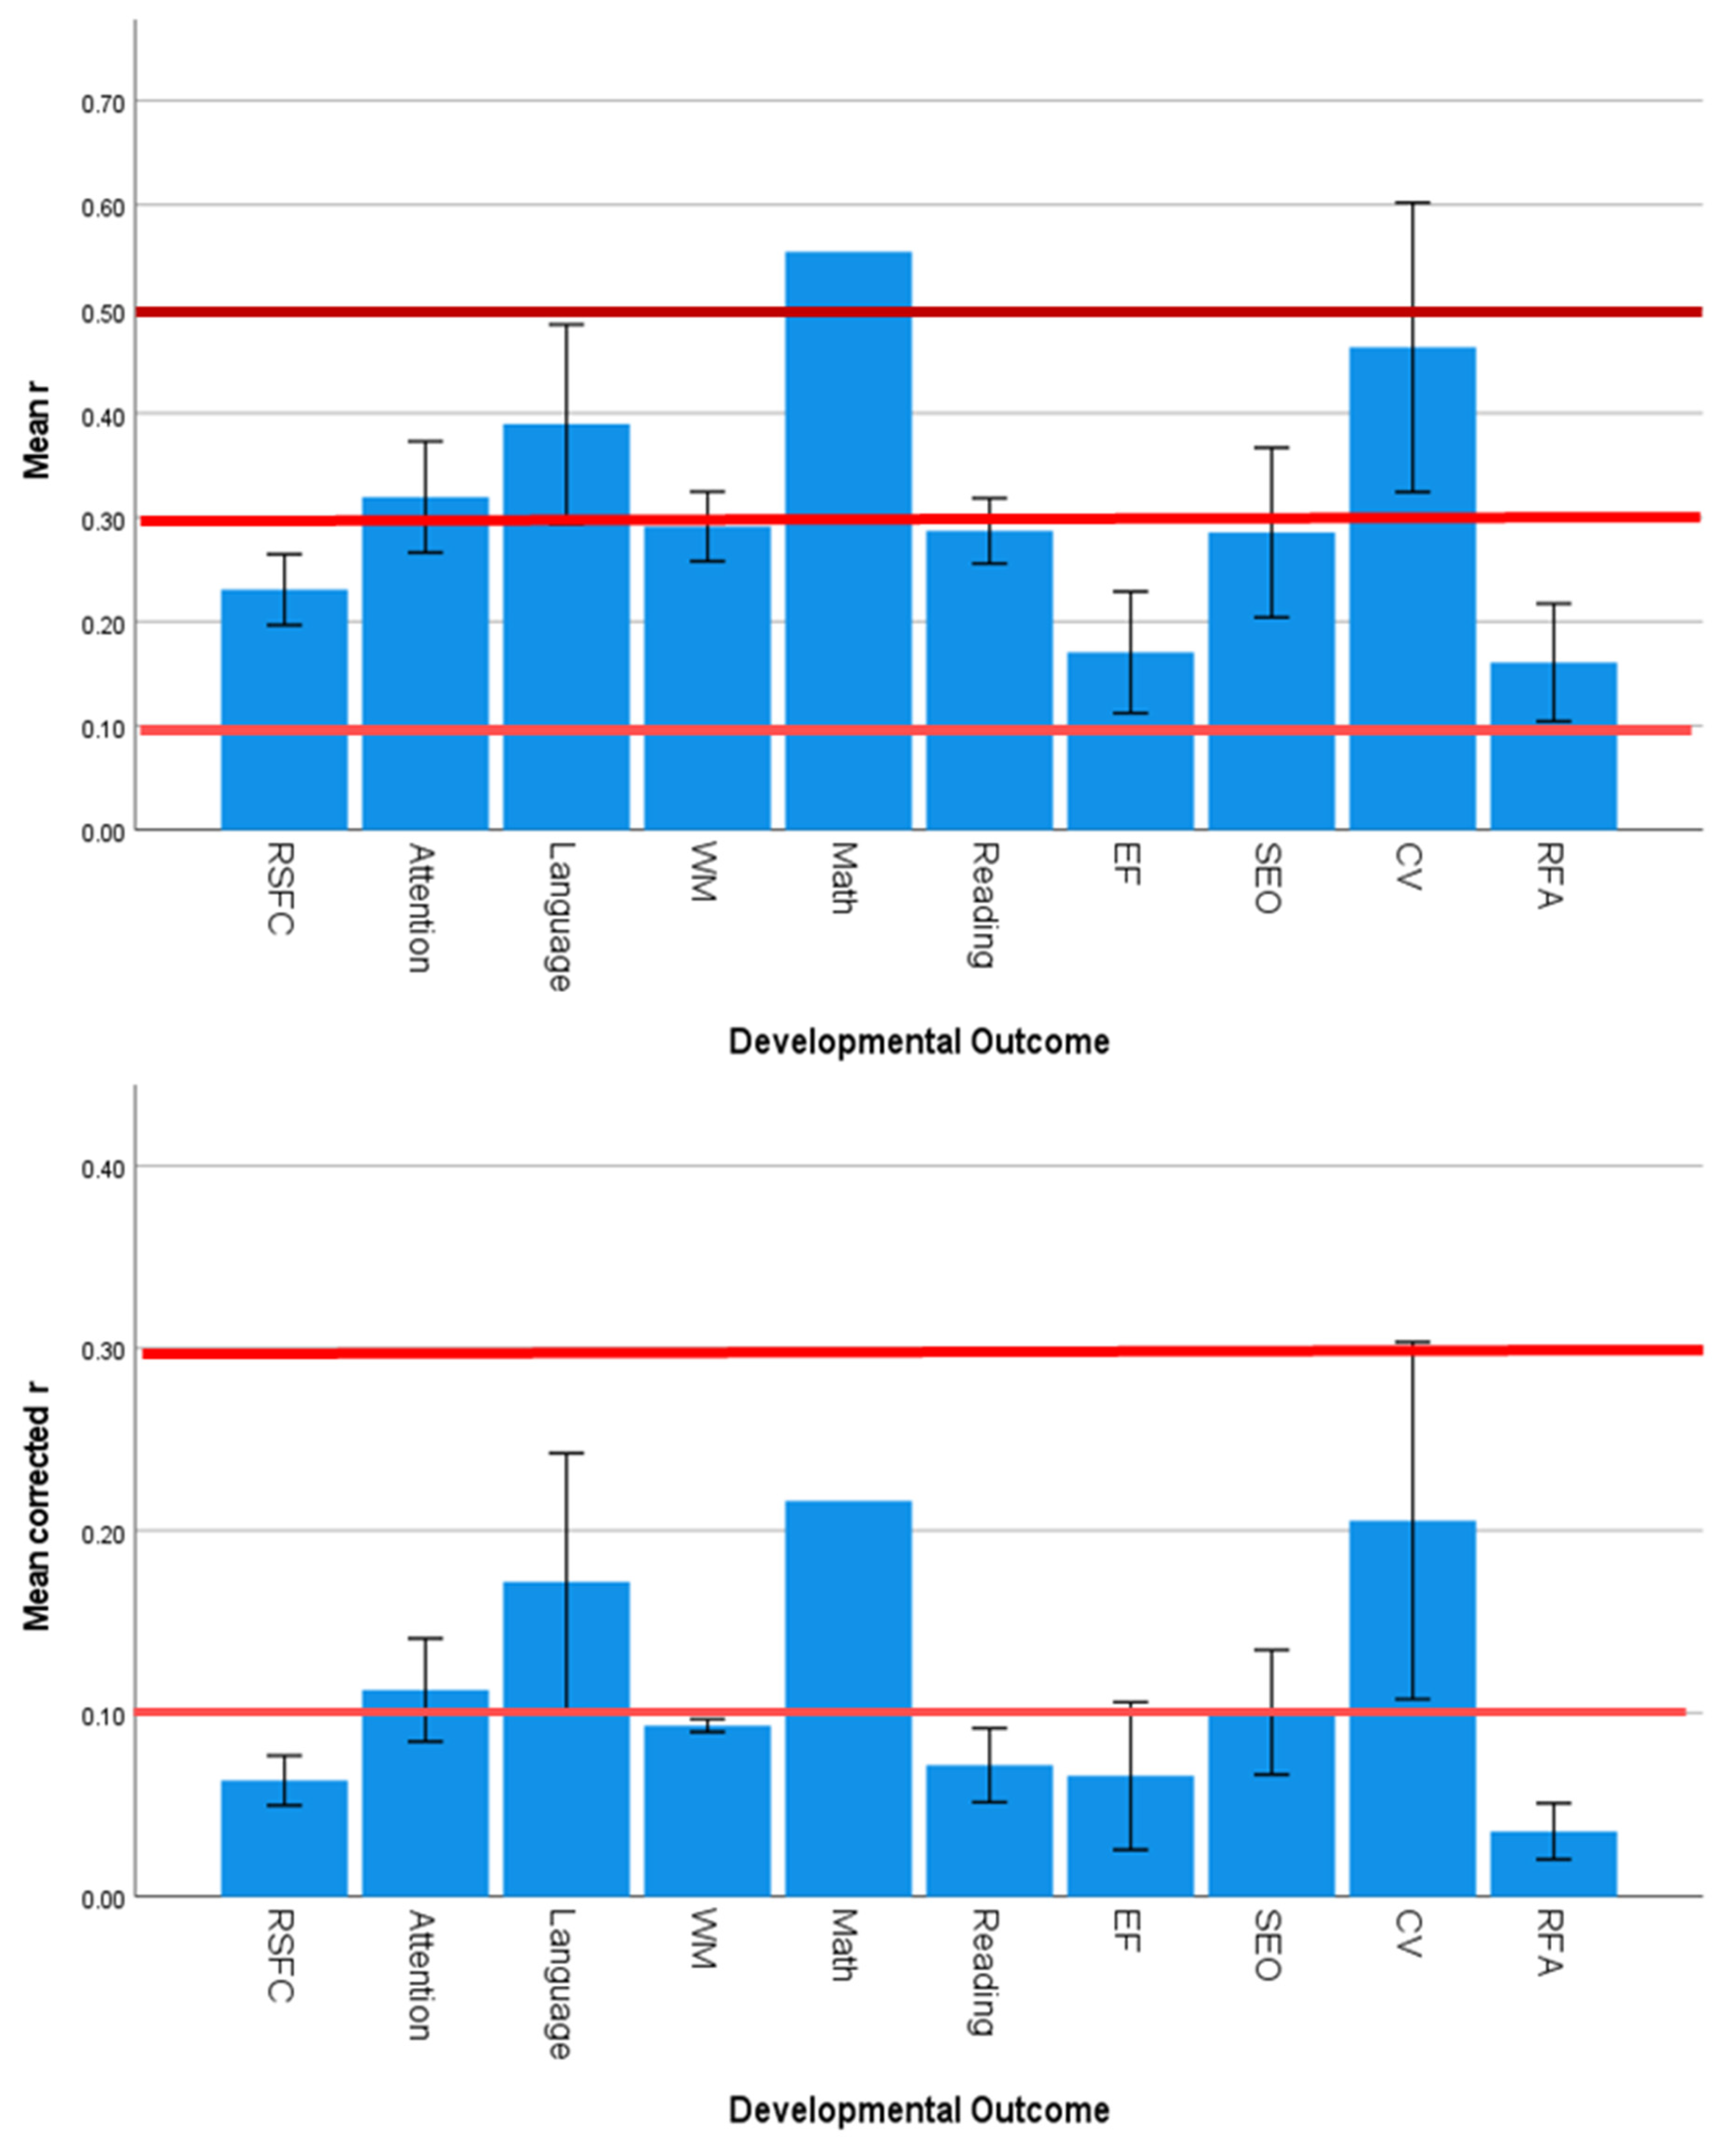
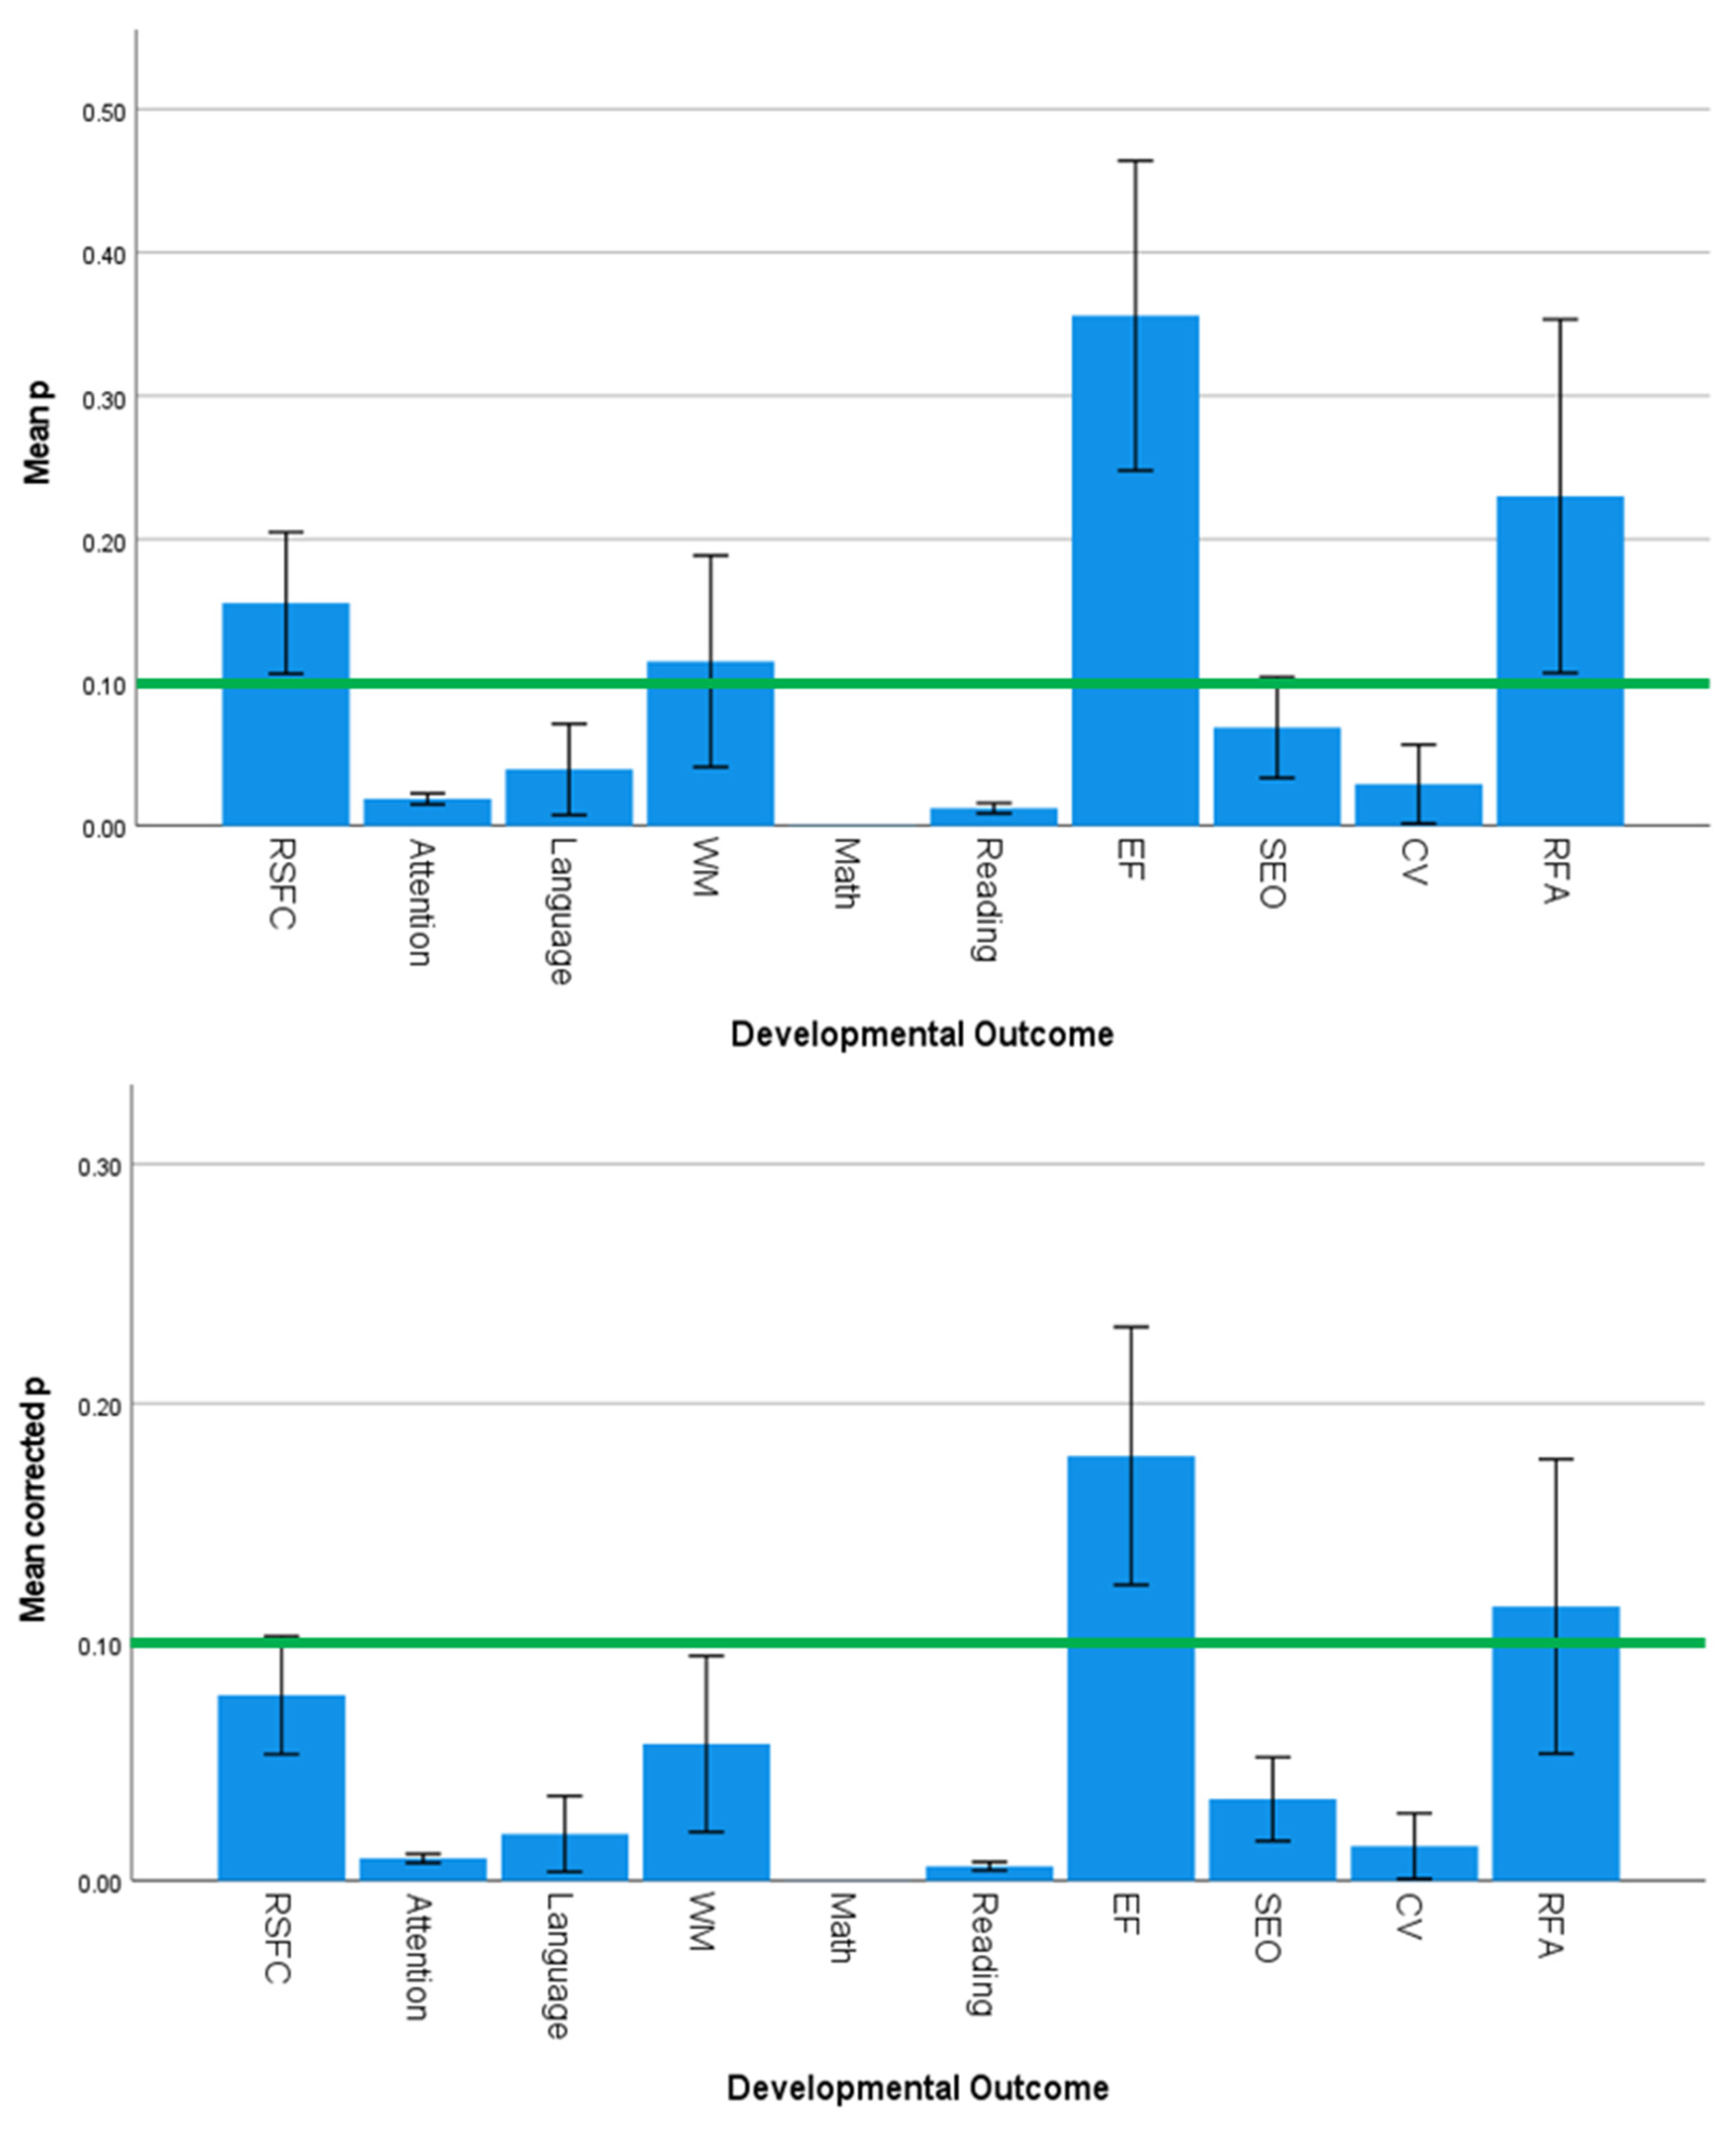
3.5. Effect Sizes and Significance Levels Vary by Developmental Outcome

Developmental outcomes in the analysis included the following functional imaging outcomes: resting state functional connectivity (21 studies), cortical volumes (three studies), and regional functional activity (five studies). It also included the following behavioral outcomes, most of which yielded overlapping effect sizes: attention (eight studies), language (six studies), working memory (five studies), math (one study), reading (four studies), executive function (ten studies), and socioemotional outcomes (three studies). With regard to absolute mean effect sizes and significance values, the study on math-related outcomes yielded the largest effect, followed by those on cortical volumes. Both outcomes yielded extremely strong effect sizes, followed by the studies on language, of which effect sizes were large, and those investigating attentional, working memory, reading, and socioemotional outcomes yielded intermediate effects. Studies on resting state functional connectivity, executive function, and regional functional activity yielded small effects (Figure 10, top panel). Studies on attention, language, math, reading, and cortical volumes reached significance, whereas those on resting state functional connectivity, working memory, executive function, socioemotional outcomes, and regional functional activity did not (Figure 11, top panel). Though corrected mean effect sizes were smaller overall, the pattern remained, with the studies on math-related outcomes and cortical volumes yielding the largest effect sizes (of intermediate strength) and those on resting state functional connectivity, executive function, and regional functional activity yielding small effects. Corrected mean p-values diminished as well, resulting in all but two outcomes (executive function and regional functional activity) reaching significance. The results of a one-way Bayesian ANOVA (BF = 0.001; Model: F(9,56) = 1.644, p = 0.125) confirmed these patterns by providing extremely strong evidence of statistical heterogeneity in absolute mean effect sizes and anecdotal evidence of statistical heterogeneity in absolute mean p-values (BF = 0.417; Model: F(9,56) = 3.548, p = 0.002) across developmental outcomes. The results of a one-way Bayesian ANOVA on corrected mean effect sizes (BF = 0.001; Model: F(9,56) = 1.687, p = 0.144) and corresponding p-values (BF = 0.470; Model: F(9,56) = 3.590, p = 0.001) yielded similar results.
Results of all one-way Bayesian ANOVAs on absolute and corrected mean effect sizes and significance values are displayed in Table 2 and Table 3.

3.6. Evidence of Implicit Deficit Attribution within the Dataset

The bibliometric key-term co-occurrence map created in Vosviewer is available (see also Shanine Kamgang. (2023). Co-Occurence Keyword Network [Data set] Version 1 28 May 2023. Zenodo. https://doi.org/10.5281/zenodo.7979517). The exported list of keywords displayed on the map consisted of 273 items, 8703 links, and a total link strength of 19231. While the number of links is a direct raw quantitative estimate, the total link strength in a keyword co-occurrence network is a relative indicator of the strength of connections between network keywords, and it is a unitless qualitative measure [59]. Twelve words were evocative of deficit attribution, with a total of 811 links and a total link strength of 1690: [abnormality, behavior problem, cognitive deficit, cognitive impairment, deficit, disorder, impairment, language difficulty, problem, risk, risk factor, and attention problem]. Bracketed words were linked with the following brain development outcomes: IQ, development, cognition, attention, brain, brain structure, brain development, amygdala, behavior, and amplitude. Three words were indicative of interpretations considering ecological and structural factors, with a total of 211 links and a total link strength of 370: [environment, environmental factor, and social inequality]. The “environment” word item was linked to cognition, brain, and development word items.
The quantitative (i.e., number of links) and the qualitative (i.e., link strengths) measures converged in indicating virtually the identical proportional difference relative to totals in the network between terms associated with deficit attribution and terms associated with ecological/structural factors, which was 9% vs. 2%, respectively. The latter difference (7%) is significant when tested relatively to the total network size associated with quantitative (χ2(1) = 3.88, p = 0.049; −0.0041% to 0.1600%) and qualitative (χ2(1) = 8.57, p = 0.003; 95% CI: 0.0234% to 0.1249%) metrics. These results suggest that in the body of literature we examined, there seems to be a significantly more frequent use of explanatory terms related to individual children’s deficits than terms related to situational and contextual factors.

4. Discussion

We found evidence (ranging in strength, anecdotal to extreme) of statistical heterogeneity in the strength and significance of the differential effects of SES across countries, national income levels, continents, developmental outcomes, and neuroimaging techniques.

4.1. General Summary of Results

In this meta-analytic review, we used a variety of methods for data analysis purposes. First, a range of Bayesian statistical procedures produced the findings listed above, which provide evidence to suggest that the strength and significance of the effects of SES on brain development outcomes vary by country and continental regions, with Europe yielding the largest, non-overlapping effect sizes and being one of two continents with findings reaching significance when considering corrected p-values (as per the standards of this study). Such results are consistent with our hypothesis, positing that it is unlikely that socioeconomic factors affect child populations all over the world in the same manner. Moreover, we found statistical evidence to support the hypothesis that the strength and significance of effects of SES effect vary as a function of country income level. Importantly, our data suggest that children’s performances in behavioral tasks may not differ as a function of SES, as the Bayesian procedure found no significant differences between studies that yielded significant differential SES effects and those that did not. When comparing effect sizes between neuroimaging techniques and developmental outcomes, we found significant differences therein, with studies combining fMRI and MRI in their data collection protocol producing the largest effect sizes as well as being the only ones to reach significance and attention, language, math, reading and cortical volume outcomes yielding the strongest effects (intermediate to large effects) and being the only developmental outcomes with mean effect sizes to reach significance.

4.2. Regional Geographic Differences in SES Effects on Health Outcomes

Research on the social determinants of health has determined that SES effects on health outcomes are likely to be highly context-dependent in that there may be large regional variations in the relationships between socioeconomic factors and health outcomes [62,63]. For example, in an investigation of the variation in SES (operationalized as wealth) effects on health outcomes in rural and urban populations in Kenya, Lea et al. [64] found that high socioeconomic status was associated with better self-reported health outcomes in nomadic groups living in rural environments but associated with poor cardiometabolic health in groups living in urban settings, thus demonstrating how regional circumstances can alter the typical SES-Health connection. To effectively resolve global health inequities brought about by socioeconomic disparities, it is important to identify and understand such circumstances and to do so not only at the national income level but also at the continental levels. Then, a rational approach should be to follow up by elaborating customized intervention policies. However, most of the research on SES and health is conducted in high-income countries in the global Western regions [62,63,64], as exemplified by our database, in which more than 75% of the literature was published in the global West. It seems unsuitable to apply policies informed by region-specific findings on a global scale, given that SES-Health mediating environmental factors differ on various levels, including those most relevant for this paper, the geographical and economic levels. Our analysis provided evidence of heterogeneity in SES effect sizes and significance across continents and income levels, which suggests that SES effects differ across those variables. Indeed, we found that effect sizes reached significance in lower-middle- and high-income countries but failed to do so in upper-middle income countries. In lower-income countries, where much of the population lives under the international poverty line, health inequities are brought about by different factors than those associated with health inequalities observed in high-income countries [62]. In the former, such inequities are likely to be brought about by absolute poverty, resulting in a lack of access to resources to satisfy basic needs [62] and an inability to deliver basic healthcare services to the population [63]. Such differences in circumstance highlight the need for region-specific intervention programs and policies, which must be informed with reliable data. Unfortunately, there seems to be a limited amount of empirical data on socioeconomic status and health outcomes from populations in non-Western low-income regions, especially when it comes to neuroimaging data on child subpopulations. We believe that it is possible to reliably conduct neuroimaging studies on children in low-income regions using non-invasive, cost-effective neuroimaging equipment such as wireless, portable EEG, and functional Near-Infrared Spectroscopy (fNIRS) equipment. Collecting reliable empirical data will help to better inform and conceive region-specific interventions and policies, which will contribute to improving health outcomes for those in need, in line with UNICEF’s sustainable development goals.

4.3. Specificity of SES Effects on Developmental Outcomes

Several reviews of neuroimaging and SES studies have reported consistent SES disparities in grey matter volume and thickness in frontal and subcortical regions [65,66], language, and executive function outcomes [65,66,67]. These trends are mostly reflected in our data in that the effect sizes of SES on language and cortical volumes are two of the largest, and both fall below the significance threshold. Conversely, the mean effect size of SES on executive function was not only one of the smallest in the dataset but also failed to reach significance, thereby contradicting the previously reported trends. It is important to note that working memory, an important subset of executive function, was treated as its own outcome, which could have taken some weight from the executive function item. However, even when working memory was indexed under executive function, the mean effect size only marginally increased and, nonetheless, failed to reach significance. Research on SES and executive function have generated conflicting results [68], with some studies finding larger SES disparities in executive function compared to other childhood cognition outcomes [32,69,70] and others failing to find SES-related differences at all [34,71,72]. In a meta-analysis on SES and executive function performance in children, Lawson et al. reported a small but significant correlation between SES and executive function across 25 independent samples [68], much like the effect size reported in this analysis, though ours did not reach significance. In sum, the statistical heterogeneity of mean effect sizes and significance of SES on the developmental brain and cognition outcomes included in this study show that the magnitude of the impact of SES varies across imaging and behavioral developmental outcomes. Moreover, there may even be a variety of SES-related effects within the same outcome, as some studies report significant effects while others report null effects. It is possible that heterogeneity and inconsistencies reflect at least in part the fact that different measures have discrepant statistical sensitivity (i.e., statistical power or 1 − β) and statistical specificity (i.e., correct Null Hypothesis retention or 1 − α). Therefore, given the inconsistency of the findings in the literature, it is even more important to determine whether, and if so, when (in which contexts) the effects of SES are detrimental and to critically assess underlying assumptions of deficits.

4.4. SES-Related Differences in Brain Activation Do Not Necessarily Predict Behavioral Performance

In addition to statistical heterogeneity in the strength of main SES-related differential effects, we found that 35% of the papers in our dataset did not find significant main effects of SES on brain-related outcomes in children. Of the 23 papers that included data on children’s behavioral cognitive performance concurrent to neuroimaging tasks, half of these papers found significant direct effects of SES on neuroimaging outcomes, whereas the other half did not. When testing for independence between the two groups in relation to task performance, we found no evidence of a significant difference, thereby suggesting that, in our dataset, children’s behavioral performance on cognitive tasks does not differ as a function of SES parameters. From a broader perspective, our data imply that differences in brain activation and/or structure do not necessarily give rise to “inferior” behavioral task performances. it is possible for children from low-SES environments to perform just as well as children from high-SES environments, and SES-related differences in brain activity found by a large portion of our dataset could be indicative of adaptative and/or compensatory mechanisms in neural circuitry, and should therefore be interpreted as such. In a study investigating SES-related differences in connectivity between the lateral frontoparietal network (LFPN), largely activated during higher-level cognitive tasks, and the Default Mode Network (DMN), active during rest and deactivated during focused-attention tasks, Ellwood-Lowe et al. [73] found that although children from low-income households had lower average performance on cognitive tasks compared to their high-income counterparts, there was a high degree of variability within the low-SES group, with many low-SES children achieving test scores that were just as high as the children from the high-income group. Most importantly, the typical association between inverse LFPN-DMN correlations and cognitive task prowess was only present in the high-income group; such a correlation was not significant in the low-income group. In other words, higher functional connectivity between the DMN and LFPN was favorable to a better cognitive task performance for children in the low-income group but was associated with lower cognitive task performance for children in the high-income group. A similar pattern of fMRI results was reported in relation to mathematical performance and related verbal and visuo-spatial skills by Demir, Prado, and Booth [74,75]. These findings suggest children from low-income environments show distinct neural patterns when performing cognitive tasks, which could reflect cognitive adaptation to the relevant conditions in their environment [7,27].
Ellwood-Lowe’s study exemplifies the evolutionary–developmental model in studying SES-related differences, a model mainly assuming that childhood adversity may not always impair child cognition but rather alters certain cognitive processes and fosters developmental adaptation to ecologically relevant conditions [76,77,78]. Such cognitive “enhancements” may only be manifested in unpredictable circumstances mirroring those found in real-life high-stress environments [79], hence why they are often undetected in experimental settings. Under the evolutionary–developmental framework, there have been numerous findings providing evidence of “hidden talents” in children and adults having experienced childhood adversity, including enhanced working memory task performance by parentally deprived children in Nigeria [80], better performance at shifting in executive functioning tasks [78], and better working memory updating performance in unpredictability conditions for subjects having experienced childhood uncertainty compared to those with predictable childhood environments [81]. While these studies are not investigating the effects of primary parameters of SES, they do provide insights into the ways in which childhood adversity, of which childhood poverty is a component, can induce unique strengths meant to support individuals in adapting to their environment.
The evolutionary–developmental model is not the only “adaptationist” perspective. An alternative theoretical approach is a neuro-epigenetic adaptationist framework, the bifurcated developmental trajectory model (BiDeT) [82]. This model intends to be an account of the external and internal set of specific variables, as well as mechanisms and dynamical relationships between them, associated with low SES that may lead to difficulties with attention and cognition, along with buffers that may protect those processes against negative outcomes. In particular, a consistent neurocognitive finding is that low-SES children attend to information non-selectively and engage in late filtering of task-irrelevant information [7,27]. Attentional preferences influence the development of latent inhibition (LI), an aspect of learning, memory, and cognition that involves reassigning meaningful associations to previously learned but irrelevant stimuli [82]. LI reflects learning processes clarifying the relationship between neurobiological mechanisms related to attention and socioeconomic disadvantage during child development [82]. Notably, changes in both selective attention and typical LI development may occur via the mesocorticolimbic dopamine (MsCL-DA) system [82]. Chaotic environments, social isolation, and deprivation associated with low SES trigger stress responses implicating imbalances in the MsCL-DA and consolidating anxiety traits [82]. BiDeT describes the plausible interactions between socioemotional traits and low-SES environments that modify selective attention and LI, predisposing individuals to vulnerability in cognitive development and academic achievement. However, positive role models, parental style, and self-regulation training are counteracting protective factors and promoters of resilience [82].

4.5. Implicit Deficit Attribution and Neuroethical Considerations

In contrast to the developmental adaptationist models mentioned in the previous section, deficit models of child development largely interpret brain activation and task performance differences associated with low SES, poverty, and early life stress as maladaptive and deficient [50,82,83,84]. A bibliometric analysis of documents included in our meta-analysis quantified instances of deficit attribution in relation to interpretations considering ecological and structural factors. Indeed, there were significantly more word items indicative of deficit-style interpretations, and they had more links, not only to brain development word items, but also to other items within the network, and a higher total link strength. Such results suggest that SES-related differences in those brain development outcomes are interpreted as deficits, as opposed to differences arising from structural environmental circumstances. The issue of the interpretation of SES-, ethnicity-, and culture-related variations as impairments arises when individuals are held to standards derived from groups to which they do not belong [84]. Under the deficit view, deviations from the norm are deemed as signs of inadequacy and require intervention and prevention [84,85]. Indeed, the term “risk”, a prominent word item in our bibliometric network, is generally associated with the perception of differences from the norm as dysfunction [42,43,50,82,83,84]. Such norms are most often derived from middle- to upper-class groups and, therefore, should not be used to assess developmental outcomes in children in and/or from less affluent communities, because of the limited sensitivity with which they reflect cognitive competencies [85,86]. Those standards include standardized psychometric tests used to measure academic achievement and/or cognitive functioning in experimental settings. For example, the Wechsler Intelligence Scale for Children (WISC), a widely used assessment tool used to measure intellect in children (which was a featured word item in our bibliometric network) has been said to overrepresent knowledge that would only be familiar or known with confidence by middle-class children [45,46,47]. As a result, class-related differences in WISC performance would be not indicative of variation in cognitive ability but rather variation in exposure to specific information [87,88,89,90,91].
While we do not seek to undermine the large body of evidence for the ways in which poverty and low SES can destabilize brain and cognition development, we do find it important to evaluate how such findings are interpreted, as the resulting implications for children are paramount in terms of education, healthcare, and even the general perception of children reared in poverty and/or low-SES environments. Most often, the interpretations of findings under deficit models fail to consider the unique adaptive strengths developed by individuals reared in high-stress environments [79,82], as they treat low-SES groups as a monolith in their experimental design and thereby fail to account for the large variability within low-SES child populations. Such considerations are important to make because they can provide valuable insight into the different neural and cognitive mechanisms of learning, memory, decision-making, and other brain development outcomes [7,27,79,82], and they can promote the accurate interpretation and careful communication of findings, which can contribute to reducing the stigmatization of differences as deficits, to identifying the resilience mechanisms in high-performing children in low-SES groups and, overall, to present a perspective that is more empowering and inclusive for people living in low-income environments across the globe.
This analysis enables us to draw two key conclusions: first, the effects of SES on neurocognition found in the existing literature should not be globally generalized, given that a large proportion (85%) of the data available for this study were generated in high-income Western countries with predominantly white populations. The under-representation of non-Western countries [40] suggests that the results may be biased as sufficient consideration for cultural and racial differences in the literature is lacking. Thus, in light of this inherent limitation in the literature itself, our study highlights the limitations of making broad generalizations solely from the findings of meta-analyses. Even so, and secondly, our study shows an intrinsic heterogeneity even within regions and countries, which not only limits generalizations at the global level but also at the local level. As we already pointed out, there is little evidential basis to conclude that SES is consistently predictive of neurocognitive differences that could be applied as a foundation for developmental normativity across different communities, and considerations are often void of structural factors associated with the specific regional contexts.

5. Limitations and Considerations

Papers were mostly screened individually at both the title and abstract and full-text screening phases. Compared to the conventional double-screening methods, individual screening has been associated with more errors, specifically a higher likelihood of missing studies [92]. We made efforts to mitigate this risk by collectively elaborating clear inclusion and exclusion criteria and by conducting a collaborative sample screening, during which we achieved high agreement and perfect reliability, as determined using Krippendorf’s alpha.
It is important to note that our search did not produce any neuroimaging studies on children in Africa that were relevant to the purposes of our paper, which could be indicative of a lack of neuroimaging research conducted in the region or a limitation in our search strategy. Either way, we are unable to draw any conclusions about the strength of SES-related main effects in African regions from our data. However, our results provided significant evidence of statistical heterogeneity of the main effects of SES across European, South Asian, and North and South American regions. It is unlikely that the inclusion of African child neuroimaging data would have occluded this trend.
One of the major objectives of this study was to quantify the isolable effects of SES in such a way as to exclude “non-circumstantial” (genetics, race, gender, etc.) risk. Consequently, our analysis did not account for possible transnational differences in ethnic diversity. A separate ongoing project in our lab is currently assessing how this aspect may be appropriately quantified and how it may influence the validity and reproducibility of meta-analysis findings from the available literature. Nevertheless, the possible limitation in the literature may be due to the severe lack of neuroimaging data from low- to middle-income countries, in that it may be assumed the latter countries might have a greater diversity of ethnicities in their populations. However, the inclusion of such a confounding variable would diminish the strength of the effects due to SES, reducing them even further. Consequently, overcoming the under-representation in the literature would further strengthen and reaffirm our findings, not weaken them.
Though a portion of the analysis focused on the various developmental outcomes and neuroimaging techniques reported in the studies included in the meta-analysis and on distinguishing neuroimaging data from non-imaging (cognitive and behavioral) data to determine whether differences in the former predict differences in the latter, there was a lack of consideration of the variety of developmental cognition assessment tools used to measure and quantify behavioral and cognitive abilities evaluated in this study. Therefore, it is important to consider differences in the sensitivity and specificity of their respective measurements when it comes to measuring the degree of SES-related differences. We discuss sensitivity and specificity as they refer to the corresponding statistical concepts of power and correct H0 retention in hypothesis testing (as briefly mentioned earlier). Here, the important difference with the clinical diagnostic or screening use of these two notions is that in the present context, we cannot define the detection or lack thereof, between-SES group differences in terms of the presence or absence of disease. This would contradict our own arguments about implicit deficit attribution.
Keeping the previous technical caveat in mind, our findings did show that within developmental outcomes, achievement-related outcomes such as language and math showed the largest effect sizes. Standardized tests fail to account for cultural and class differences in manifestations of cognitive abilities, as they are often derived from middle to upper-class groups but are applied to low-income groups in developmental research as well. As a result, these tests lack specificity because they measure exposure to types of information and shared knowledge [83,93] as opposed to true cognitive competencies. Indeed, many of these assessment tools rely on literary and numerical representations of knowledge, which are often culturally specific [93], thereby rendering such tests culturally relative and diminishing the degree of sensitivity and specificity when applied to “non-standard” populations [94]. In this manner, standardized neuropsychological tests are often prone to construct and method biases. Construct bias can occur when the construct under investigation differs across cultures [95] or even when the situations in which specific cognitive processes are elicited differ across cultures [96], best exemplified by cultural differences in performance on tests assessing universal cognitive processes such as visual processing or memory. Method bias is characterized by issues in test sampling, instrument, and administration, in which samples differ significantly across non-target variables when there are cultural variations in stimuli familiarity or response styles and procedures and when there are difficulties in administering the tests due to communication issues [97]. For example, the application of Western-normed cognitive tests in sub-Saharan African regions has been questioned due to difficulties in replicating the controlled experimental conditions and the lack of consideration of dimensional perception differences across cultures [98], both of which are examples of method bias. The use of two-dimensional stimuli in cognitive assessment tools is deemed culturally inappropriate for application in rural sub-Saharan regions because such stimuli are uncommon in those environments [98], resulting in tests lacking in specificity and sensitivity and producing biased results [98]. Overall, cognitive assessment tools that are normed to Western, middle- and upper-class groups tend to capture the cognitive abilities of the aforementioned populations but are neither sensitive nor specific in the measurement of the cognitive competencies of children beyond those groups, and may lead to biased and invalid interpretations of their abilities [99]. Therefore, it is important to customize assessment tools to the population under investigation in order to create measures that are adequately sensitive and specific to the assessment of children in low-income and/or non-Western communities.
An additional interesting observation in our results is that imaging functional outcomes should supposedly be more reliable (i.e., precise) than behavioral measures. However, at least considering the comparison of the effect sizes across measures, such a conclusion does not seem to be warranted.
Another important consideration to be made concerns the unreported insignificant effects, the “file drawer problem” [100]. Many studies within our dataset did not report statistical parameters or significance values associated with non-significant results, which suggests that non-significant main (null) effects of SES and poverty are under-reported in our analysis. However, this means that including such effects in our analysis would only have provided further support for the conclusion that the strength of the direct main effects of SES on children’s neuroimaging outcomes is inflated in the literature, and interpretations linked with it grossly exaggerate the weight of this relationship.

6. Conclusions

In this meta-analytic review, we used a combination of Bayesian hypothesis testing and bibliometric analysis methods to determine the strength and significance of regional SES- and poverty-related effects on brain and cognition developmental outcomes and whether they are consistently adverse and to evaluate the framework by which these findings are interpreted. We found that effect sizes ranged from small to large across countries, country income levels, and continental regions, which emphasizes the necessity of interventions and policies informed by region-specific empirical data. The main effects of SES generated in one country should not be generalized to children in other countries, and if experimental methods incorporated the use of standardized tests, it cannot even be generalized to children of different SES within the same country, as it has been found that such standardized tests do not account for environmental and circumstantial differences between low- and high-SES children. We also found that differences in brain activity did not necessarily translate to substandard behavioral performances in tasks assessing cognitive ability, suggesting that the distinct neural activation patterns shown by children from low-SES settings may be the result of adaptation to their unique environmental circumstances. Lastly, we identified deficit terminology within the literature, showing that at least some of the findings were explained under a deficit view. We discussed the neuroethical implications of such interpretations and concluded by advocating for an interpretative framework that is more inclusive and holistic, and considers critically deficit attributions to groups.

7. Future Directions

It is important to conduct more developmental neuroimaging research in low-income and non-Western regions, not only to better inform intervention policies and programs but also to create a broader picture of environmental influences on brain and cognition development and elucidate the variability within low-SES child populations. In doing so, researchers should avoid employing exclusionary standardized measures of cognitive ability and should instead opt for ecologically sound methods as well as strength-based approaches to accurately identify the true competencies and mechanisms of resilience in children from socioeconomically disadvantaged communities and regions. Moreover, it is time for researchers to abandon the deficit view when it comes to interpreting neuroimaging data, as SES-related differences in brain activity are not always indicative of impairments. Taking these steps would contribute to the efforts in reaching UNICEF’s Sustainable Development Goals by reducing social inequality brought about by deficit thinking and improving educational outcomes for children living in poverty and/or in low-income environments.

Author Contributions

Conceptualization, A.D.; methodology, A.D. and S.K.; validation, S.K., A.M. and M.L.; formal analysis, A.D. and S.K.; investigation, A.D., S.K., A.M. and M.L.; resources, A.D.; data curation, S.K.; writing—original draft preparation, S.K. and A.D.; writing—review and editing, A.D.; visualization, S.K.; supervision, A.D. All authors have read and agreed to the published version of the manuscript.

Funding

This research received no external funding.

Institutional Review Board Statement

Not applicable.

Informed Consent Statement

Not applicable.

Data Availability Statement

Data are available upon request from authors in accordance with proper intellectual property use.

Acknowledgments

Special thanks to Kylie Schibli, Seema Biswas, Stefanie Haustein, Anton Boudreau Ninkov, and Gerry Leisman. We thank two anonymous reviewers for providing comments which greatly helped us improve our manuscript.

Conflicts of Interest

The authors declare no conflict of interest.

References

  1. UNICEF. UNICEF’s Commitment to Ending Child Poverty and Achieving the SDGs: Measurement, Advocacy and Evidence Based Policies; UNICEF: New York, NY, USA, 2022; Available online: https://tinyurl.com/4n7n83y9 (accessed on 23 June 2023).
  2. The World Bank. Understanding Poverty; The World Bank Group: Washington, DC, USA, 2022; Available online: https://www.worldbank.org/en/topic/poverty/overview (accessed on 23 June 2023).
  3. Stringhini, S.; Carmeli, C.; Jokela, M.; Avendaño, M.; Muennig, P.; Guida, F.; Ricceri, F.; d’Errico, A.; Barros, H.; LIFEPATH Consortium; et al. Socioeconomic status and the 25 × 25 risk factors as determinants of premature mortality: A multicohort study and meta-analysis of 1·7 million men and women. Lancet 2017, 389, 1229–1237. [Google Scholar] [CrossRef] [PubMed]
  4. Pollak, S.; Wolfe, B. How developmental neuroscience can help address the problem of child poverty. Dev. Psychopathol. 2020, 32, 1640–1656. [Google Scholar] [CrossRef] [PubMed]
  5. Raizada, R.D.; Richards, T.L.; Meltzoff, A.; Kuhl, P.K. Socioeconomic status predicts hemispheric specialisation of the left inferior frontal gyrus in young children. Neuroimage 2008, 40, 1392–1401. [Google Scholar] [CrossRef]
  6. Wang, J.; Lytle, M.N.; Weiss, Y.; Yamasaki, B.L.; Booth, J.R. A longitudinal neuroimaging dataset on language processing in children ages 5, 7, and 9 years old. Sci. Data 2022, 9, 4. [Google Scholar] [CrossRef] [PubMed]
  7. D’Angiulli, A.; Herdman, A.; Stapells, D.; Hertzman, C. Children’s event-related potentials of auditory selective attention vary with their socioeconomic status. Neuropsychology 2008, 22, 293. [Google Scholar] [CrossRef] [PubMed]
  8. Brito, N.H.; Noble, K.G. Socioeconomic status and structural brain development. Front. Neurosci. 2014, 8, 276. [Google Scholar] [CrossRef] [PubMed]
  9. Tomasi, D.; Volkow, N.D. Associations of family income with cognition and brain structure in USA children: Prevention implications. Mol. Psychiatry 2021, 26, 6619–6629. [Google Scholar] [CrossRef]
  10. McDermott, C.L.; Seidlitz, J.; Nadig, A.; Liu, S.; Clasen, L.S.; Blumenthal, J.D.; Reardon, P.K.; Lalonde, F.; Greenstein, D.; Patel, R.; et al. Longitudinally mapping childhood socioeconomic status associations with cortical and subcortical morphology. J. Neurosci. 2019, 39, 1365–1373. [Google Scholar] [CrossRef] [PubMed]
  11. Duncan, G.J.; Magnuson, K. Socioeconomic status and cognitive functioning: Moving from correlation to causation. Wiley Interdiscip. Rev. Cogn. Sci. 2012, 3, 377–386. [Google Scholar] [CrossRef]
  12. Li, M.; Lindenmuth, M.; Tarnai, K.; Lee, J.; King-Casas, B.; Kim-Spoon, J.; Deater-Deckard, K. Development of cognitive control during adolescence: The integrative effects of family socioeconomic status and parenting behaviors. Dev. Cogn. Neurosci. 2022, 57, 101139. [Google Scholar] [CrossRef]
  13. Olson, L.; Chen, B.; Fishman, I. Neural correlates of socioeconomic status in early childhood: A systematic review of the literature. Child Neuropsychol. 2021, 27, 390–423. [Google Scholar] [CrossRef] [PubMed]
  14. Gianaros, P.J.; Kuan, D.C.; Marsland, A.L.; Sheu, L.K.; Hackman, D.A.; Miller, K.G.; Manuck, S.B. Community Socioeconomic Disadvantage in Midlife Relates to Cortical Morphology via Neuroendocrine and Cardiometabolic Pathways. Cereb. Cortex 2017, 27, 460–473. [Google Scholar] [CrossRef]
  15. Yang, J.; Liu, H.; Wei, D.; Liu, W.; Meng, J.; Wang, K.; Hao, L.; Qiu, J. Regional gray matter volume mediates the relationship between family socioeconomic status and depression-related trait in a young healthy sample. Cogn. Affect. Behav. Neurosci. 2016, 16, 51–62. [Google Scholar] [CrossRef] [PubMed]
  16. Yaple, Z.A.; Yu, R. Functional and Structural Brain Correlates of Socioeconomic Status. Cereb. Cortex 2020, 30, 181–196. [Google Scholar] [CrossRef] [PubMed]
  17. Tomalski, P.; Moore, D.G.; Ribeiro, H.; Axelsson, E.L.; Murphy, E.; Karmiloff-Smith, A.; Johnson, M.H.; Kushnerenko, E. Socioeconomic status and functional brain development—Associations in early infancy. Dev. Sci. 2013, 16, 676–687. [Google Scholar] [CrossRef]
  18. Ramphal, B.; Whalen, D.J.; Kenley, J.K.; Yu, Q.; Smyser, C.D.; Rogers, C.E.; Sylvester, C.M. Brain connectivity and socioeconomic status at birth and externalizing symptoms at age 2 years. Dev. Cogn. Neurosci. 2020, 45, 100811. [Google Scholar] [CrossRef] [PubMed]
  19. Tooley, U.A.; Mackey, A.P.; Ciric, R.; Ruparel, K.; Moore, T.M.; Gur, R.C.; Gur, R.E.; Satterthwaite, T.D.; Bassett, D.S. Associations between Neighborhood SES and Functional Brain Network Development. Cereb. Cortex 2020, 30, 1–19. [Google Scholar] [CrossRef] [PubMed]
  20. Ding, K.; Li, C.; Li, Y.; Wang, H.; Yu, D. The Effect of Socioeconomic Disparities on Prefrontal Activation in Initiating Joint Attention: A Functional Near-Infrared Spectroscopy Evidence from Two Socioeconomic Status Groups. Front. Hum. Neurosci. 2021, 15, 741872. [Google Scholar] [CrossRef]
  21. Moriguchi, Y.; Shinohara, I. Socioeconomic disparity in prefrontal development during early childhood. Sci. Rep. 2019, 9, 2585. [Google Scholar] [CrossRef]
  22. Burgess, A.; Hernandez, S.M.; Li, X.; Bick, J.; Pollonini, L. Correlation between socioeconomic disadvantage in preschool children and brain organization: A functional NIRS connectivity study. In Optics and the Brain; Optica Publishing Group: Washington, DC, USA, 2021; p. BW4B-5. [Google Scholar]
  23. Louis, E.K.S.; Frey, L.C.; Britton, J.W.; Hopp, J.L.; Korb, P.; Koubeissi, M.Z.; Lievens, W.E.; Pestana-Knight, E.M. Electroencephalography (EEG): An Introductory Text and Atlas of Normal and Abnormal Findings in Adults, Children, and Infants; American Epilepsy Society: Chicago, IL, USA, 2016. [Google Scholar]
  24. Maguire, M.J.; Schneider, J.M. Socioeconomic status related differences in resting state EEG activity correspond to differences in vocabulary and working memory in grade school. Brain Cogn. 2019, 137, 103619. [Google Scholar] [CrossRef]
  25. Brito, N.H.; Fifer, W.P.; Myers, M.M.; Elliott, A.J.; Noble, K.G. Associations among family socioeconomic status, EEG power at birth, and cognitive skills during infancy. Dev. Cogn. Neurosci. 2016, 19, 144–151. [Google Scholar] [CrossRef]
  26. Sur, S.; Sinha, V.K. Event-related potential: An overview. Ind. Psychiatry J. 2009, 18, 70–73. [Google Scholar] [CrossRef] [PubMed]
  27. D’Angiulli, A.; Van Roon, P.M.; Weinberg, J.; Oberlander, T.F.; Grunau, R.E.; Hertzman, C.; Maggi, S. Frontal EEG/ERP correlates of attentional processes, cortisol and motivational states in adolescents from lower and higher socioeconomic status. Front. Hum. Neurosci. 2012, 6, 306. [Google Scholar] [CrossRef]
  28. St. John, A.M.; Finch, K.; Tarullo, A.R. Socioeconomic status and neural processing of a go/no-go task in preschoolers: An assessment of the P3b. Dev. Cogn. Neurosci. 2019, 38, 100677. [Google Scholar] [CrossRef] [PubMed]
  29. Eilertsen, T.; Thorsen, A.L.; Holm, S.E.H.; Bøe, T.; Sørensen, L.; Lundervold, A.J. Parental socioeconomic status and child intellectual functioning in a Norwegian sample. Scand. J. Psychol. 2016, 57, 399–405. [Google Scholar] [CrossRef]
  30. Monzalvo, K.; Fluss, J.; Billard, C.; Dehaene, S.; Dehaene-Lambertz, G. Cortical networks for vision and language in dyslexic and normal children of variable socio-economic status. Neuroimage 2012, 61, 258–274. [Google Scholar] [CrossRef] [PubMed]
  31. Tervo-Clemmens, B.; Simmonds, D.; Calabro, F.J.; Montez, D.F.; Lekht, J.A.; Day, N.L.; Richardson, G.A.; Luna, B. Early cannabis use and neurocognitive risk: A prospective functional neuroimaging study. Biol. Psychiatry Cogn. Neurosci. Neuroimag. 2018, 3, 713–725. [Google Scholar] [CrossRef]
  32. Noble, K.G.; McCandliss, B.D.; Farah, M.J. Socioeconomic gradients predict individual differences in neurocognitive abilities. Dev. Sci. 2007, 10, 464–480. [Google Scholar] [CrossRef]
  33. Benischek, A.; Long, X.; Rohr, C.S.; Bray, S.; Dewey, D.; Lebel, C. Pre-reading language abilities and the brain’s functional reading network in young children. NeuroImage 2020, 217, 116903. [Google Scholar] [CrossRef] [PubMed]
  34. Wiebe, S.A.; Espy, K.A.; Charak, D. Using confirmatory factor analysis to understand executive control in preschool children: I. Latent structure. Dev. Psychol. 2008, 44, 575–587. [Google Scholar] [CrossRef]
  35. Nentwich, M.; Ai, L.; Madsen, J.; Telesford, Q.K.; Haufe, S.; Milham, M.P.; Parra, L.C. Functional connectivity of EEG is subject-specific, associated with phenotype, and different from fMRI. NeuroImage 2020, 218, 117001. [Google Scholar] [CrossRef] [PubMed]
  36. Itahashi, T.; Okada, N.; Ando, S.; Yamasaki, S.; Koshiyama, D.; Morita, K.; Yahata, N.; Koike, S.; Nishida, A.; Kasai, K.; et al. Functional connectomes linking child-parent relationships with psychological problems in adolescence. Neuroimage 2020, 219, 117013. [Google Scholar] [CrossRef]
  37. Biazoli, C.E.; Salum, G.A.; Gadelha, A.; Rebello, K.; Moura, L.M.; Pan, P.M.; Brietzke, E.; Miguel, E.C.; Rohde, L.A.; Bressan, R.A.; et al. Socioeconomic status in children is associated with spontaneous activity in right superior temporal gyrus. Brain Imaging Behav. 2020, 14, 961–970. [Google Scholar] [CrossRef]
  38. Anum, A. Does socio-economic status have different impact on fluid and crystallized abilities? Comparing scores on Raven’s progressive matrices, Kaufman assessment battery for children II story completion and Kilifi naming test among children in Ghana. Front. Psychol. 2022, 13, 880005. [Google Scholar] [CrossRef]
  39. Julius, M.S.; Meir, R.; Shechter-Nissim, Z.; Adi-Japha, E. Children’s ability to learn a motor skill is related to handwriting and reading proficiency. Learn. Individ. Differ. 2016, 51, 265–272. [Google Scholar] [CrossRef]
  40. Bringas-Vega, M.L.; Michel, C.M.; Saxena, S.; White, T.; Valdes-Sosa, P.A. Neuroimaging and global health. NeuroImage 2022, 260, 119458. [Google Scholar] [CrossRef]
  41. Nisbett, R.E. Intelligence and How to Get It: Why Schools and Cultures Count; WW Norton and Company: New York, NY, USA, 2009. [Google Scholar]
  42. Valencia, R.R. Conceptualizing the notion of deficit thinking. In The Evolution of Deficit Thinking; Routledge: Abingdon-on-Thames, UK, 1997; pp. 1–12. [Google Scholar]
  43. Riojas-Cortéz, M. Mexican American Preschoolers Create Stories: Sociodramatic Play in a Dual Language Classroom. Biling. Res. J. 2000, 24, 295–307. [Google Scholar] [CrossRef]
  44. Menchaca, M. Early racist discourses: The roots of deficit thinking. In The Evolution of Deficit Thinking; Routledge: Abingdon-on-Thames, UK, 1997; pp. 13–40. [Google Scholar]
  45. Aikman, S.; Robinson-Pant, A.; McGrath, S.; Jere, C.M.; Cheffy, I.; Themelis, S.; Rogers, A. Challenging deficit discourses in international education and development. Compare 2016, 46, 314–334. [Google Scholar] [CrossRef]
  46. Mampaey, J.; Huisman, J. The reproduction of deficit thinking in times of contestation: The case of higher education. Br. J. Sociol. Educ. 2022, 43, 1233–1249. [Google Scholar] [CrossRef]
  47. Sleeter, C.E. Context-Conscious Portraits and Context-Blind Policy. Anthropol. Educ. Q. 2004, 35, 132–136. [Google Scholar] [CrossRef]
  48. James, C.E.; Turner, T. Towards Race Equity in Education: The Schooling of Black Students in the Greater Toronto Area; York University: York, UK, 2017; Available online: https://edu.yorku.ca/files/2017/04/Towards-Race-Equity-in-Education-April-2017.pdf (accessed on 15 May 2023).
  49. Perera, W.A.H.; Salehuddin, K.; Khairudin, R.; Schaefer, A. The Relationship Between Socioeconomic Status and Scalp Event-Related Potentials: A Systematic Review. Front. Hum. Neurosci. 2021, 15, 601489. [Google Scholar] [CrossRef] [PubMed]
  50. D’Angiulli, A.; Lipina, S.J.; Olesinska, A. Explicit and implicit issues in the developmental cognitive neuroscience of social inequality. Front. Hum. Neurosci. 2012, 6, 254. [Google Scholar] [CrossRef]
  51. Hutton, B.; Salanti, G.; Caldwell, D.M.; Chaimani, A.; Schmid, C.H.; Cameron, C.; Ioannidis, J.P.; Straus, S.; Thorlund, K.; Jansen, J.P.; et al. The PRISMA extension statement for reporting of systematic reviews incorporating network meta-analyses of health care interventions: Checklist and explanations. Ann. Intern. Med. 2015, 162, 777–784. [Google Scholar] [CrossRef]
  52. Jodal, H.C.; Helsingen, L.M.; Anderson, J.C.; Lytvyn, L.; Vandvik, P.O.; Emilsson, L. Colorectal cancer screening with faecal testing, sigmoidoscopy or colonoscopy: A systematic review and network meta-analysis. BMJ Open 2019, 9, e032773. [Google Scholar] [CrossRef] [PubMed]
  53. Page, M.J.; Moher, D.; Bossuyt, P.M.; Boutron, I.; Hoffmann, T.C.; Mulrow, C.D.; Shamseer, L.; Tetzlaff, J.M.; Akl, E.A.; Brennan, S.E.; et al. PRISMA 2020 explanation and elaboration: Updated guidance and exemplars for reporting systematic reviews. BMJ 2021, 372, n160. [Google Scholar] [CrossRef]
  54. Hayes, A.F.; Krippendorff, K. Answering the Call for a Standard Reliability Measure for Coding Data. Commun. Methods Meas. 2007, 1, 77–89. [Google Scholar] [CrossRef]
  55. Krippendorff, K. Content analysis: An introduction to its methodology. In Content Analysis: An Introduction to Its Methodology, 2nd ed.; SAGE Publications: Thousand Oaks, CA, USA, 2004; p. 23. [Google Scholar]
  56. Rosenthal, R. Meta-Analytic Procedures for Social Research, revised ed.; SAGE Publications: Thousand Oaks, CA, USA, 1991. [Google Scholar]
  57. Jeffreys, H. The Theory of Probability, 3rd ed.; Oxford University Press: Oxford, UK, 1961; p. 432. [Google Scholar]
  58. Murphy, K.R.; Myors, B.; Wolach, A. Statistical Power Analysis: A Simple and General Model for Traditional and Modern Hypothesis Tests, 4th ed.; Routledge/Taylor and Francis Group: Cambridge, UK, 2014. [Google Scholar]
  59. Van Eck, N.J.; Waltman, L. Visualizing bibliometric networks. In Measuring Scholarly Impact; Springer: Cham, Switzerland, 2010; pp. 285–320. [Google Scholar]
  60. The World Bank. World Bank Country and Lending Groups; The World Bank Group: Washington, DC, USA, 2022; Available online: https://datahelpdesk.worldbank.org/knowledgebase/articles/906519-world-bank-country-and-lending-groups (accessed on 7 August 2023).
  61. Lenhard, W.; Lenhard, A. Computation of Effect Sizes. Psychometrica. 2016. Available online: https://www.psychometrica.de/effect_size.html (accessed on 26 May 2023).
  62. Eshetu, E.B.; Woldesenbet, S.A. Are there particular social determinants of health for the world’s poorest countries? Afr. Health Sci. 2011, 11, 108–115. [Google Scholar]
  63. Orach, C.G. Health equity: Challenges in low income countries. Afr. Health Sci. 2009, 9 (Suppl. S2), S49–S51. [Google Scholar] [PubMed]
  64. Lea, A.J.; Waigwa, C.; Muhoya, B.; Lotukoi, F.; Peng, J.; Henry, L.P.; Abhyankar, V.; Kamau, J.; Martins, D.; Gurven, M.; et al. Socioeconomic status effects on health vary between rural and urban Turkana. Evol. Med. Public Health 2021, 9, 406–419. [Google Scholar] [CrossRef] [PubMed]
  65. Rakesh, D.; Whittle, S. Socioeconomic status and the developing brain—A systematic review of neuroimaging findings in youth. Neurosci. Biobehav. Rev. 2021, 130, 379–407. [Google Scholar] [CrossRef]
  66. Dennis, E.; Manza, P.; Volkow, N.D. Socioeconomic status, BMI, and brain development in children. Transl. Psychiatry 2022, 12, 33. [Google Scholar] [CrossRef] [PubMed]
  67. Hackman, D.A.; Farah, M.J. Socioeconomic status and the developing brain. Trends Cogn. Sci. 2009, 13, 65–73. [Google Scholar] [CrossRef] [PubMed]
  68. Lawson, G.M.; Hook, C.J.; Farah, M.J. A meta-analysis of the relationship between socioeconomic status and executive function performance among children. Dev. Sci. 2018, 21, 12529. [Google Scholar] [CrossRef] [PubMed]
  69. Farah, M.J.; Shera, D.M.; Savage, J.H.; Betancourt, L.; Giannetta, J.M.; Brodsky, N.L.; Malmud, E.K.; Hurt, H. Childhood poverty: Specific associations with neurocognitive development. Brain Res. 2006, 1110, 166–174. [Google Scholar] [CrossRef]
  70. Noble, K.G.; Norman, M.F.; Farah, M.J. Neurocognitive correlates of socioeconomic status in kindergarten children. Dev. Sci. 2005, 8, 74–87. [Google Scholar] [CrossRef]
  71. Engel, P.M.; Santos, F.H.; Gathercole, S.E. Are working memory measures free of socioeconomic influence? J. Speech Lang. Hear. Res. JSLHR 2008, 51, 1580–1587. [Google Scholar] [CrossRef]
  72. Lupien, S.J.; King, S.; Meaney, M.J.; McEwen, B.S. Can poverty get under your skin? Basal cortisol levels and cognitive function in children from low and high socioeconomic status. Dev. Psychopathol. 2001, 13, 653–676. [Google Scholar] [CrossRef]
  73. Ellwood-Lowe, M.E.; Whitfield-Gabrieli, S.; Bunge, S.A. What is an adaptive pattern of brain network coupling for a child? It depends on their environment. BioRxiv 2020, 12, 7183. [Google Scholar]
  74. Demir, Ö.E.; Prado, J.; Booth, J.R. Parental socioeconomic status and the neural basis of arithmetic: Differential relations to verbal and visuo-spatial representations. Dev. Sci. 2015, 18, 799–814. [Google Scholar] [CrossRef]
  75. Demir-Lira, Ö.E.; Prado, J.; Booth, J.R. Neural correlates of math gains vary depending on parental socioeconomic status (SES). Front. Psychol. 2016, 7, 892. [Google Scholar] [CrossRef]
  76. Frankenhuis, W.E.; de Weerth, C. Does early-life exposure to stress shape or impair cognition? Curr. Dir. Psychol. Sci. 2013, 22, 407–412. [Google Scholar] [CrossRef]
  77. Frankenhuis, W.E.; Nettle, D. The strengths of people in poverty. Curr. Dir. Psychol. Sci. 2020, 29, 16–21. [Google Scholar] [CrossRef]
  78. Mittal, C.; Griskevicius, V.; Simpson, J.A.; Sung, S.; Young, E.S. Cognitive adaptations to stressful environments: When childhood adversity enhances adult executive function. J. Personal. Soc. Psychol. 2015, 109, 604–621. [Google Scholar] [CrossRef]
  79. Ellis, B.J.; Bianchi, J.; Griskevicius, V.; Frankenhuis, W.E. Beyond Risk and Protective Factors: An Adaptation-Based Approach to Resilience. Perspect. Psychol. Sci. 2017, 12, 561–587. [Google Scholar] [CrossRef] [PubMed]
  80. Nweze, T.; Nwoke, M.B.; Nwufo, J.I.; Aniekwu, R.I.; Lange, F. Working for the future: Parentally deprived Nigerian Children have enhanced working memory ability. J. Child Psychol. Psychiatry Allied Discip. 2021, 62, 280–288. [Google Scholar] [CrossRef] [PubMed]
  81. Young, E.S.; Griskevicius, V.; Simpson, J.A.; Waters, T.E.A.; Mittal, C. Can an unpredictable childhood environment enhance working memory? Testing the sensitized-specialization hypothesis. J. Personal. Soc. Psychol. 2018, 114, 891–908. [Google Scholar] [CrossRef]
  82. Schibli, K.; Wong, K.; Hedayati, N.; D’Angiulli, A. Attending, learning, and socioeconomic disadvantage: Developmental cognitive and social neuroscience of resilience and vulnerability. Ann. N. Y. Acad. Sci. 2017, 1396, 19–38. [Google Scholar] [CrossRef]
  83. Ginsburg, H.P. The myth of the deprived child: New thoughts on poor children. In The School Achievement of Minority Children; Routledge: Abingdon-on-Thames, UK, 1986; pp. 169–189. [Google Scholar]
  84. Cole, M. Differences and deficits in psychological research in historical perspective: A commentary on the special section. Dev. Psychol. 2013, 49, 84–91. [Google Scholar] [CrossRef]
  85. Wastell, D.; White, S. Blinded by Science: The Social Implications of Epigenetics and Neuroscience; Policy Press: Bristol, UK, 2017. [Google Scholar]
  86. Hoff, E. Interpreting the early language trajectories of children from low-SES and language minority homes: Implications for closing achievement gaps. Dev. Psychol. 2013, 49, 4–14. [Google Scholar] [CrossRef]
  87. Hall, W.S.; Tirre, W.C. The Communicative Environment of Young Children: Social Class, Ethnic, and Situational Differences; Technical Report No. 125; University of Illinois at Urbana: Champaign, IL, USA, 1979. [Google Scholar]
  88. Fagan, J.F.; Holland, C.R. Equal opportunity and racial differences in IQ. Intelligence 2002, 30, 361–387. [Google Scholar] [CrossRef]
  89. Fagan, J.F.; Holland, C.R. Racial equality in intelligence: Predictions from a theory of intelligence as processing. Intelligence 2007, 35, 319–334. [Google Scholar] [CrossRef]
  90. Gould, S.J. Mismeasure of Man; WW Norton and Company: New York, NY, USA, 1996. [Google Scholar]
  91. Blum, J.M. Pseudoscience and Mental Ability: The Origins and Fallacies of the IQ Controversy. Rev. Radic. Political Econ. 1978, 13, 72–73. [Google Scholar]
  92. Waffenschmidt, S.; Knelangen, M.; Sieben, W.; Bühn, S.; Pieper, D. Single screening versus conventional double screening for study selection in systematic reviews: A methodological systematic review. BMC Med. Res. Methodol. 2019, 19, 132. [Google Scholar] [CrossRef]
  93. Ford, C.B.; Kim, H.Y.; Brown, L.; Aber, J.L.; Sheridan, M.A. A cognitive assessment tool designed for data collection in the field in low-and middle-income countries. Res. Comp. Int. Educ. 2019, 14, 141–157. [Google Scholar] [CrossRef]
  94. Sternberg, R.J. Context-sensitive cognitive and educational testing. Educ. Psychol. Rev. 2018, 30, 857–884. [Google Scholar] [CrossRef]
  95. Van de Vijver, F.; Tanzer, N.K. Bias and equivalence in cross-cultural assessment: An overview. Eur. Rev. Appl. Psychol. 2004, 54, 119–135. [Google Scholar] [CrossRef]
  96. Ardila, A.; Keating, K. Cognitive abilities in different cultural contexts. In International Handbook of Cross-Cultural Neuropsychology; Routledge: Abingdon-on-Thames, UK, 2007; pp. 109–125. [Google Scholar]
  97. Fernández, A.L.; Abe, J. Bias in cross-cultural neuropsychological testing: Problems and possible solutions. Cult. Brain 2018, 6, 1–35. [Google Scholar] [CrossRef]
  98. Zuilkowski, S.S.; McCoy, D.C.; Serpell, R.; Matafwali, B.; Fink, G. Dimensionality and the development of cognitive assessments for children in Sub-Saharan Africa. J. Cross-Cult. Psychol. 2016, 47, 341–354. [Google Scholar] [CrossRef]
  99. Kranzler, J.H.; Flores, C.G.; Coady, M. Examination of the cross-battery approach for the cognitive assessment of children and youth from diverse linguistic and cultural backgrounds. Sch. Psychol. Rev. 2010, 39, 431–446. [Google Scholar] [CrossRef]
  100. Rosenthal, R. The file drawer problem and tolerance for null results. Psychol. Bull. 1979, 86, 638–641. [Google Scholar] [CrossRef]
Figure 1. Prisma flowchart process of document collection, screening, retrieval, and selection.
Ctn 07 00024 g001
Figure 2. Absolute and corrected mean effect sizes across countries. Mean effect size (expressed as mean of absolute unstandardized correlation coefficients r in the top panel, and as mean of corrected standardized correlation coefficients r in the bottom panel) of developmental cognitive neuroimaging findings showing direct effects of SES on brain structure and processes broken down by country where the studies were conducted. Error bars represent ± 1 standard error. Bars without error represent single studies. Red references lines show interpretation of r as increased strength of the effect represented as increasingly darker tone of red (Null effect: 0 to 0.9; Small effect: 0.10 to 0.23; intermediate effect: 0.24 to 0.36; large effect: 0.37 to 0.45; extreme > 0.45, adapted from Lehnard and Lehnard [61]).
Ctn 07 00024 g002
Figure 3. Absolute and corrected mean significance values across countries. Significance values (expressed as mean of absolute p-values in the top panel, and as mean of corrected p-values in the bottom panel) of developmental cognitive neuroimaging findings showing direct effects of SES on brain structure and processes broken down by country where the studies were conducted. Error bars represent ± 1 standard error. Bars without error represent single studies. Green reference line corresponds to significance threshold level of p < 0.10.
Ctn 07 00024 g003
Figure 4. Absolute and corrected mean effect sizes across continental regions. Mean effect sizes (expressed as mean of absolute unstandardized correlation coefficients r in top panel, and as mean of corrected standardized correlation coefficients r in bottom panel) of developmental cognitive neuroimaging findings showing direct effects of SES on brain structure and processes across continental regions. Error bars represent ± 1 standard error. Red reference lines show interpretation of r as increased strength of the effect represented as increasingly darker tone of red (Null effect: 0 to 0.9; Small effect: 0.10 to 0.23; intermediate effect: 0.24 to 0.36; large effect: 0.37 to 0.45; extreme > 0.45, adapted from Lehnard and Lehnard [61]).
Ctn 07 00024 g004
Figure 5. Absolute and corrected significance values across continental regions. Significance values (expressed as mean of absolute p-values in the top panel, and as mean of corrected p-values in the bottom panel) of developmental cognitive neuroimaging findings showing direct effects of SES on brain structure and processes across continental regions. Error bars represent ± 1 standard error. Green reference line corresponds to significance threshold level of p < 0.10.
Ctn 07 00024 g005
Figure 6. Absolute and corrected mean effect sizes across country income levels. Mean effect sizes (expressed as mean of absolute unstandardized correlation coefficients, r in top panel, and as mean of corrected standardized correlation coefficients r in bottom panel) of developmental cognitive neuroimaging findings showing direct effects of SES on brain structure and processes across country income levels according to the World Bank classification. Error bars represent ± 1 standard error. Red reference lines show interpretation of r as increased strength of the effect represented as increasingly darker tone of red (Null effect: 0 to 0.9; Small effect: 0.10 to 0.23; intermediate effect: 0.24 to 0.36; large effect: 0.37 to 0.45; extreme > 0.45, adapted from Lehnard and Lehnard [61]).
Ctn 07 00024 g006
Figure 7. Absolute and corrected significance values across country income levels. Significance values (expressed as mean of absolute p-values in the top panel, and as mean of corrected p-values in the bottom panel) of developmental cognitive neuroimaging findings showing direct effects of SES on brain structure and processes across country income levels. Error bars represent ± 1 standard error. Green reference line corresponds to significance threshold level of p < 0.10.
Ctn 07 00024 g007
Figure 8. Absolute and corrected mean effect sizes across neuroimaging techniques. Mean effect sizes (expressed as mean of absolute unstandardized correlation coefficients, r in top panel, and as mean of corrected standardized correlation coefficients r in bottom panel) of developmental cognitive neuroimaging findings showing direct effects of SES on brain structure and processes across neuroimaging techniques. Error bars represent ± 1 standard error. EEG = Electroencephalography; sMRI = structural Magnetic Resonance Imaging; ERP = Event-Related Potentials; NIRS = Near InfraRed Spectroscopy; fMRI + sMRI = combined functional and structural Magnetic Resonance Imaging. Red reference lines show interpretation of r as increased strength of the effect represented as increasingly darker tone of red (Null effect: 0 to 0.9; Small effect: 0.10 to 0.23; intermediate effect: 0.24 to 0.36; large effect: 0.37 to 0.45; extreme > 0.45, adapted from Lehnard and Lehnard [61]).
Ctn 07 00024 g008
Figure 9. Absolute and corrected significance values across neuroimaging techniques. Significance values (expressed as mean of absolute p-values in the top panel, and as mean of corrected p-values in the bottom panel) of developmental cognitive neuroimaging findings showing direct effects of SES on brain structure and processes across neuroimaging technique. Error bars represent ± 1 standard error. Green reference line corresponds to significance threshold level of p < 0.10. EEG = Electroencephalography; sMRI = structural Magnetic Resonance Imaging; ERP = Event-Related Potentials; NIRS = Near InfraRed Spectroscopy; fMRI + sMRI = combined functional and structural Magnetic Resonance Imaging.
Ctn 07 00024 g009
Figure 10. Absolute and corrected mean effect sizes across developmental outcomes. Mean effect sizes (expressed as mean of absolute unstandardized correlation coefficients, r in top panel, and as mean of corrected standardized correlation coefficients r in bottom panel) of developmental cognitive neuroimaging findings showing direct effects of SES on brain structure and processes across developmental outcomes. Error bars represent ± 1 standard error. RSFC: resting state functional connectivity, WM: working memory, EF: executive function, SEO: socio-emotional outcomes, CV: cortical volumes, RFA: regional functional activity. Note that RSFC, RFA, and CV reflect functions measured via imagining; all other functions were measured using behavioral performance. Red reference lines show interpretation of r as increased strength of the effect represented as increasingly darker tone of red (Null effect: 0 to 0.9; Small effect: 0.10 to 0.23; intermediate effect: 0.24 to 0.36; large effect: 0.37 to 0.45; extreme > 0.45, adapted from Lehnard and Lehnard [61]).
Ctn 07 00024 g010
Figure 11. Absolute and corrected significance values across developmental outcomes. Significance values (expressed as mean of absolute p-values in the top panel, and as mean of corrected p-values in the bottom panel) of developmental cognitive neuroimaging findings showing direct effects of SES on brain structure and processes across neuroimaging technique. Error bars represent ± 1 standard error. Green reference line corresponds to significance threshold level of p < 0.10. RSFC: resting state functional connectivity, WM: working memory, EF: executive function, SEO: socio-emotional outcomes, CV: cortical volumes, RFA: regional functional activity.
Ctn 07 00024 g011
Table 2. One-way Bayesian ANOVAs on absolute mean effect sizes and corresponding p-values, weighted by sample sizes, across country, continent, country income level, developmental outcome, and neuroimaging technique.
Predictor VariablesOutcome Variables
Mean r (Unstandardized)Mean p-Value (Two-Tailed)Mean Zr
FpBFFpBFFpBF
Country1.5850.1200.0001.5320.1370.0001.9690.0430.001
Continent2.3570.0800.0761.2700.2930.0172.7700.0490.130
Country Income Level0.2720.7630.0191.3850.2580.0550.2250.7990.018
Developmental Outcome1.6440.1250.0013.5480.0020.4171.4900.1740.001
Neuroimaging Technique3.1610.0130.1610.3350.8900.0002.9580.0190.108
Table 3. One-way Bayesian ANOVAs on corrected mean effect sizes and corresponding p-values, weighted by inverse variance across country, continent, country income level, developmental outcome, and neuroimaging technique.
Predictor VariablesOutcome Variables
Corrected Mean ZrCorrected Mean p-Value
(Two-Tailed)
FpBFFpBF
Country1.5710.1240.0001.5380.1350.000
Continent2.3420.0820.0971.3160.2770.008
Country Income Level0.2850.7530.0181.4480.2430.025
Developmental Outcome1.3060.2550.0003.0800.0050.107
Neuroimaging Technique3.1220.0140.0650.3490.8810.000
Disclaimer/Publisher’s Note: The statements, opinions and data contained in all publications are solely those of the individual author(s) and contributor(s) and not of MDPI and/or the editor(s). MDPI and/or the editor(s) disclaim responsibility for any injury to people or property resulting from any ideas, methods, instructions or products referred to in the content.

