Article

The Microvertebrates of Shanidar Cave: Preliminary Taphonomic Findings

Department of Archaeology, University of Cambridge, Cambridge CB2 3DZ, UK
*
Author to whom correspondence should be addressed.
Quaternary 2022, 5(1), 4; https://doi.org/10.3390/quat5010004
Submission received: 27 September 2021 / Revised: 1 December 2021 / Accepted: 4 January 2022 / Published: 10 January 2022

Abstract

:
Shanidar Cave, Iraqi Kurdistan, is one of the most important Palaeolithic sites in Southwest Asia. This is due to the long sequence of hominin occupation of the cave and the discovery of multiple Neanderthal individuals from the original Solecki excavations (1951–1960) and recent excavations (2014 to present). Preliminary taphonomic analyses of the microvertebrate assemblage were undertaken to understand the factors affecting assemblage formation and accumulation, and this paper presents the first results of these analyses. All contexts display a high proportion of fragmentation, with a slight decrease in breakage towards the base of the sequence. Black staining and root etching were observed in a similar pattern, present in most contexts but with an increase in the lower levels. A significant proportion of the microvertebrate remains examined displayed light traces of digestion, indicating some contribution to the assemblage by predators. The results are consistent with wider palaeoecological records that indicate relatively warm, wet conditions at the base of the sequence and cooler, drier conditions at the top.

Graphical Abstract

1. Introduction

Climate change and resultant environmental shifts have long been associated with major population and cultural turnover in human history. Understanding the nature of these shifts, the exact duration, rapidity, and amplitude, can provide a comprehensive understanding of the situations faced by early humans. Local environmental records are particularly valuable when investigating human responses, as they reflect the specific conditions and resulting challenges faced by humans. Micromammals provide particularly good local, high-resolution environmental records due to their restricted habitat range, short generational turnover time, and ubiquity in the zooarchaeological record [1].
Taphonomy is “the study of the transition, in all details, of organics from the biosphere into the … geological record” [2]. Taphonomic processes may distort and alter the archaeological and palaeontological record, potentially producing spurious interpretations and conclusions if not accounted for. Understanding these taphonomic processes is particularly important in analyses that are based on tracking change through a sequence (as is the case in palaeoenvironmental studies), as changes due to shifts in the taphonomic process may mimic or mask environmental changes. In the case of microvertebrates the effect of avian predators is particularly important, as the hunting range and prey preferences may produce biases in the eventual microfaunal community recorded and resultant palaeoenvironmental reconstruction. The aim of this preliminary study was to carry out an initial taphonomic analysis of the microvertebrate assemblage of Shanidar Cave. The results of this analysis will be the baseline for future taxonomic, taphonomic, and palaeoenvironmental studies of the site.

1.1. The Site

Shanidar Cave (36°50′ N, 44°13′ E) is a karstic cave located in the Baradost Mountains in the Zagros foothills of northwest Iraqi Kurdistan, approximately 2.5 km from the Greater Zab River, a tributary of the Tigris (Figure 1). The cave is at an elevation of 745 m, with a large, south-facing mouth measuring about 25 m in width and 8 m in height. The cave is slightly wider than it is long. It extends back approximately 40 m and is 53 m wide at its maximum point, resulting in a cave floor of about 1200 m2 [3,4]. The Zagros Mountains extend from southeastern Turkey down towards the Persian Gulf, the main massif forming the modern boundary between Iraq and Iran. They are a series of karstic formations, and as such multiple caves are present in the region. Many of these caves have provided both archaeological and paleoclimatic information on the region; along with Shanidar Cave other key archaeological sites in the region include Yafteh Cave, Bisitun Cave, Kaldar Cave, and Kobeh Cave [5].

1.1.1. Excavations 1951–1960

The cave was initially excavated by Ralph Solecki in a series of four field seasons through the 1950s and has yielded one of the key Palaeolithic sequences for the region [4,6,7,8,9,10,11,12]. The original excavations resulted in a 14 m-deep trench roughly in the centre of the cave floor. During the original excavations the remains of nine Neanderthal individuals were recovered from the Mousterian Layer D, with remains from a 10th, immature individual recovered during reanalysis of the faunal remains in 2007 [4,13,14]. These remains attracted significant interest due both to their biology and to the inferences drawn from them about Neanderthal behaviour, particularly Shanidar I and Shanidar IV. Shanidar I shows signs of severe trauma and may have been partially incapacitated during his life, suggesting a degree of care for the wounded or disabled among Neanderthals [15,16,17]. Shanidar IV is an individual who appears to have been deliberately buried with flowers, which has significant implications for our understanding of Neanderthal mortuary practices [16,18,19]. This interpretation has been challenged by various authors, including Sommer [20], who suggested that the clusters of flowers may be the result of jirds burrowing in the sediments around the burial.
Although the focus of the original excavations was the recovery of a deep cultural sequence, with the Neanderthal remains an unexpected bonus, palaeoenvironmental studies of the flora (pollen) and fauna were also carried out. The former was analysed by Arlette Leroi-Gourhan [12,18] and the later primarily by Dexter Perkins [21], though additional work was carried out by Mary Evins [22,23] on the Mousterian faunal assemblage that was excluded from the original analyses. The original faunal analyses mostly focused on larger mammals, though short reports on the molluscs and microvertebrates were included as appendices to Evins’ thesis. Microvertebrate taxa reported here included Hemiechinus auratus, Talpa sp., Miniopterus schreibersi, Taphozous sp., Ellobius sp., Meriones sp. and Spalax sp.

1.1.2. Recent Excavations

All material studied in this research derives from the recent excavations at Shanidar Cave led by Graeme Barker. The project began with preliminary work in 2014, and excavations commenced in 2015. The recent excavations have two main aims. The first is to locate and date the cultural layers and Neanderthal burial locations described by Solecki using modern methods. The new dates will produce a high-resolution sequence of occupation of the cave, securely establishing the presence of Neanderthals in the landscape at set points in time. The second aim is to collect a range of palaeoecological data to provide a local record of climate and environment. Although, as discussed above, some palaeoenvironmental analyses were carried out in the original excavations, certain groups such as the microvertebrates were largely excluded due to the difficulty in finding appropriate reference collections. The recent excavations offer an opportunity to redress this absence. Although the recent excavations are processing a far smaller amount of material than the original excavations, it is hoped that the application of modern techniques and methods will provide a rich, well-dated palaeoenvironmental sequence for the cave [24]. The reopened excavations are ongoing with faunal, shell, and botanical samples taken for use as climate proxies and isotope analyses of shell and faunal material planned. To date, work at the cave has uncovered further remains attributed to Shanidar V from the area defined by Solecki as Layer D, as well as an incised shell object from the base of the Baradostian Layer C [25,26]. The most notable discovery has been the torso and skull of an additional Neanderthal individual in the immediate vicinity of the original “Flower Burial” [27]. The discovery of the new hominin remains has expanded the aims and methodology of the overall project. The remains offer an opportunity to excavate and analyse the Neanderthal remains and their burial contexts in much higher detail than was possible during the original excavations, potentially providing robust insights into Neanderthal mortuary behaviour [28].

1.1.3. Stratigraphy and Dating of the Cave

In the original excavations, Solecki recognised four major layers or cultural phases in the 14 m sequence of the cave: Layer A (modern to Neolithic), Layer B1 (Proto-Neolithic), Layer B2 (Mesolithic), Layer C (Upper Palaeolithic Baradostian), and Layer D (Middle Palaeolithic Mousterian) [4]. Multiple rockfall events occurred throughout the sequence in addition to mudflow events, and as a result the stratigraphy is highly complex. His radiocarbon dates indicated that Layer A dates from approximately 7000 BP to the present, Layer B from approximately 12,000 BP to 10,600 BP, Layer C from 35,540 BP to 28,700 BP, and that Layer D ended around 46,900 BP. The start date of the sequence is uncertain, though at the time Solecki estimated that it could be as old as 100,000 BP on the basis of sedimentation rates in the cave [4]. It should be noted that a significant hiatus in the occupation of the cave was recorded between Layers B2 and C, and between C and D. In addition to the radiocarbon dates, obsidian samples from Layers B and C were taken for obsidian hydration dating [29], though Solecki did not feel that the dates obtained for Layer C using this method were reliable [4].
In 2017 Becerra-Valdivia et al. published a paper reanalysing the dates obtained for the original excavations alongside new and original radiocarbon dates for other Palaeolithic sites in the region. Bayesian modelling of these dates was used to suggest a transition to the Upper Palaeolithic between 45,000 to 40,250 cal BP in the region, and a transition between 43,200 to 39,600 cal BP for Shanidar Cave specifically (i.e., from Solecki’s Layer D to Layer C) [5]. Dating of material from the recent excavations is ongoing, with charcoal AMS dates and preliminary OSL dates broadly agreeing with the original Solecki dates but without indicating any substantial hiatus between Layers C and D. Altogether the current set of available dates suggests that the full cave sequence extends back at least 100,000 years, which corresponds to marine isotope stage 5.

1.2. Taphonomy and Microvertebrate Studies

Microvertebrates are a valuable component of the zooarchaeological assemblage, as they offer unique perspectives on human–environment interactions that cannot always be gleaned from other sources [30]. They offer particular advantages in the study of human migration and sedentism through the study of commensal microvertebrates [31,32]. The other major use of microvertebrate assemblages is in palaeoenvironmental reconstruction (e.g., [33,34,35,36,37]). The abundance, small range, and specific ecological niches of microvertebrates mean that they are able to offer a much more localised, high-resolution palaeoclimatic record than other proxies.
The selection of prey by predators may create biases in the observed micromammal community composition. Information on which predators are responsible for depositing the micromammals in an archaeological assemblage, and whether there is change in the predator, may have large implications for any resulting palaeoecological reconstruction. Taphonomic studies aim to provide insights into any possible predatory action in the accumulation of the assemblage, as well as provide information on other taphonomic processes that may be related to environmental conditions within the cave. For example, black discolouration of the microvertebrate remains may be indicative of burning or manganese staining. The former may be caused by human activity in the cave and the latter may be indicative of increased humidity in the cave or the presence of standing water [38]. Root etching of the bones is indicative of relatively high levels of vegetation and plant growth in an area, which may in turn suggest warmer or more humid environmental conditions that are more conducive to plant growth. Abrasion of the microvertebrate remains due to transportation and mixing of sediments also provides important information on the assemblage formation. Abrasion and digestion can produce similar effects in microvertebrate remains, though they can be distinguished from each other on the basis of the location and smoothness of any rounding [39].
The most common way in which microfaunal remains are accumulated is through predation [40,41]. As different predators have different dietary preferences and prey selectivity, the resulting species presence and proportional abundance may be more of a reflection of predator activity than the actual microfaunal community. The predator responsible for assemblage accumulation therefore acts as a taphonomic filter. A substantial body of work dedicated to the effects of predation on microfaunal remains exists, with key work carried out by Mayhew [42] and Andrews [40] focusing on the taphonomic signals of different predators. The different feeding habits and digestive environments of different predators result in different degrees of breakage and digestion of the microfaunal skeletons. Digestion has been particularly thoroughly studied using teeth, and as a result the intensity of digestion of the enamel and dentine of teeth can be linked to different predator types [39,41,43,44,45]. Once the digestion category is known it may be possible to deduce the predator responsible using evidence from the larger mammal and avian faunal remains. Given different predators’ preferences, this can then be used to determine the strength of any taphonomic or ecological signal in an assemblage composition [40]. If a predator preferentially feeds on a subset of the microfaunal community, this produces stronger taphonomic than ecological patterning in the community composition, and any environmental reconstruction based on this will be less reliable. If a predator is more generalist in its feeding habits, the community composition in the predator diet and resulting archaeological assemblage are much more likely to be representative of the actual community. In this case, the ecological signal is stronger than the taphonomic signal and we can be more confident in any resulting palaeoecological reconstruction [44].

2. Materials and Methods

2.1. Sampling and Processing of Material

All the material used in this study is from the recent excavations at Shanidar Cave, with all microfaunal samples prior to those of the 2019 excavation season examined, including seasons 2015, 2015A, 2016, 2016A, 2017, and 2018. The sections and trench walls from the Solecki excavations were exposed and cleaned and then a series of sample columns were cut through the length of the sequence. The location of these sample columns is indicated in Figure 2. Where possible, sample columns were cut with a dimension of 30 by 30 cm, though in many cases smaller diameters were cut due to the large amount of rockfall in the sequence. In addition to the sample columns, in the 2018 excavation season material was collected from two open-plan excavation areas, also shown in Figure 2. For the purposes of this analysis the upper open-plan excavation area is referred to as SH18GS and the lower SH19GS. Overall, on the basis of the dates from the recent excavations, the Solecki excavations, and the Becerra-Valdivia reanalysis, it is thought that the material examined here dates from around 30,000 years ago to around 85,000 years ago. This corresponds to marine isotope stages 5a to 3.
In the field, the volume of excavated bulk material was recorded and then material was wet sieved through a 1 mm mesh. Once dry, materials were separated by dry sieving into three fractions of approximately >10 mm, >3 mm, and >0.3 mm. Following this, the shells, lithics, and bones (all mostly fragments) were hand sorted from each fraction into material type. All faunal material from the excavations is held on loan from the Kurdistan Directorate of Antiquities at the Department of Archaeology in Cambridge. On the return to the UK, the faunal sample bags were sorted again in the Grahame Clark Zooarchaeology Laboratory with the aid of a Leica MZ 75 light microscope. Micro- and macrofauna were analysed separately and so were initially sorted apart from one another. Within the microfaunal fraction, indeterminate bones were separated from the rest of the assemblage and the remainder was sorted into the major taxonomic groups (e.g., birds, reptiles, fish, mammals). The analysis focused on the micromammals, and within this group bones were sorted according to element. Overall, 2592 microfaunal remains collected from the recent excavation were examined. The preliminary micromammal faunal list is given in Table 1.

2.2. Taphonomic Methods

Breakage patterns and the degree of digestive etching on microfaunal remains can be used as an indicator of the predator responsible for assemblage accumulation. Surface digestion of the specimens, recorded following the categories set out by Andrews [40] and expanded in subsequent work by Fernandez-Jalvo et al. [44], was recorded for both postcranial (humeri and femora) and dental material. Diagrams and descriptions of humeri and femora digestion from Jenkins aided categorisation of this material [46]. The categories were as follows: None, Light, Moderate, Heavy, and Extreme. Corrosion of bones and teeth can be produced by other processes, such as chemical weathering, but in the case of the Shanidar Cave assemblage the larger fauna and the mollusc assemblages showed no preliminary evidence of corrosion. In addition to this, the corrosion of the molars originated at the salient angles of the tooth, rather than at random spots. Chemical corrosion leaves randomly dispersed points of corrosion on the tooth surface [44]. This suggests that any corrosion observed on the microfauna is due to digestion rather than other processes. Data on breakage were also collected for these two groups, and, where relevant, additional information on other taphonomic marks such as burning and manganese staining was also collected. Studies of anatomical representation can provide useful additional information on the predator or post-depositional processes [40]. However, fully sorted postcranial data are not available for all contexts at this stage. These data, and their analyses, will be included in future work.
The data are presented as an overall assemblage dataset, and then disaggregated into separate stratigraphic units in order to investigate whether taphonomic processes changed through the sequence. As there is a degree of overlap between the sample columns and open-plan excavation areas, a new stratigraphic framework of a northern and southern sequence was developed to integrate these areas. Many of the individual contexts (i.e., within-layer sediment units identified in the field) were very small, and so, where possible, data from individual contexts have been combined into single sequence units in the northern and southern sequences. The northern sequence brings together samples from the back of the cave, encompassing contexts from Sample Columns B, B1, M, N, and N1 and the SH19GS open-plan excavation area, shown on the left side of Figure 2. The remaining areas, Sample Columns J, J1, L, and L1 and the SH18GS open-plan excavation area, are located towards the entrance of the cave and were grouped together into the southern sequence, shown in the right side of Figure 2. Contexts were grouped together into new units for the northern and southern sequences and assigned sequence numbers to indicate the relative position of each unit, with units numbered from top to bottom. Smaller sequence numbers, e.g., N01 and S03, represent samples from the upper stratigraphic levels that correspond to later dates, and larger sequence numbers, e.g., N66 and S43, represent lower stratigraphic levels that correspond to earlier dates. A small number of contexts that were very isolated were not linked to the main northern and southern sequences.
In order to maximise the amount of usable data in the timeframe available, the taphonomic analysis focused on two element groups, the dentition and proximal long bones (humerus and femur). Breakage and other taphonomic marks were recorded for all taxa, but the dental taphonomic analyses used only the arvicoline molars, as this group was present in nearly all contexts and in large numbers. A small subsample of murid data was collected (see Supplementary Table S1), but given the very small and uneven sample sizes is not included in the digestion data presented and discussed. Breakage data considered all soricid teeth and all rodent molars, whereas the digestion data only considered arvicoline molars. All femora were considered for digestion. As unfused femoral heads could be mistaken for digestive marks, particular care was taken in distinguishing between these two categories. Digestion marks were also visible on the greater and lesser trochanters and particular attention was likewise paid to these in cases where the femoral head was unfused. Digestion and breakage were recorded for all available humeri and femora, which are generally among the most commonly preserved postcranial elements in the assemblage and for which there are available comparative digestion data. With the exception of the talpid humerus, there are few diagnostic differences between the different micromammal postcrania, and so these results were not disaggregated by taxa. In the case of dental breakage, a tooth was recorded as incomplete if part of the occlusal surface or a cusp was absent. Absolute frequencies for all data are provided in the Supplementary Materials.

3. Results

3.1. Breakage

3.1.1. Humeri and Femora Results

Following the guidelines in Andrews [40], breakage of the humeri and femora was recorded as being present or absent, and if breakage had occurred, whether the proximal, shaft, distal, or a combination of these sections was present. The vast majority of humeri and femora surveyed were broken: 93% of the total surveyed. The data are shown broken down by element and portion present in Table 2. Approximately equal numbers of humeri and femora were surveyed, 336 to 343, respectively, and both showed similar levels of breakage, with 92.3% of humeri broken compared to 91.5% of femora. In terms of the portion present, most of the humeri were either a distal or a distal and shaft fragment, and the opposite was true of the femora, with most consisting of a proximal or proximal and shaft fragment.
As the humeri and femora sample size was smaller than the dentition sample, the data were very coarse when broken down by approximate area of the assemblage (sample column or cluster), particularly in the smaller upper sample columns. The sample size per area is shown in Table 3, demonstrating that certain sample columns had very small humeri and femora samples, in particular Sample Column J, from which no humeri or femora were recovered. As would be expected from the overall data, breakage in all areas was very high, ranging from 85.3 to 100% of all specimens showing signs of breakage. It is notable that some of the lowest proportions of breakage were observed in the lower sample columns and clusters: Sample Column N1, the lowest area of the excavations, had the highest number of complete specimens. Sample Columns B, B1, J, J1, L, and L1 are all located in the upper levels and in section appeared to have higher levels of rockfall, characteristics that may explain the highly fragmented nature of the assemblage.
When broken down by context, 74% of contexts had no complete specimens, though it must be noted that this may be partially due to the small sample size of contexts. Contexts with no complete specimens had an average sample size of 3.34 in comparison to 5.9 in contexts with at least one complete specimen, with an average sample size of 5.9. Contexts with greater sample sizes than average had a mean breakage of 92.3% in comparison to 94.6% in those with a below-average sample size. Whilst there was a large number of smaller contexts with no complete specimens, there did not seem to be a significant increase in the number of complete specimens as sample size increased.
In order to investigate whether there were any changes in the taphonomic processes throughout, the sequence data were grouped into northern and southern sequences. Overall, the proportion of broken humeri and femora remained high throughout both sequences (see Supplementary Figures S1–S4). A possible reduction in breakage was visible between sequence units N34 to N38 and S36 onwards.

3.1.2. Teeth Results

Given the contrasting morphology of different teeth within and between taxa, tooth breakage was recorded as simply present or absent. Whether the teeth were loose or present in a tooth row was also recorded. Very few teeth were found in a tooth row: Only 175 or 9.5% of the teeth recorded were present in the mandible or maxilla. In terms of fragmentation of the teeth themselves, 12% of in situ teeth and 34.8% of isolated teeth were broken. It should be noted that given the way in which teeth and bones were picked from the sieved material and then sorted in the lab, fragmented teeth, particularly single cusps of the microtine molars, were perhaps more likely to be missed and not kept due to their resemblance to the bone “dust” that was ubiquitous in the assemblage, so it might be expected that as sampling effort (and sample size) increases, more of the tiny individual teeth and toothrow fragments would be recovered. In this case, the same team was responsible for the initial picking of all teeth, and one individual was responsible for all lab sorting of the microfaunal remains. By keeping these conditions constant throughout the samples, it is hoped that sorting effort was maintained at a constant level throughout the assemblage. Examination of the data suggests that it is not a lack of sampling effort that led to the lack of teeth found in tooth rows: Even the largest sample area, SH18GS, had only 7.3% teeth in situ (see Table 4). The area with the highest proportion of teeth still present in a tooth row was SH19GS, with still only 17.3% of specimens containing toothrows.
In addition to data on whether teeth were present in the jaw, data were also collected on the breakage of the teeth. Given the different types of teeth surveyed, the data were not broken down by portion of the tooth present, but instead whether the tooth in question was complete. Overall, 32% of teeth were incomplete across the whole assemblage, with these data shown broken down by excavation area in Table 4.
The proportion of incomplete isolated teeth ranged from 19.7% in Sample Column N1 to 55.8% in Sample Column L1, a fairly large range. In the toothrow dataset, breakage was generally lower, ranging from 0 in several sample columns to 20% in Sample Column B. As discussed above, it is possible that increased sampling effort may be a factor leading to greater recovery of fragmentary teeth. However, this does not seem to be the case, as there did not appear to be a strong correlation between sample size and the proportion of specimens examined that were incomplete. This indicates that the higher proportion of incomplete specimens in certain areas is likely to be a genuine indication of higher disturbance to the sediments or other taphonomic processes, rather than greater sampling effort resulting in increased numbers of incomplete specimens being recovered.
As with the humeri and femora, the dental breakage patterns were also examined in sequence. The initial data were complicated by the large number of sequence units with 100% or 0% breakage. This was due to their relatively small sample sizes, with only one or two specimens examined. The data were filtered to remove extremely small samples (n < 5), producing a clearer picture of the variation through the sequence. Bar charts displaying the proportion of broken isolated teeth in each sequence unit are presented in the Supplementary Materials (Figures S5 and S6), but overall there appeared to be a slight increase in the proportion of teeth that were broken over time in both sequences. This was particularly evident at the base of the northern sequence from unit N64 to N36, where all units except N51 had breakage levels of less than 37.5%.

3.1.3. Comparison between the Postcranial and the Dental Breakage Patterns
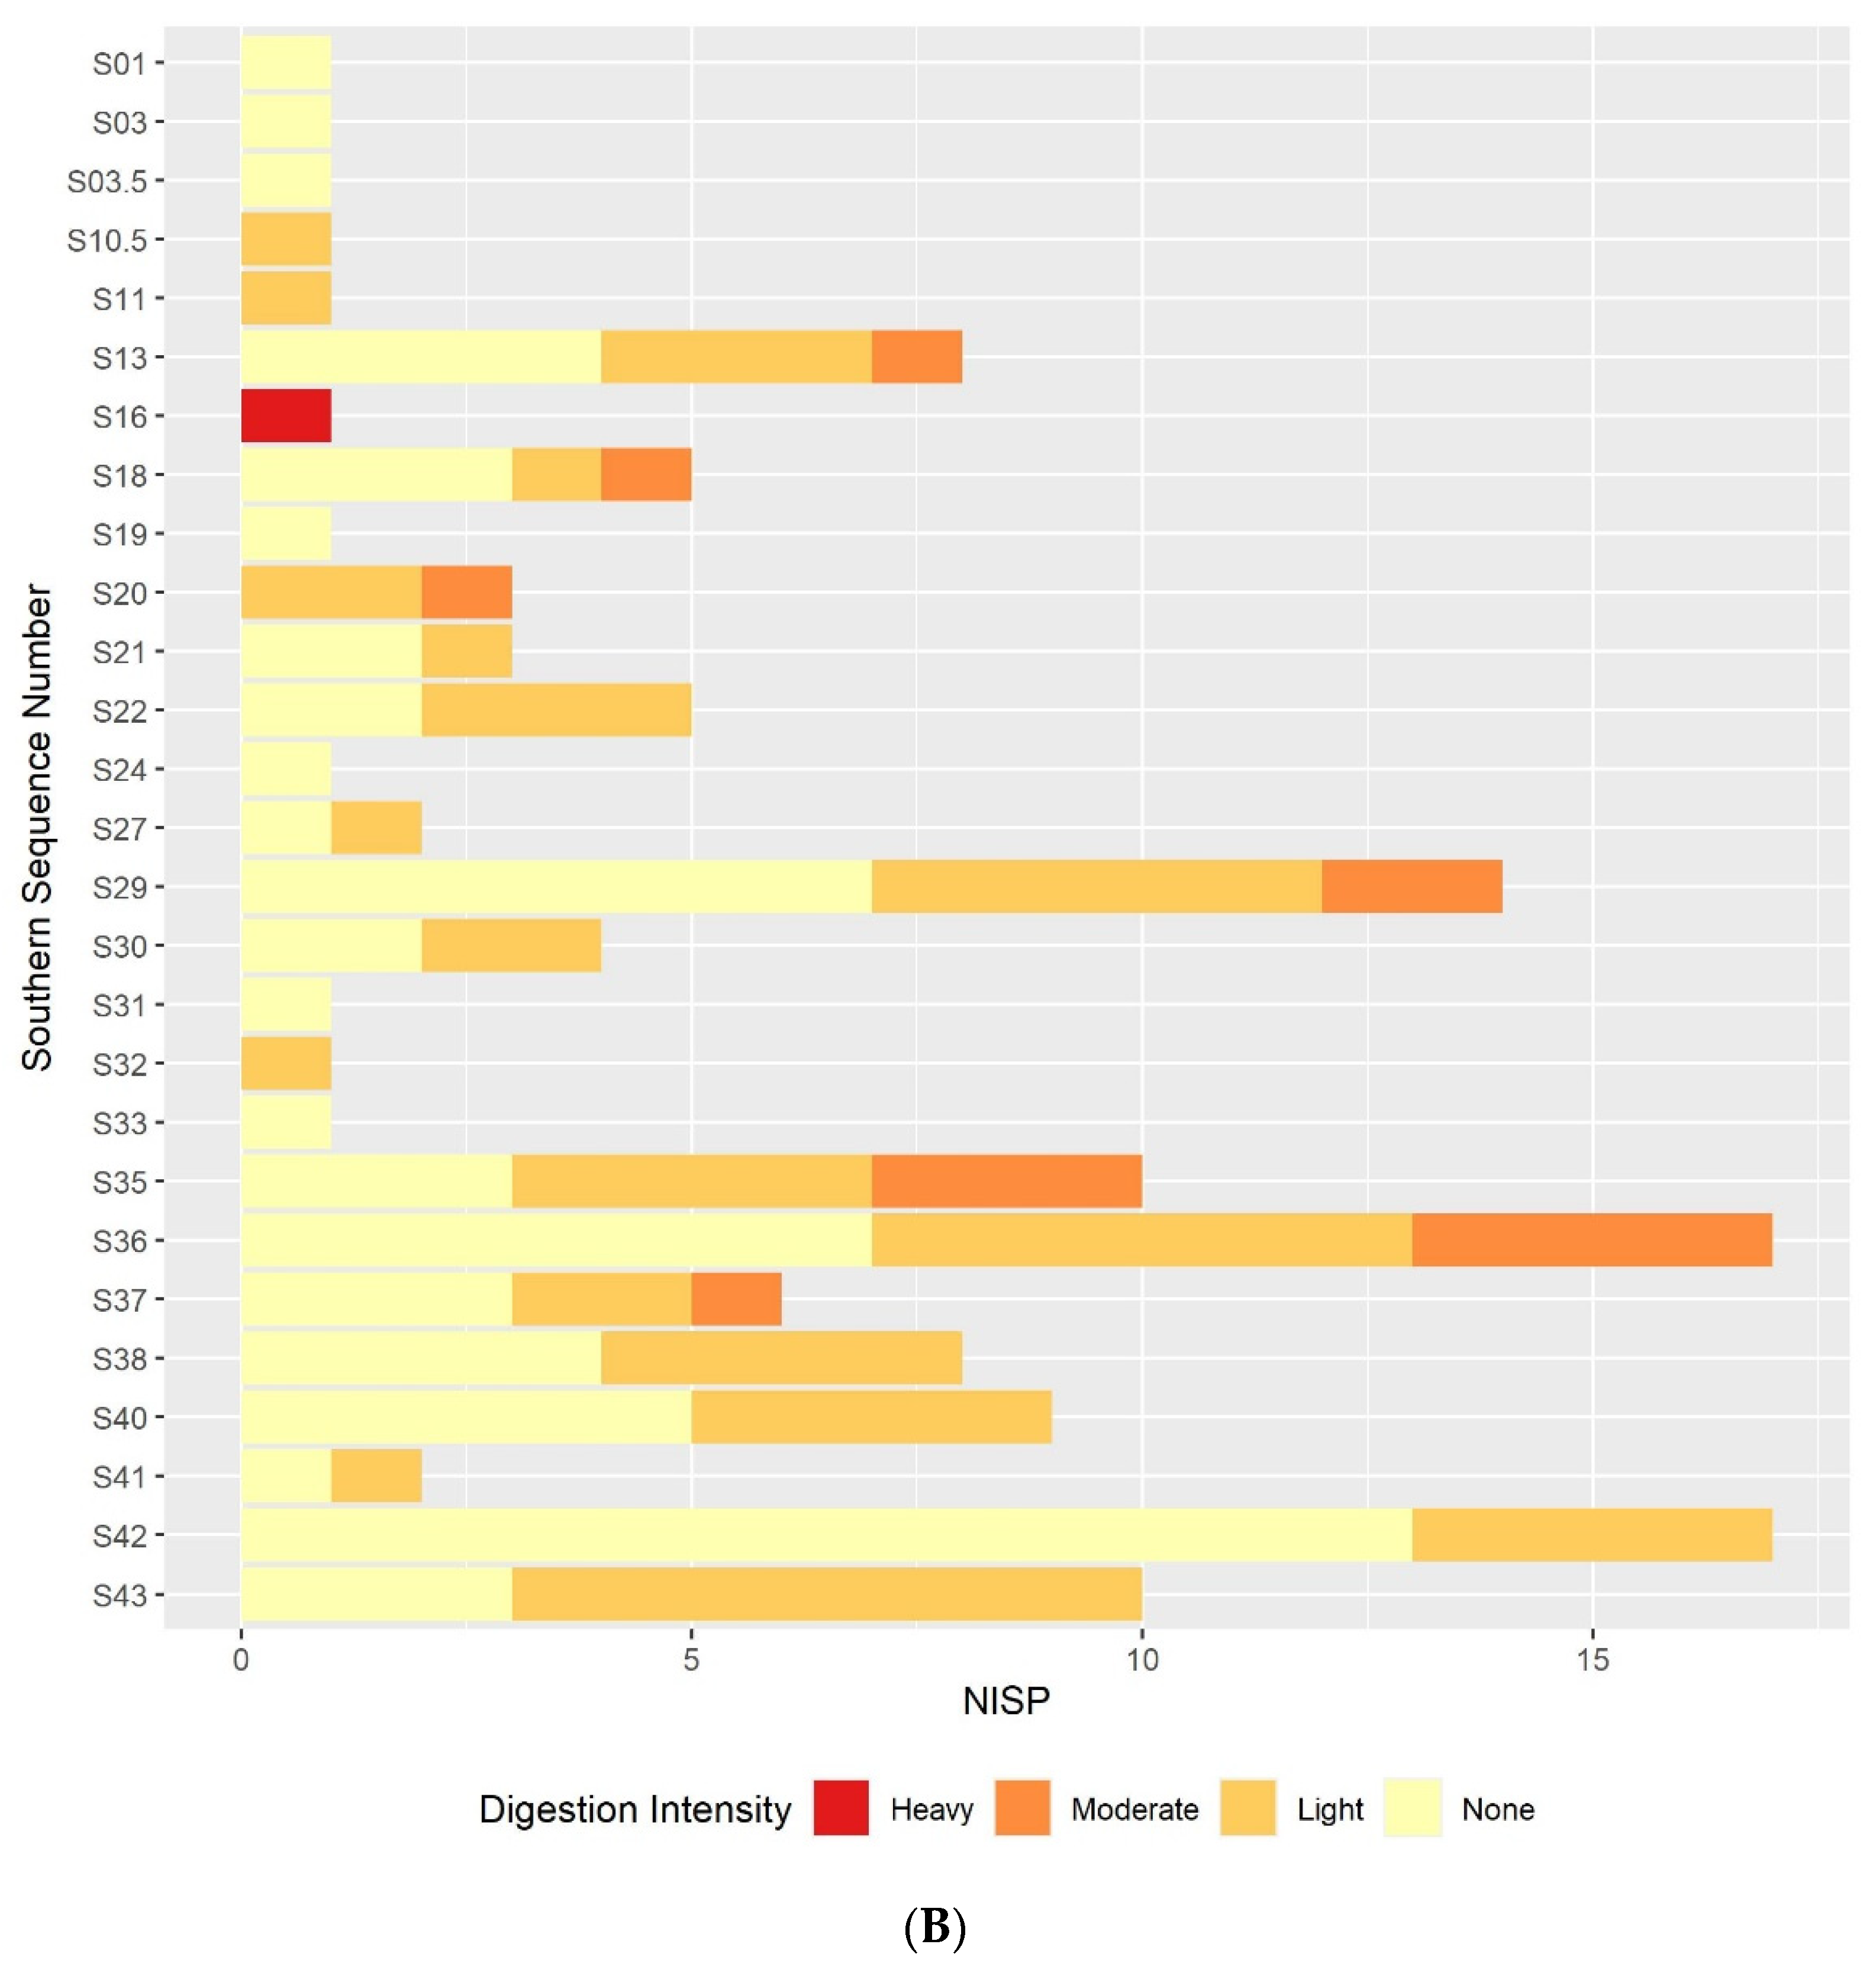
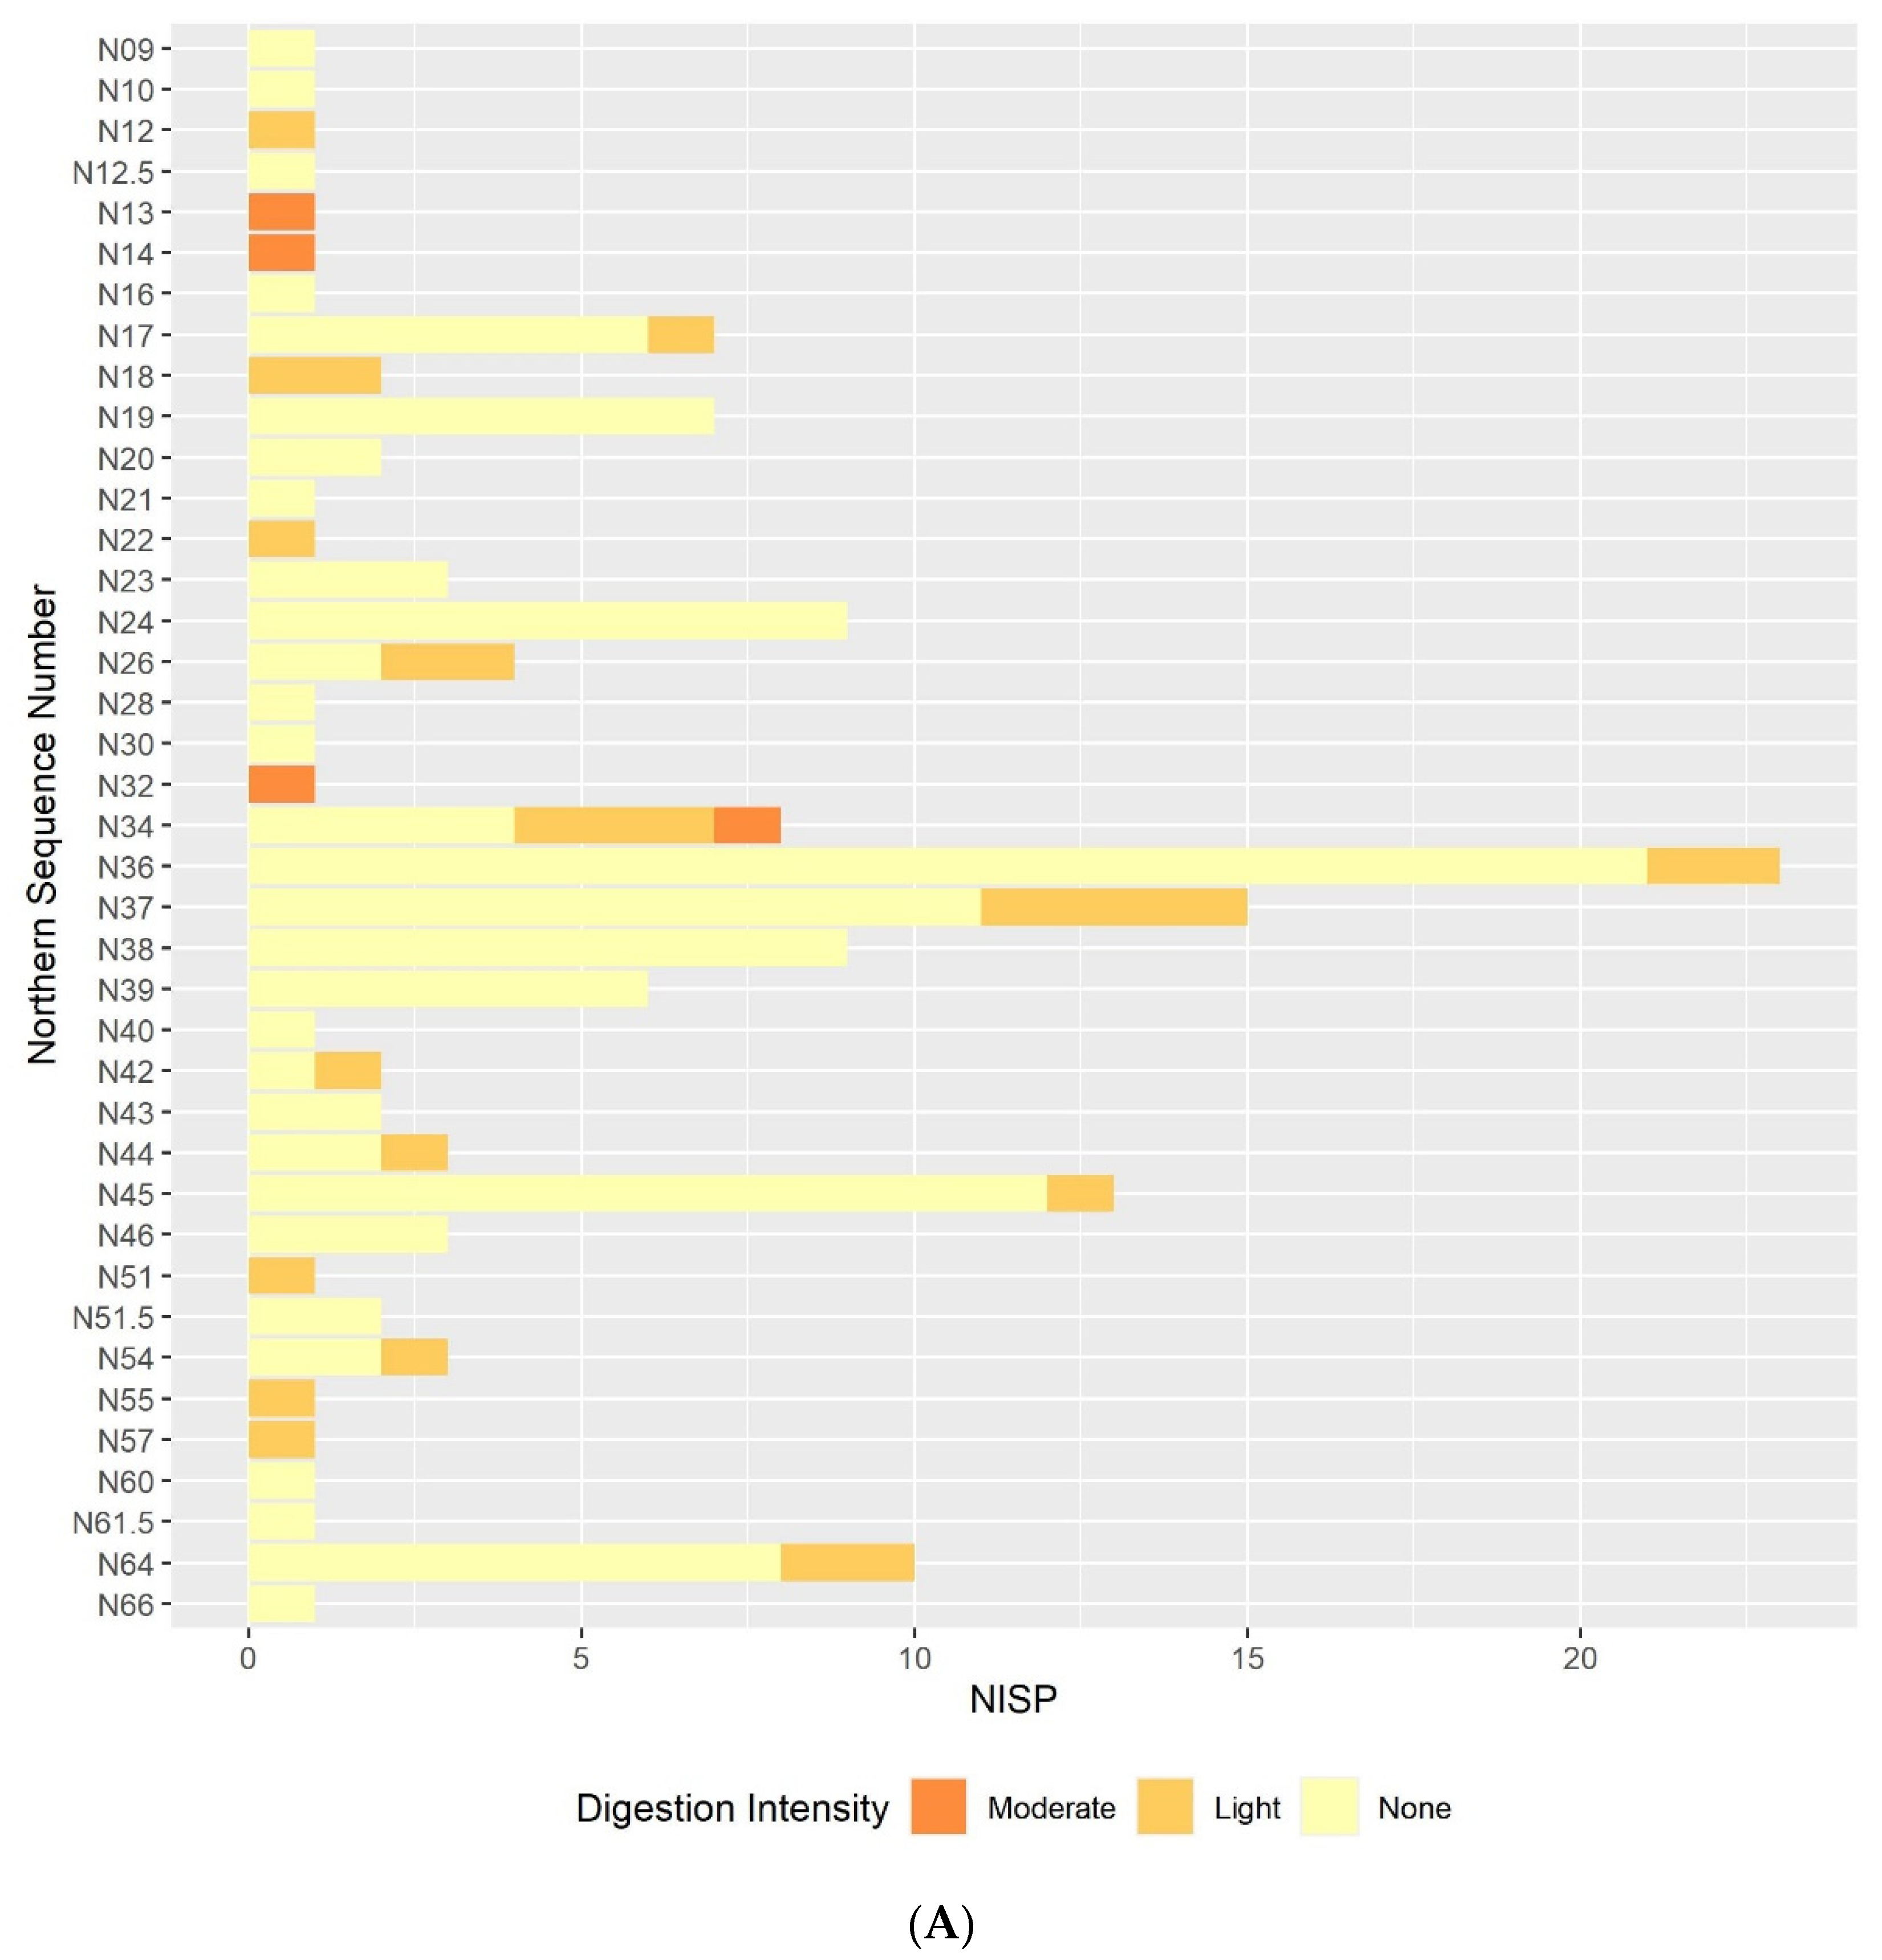
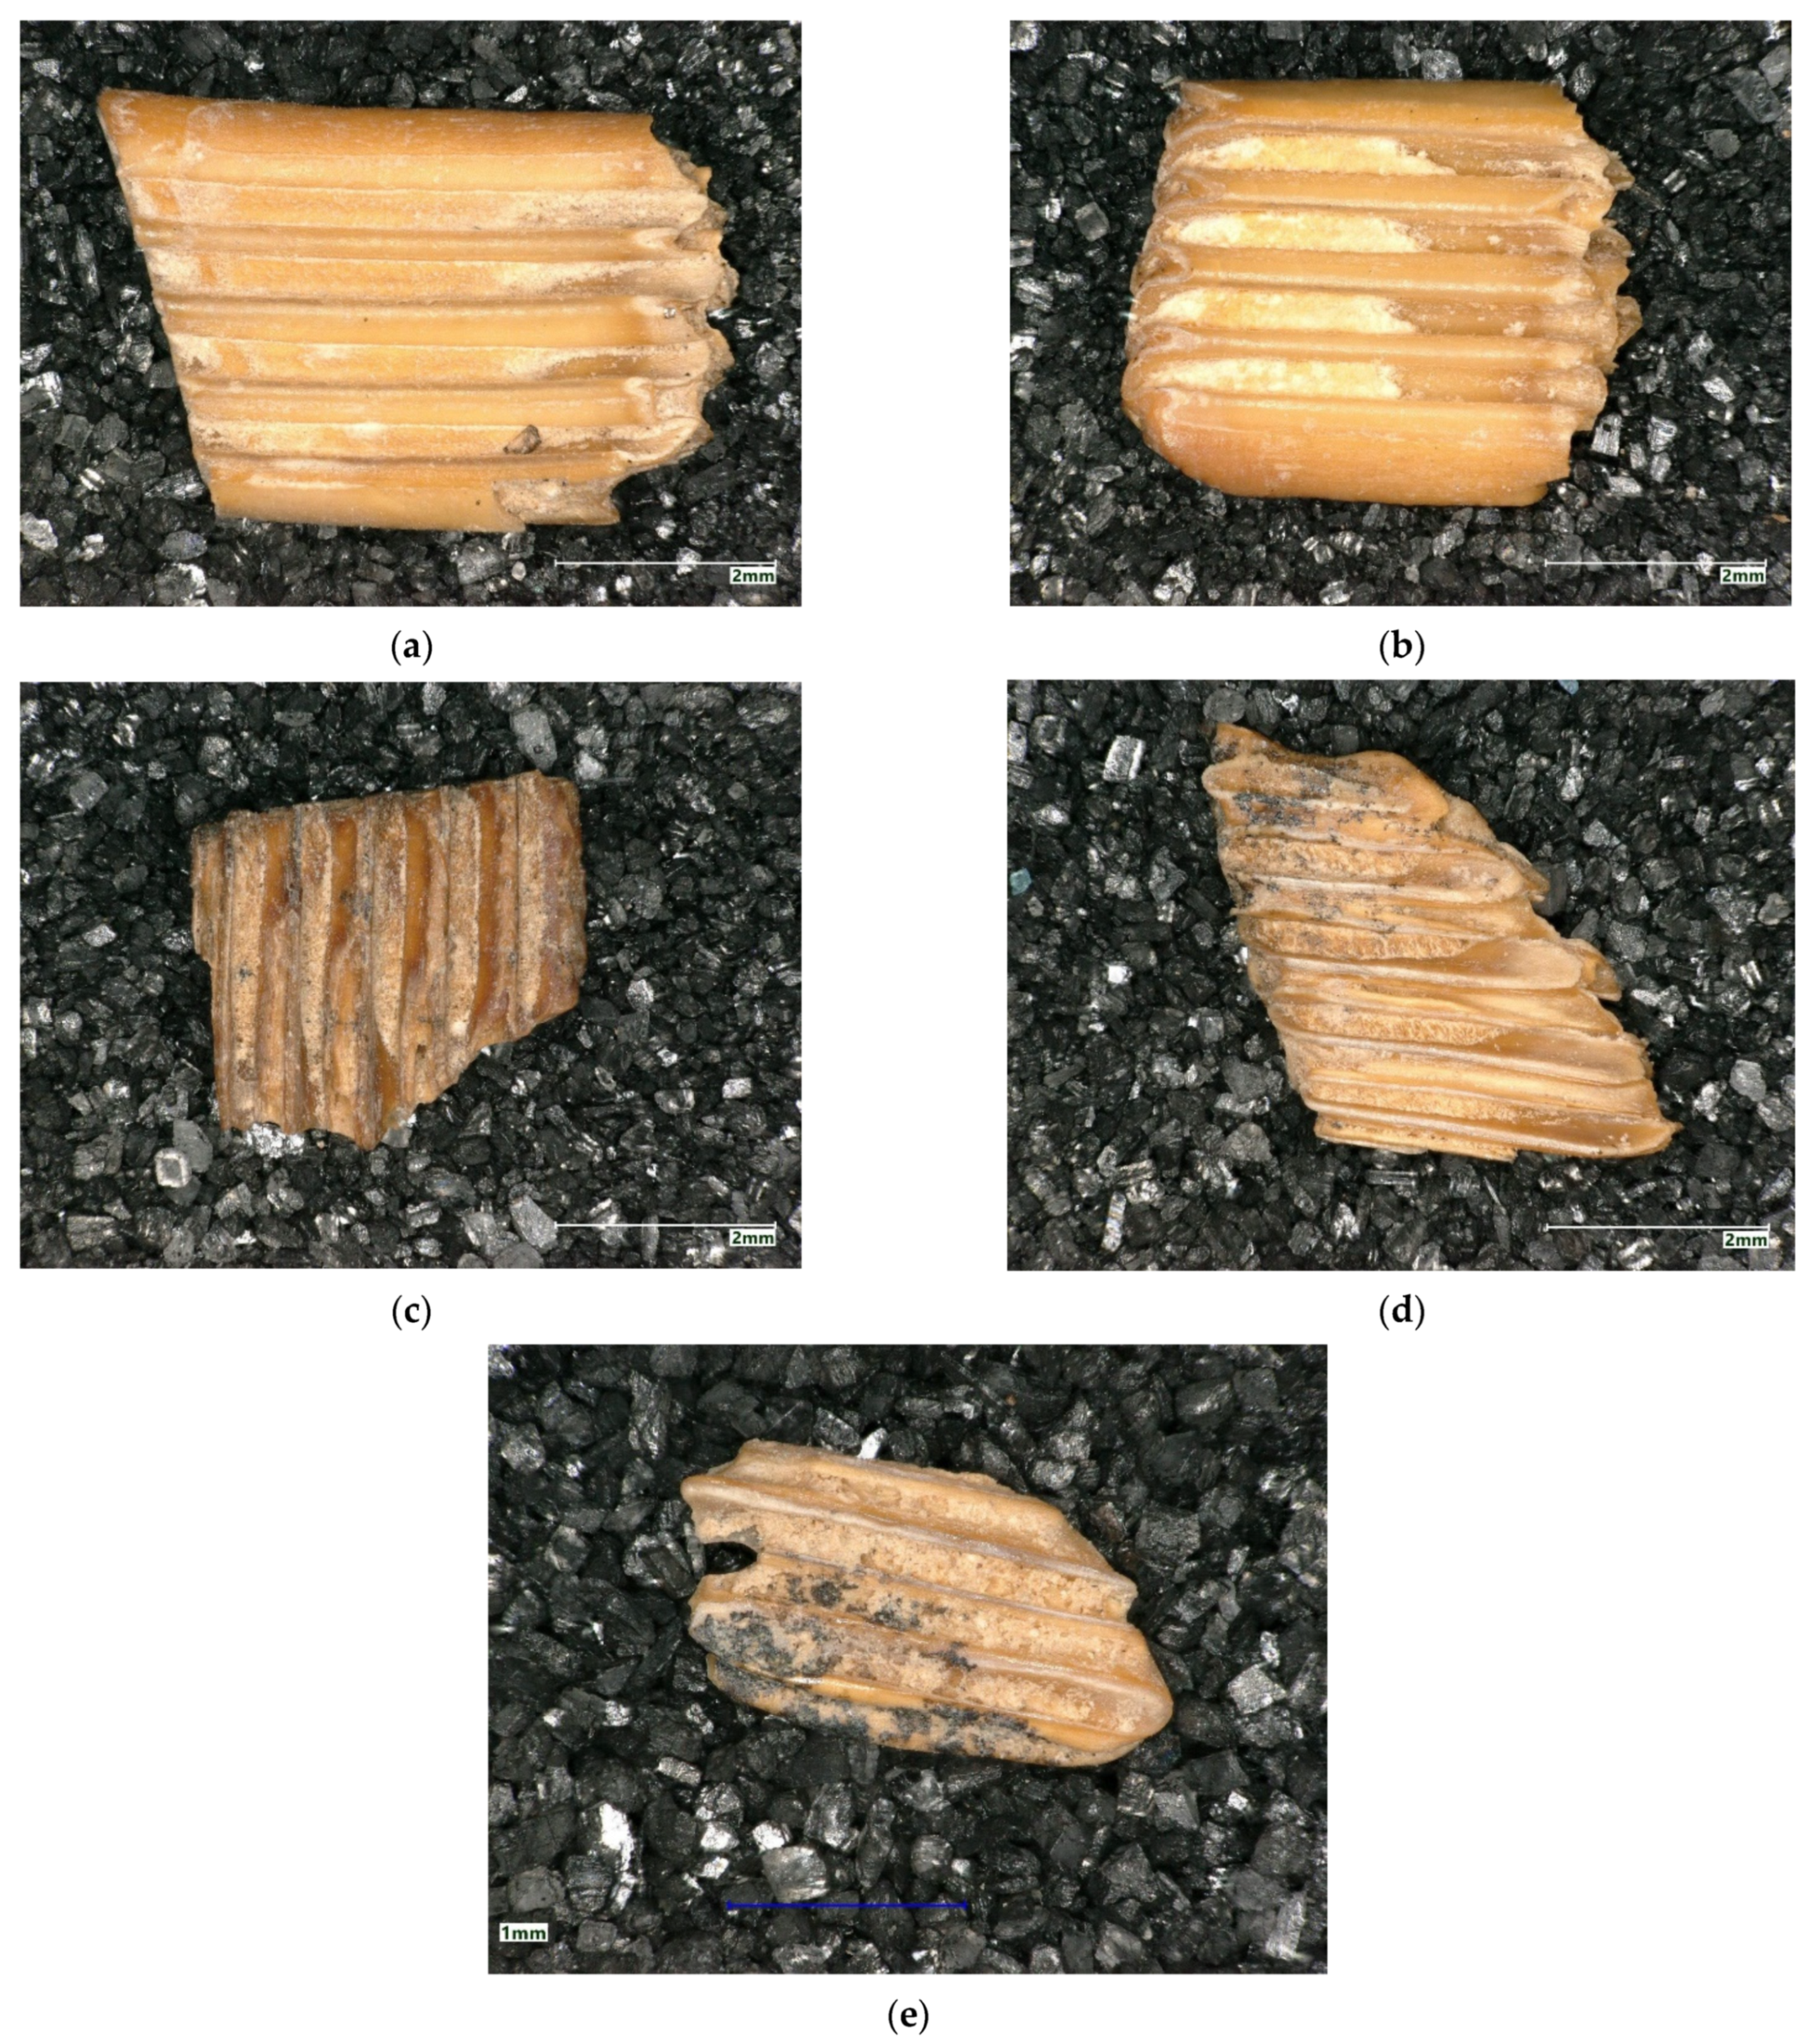
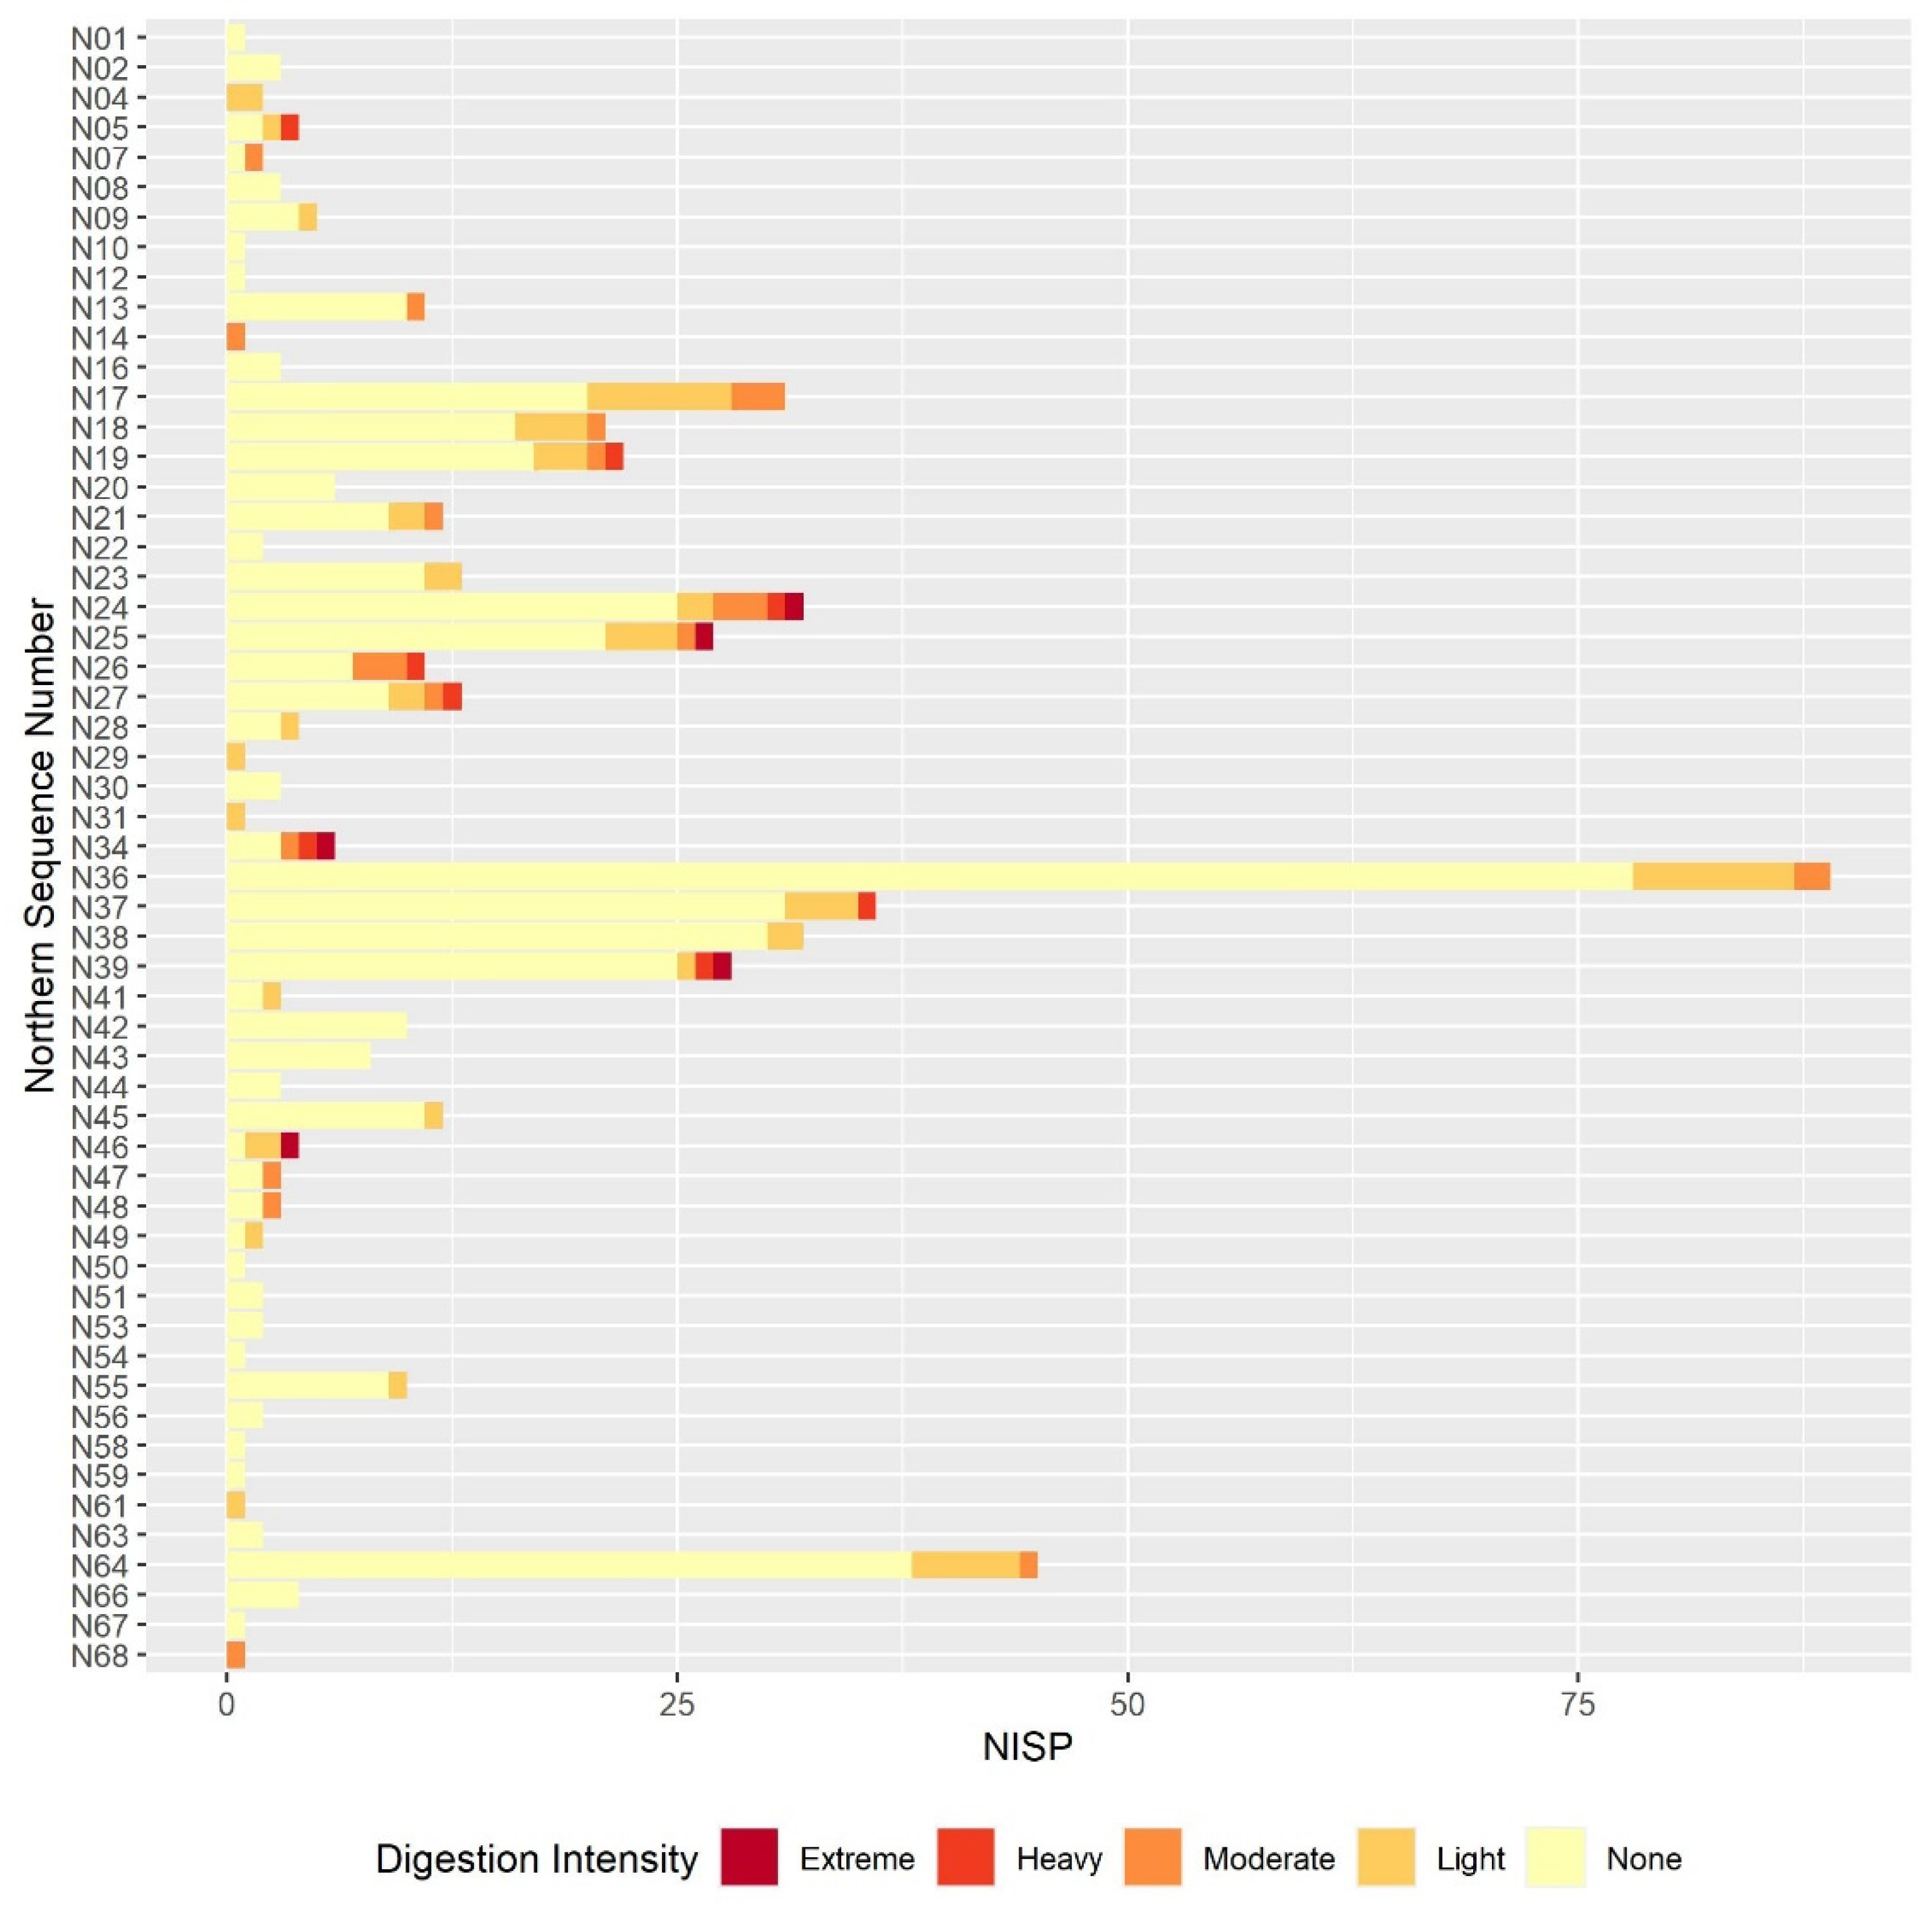
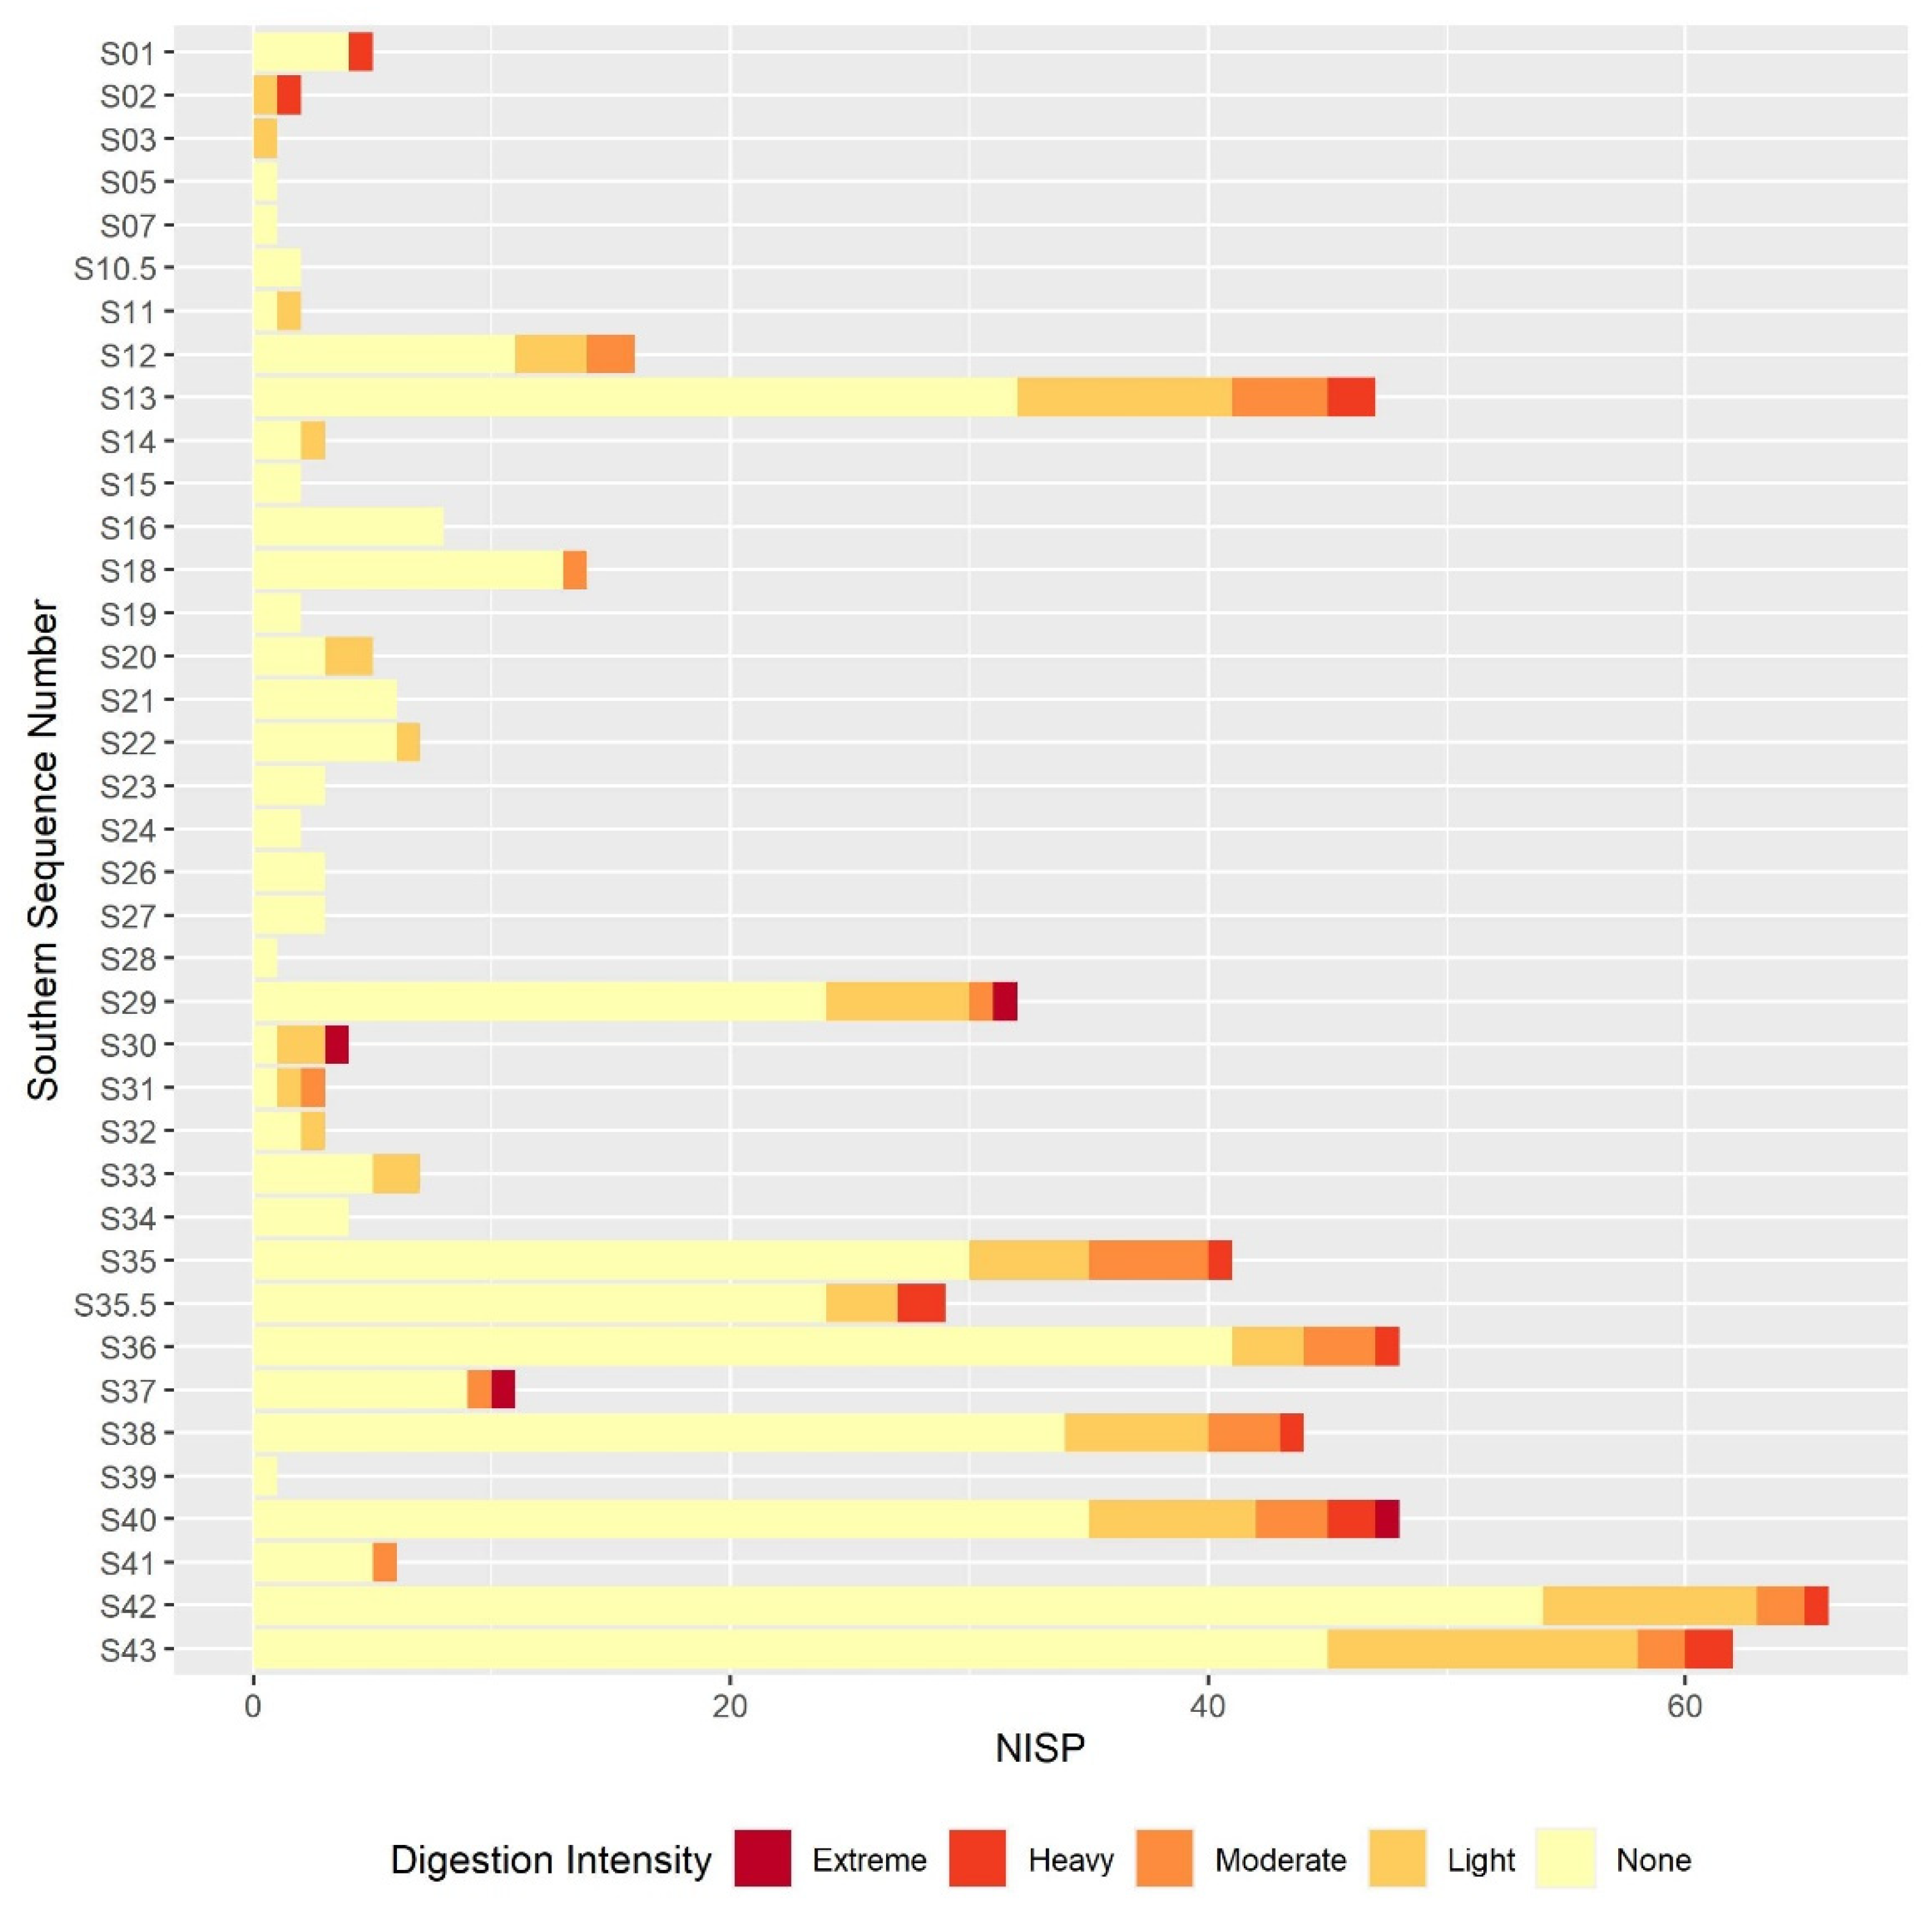
Postcranial and tooth breakage patterns were compared to investigate whether any parts of the sequence showed similar patterns of breakage in both elements. There did not appear to be any particularly strong correlation between the two datasets, though the absence of postcranial data for certain parts of the sequence, where no humeri or femora were recovered, makes comparisons throughout the whole sequence hard. The postcrania were generally much more fragmented than the teeth, which is to be expected given the more delicate nature of these elements. Something that did seem to be evident from the fragmentation and breakage data is that there was a slight decline in the proportion of broken teeth, loose teeth, and broken postcrania in the lower sample columns (Sample Column N1 and Area SH19GS) and lower sections of the northern sequence.

3.2. Digestion

3.2.1. Humeri and Femora Results

Digestion on the long bones is generally most evident at the epiphyses. A subset of the overall postcranial dataset was taken, with only the distal epiphysis of the humerus and the proximal epiphysis of the femur examined for signs of digestion. Overall, 67.7% of the humeri and femora surveyed showed no signs of digestion and a further 26.5% only light. Although some specimens with higher digestion intensities were recorded, they accounted for only 5.8% of the whole humeri and femora assemblage.
These data can be broken down further by element, as shown in Table 5. The data are presented as independent proportions of the overall humeri and femora assemblage and as a cumulative proportion. Similar numbers of each element were examined: 343 femora and 336 humeri. The data here show that generally lower degrees of digestion were observed on humeri than on femora, with 82.1% of the humeri showing no signs of digestion in comparison to 53.4% of the femora. It should also be noted that no specimens displaying heavy or extreme digestion were observed in the humeri. Similar numbers of each element were examined—343 femora and 336 humeri—so we can be confident that these patterns are not an artefact of relatively small sample size in one of the elements. It is possible that the distal epiphysis of the humerus is generally denser, and more robust to digestion than the proximal epiphysis of the femur. An additional explanation is that the proximal epiphysis of the femur fuses later than the distal humerus, and so unfused or fusing epiphyses were mistaken for or exacerbated by digestion.
The results of the digestion intensity analysis for the humeri and femora assemblage are presented in Figure 3 and Figure 4, respectively. Overall, the majority of samples in each sequence displayed relatively low digestion intensities, with the majority of each sequence unit showing either no or light digestion. In the southern sequence, no humeri or femora samples displaying extreme digestion were observed, and only one heavily digested specimen. It was difficult to discern any sequence units with particularly distinct digestion patterns, although some areas of both sequences seemed to have relatively higher proportions of more severe digestion. These areas also had relatively small sample sizes.

3.2.2. Molar Results

A large number of molars were too incomplete to discern whether any digestion marks were present, or the molar was obscured by large amounts of sediment. In these cases, digestion was recorded as N/A (not applicable) and not included in these results. Examples of molars displaying the different digestion intensities are shown in Figure 5.
A breakdown of the overall assemblage molar digestion data is shown in Table 6. Overall, more severe levels of digestion intensity were very low: 80% of the isolated molars surveyed had no signs of digestion and 13.2% light evidence, with less than 8% of molars displaying signs of more intense digestion than this. The in situ molars also displayed even lower levels of digestion intensity than the isolated molars, which is to be expected given that isolated molars are generally more exposed and digested. Given the very small sample size of in situ molars, they are excluded from the datasets disaggregated by sample column, unit, or area.
When these data are broken down further into broad sample columns or area groups, a little more variation in the observed digestion intensities can be seen (Table 7). In all areas except in Sample Column L, over 70% of molars showed no signs of digestion, and in all areas except in Sample Column L and Sample Column B1, over 90% of molars showed light or no signs of digestion. This variation in digestion intensity may be partially explained by the extreme variations in sample size; in Sample Column L, only four molars were examined for digestion and in Sample Column B1, 14.
The effect of sample size is evident when the assemblage is broken down further into the northern and southern sequence units, presented in Figure 6 and Figure 7. Broadly, most sequence units showed mostly no, or light, digestion, though there are a few that appeared to show higher proportions of more severe digestion. For example, in N34, S02, and S30, at least 50% of all specimens showed signs of digestion, including moderate or more severe digestion, but all three of these sequence units had very small sample sizes, of fewer than five specimens. There was perhaps a decrease in digestion intensity towards the base of the northern sequence and the top of the southern sequence, with a greater proportion of molars showing no digestion. However, these two areas also coincided with relatively small sample sizes, which may be a significant biasing factor.

3.2.3. Comparison between the Postcranial and the Molar Digestion Patterns

Overall, the digestion data from both molars and postcrania displayed similar patterns of no or relatively low digestion levels. In both cases, certain sample columns or areas and certain sequence units did appear to have relatively high proportions of more severe digestion, but it is difficult to determine whether this is a genuine signal, or simply the effect of small sample size. Humeri and femora remains did display slightly lower proportions of elements with no observed digestion compared to the molars, though similar levels of elements showed light or no digestion. It is unlikely that this disparity indicates anything unusual about the taphonomic processes affecting the humeri and femora material versus the molars in the Shanidar Cave assemblage, as the former has widely been observed to display digestion more readily than molars in other assemblages.
A possible confounding factor in the recorded molars and humeri and femora digestion intensities is the increased fragility of more heavily digested molars. The erosion of the stronger enamel layers leaves the molars more susceptible to fragmentation, which in turn makes the element less likely to survive to be recovered during the excavation and sorting process. As such, it is possible that certain samples displayed artificially low levels of digestion due to the difference in the recoverability of severely digested elements.

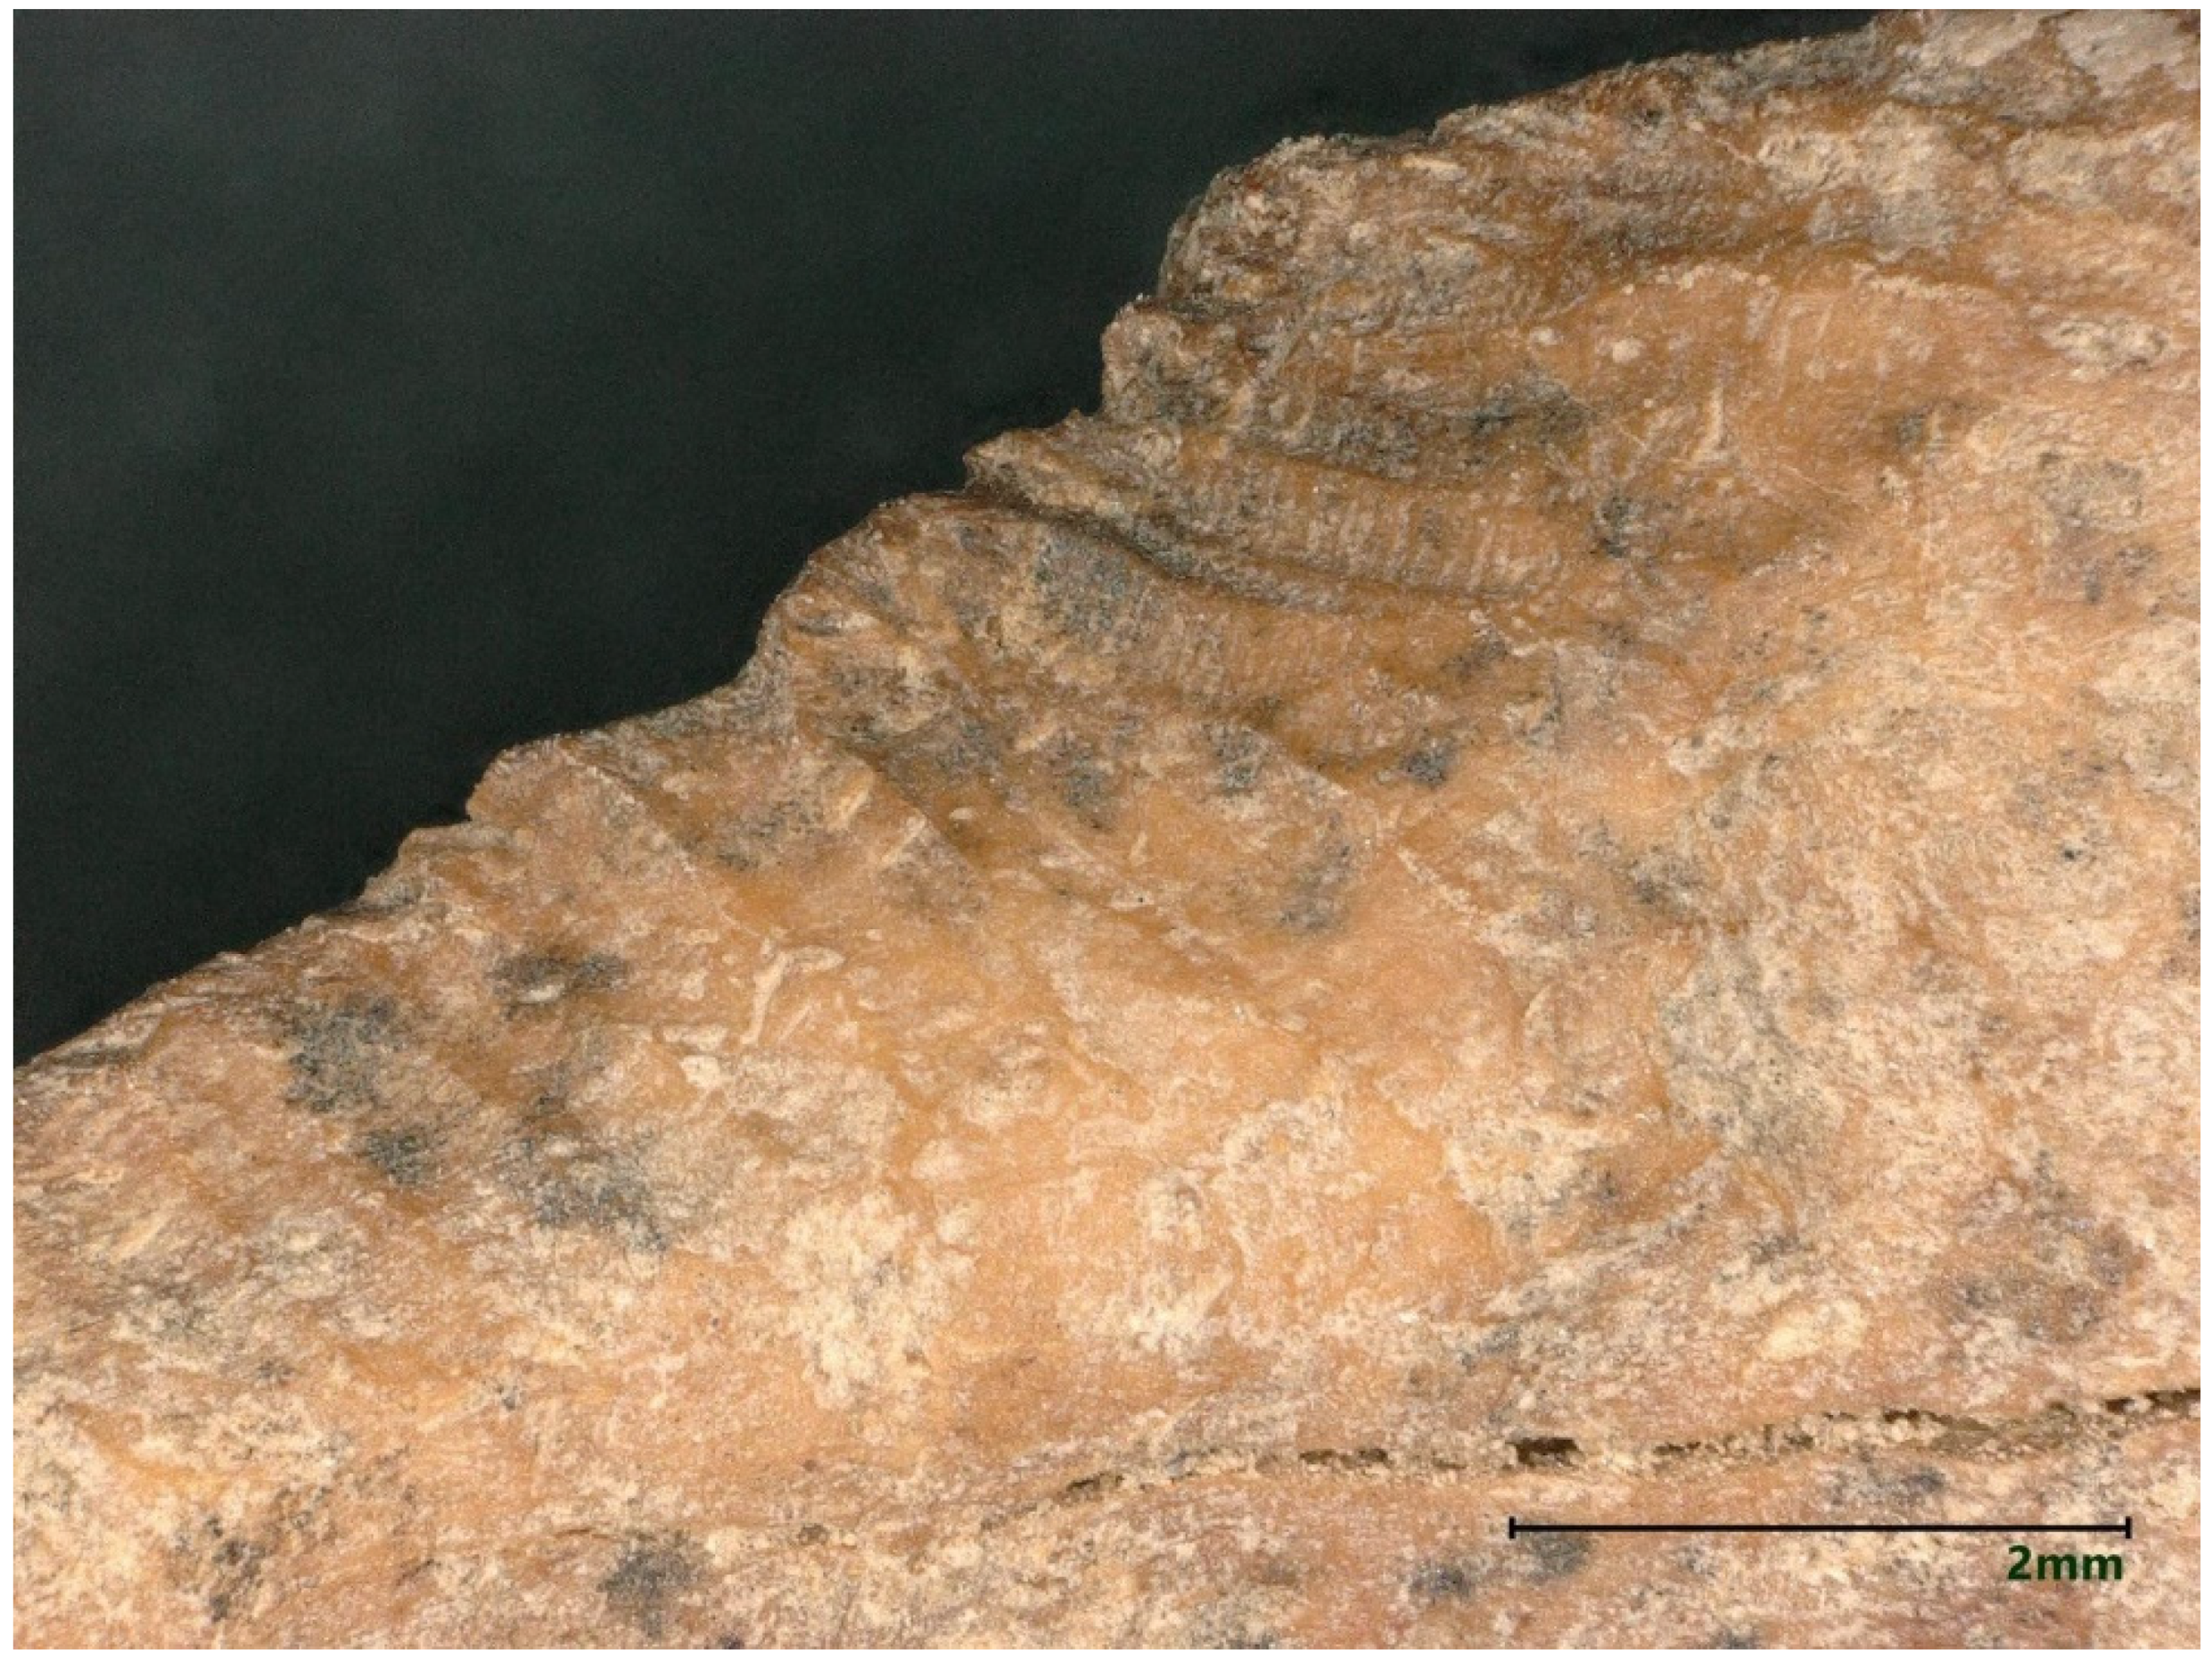
3.3. Other Taphonomic Marks

Although the more systematic data collection was aimed at investigating breakage patterns and digestion, data on other taphonomic marks were also collected. Burning was recorded on 58 teeth specimens, five humeri, and four femora specimens. On occasion, burnt teeth, humeri, or femora appeared to be the result of being in close proximity to hearths, with all specimens showing signs of burning, but more commonly burnt specimens appeared sporadically across the sequence in context with unburnt material, likely as a result of fluvial or aeolian processes leading to the dispersal of burnt remains. A commonly observed taphonomic mark was manganese oxide staining or spotting of teeth. This was observed on 89 tooth specimens across all levels of the sequence, though there did appear to be a higher proportion of teeth showing this marking in the lower part of Sample Column N and Sample Column N1. Manganese spotting has been attributed to a number of sedimentary processes, including the deposition of organic matter and relatively damp conditions [38,45,47]. Root etching on larger faunal remains and larger microvertebrate postcranial fragments was also observed, and this again was more common in the lowest layers of the sequence.
Although the analysis of larger fauna was outside the scope of the project, the highly fragmentary nature of the zooarchaeological assemblage meant that micro and macro remains were generally bagged together, giving the opportunity to briefly examine these larger fragments when sorting. As a result, although the data collection of large mammal bones was not systematic, it was occasionally possible to record the presence of rodent gnawing on fragments of bone, as seen in Figure 8. Although data collection here was not systematically completed, this finding is significant, as it indicates that rodents inhabited the cave at certain times in the past. Here we can see how hominins may have disrupted the ecology of the cave by their presence. Faunal data from the original excavations indicates that large numbers of ungulates were being consumed in the cave: Over 90% of the faunal assemblage studied by Perkins was Ovis orientalis, Capra hircus aegagrus, and Cervus elaphus [21]. It is possible that the presence of discarded food remains in the cave may have encouraged the presence of rodents and other scavenging species. This also has implications for the interpretation of other taphonomic data from the cave. Within Andrews’ framework, for example, the absence of digestion marks could be taken as evidence of certain species of avian predator: Tyto alba, for example, leaves no or only light digestion marks. The presence of gnawed bones may indicate that these undigested specimens are from rodent specimens that inhabited the cave and died a more “natural” death, though it is equally possible that these rodents were temporary visitors to the site and died elsewhere.

4. Discussion

The results of this preliminary analysis suggest that in most respects the taphonomic processes affecting the microvertebrate assemblage remain constant throughout the sequence. Certain individual sequence units do appear to have particularly distinct digestion or breakage patterns, but these are generally extremely small units. If these extremely small sequence units are excluded, the overall picture of the assemblage is one of high fragmentation and low digestion intensity throughout the sequence. The only exception to this continuity is the slight decline in fragmentation in the lower contexts that are dated to the earlier phases of the sequence. The majority of humeri and femora are still broken, and most teeth are still loose from the jaw but there is a small reduction in the overall proportion in each case. This is best illustrated in the teeth breakage data, with the proportion of teeth broken in the lowest sample column and area half that of the proportion in the highest sample columns. There are multiple possible causes of the high fragmentation rates, including rockfall, trampling, predation, and sediment movement. Although some predators, such as diurnal raptors and mammalian carnivores, can produce very high levels of fragmentation [45], they are unlikely to be the cause in this case. Predators that produce high levels of fragmentation generally leave more intensive digestive marks on the teeth, and this does not seem to be the case in the Shanidar Cave assemblage. Indeed, many of the incomplete specimens examined display no traces of digestion.
Extensive rockfall is visible throughout most of the assemblage, particularly in the upper layers, and these high energy rockfall events are likely to be responsible for most of the observed fragmentation. Geomorphological analyses to determine the exact nature and causes of these repeated rockfall events are ongoing. One current explanation is that they are associated with colder, arid periods, as they are generally absent from the lowest layers of the sequence [27]. Relatively warmer, humid conditions are also indicated by the presence of increased manganese dioxide staining in these layers. These lower layers are present at the bottom of the northern sequence only, as the southern sequence does not extend as deep. This is significant because the northern sequence is located towards the back of the cave, further away from the entrance than the southern sequence. The presence of manganese staining and root etching indicates that the warm and humid conditions extended quite far into the cave, enough to support some plant growth. Although dating for the lowest layers is still ongoing, preliminary dates suggest that these sediments below the lower Neanderthal cluster are older than 70,000 years BP. This would place these sediments in the range of Marine Isotope Stage 5a, a period of relatively warmer conditions. Further palaeoecological analyses of the microvertebrate assemblage and other environmental samples are needed to confirm these warmer conditions, but these results present an intriguing starting point.
Results from the digestion analyses also show no large-scale changes in digestion intensity, or at least none that can be distinguished from others due to the small sample size. In the molars and, to a slightly lesser degree, the humeri and femora, the majority of specimens show no signs of digestion, with the next most commonly occurring digestion category of light. The presence of occasional more heavily digested specimens indicates that at least one predator is responsible for at least part of the assemblage accumulation, and that this predator is likely to be a category 1 or 2 predator following Andrews’ classification of different predators’ modification of microvertebrate teeth, humeri and femora [40], though further analyses of the incisors and other microvertebrate taxa will be needed to confirm this. The proportion of digested molars does not closely match the proportions seen in modern predators, except for the Eurasian eagle owl (Bubo bubo), the tawny owl (Strix aluco), and possibly the barn owl (Tyto alba), long-eared owl (Asio otus), and short-eared owl (Asio flammeus) [44]. These species can be found in present-day Iraq; B. Bubo and T. alba are resident year-round, whereas S. alucois, A. otus, and A. flammeus are much rarer and present only in the winter [48]. None of these species are reported in Hesse’s preliminary list of microvertebrates reported in Appendix B of Evins’ 1981 report [22]. It should be noted that absence of physical evidence of the predator responsible is not necessarily evidence of absence, and that we would not generally expect the remains of the predator responsible to be found among the prey fossils. The only bird of prey found was a kestrel, Falco cf. tinnunculus [22]. If Falco was responsible for assemblage accumulation, a much higher proportion of digested molars would be expected (~53%), and those that were digested would be categorized as heavily digested. S. aluco also produces teeth that would be categorized as heavily digested, and so is unlikely to be the primary contributor to the assemblage. B. bubo produces a lower proportion of teeth displaying any digestion, though those teeth still tend to be more heavily digested than those examined in the Shanidar Cave assemblage [44]. B. bubo nests in rocky habitats, cliffs, and small caves, and hunts over open habitats, very similar to the karstic landscape around Shanidar Cave. Attempts were made during the excavation seasons to collect owl pellets in order to understand the local avian predator community and diet. Unfortunately, no pellets have been recovered to date, though it is possible that some may be recovered in future excavation seasons. A motion-activated trail camera was placed in the cave during the 2018 excavation season. It recorded images of a larger owl species visiting the cave, but the image quality was too low to allow specific identification. Preliminary taphonomic analysis of the small mammal assemblage of Kaldar Cave (approximately 500 km northwest of Shanidar Cave) found a high proportion of digested elements in the assemblage, and also considered S. aluco and B. bubo to be possible contributors to the assemblage [49,50]. The high proportion of arvicoline teeth in the assemblage may be indicative of certain predators with a preference for this taxon. Several avian predators have been reported as preferring arvicolids, in particular Asio otus, A. flammeus, and Strix nebulosa [40]. The latter is not currently found in the region, but both A. otus and A. flammeus are known to visit the region in winter [48].
Although no owl pellets were collected from the local area of Shanidar Cave, a recent taphonomic study of T. alba was carried out in Birecik, Turkey, approximately 550 km west of Shanidar Cave [51]. The study found that the T. alba prey assemblage was dominated by Meriones tristrami, followed by Mus musculus. Species from both genera were also recovered from the Shanidar Cave assemblage (see Table 1), and a similarly low level of digestion intensity was observed in both assemblages. Microtus dominates the Shanidar Cave assemblage, and was not recovered from the Birecik T. alba prey assemblage. Microtus is known to be taken by T. alba in the wider region; a 2006 study of T. alba pellets in the Beit She’an Valley (approximately 890 km southwest of Shanidar Cave) found that Microtus accounted for 19.9% of the total prey MNI, with Meriones accounting for 32.3% and Mus 37.3% [52]. The difference between the two studies is unlikely to be due to season of capture, as the Birecik pellets were collected in June and the Beit She’an in July. The Beit She’an study noted a large difference in recovery of Microtus between different study sites that was not observed in Mus or Meriones, and so it is possible that the lack of Microtus in the Birecik study is due to a lack of vole populations in the study area. T. alba is a category 1 predator that produces absent or minimal digestion of the microfaunal remains. This broadly matches the pattern seen in the Shanidar Cave assemblage. Occasional specimens with more intense digestion have been recorded in the Shanidar Cave assemblage, though as demonstrated by Williams [53], there is variation in digestion intensity between different T. alba individuals depending on age and other factors.
The results of the taphonomic analysis with respect to predation are not conclusive. The digestion patterns, landscape, and predators present in the region today suggest that the eagle owl is the most likely predator responsible for assemblage accumulation out of the avian species listed above, though the digestion intensities reported in the literature are slightly higher than those observed here. It should be recognised that the assemblage is being analysed over very large temporal ranges, and it is possible that other predators occasionally contributed to the assemblage at different points, which may explain the occasional teeth and bones displaying more intense digestion. As the agent of accumulation is uncertain, it is difficult to be confident that the community composition observed in any palaeoecological analyses is a genuine ecological rather than taphonomic signal. The taxonomic identification of microvertebrate specimens is outside the scope of this paper, but generally speaking, arvicolines dominate the assemblage. Arvicolines are known to dominate the diet of several avian predators [44], but can also reach very high population densities in the landscape, and so it is difficult to know whether their presence is due to predator bias. Further studies of predator distribution, hunting behaviour, and preferences in the region are needed to resolve this problem.
Occasional animal burrows have been observed during excavation. Some of these are likely to have occurred during and following the 1950s excavations, when the trench walls were more accessible. Burrowing taxa are present in the preliminary faunal list, for example, Microtus, Meriones, and Ellobius, and may be responsible for some of these burrows, though many of these taxa more commonly construct burrows in open areas rather than within caves. Repeated rockfall throughout the sequence has resulted in very rocky sediments that may be unsuitable for some burrowing rodent taxa. Further data on the shape, depth and, where possible, age, of these burrows, and the palynological data from their sediments, will help to determine which are modern and which taxa may be responsible.

5. Conclusions

The preliminary taphonomic results presented here are indicative of relatively constant taphonomic processes throughout the length of the sequence at Shanidar Cave exposed in the new excavations, spanning from MIS 5a to MIS 3. There are no extreme changes in taphonomy, though there does appear to be a gradual increase in rockfall damage towards the upper layers alongside a decrease in manganese staining and root etching. This slight shift is suggestive of relatively wet, warm conditions in the lower levels. Early faunal data appear to support this, with increased proportions of taxa found in wetland and more vegetated habitats found in these lower levels. Further palaeoecological analyses will need to be conducted to confirm this. In terms of the agent of accumulation, digestion of the teeth is rare and generally of a low intensity throughout the sequence. Several avian predator species are recorded as being present in the region, but current records of the digestion intensity left on microvertebrate teeth and bones by these species does not closely match those observed in the Shanidar Cave assemblage. Further surveys of the hunting behaviour of avian predators of the region are needed to identify the agent of accumulation of microvertebrates in this assemblage. Further taxonomic and taphonomic work on the Shanidar Cave microvertebrate assemblage, focusing in particular on the non-arvicolines and postcranial elements, is required to produce a more complete account of the taphonomic history of the cave.

Supplementary Materials

The following are available online at https://www.mdpi.com/article/10.3390/quat5010004/s1, Figure S1. The proportion of femora that were broken in the northern sequence, Figure S2. The proportion of humeri that were broken in the northern sequence, Figure S3. The proportion of femora that were broken in the southern sequence, Figure S4. The proportion of humeri that were broken in the southern sequence, Figure S5. Proportion of isolated teeth broken by sequence unit in the northern sequence, Figure S6. Proportion of isolated teeth broken by sequence unit in the southern sequence, Table S1: Murid digestion intensity, Table S2: Sample column or area humerus data, Table S3: Sample column or area femur data, Table S4: Northern sequence femur data, Table S5: Northern sequence humerus data, Table S6: Southern sequence femur data, Table S7: Southern sequence humerus data, Table S8: Northern sequence arvicoline isolated molar digestion data, Table S9: Southern sequence arvicoline isolated molar digestion data, Table S10: Northern sequence arvicoline in situ molar digestion data, Table S11: Southern sequence arvicoline in situ molar digestion data, Table S12: Sample column or area dentition breakage data, Table S13: Northern sequence dentition breakage data, Table S14: Southern Sequence dentition breakage data, Table S15: Sample column or area arvicoline isolated molar digestion data, Table S16: Sample column or area arvicoline in situ molar digestion data.

Author Contributions

Conceptualization, E.T.; methodology, E.T.; software, E.T.; formal analysis, E.T.; investigation, E.T.; resources, E.T., P.M. and G.B.; writing—original draft preparation, E.T.; writing—review and editing, E.T., P.M. and G.B.; visualization, E.T.; supervision, P.M. and G.B.; project administration, E.T. and G.B.; funding acquisition, E.T., P.M. and G.B. All authors have read and agreed to the published version of the manuscript.

Funding

Doctoral research was funded by the Natural Environment Research Council, grant number NE/L002507/1. The overall Shanidar Cave Project has received funding from the Leverhulme Trust (Research Grant RPG-2013-105), the Rust Family Foundation, the British Academy, the Wenner-Gren Foundation, the Society of Antiquaries, the McDonald Institute of Archaeological Research at the University of Cambridge, and the Natural Environment Research Council’s Oxford Radiocarbon Dating Facility (grant NF/2016/2/14). The ongoing dating programme has also been supported by the European Research Council under the European Union’s Seventh Framework Programme (FP7/2007–2013)/ERC grant agreement number 324139 “PalaeoChron” awarded to Tom Higham, University of Oxford.

Data Availability Statement

Data are available within this article, in the supplementary materials and on request from the corresponding author.

Acknowledgments

We wish to thank the Kurdistan Regional Government for the original invitation to G.B. to plan new excavations at Shanidar Cave, and the Kurdistan General Directorate of Antiquities for permission to conduct these excavations and to study the finds, as well as for invaluable logistical support. In particular, we thank the General Director Mala Awat and his successor Kaifi Mustafa Ali, the Director for the Soran District Abdulwahab Suleiman, and the on-site inspectors from the Soran District Directorate of Antiquities, Dlshad Abdulmutalb and Jeghir Khalil. E.T. wishes to thank Jessica Rippengal and Catherine Kneale for technical and laboratory support, Ruairidh Macleod for reviewing drafts and coding support, Evan Hill for providing Figure 2 and useful discussion, and past and present members of the Grahame Clark Zooarchaeology Laboratory. We thank our colleagues of the Shanidar Cave Project field team for help and support in the field and post-excavation, particularly Chris Hunt, Tim Reynolds, Paul Bennett, Lucy Farr, Emma Pomeroy, Evan Hill, James Holman, Ross Lane, Jessica Twyman, and Andreas Nymark. We also wish to thank the general editors, in particular E. Stoetzel, and three anonymous reviewers for their support, useful comments, and suggestions.

Conflicts of Interest

The authors declare no conflict of interest.

References

  1. Stahl, P.W. The recovery and interpretation of microvertebrate bone assemblages from archaeological contexts. J. Archaeol. Method Theory 1996, 3, 31–75. [Google Scholar] [CrossRef]
  2. Lyman, R.L. Vertebrate Taphonomy; Cambridge Manuals in Archaeology; Cambridge University Press: Cambridge, UK, 1994; ISBN 978-0-521-45840-5. [Google Scholar]
  3. Fiacconi, M.; Hunt, C.O. Pollen taphonomy at Shanidar Cave (Kurdish Iraq): An initial evaluation. Rev. Palaeobot. Palynol. 2015, 223, 87–93. [Google Scholar] [CrossRef]
  4. Solecki, R.S. Prehistory in Shanidar Valley, Northern Iraq. Science 1963, 139, 179–193. [Google Scholar] [PubMed]
  5. Becerra-Valdivia, L.; Douka, K.; Comeskey, D.; Bazgir, B.; Conard, N.J.; Marean, C.W.; Ollé, A.; Otte, M.; Tumung, L.; Zeidi, M.; et al. Chronometric investigations of the Middle to Upper Paleolithic transition in the Zagros Mountains using AMS radiocarbon dating and Bayesian age modelling. J. Hum. Evol. 2017, 109, 57–69. [Google Scholar] [CrossRef]
  6. Solecki, R.S. Notes on a brief archaeological reconnaissance of cave sites in the Rowanduz district of Iraq. Sumer 1952, 8, 37–48. [Google Scholar]
  7. Solecki, R.S. A palaeolithic site in the Zagros Mountains of Northern Iraq, report on a sounding at Shanidar Cave: Part I. Sumer 1952, 8, 127–192. [Google Scholar]
  8. Solecki, R.S. A palaeolithic site in the Zagros Mountains of Northern Iraq, report on a sounding at Shanidar Cave: Part II. Sumer 1953, 9, 60–93. [Google Scholar]
  9. Solecki, R.S. Shanidar Cave, a Paleolithic site in Northern Iraq. In Annual Report of the Smithsonian Institution, 1954; Annual Report of the Smithsonian Institution; Smithsonian Institution: Washington, DC, USA, 1955; pp. 389–425. [Google Scholar]
  10. Solecki, R.S. Three adult Neanderthal skeletons from Shanidar Cave, Northern Iraq. In Annual Report of the Smithsonian Institution, 1959; Annual Report of the Smithsonian Institution; Smithsonian Institution: Washington, DC, USA, 1960; pp. 603–635. [Google Scholar]
  11. Solecki, R.S. New anthropological discoveries at Shanidar, Northern Iraq. Trans. N. Y. Acad. Sci. 1961, 23, 690–699. [Google Scholar] [CrossRef]
  12. Solecki, R.S.; Leroi-Gourhan, A. Palaeoclimatology and archaeology in the Near East. Ann. N. Y. Acad. Sci. 1961, 95, 729–739. [Google Scholar] [CrossRef]
  13. Cowgill, L.W.; Trinkaus, E.; Zeder, M.A. Shanidar 10: A Middle Paleolithic immature distal lower limb from Shanidar Cave, Iraqi Kurdistan. J. Hum. Evol. 2007, 53, 213–223. [Google Scholar] [CrossRef] [PubMed]
  14. Trinkaus, E. The Shanidar Neandertals; Academic Press: New York, NY, USA, 1983. [Google Scholar]
  15. Dettwyler, K.A. Can paleopathology provide evidence for “compassion”? Am. J. Phys. Anthropol. 1991, 84, 375–384. [Google Scholar] [CrossRef] [PubMed]
  16. Solecki, R.S. Shanidar: The Humanity of Neanderthal Man; Allen Lane The Penguin Press: London, UK, 1971; ISBN 978-0-7139-0306-5. [Google Scholar]
  17. Trinkaus, E.; Zimmerman, M.R. Trauma among the Shanidar Neandertals. Am. J. Phys. Anthropol. 1982, 57, 61–76. [Google Scholar] [CrossRef] [PubMed]
  18. Leroi-Gourhan, A. The flowers found with Shanidar IV, a Neanderthal burial in Iraq. Science 1975, 190, 562–564. [Google Scholar] [CrossRef]
  19. Solecki, R.S. The implications of the Shanidar cave Neanderthal flower burial. Ann. N. Y. Acad. Sci. 1977, 293, 114–124. [Google Scholar] [CrossRef]
  20. Sommer, J.D. The Shanidar IV ‘flower burial’: A re-evaluation of Neanderthal burial ritual. Camb. Archaeol. J. 1999, 9, 127–129. [Google Scholar] [CrossRef]
  21. Perkins, D. Prehistoric fauna from Shanidar, Iraq. Science 1964, 144, 1565–1566. [Google Scholar] [CrossRef]
  22. Evins, M. A Study of the Fauna from the Mousterian Deposits at Shanidar Cave, Northeastern Iraq. Master’s Thesis, University of Chicago, Chicago, IL, USA, 1981. [Google Scholar]
  23. Evins, M. The fauna from Shanidar Cave: Mousterian wild goat exploitation in Northeastern Iraq. Paléorient 1982, 8, 37–58. [Google Scholar] [CrossRef]
  24. Reynolds, T.; Boismier, W.; Farr, L.; Abdulmutalb, D.; Barker, G. New investigations at Shanidar Cave, Iraqi Kurdistan. In The Archaeology of the Kurdistan Region of Iraq and Adjacent Regions; Kopanias, K., MacGinnis, J., Eds.; Archaeopress: Oxford, UK, 2016; pp. 369–372. ISBN 978-1-78491-394-6. [Google Scholar]
  25. Hunt, C.O.; Hill, E.A.; Reynolds, T.; Abdulmutalb, D.; Farr, L.; Lane, R.; Szabó, K.; Barker, G. An incised shell object from Baradostian (Early Upper Palaeolithic) layers in Shanidar Cave, Iraqi Kurdistan. J. Archaeol. Sci. Rep. 2017, 14, 318–322. [Google Scholar] [CrossRef]
  26. Pomeroy, E.; Mirazón Lahr, M.; Crivellaro, F.; Farr, L.; Reynolds, T.; Hunt, C.O.; Barker, G. Newly discovered Neanderthal remains from Shanidar Cave, Iraqi Kurdistan, and their attribution to Shanidar 5. J. Hum. Evol. 2017, 111, 102–118. [Google Scholar] [CrossRef]
  27. Pomeroy, E.; Bennett, P.; Hunt, C.O.; Reynolds, T.; Farr, L.; Frouin, M.; Holman, J.; Lane, R.; French, C.; Barker, G. New Neanderthal remains associated with the ‘flower burial’ at Shanidar Cave. Antiquity 2020, 94, 11–26. [Google Scholar] [CrossRef] [Green Version]
  28. Pomeroy, E.; Hunt, C.O.; Reynolds, T.; Abdulmutalb, D.; Asouti, E.; Bennett, P.; Bosch, M.; Burke, A.; Farr, L.; Foley, R.; et al. Issues of theory and method in the analysis of Paleolithic mortuary behavior: A view from Shanidar Cave. Evol. Anthropol. 2020, 29, 263–279. [Google Scholar] [CrossRef]
  29. Friedman, I.; Smith, R.L. Part I, the development of the method. Am. Antiq. 1960, 25, 476–493. [Google Scholar] [CrossRef]
  30. Brothwell, D.R.; Jones, R. The relevance of small mammal studies to archaeology. In Research Problems in Zooarchaeology; Routledge: London, UK; Institute of Archaeology: London, UK, 1978; pp. 47–57. [Google Scholar]
  31. Cucchi, T.; Papayianni, K.; Cersoy, S.; Aznar-Cormano, L.; Zazzo, A.; Debruyne, R.; Berthon, R.; Bălășescu, A.; Simmons, A.; Valla, F.; et al. Tracking the Near Eastern origins and European dispersal of the Western house mouse. Sci. Rep. 2020, 10, 8276. [Google Scholar] [CrossRef] [PubMed]
  32. O’Connor, T. Animals as Neighbors: The Past and Present of Commensal Species; Michigan State University Press: East Lansing, MI, USA, 2013. [Google Scholar]
  33. Avery, D.M. Micromammals and paleoenvironmental interpretation in Southern Africa. Geoarchaeology 1988, 3, 41–52. [Google Scholar] [CrossRef]
  34. Belmaker, M.; Bar-Yosef, O.; Belfer-Cohen, A.; Meshveliani, T.; Jakeli, N. The environment in the Caucasus in the Upper Paleolithic (Late Pleistocene): Evidence from the small mammals from Dzudzuana cave, Georgia. Quat. Int. 2016, 425, 4–15. [Google Scholar] [CrossRef]
  35. Belmaker, M.; Hovers, E. Ecological change and the extinction of the Levantine Neanderthals: Implications from a diachronic study of micromammals from Amud Cave, Israel. Quat. Sci. Rev. 2011, 30, 3196–3209. [Google Scholar] [CrossRef]
  36. Maul, L.C.; Smith, K.T.; Barkai, R.; Barash, A.; Karkanas, P.; Shahack-Gross, R.; Gopher, A. Microfaunal remains at Middle Pleistocene Qesem Cave, Israel: Preliminary results on small vertebrates, environment and biostratigraphy. J. Hum. Evol. 2011, 60, 464–480. [Google Scholar] [CrossRef] [PubMed]
  37. Smith, K.T.; Maul, L.C.; Flemming, F.; Barkai, R.; Gopher, A. The microvertebrates of Qesem Cave: A comparison of the two concentrations. Quat. Int. 2016, 398, 233–245. [Google Scholar] [CrossRef]
  38. López-González, F.; Grandal-d’Anglade, A.; Vidal-Romaní, J.R. Deciphering bone depositional sequences in caves through the study of manganese coatings. J. Archaeol. Sci. 2006, 33, 707–717. [Google Scholar] [CrossRef]
  39. Fernández-Jalvo, Y.; Andrews, P.; Sevilla, P.; Requejo, V. Digestion versus abrasion features in rodent bones. Lethaia 2014, 47, 323–336. [Google Scholar] [CrossRef]
  40. Andrews, P. Owls, Caves and Fossils; The University of Chicago Press: Chicago, IL, USA, 1990; ISBN 978-0-565-01118-5. [Google Scholar]
  41. Fernández-Jalvo, Y.; Scott, L.; Andrews, P. Taphonomy in palaeoecological interpretations. Quat. Sci. Rev. 2011, 30, 1296–1302. [Google Scholar] [CrossRef]
  42. Mayhew, D.F. Avian predators as accumulators of fossil mammal material. Boreas 1977, 6, 25–31. [Google Scholar] [CrossRef]
  43. Denys, C.; Stoetzel, E.; Andrews, P.; Bailon, S.; Rihane, A.; Huchet, J.B.; Fernández-Jalvo, Y.; Laroulandie, V. Taphonomy of small predators multi-taxa accumulations: Palaeoecological implications. Hist. Biol. 2018, 30, 868–881. [Google Scholar] [CrossRef]
  44. Fernández-Jalvo, Y.; Andrews, P.; Denys, C.; Sesé, C.; Stoetzel, E.; Marin-Monfort, D.; Pesquero, D. Taphonomy for taxonomists: Implications of predation in small mammal studies. Quat. Sci. Rev. 2016, 139, 138–157. [Google Scholar] [CrossRef]
  45. Fernández-Jalvo, Y.; Andrews, P. Atlas of Taphonomic Identifications: 1001+ Images of Fossil and Recent Mammal Bone Modification; Springer: New York, NY, USA, 2016. [Google Scholar]
  46. Jenkins, E.L. Unwanted Inhabitants? The Microfauna from Çatalhöyük and Pınarbası; VDM: Saarbrücken, Germany, 2009; ISBN 978-3-639-11213-9. [Google Scholar]
  47. Marín Arroyo, A.B.; Landete Ruiz, M.D.; Vidal Bernabeu, G.; Seva Román, R.; González Morales, M.R.; Straus, L.G. Archaeological implications of human-derived manganese coatings: A study of blackened bones in El Mirón Cave, Cantabrian Spain. J. Archaeol. Sci. 2008, 35, 801–813. [Google Scholar] [CrossRef]
  48. Porter, R.; Salim, M.; Ararat, K. A provisional checklist of the birds of Iraq. Marsh Bull. 2010, 5, 56–95. [Google Scholar]
  49. Bazgir, B.; Ollé, A.; Tumung, L.; Becerra-Valdivia, L.; Douka, K.; Higham, T.; Van Der Made, J.; Picin, A.; Saladié, P.; López-Garciá, J.M.; et al. Understanding the emergence of modern humans and the disappearance of Neanderthals: Insights from Kaldar Cave (Khorramabad Valley, Western Iran). Sci. Rep. 2017, 7, 43460. [Google Scholar] [CrossRef]
  50. Rey-Rodríguez, I.; López-García, J.-M.; Blain, H.-A.; Stoetzel, E.; Denys, C.; Fernández-García, M.; Tumung, L.; Ollé, A.; Bazgir, B. Exploring the landscape and climatic conditions of Neanderthals and Anatomically Modern Humans in the Middle East: The rodent assemblage from the Late Pleistocene of Kaldar Cave (Khorramabad Valley, Iran). Quat. Sci. Rev. 2020, 236, 106278. [Google Scholar] [CrossRef]
  51. Rey-Rodríguez, I.; Stoetzel, E.; López-García, J.M.; Denys, C. Implications of modern barn owl pellets analysis for archaeological studies in the Middle East. J. Archaeol. Sci. 2019, 111, 105029. [Google Scholar] [CrossRef]
  52. Charter, M.; Izhaki, I.; Meyrom, K.; Motro, Y.; Leshem, Y. Diets of barn owls differ in the same agricultural region. Wilson J. Ornithol. 2009, 121, 378–383. [Google Scholar] [CrossRef]
  53. Williams, J.P. Small Mammal Deposits in Archaeology: A Taphonomic Investigation of Tyto Alba (Barn Owl) Nesting and Roosting Sites. Ph.D. Thesis, University of Sheffield, Sheffield, UK, 2001. [Google Scholar]
Figure 1. Map showing the location of Shanidar Cave. Map created in R using Natural Earth raster.
Quaternary 05 00004 g001
Figure 2. Schematic of recent excavations showing the locations of the sample columns and open-plan excavation areas. The northern sequence combines samples from Sample Columns B, B1, M, N, and N1 and the lower open-plan excavation area. SH19GS samples all come from the lower open-plan excavation area, shown in the figure as the lower light-grey rectangle. The southern sequence combines samples from Sample Columns L, L1, J, J1, and R and the upper open-plan excavation area. SH18GS samples all come from the upper open-plan excavation area, shown in the figure as the upper light-grey area. Diagram created by E. Hill.
Quaternary 05 00004 g002
Figure 3. Observed femora digestion intensity in the northern (A) and southern (B) sequence. NISP: number of identifiable specimens.
Quaternary 05 00004 g003aQuaternary 05 00004 g003b
Figure 4. Observed humeri digestion intensity in the northern (A) and southern (B) sequence. NISP: number of identifiable specimens.
Quaternary 05 00004 g004aQuaternary 05 00004 g004b
Figure 5. Arvicoline molars from the Shanidar Cave assemblage displaying the different categories of digestion intensity: (a) Molar displaying no digestion marks. (b) Molar displaying light digestion marks. (c) Molar displaying moderate digestion marks. (d) Molar displaying heavy digestion marks. (e) Molar displaying extreme digestion marks. Note the manganese staining in Figure 5d,e.
Quaternary 05 00004 g005
Figure 6. Observed isolated molar digestion intensities in the northern sequence. NISP: number of identifiable specimens.
Quaternary 05 00004 g006
Figure 7. Observed isolated molar digestion intensities in the southern sequence. NISP: number of identifiable specimens.
Quaternary 05 00004 g007
Figure 8. Detail of rodent gnawing on ungulate long bone fragment.
Quaternary 05 00004 g008
Table 1. Preliminary microvertebrate faunal list from Shanidar Cave.
OrderFamilySubfamilySpecies
Rodentia
Cricetidae
Arvicolinae
Microtus socialis s.l.
Ellobius sp.
Arvicola cf. amphibius
Cricetinae
Cricetulus sp.
Mesocricetus sp.
Muridae
Murinae
Apodemus (Sylvaemus) sp.
Mus cf. musculus
Micromys sp.
GerbillinaeMeriones cf. persicus
Calomyscidae
Calomyscus sp.
Eulipotyphla
Soricidae
Crocidurinae
Crocidura cf. suaveolens
Table 2. Overall humeri and femora fragmentation data: The data are disaggregated by element and portion present.
ElementPortion PresentNumber of Specimens ExaminedProportion (%) 1
HumerusProximal epiphysis206.0
Proximal epiphysis and shaft103.0
Shaft3911.6
Distal epiphysis and shaft6720.0
Distal epiphysis 17451.8
Complete267.7
FemurProximal epiphysis 17651.3
Proximal epiphysis and shaft9527.7
Shaft247.0
Distal epiphysis and shaft72.0
Distal epiphysis 123.5
Complete298.5
UnidentifiedShaft3100
1 “Proportion”: the proportion of each fragment type relative to the overall number of fragments for each element type.
Table 3. Postcranial fragmentation data, disaggregated by sample column or area.
Sample Column or AreaFemoraHumeri
NISP% Broken 1NISP% Broken 1
Area SH18GS16590.916394.5
Area SH19GS6992.87088.6
Sample Column J4100.00-
Sample Column J12100.04100.0
Sample Column L1100.02100.0
Sample Column L13100.03100.0
Sample Column B1100.00-
Sample Column B14297.66100.0
Sample Column M4292.93894.7
Sample Column N1485.73093.3
Sample Column N111391.22085.0
Total31792.433692.9
1 “% Broken” refers to the proportion of humeri and femora specimens examined that were broken.
Table 4. Number of teeth examined in each sample column or area.
Sample Column or AreaIn SituIsolated Teeth
NISP% BrokenNISP% Broken
Sample Column B520.03053.3
Sample Column B110.02035
Sample Column J40.03151.6
Sample Column J10-850
Sample Column L0-850
Sample Column L120.05255.8
Sample Column M150.028344.2
Sample Column N714.312731.5
Sample Column N1175.912219.7
Area SH18GS5814.772836.0
Area SH19GS5614.326721.0
Total17512.0167634.8
Table 5. Observed humeri and femora digestion across the assemblage. Data presented disaggregated by element.
ElementObserved DigestionNISPProportion (%)
FemurNone18353.4
Light12536.4
Moderate267.6
Heavy72
Extreme20.6
HumerusNone27682.1
Light5616.7
Moderate41.2
Table 6. Overall assemblage observed digestion of molars.
Observed DigestionIsolated MolarsIn Situ Molars
NISPProportion (%)NISPProportion (%)
None96880.02589.3
Light16213.227.1
Moderate625.113.6
Heavy242.000
Extreme100.800
Total1226-28-
Table 7. Overall isolated arvicoline molar digestion intensities observed in each area or sample column. The observed digestion is presented as a proportion of each sample column or area.
Sample ColumnObserved Digestion (%)Total
NISP
NoneLightModerateHeavyExtreme
Sample Column B70.020.05.05.00.020
Sample Column B185.70.014.30.00.014
Sample Column J90.54.80.00.04.821
Sample Column J183.316.70.00.00.06
Sample Column L25.050.00.025.00.04
Sample Column L180.020.00.00.00.020
Sample Column M75.314.47.22.11.0194
Sample Column N81.78.51.44.24.271
Sample Column N186.111.12.80.00.072
Area SH18GS76.614.45.92.50.7611
Area SH19GS86.510.43.10.00.0193
Total79.013.25.12.00.81226
Publisher’s Note: MDPI stays neutral with regard to jurisdictional claims in published maps and institutional affiliations.

