
Innovation in Company Labor Productivity Management: Data Science Methods Application


Abstract
:1. Introduction
- Material and technical factors, in that number technology innovations;
- High-performance workspace setting up;
- Development, specialization and concentration of production, using lean production techniques;
- Improvement of production structure and output volumes;
- Advanced training;
- Social and economic factors determined wages and working conditions.
- Identification and substantiation of a set of factors, including factors about health quality that determine labor productivity;
- Design homogeneous employees’ groups using all indicated above factors;
- Development a set of management decisions to improve personnel health quality which is differ for each homogeneous group and to contribute to labor productivity growth;
- Assessment of economic efficiency of supposed management decisions to preserve personnel health.
2. Methodology of Research
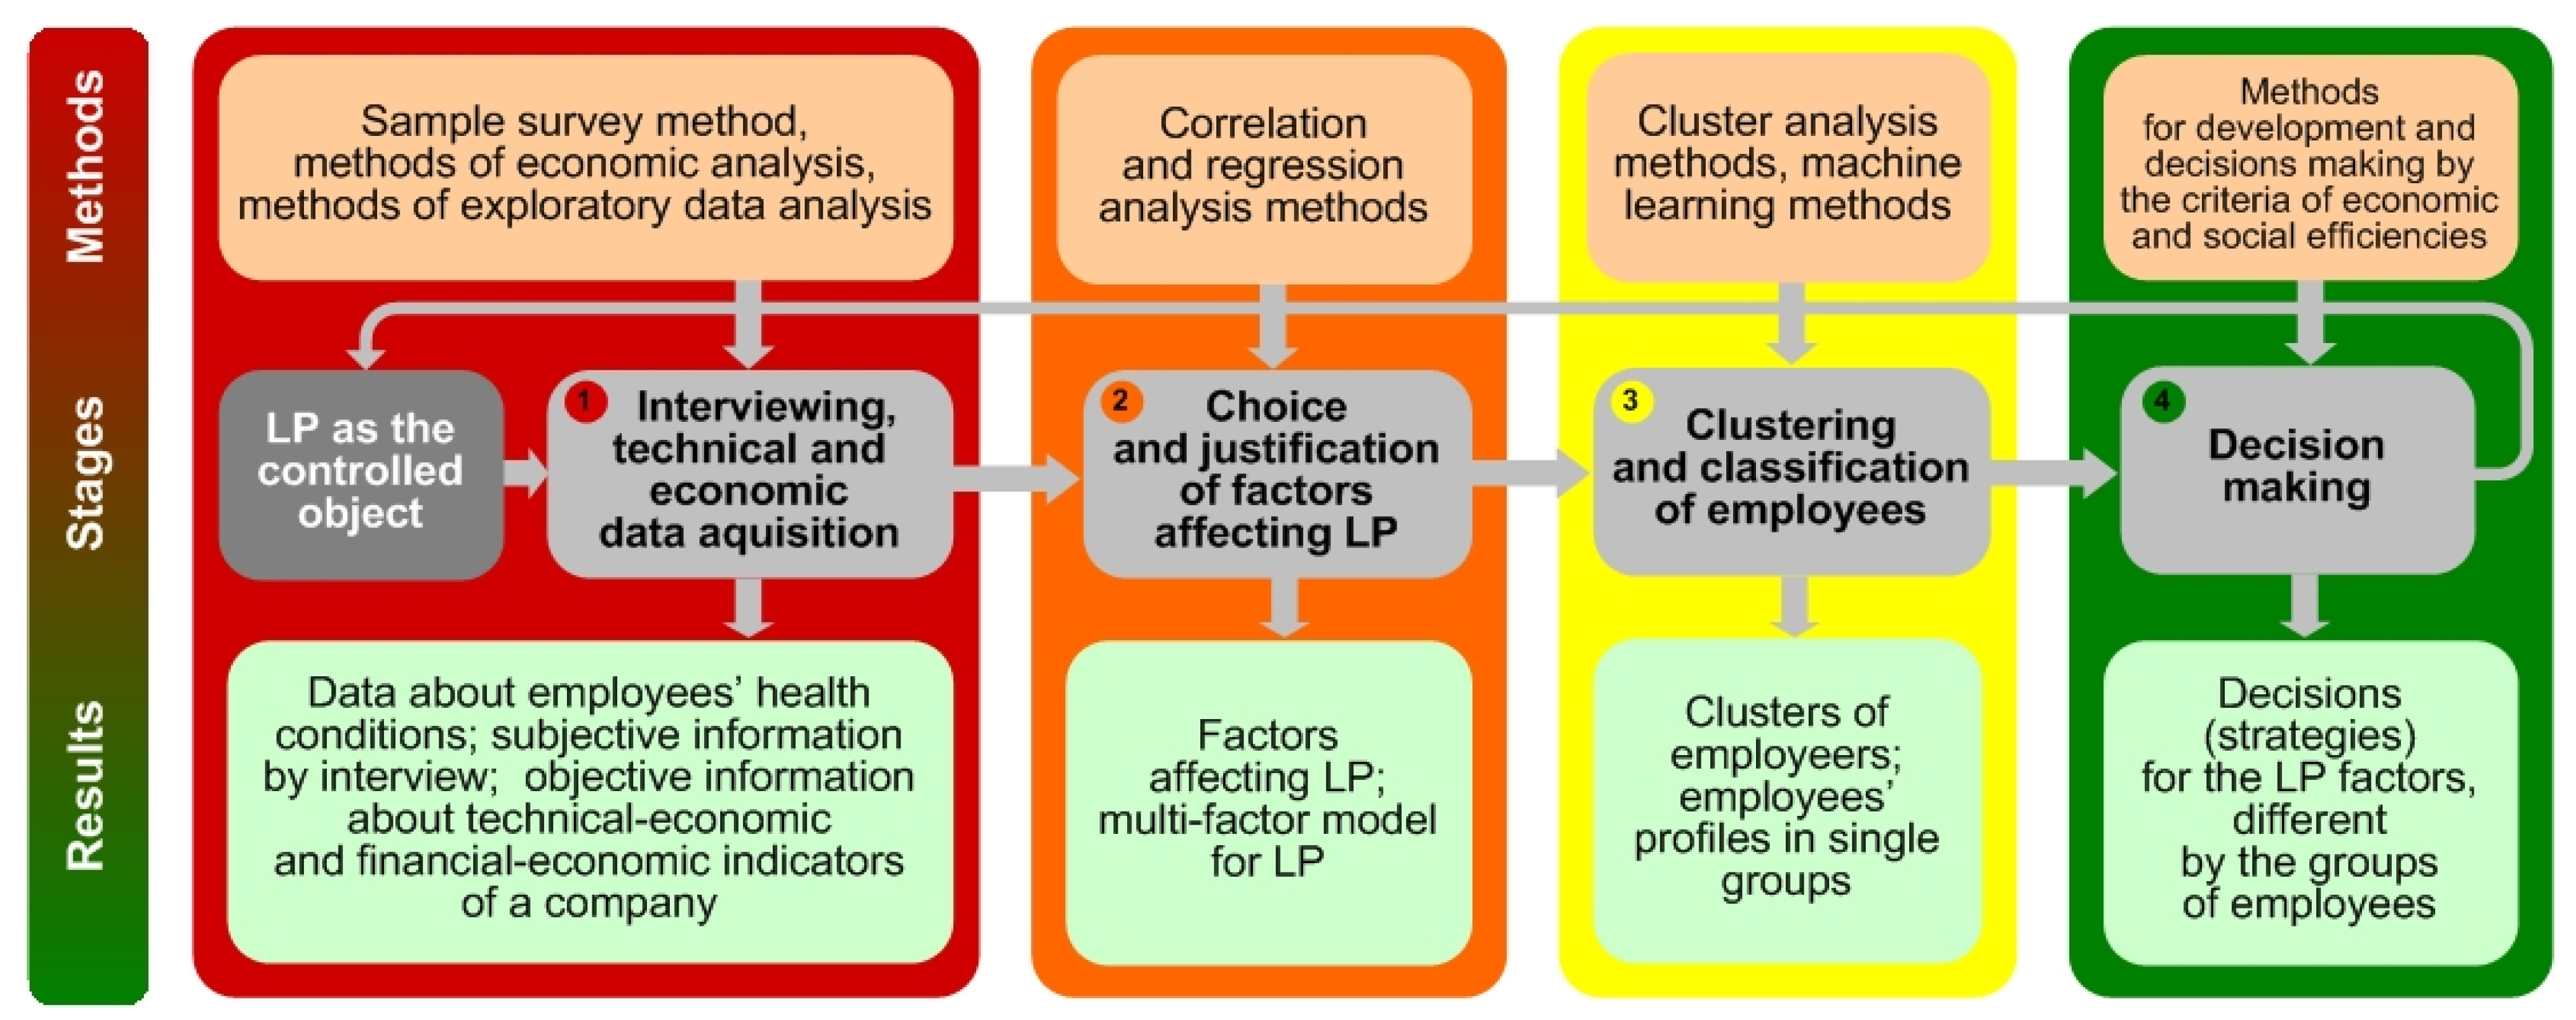
2.1. Conceptual Approach for Labor Productivity Management
2.2. Materials and Methods
2.2.1. Decision Trees
2.2.2. Support Vector Machines
- SVM method is effective in large spaces;
- It is effective if the number of measurements exceeds the number of samples;
- It uses a subset of the training set in the decision function (called support vectors), so it is also memory efficient;
- Versatility: different kernel functions can be specified for the decision function.Common kernels are provided, but one can also specify his own kernels.The disadvantages of the method include:
- If the number of features is much larger than the number of samples, overfit should be avoided when choosing kernel features, and the term regularization is critical;
- SVMs do not provide direct estimates of probabilities, which can be calculated using an expensive five-fold cross-validation.
2.2.3. K-Means Method
2.2.4. Self-Organizing Maps
3. Experimental Results
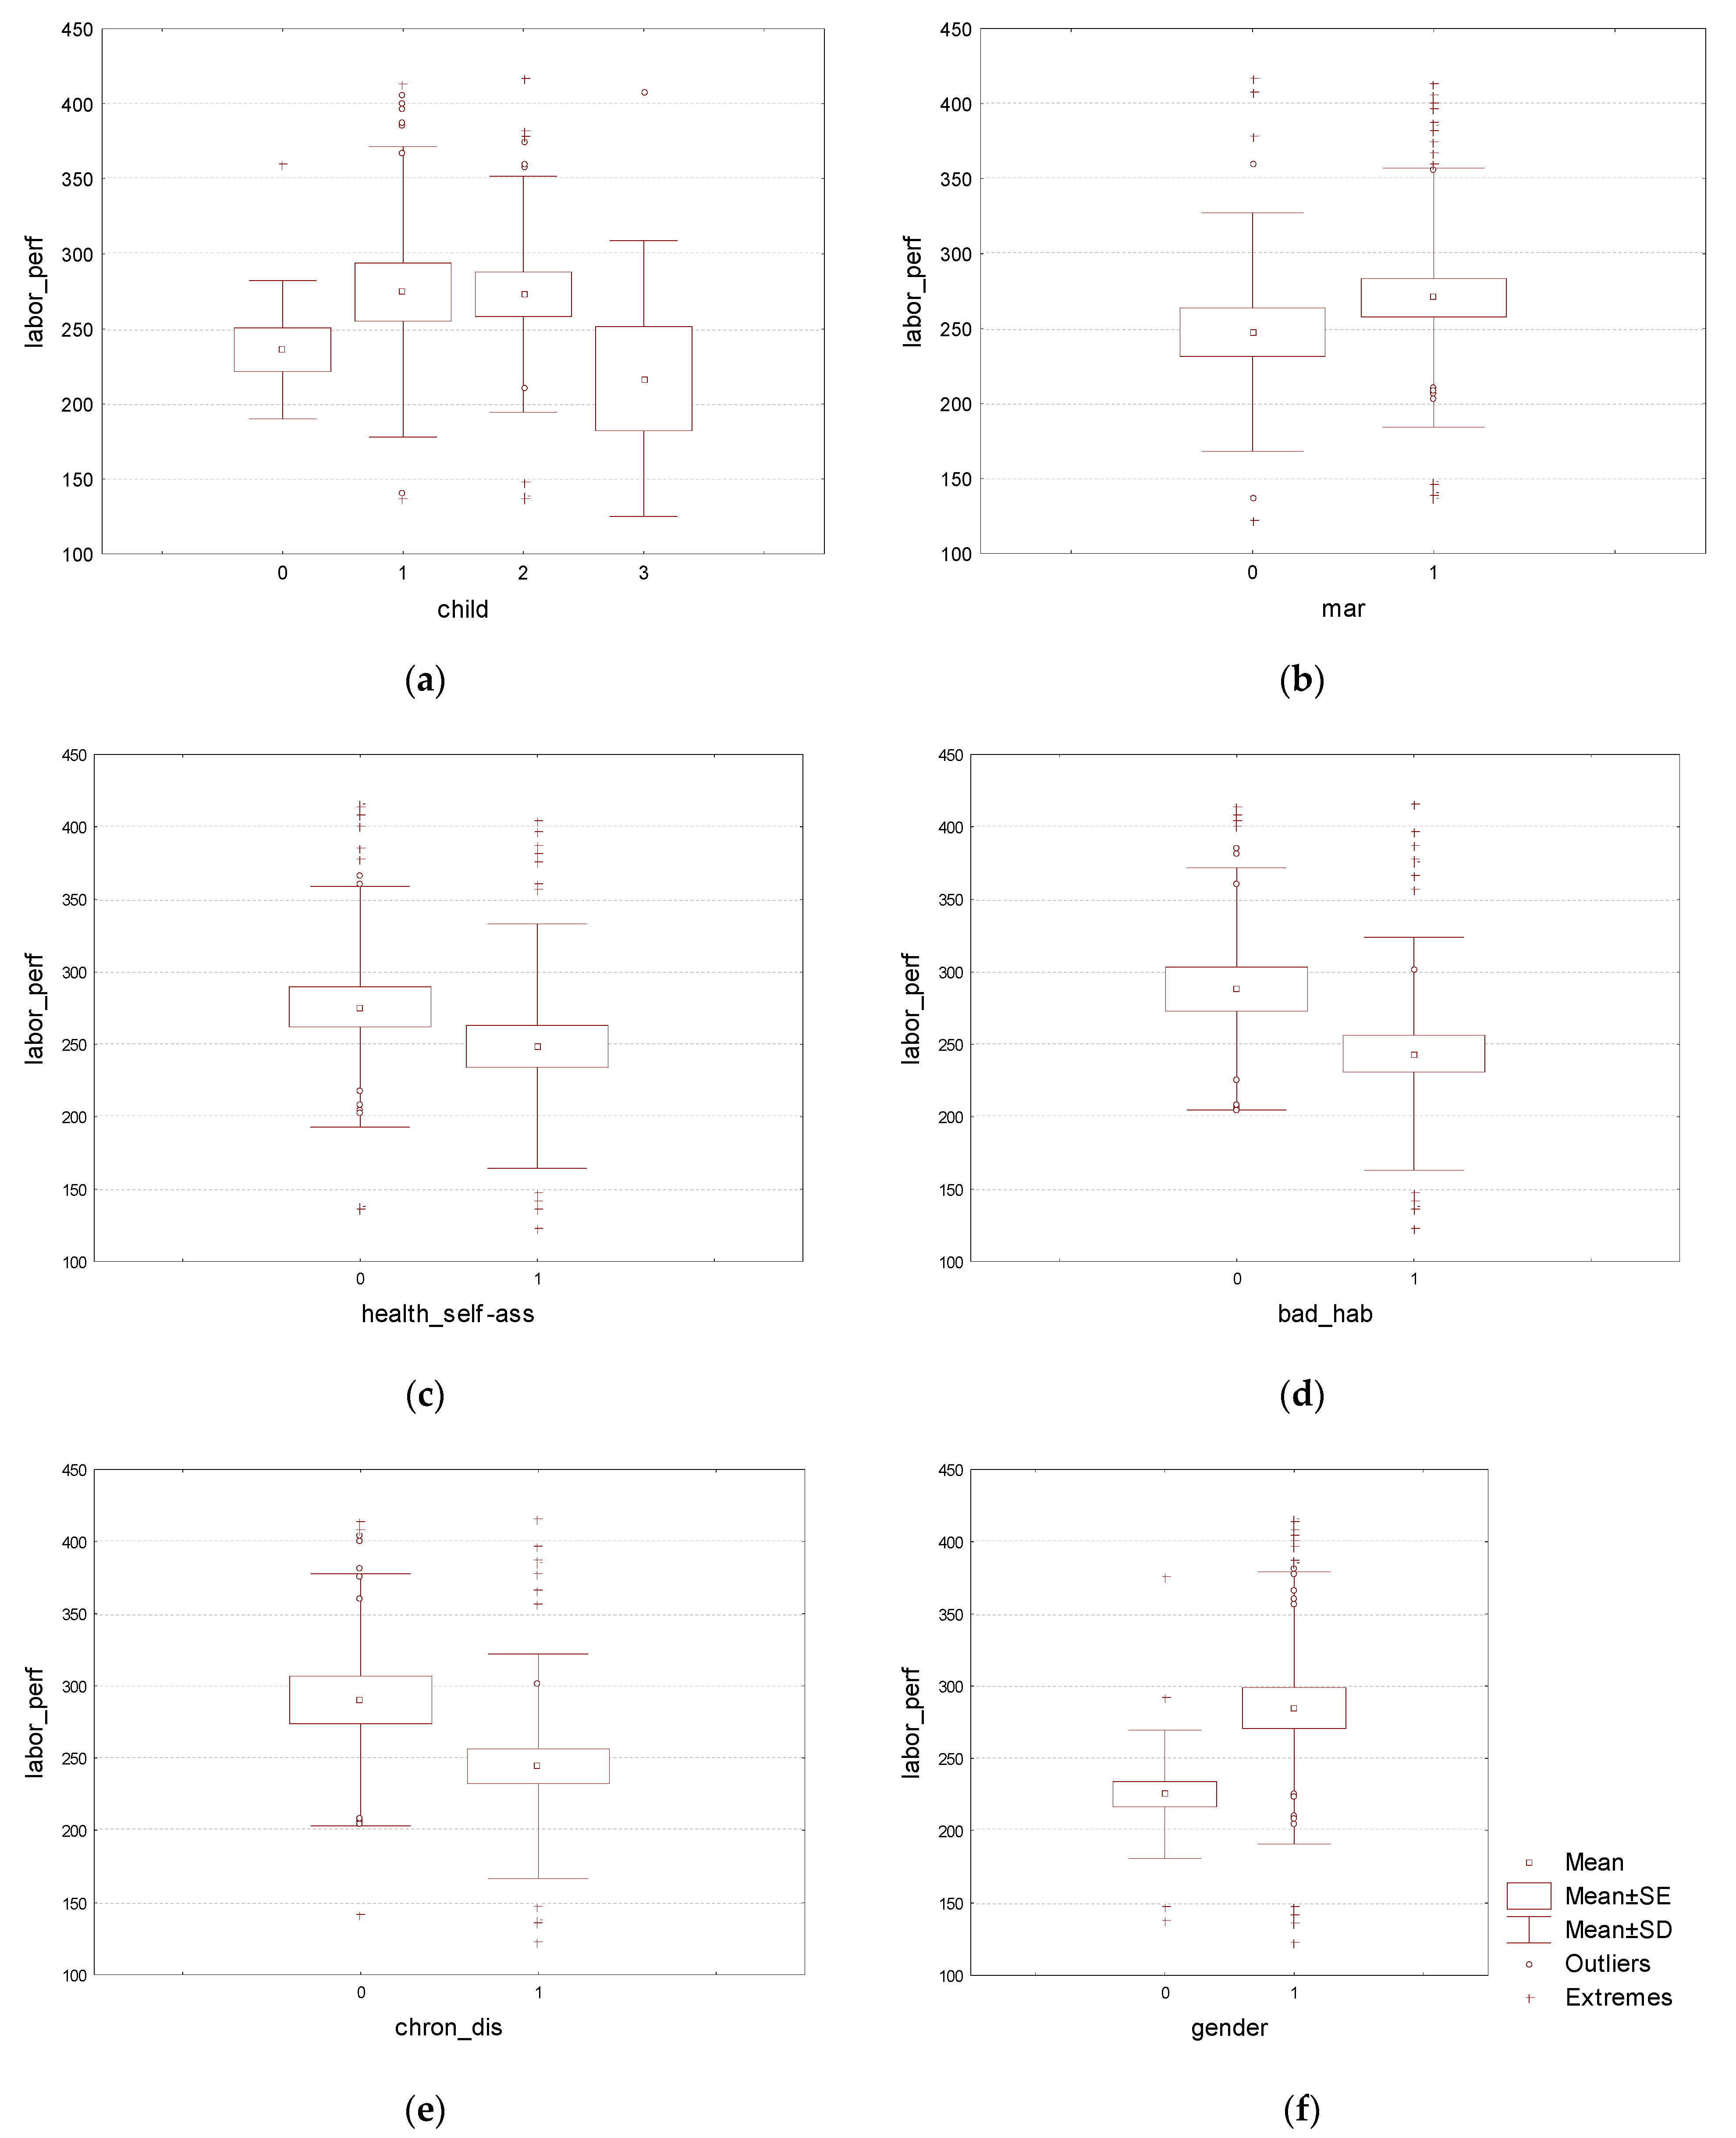
3.1. Exploratory Data Analysis and Visualization
3.2. Clustering and Classification of Companies’ Employeers
- Clustering an employers to form homogeneous groups with similar labor productivity profiles. For this we test two clustering methods—k-means method and neural network method based on self-organizing Kohonen maps (SOM);
- Classification an employers to identify the performance profile of the new employee, or to determine the cluster to which he is more likely to belong. At this stage we use the following methods: decision trees and support vector machines.
4. Discussion of Results: Management Decisions to Improve Employers’ Health Quality
- Reducing a cost of sick leave. Since the employees in the third cluster make 34 percent of all employees, we accept two options: an optimistic one, which results in a complete reduction in the incidence of sickness among employees in this cluster, and in the second realistic option, a reduction in the incidence and costs of sick leave payments is ensured by 20%;
- Reducing a cost of replacing an employee who has left for sick leave. Similarly, to assess the effect, an optimistic option is considered, in which these costs are completely eliminated, and a realistic option, in which the cost reduction will be 20%.
5. Conclusions
Funding
Institutional Review Board Statement
Informed Consent Statement
Data Availability Statement
Conflicts of Interest
Appendix A

| Question Number | Question | Answer | |
|---|---|---|---|
| Yes | No | ||
| 1 | Does headache bother you? | ||
| 2 | Do you easily wake up from any noise? | ||
| 3 | Are you worried about pain in the heart? | ||
| 4 | Do you think that your eyesight has deteriorated? | ||
| 5 | Do you think that your hearing has deteriorated? | ||
| 6 | Do you try to drink only boiled water? | ||
| 7 | Do the younger ones give way to you in public transport? | ||
| 8 | Do joint pain bother you? | ||
| 9 | Does the change in the weather affect your well-being? | ||
| 10 | Do you have periods when you lose sleep because of anxiety? | ||
| 11 | Are you worried about constipation? | ||
| 12 | Are you worried about pain in the liver (in the right hypochondrium)? | ||
| 13 | Do you have dizziness? | ||
| 14 | Has it become more difficult for you to concentrate now than in past years? | ||
| 15 | Are you worried about the weakening of memory, forgetfulness? | ||
| 16 | Do you feel a burning sensation, tingling sensation, “creeping creeps” in various parts of your body? | ||
| 17 | Do you have noise in your ears? | ||
| 18 | Do you keep one of the following medicines at home: validol, nitroglycerin, heart drops? | ||
| 19 | Do you have swelling in your legs? | ||
| 20 | Did you have to give up some of the dishes? | ||
| 21 | Do you have shortness of breath when walking fast? | ||
| 22 | Are you worried about lower back pain? | ||
| 23 | Have you ever used any mineral water for medicinal purposes? | ||
| 24 | Is it possible to say that you have become whiny? | ||
| 25 | How often do you drink alcoholic beverages? | ||
| 26 | Do you think that you have become less efficient than before? | ||
| 27 | Are the periods when you feel joyful, excited, happy disappeared in your life? | ||
| 28 | How do you assess your state of health (good, satisfactory, bad or very bad)? | ||
| 29 | Do you often get colds and flu? | ||
| 30 | Do you smoke? | ||
| Indicator | Characteristic | Question Number in the Questionnaire |
|---|---|---|
| Chronic diseases | Diseases that can be controlled but not completely cured | 3,8,11,16,19,21,22,29 |
| Feeling unwell | An employee health state, which does not allow them to fully carry out his labor activity | 1,9,10,13,14,17,27 |
| Self-reported health as weak and unsatisfactory | An employee’s overall assessment of his health | 2,4,5,7,15,18,24,26,28 |
| Bad habits | Habits that negatively affect employee health | 12,25,30 |
| Inadequate nutrition | Food that eliminates harmful or useless substances in the diet | 6,20,23 |
References
- Passport of the National Project (Program). Labor Productivity and Employment Support. 2018. Available online: https://www.government.ru/info/35567/ (accessed on 10 August 2021).
- Arthur, J. Effects of human resource systems on manufacturing performance and turnover. Acad. Manag. J. 1994, 37, 670–687. [Google Scholar]
- Becker, B.; Gerhart, B. Human resources and 2005 datta, guthrie, and wright 143 organizational performance: Progress and prospects. Acad. Manag. J. 1996, 39, 779–801. [Google Scholar]
- Delery, J.E.; Shaw, J.D. The strategic management of people in work organizations: Review, synthesis and extension. In Research in Personnel and Human Resource Management; Rowland, K.M., Ferris, G.R., Eds.; JAI Press: Greenwich, UK, 2001; pp. 165–197. [Google Scholar]
- Datta, D.; Guthrie, J. Human resource management and labor productivity: Does industry matter? Acad. Manag. J. 2005, 48, 135–145. [Google Scholar] [CrossRef] [Green Version]
- Goel, V.; Agrawal, R.; Sharma, V. Factors affecting labour productivity: An integrative synthesis and productivity modelling. Glob. Bus. Econ. Rev. 2017, 19, 299. [Google Scholar] [CrossRef]
- The World Bank. Change in the Nature of Labor. World Development Report. 2019. Available online: https://www.vsemirnyjbank.org/en/publication/wdr2019#a (accessed on 10 August 2021).
- Technical Notes Calculating the Human Development Indices—Graphical Presentation. 2019. Available online: http://hdr.undp.org/sites/default/files/hdr2019_technical_notes.pdf (accessed on 10 August 2021).
- World Economic Forum. The Global Human Capital Report 2017: Preparing People for the Future of Work. 2017. Available online: http://www3.weforum.org/docs/WEF_Global_Human_Capital_Report_2017.pdf (accessed on 10 August 2021).
- Global Health Workforce Alliance; Technical Working Group (TWG). Improving Health Worker Productivity and Performance in the Context of Universal Health Coverage: The Roles of Standards, Quality Improvement and Regulation—Final Draft. 2014. Available online: https://www.who.int/ (accessed on 10 August 2021).
- Galkina, E.E.; Kabanov, A.S.; Khanetsky, A.S. Some aspects of evaluating the effectiveness of the labor protection and safety management system at the enterprises of the aerospace complex. Qual. Life 2018, 17, 55–60. [Google Scholar]
- Sudarkina, H.V.; Glod, O.D. Labor protection management: The system, methods and functions of labor protection management at the enterprise. Innov. Sci. 2016, 6-1, 245–248. [Google Scholar]
- Armstrong, M. Strategic Human Resource Management; Kogan Page: London, UK, 2008. [Google Scholar]
- Anders, F.; Johan, L.; Yvonne, L.; Bjarne, B. Quality 2030: Quality management for the future. Total Qual. Manag. Bus. Excell. 2020, 17, 1. [Google Scholar] [CrossRef]
- Aldana, S.G.; Pronk, N.P. Health promotion programs, modifiable health risks, and employee absenteeism. J. Occup. Environ. Med. 2001, 43, 6–46. [Google Scholar] [CrossRef]
- Ullah, S.; Malik, M.N.; Hassan, M. Impact of health on labour productivity: Empirical evidence from pakistan. Eur. Online J. Nat. Soc. Sci. 2019, 8, 117–139. [Google Scholar]
- Wei, F.; Xia, Y.; Kong, Y. Public health expenditure and labour productivity: A tentative interpretation based on the science of brain cognition. Neuro Quantol. 2019, 16, 319–333. [Google Scholar] [CrossRef]
- Calvo-Sotomayor, I.; Laka, J.P.; Aguado, R. Workforce ageing and labour productivity in Europe. Sustainability 2019, 11, 5851. [Google Scholar] [CrossRef] [Green Version]
- Chizhova, M.A.; Khayrullina, L.I. Systemic actions in the management of labor protection: Management of safety and health protection of workers. Bull. Technol. Univ. 2016, 19, 163–167. [Google Scholar]
- Bloom, D.E. Governing Global Health. Financ. Dev. 2007, 44, 31–35. [Google Scholar]
- Sheiner, L.; Malinovskaya, A.; Hutchins Center on Fiscal and Monetary Policy at Brookings. Measuring Productivity in Healthcare: An Analysis of the Literature. 2016. Available online: https://www.brookings.edu/wp-content/uploads/2016/08/hp-lit-review_final.pdf (accessed on 10 August 2021).
- Barro, R.J.; Lee, J.W. International data on educational attainment: Updates and implications. Oxf. Econ. Pap. 2001, 53, 541–563. [Google Scholar] [CrossRef]
- Baumol, W. Productivity growth, convergence, and welfare: What the long-run data show. Am. Econ. Rev. 1986, 76, 1072–1085. [Google Scholar]
- Bhargava, A.; Jamison, D.; Lau, L.; Murray, C. Modeling the effects of health on economic growth. J. Health Econ. 2001, 20, 423–440. [Google Scholar] [CrossRef]
- Boles, M.; Pelletier, B.; Lynch, W. The relationship between health risks and work productivity. J. Occup. Environ. Med. 2004, 46, 37–45. [Google Scholar] [CrossRef]
- Bloom, D.E.; Canning, D.; Sevilla, J. The effect of health on economic growth: A production function approach. World Dev. 2004, 32, 1–13. [Google Scholar] [CrossRef]
- Bloom, D.E.; Canning, D.; Harvard School of Public Health. Health and Economic Growth: Reconciling the Micro and Macro Evidence February. Available online: https://www.anderson.ucla.edu/faculty_pages/romain.wacziarg/demogworkshop/Bloom%20and%20Canning.pdf (accessed on 1 September 2021).
- Chansarn, S. Labor productivity growth, education, health and technological progress: A cross-country analysis. Econ. Anal. Policy 2010, 40, 249–261. [Google Scholar] [CrossRef]
- Cole, M.; Neumayer, E. The impact of poor health on total factor productivity. J. Dev. Stud. 2006, 42, 918–938. [Google Scholar] [CrossRef]
- Umoru, D.; Yaqub, J.O. Labour productivity and health capital in Nigeria: The empirical evidence. World 2008, 1987, 1995–2007. [Google Scholar]
- Vlegel, M.; Haagsma, J.A.; Munter, L.; Jongh, M.; Polinder, S. Health care and productivity costs of non-fatal traffic injuries: A comparison of road user types. Int. J. Environ. Res. Public Health 2020, 17, 2217. [Google Scholar] [CrossRef] [Green Version]
- The World Health Organization (WHO). The Labor Market for Human Resources for Health in Low- and Middle-Income Countries. 2012. Available online: http://www.who.int/hrh/resources/Observer11_WEB.pdf (accessed on 10 August 2021).
- Autor, D.; Dorn, D.; Katz, L.F.; Patterson, C.; Reenen, J.V. The fall of the labor share and the rise of superstar firms. Q. J. Econ. 2020, 135, 645–709. [Google Scholar] [CrossRef] [Green Version]
- Job Quality, Health and Productivity. An Evidence-Based Framework for Analysis OECD Social, Employment and Migration. 2018. Available online: https://www.oecd-ilibrary.org/ (accessed on 10 August 2021).
- Meyer, D.; Liker, J. Talented Employees. Education and Training of People in the Spirit of Tao Toyota; Alpina Publisher: Moscow, Russia, 2007. [Google Scholar]
- Syarnubi, A.; Sembiring, R.A.; Siswaya, T.; Zuraida, R. Performance, productivity, and safety & health among employee of oil & gas company in qatar. IOP Conf. Ser. Earth Environ. Sci. 2018, 195, 012075. [Google Scholar]
- Orlova, E.V. Methods and models of data analysis and machine learning in the problem of labor productivity management. Softw. Eng. 2020, 4, 219–229. [Google Scholar] [CrossRef]
- Orlova, E.V. Labor productivity management using health factors: Technique and models. Manager 2020, 6, 57–69. [Google Scholar] [CrossRef]
- Mauboussin, M.J. The success equation: Untangling skill and luck in business, sports, and investing. CFA Inst. Conf. Proc. Q. 2013, 30, 44–51. [Google Scholar] [CrossRef]
- Jackle, R. Health and Wages. In Panel Data Estimates Considering Selection and Endogeneity; Ifo Institute for Economic Research: Munich, Germany, 2007. [Google Scholar]
- Stern, S. Semiparametric estimates of the supply and demand effects of disability on labor force participation. J. Econom. 1996, 71, 364–406. [Google Scholar] [CrossRef]
- Lyashok, V.; Roshchin, S. Young and old workers in the Russian labor market: Are they competitors? J. New Econ. Assoc. 2017, 33, 117–140. [Google Scholar] [CrossRef]
- Sadia, R. The relationship between employee health, quality culture and organizational effectiveness: Findings from the literature. Int. J. Des. Nat. Ecodyn. 2016, 11, 1–9. [Google Scholar] [CrossRef] [Green Version]
- Jiang, J.Y.; Liu, C.W. High performance work systems and organizational effectiveness: The mediating role of social capital. Hum. Resour. Manag. Rev. 2015, 25, 126–137. [Google Scholar] [CrossRef]
- Matthews, J.R. Assessing organizational effectiveness: The role of performance measures. Libr. Q. 2011, 81, 83–110. [Google Scholar] [CrossRef]
- Koys, J.D. The effects of employee satisfaction, organizational citizenship behavior, and turnover on organizational effectiveness: A unit-level, longitudinal study. Pers. Psychol. 2001, 54, 101–114. [Google Scholar] [CrossRef]
- Lechner, M.; Huber, M.; Wunsch, C. Workplace health promotion and labour market performance of employees. J. Health Econ. 2015, 43, 170–189. [Google Scholar]
- Quinlan, J.R. Induction of decision trees. Mach. Learn. 1986, 1, 81–106. [Google Scholar] [CrossRef] [Green Version]
- Quinlan, J.R. C4.5: Programs for Machine Learning; Morgan Kaufmann: Los Altos, CA, USA, 1993. [Google Scholar]
- Breiman, L.; Friedman, J.; Olshen, R.; Stone, C. Classification and Regression Trees; Wadsworth Int. Group: Belmont, CA, USA, 1984. [Google Scholar]
- Rokach, L.; Maimon, O. Decision Trees; Springer: Boston, MA, USA, 2005. [Google Scholar] [CrossRef]
- Awad, M.; Khanna, R. Support Vector Machines for Classification; Efficient Learning Machines: Berkeley, CA, USA, 2015. [Google Scholar] [CrossRef] [Green Version]
- Adam, C.; Ng, A.Y. Learning Feature Representations with K-Means; Stanford University: Stanford, CA, USA, 2012; p. 20. [Google Scholar]
- Kohonen, T. Self-Organizing Maps, 3rd ed.; Springer: New York, NY, USA, 2001; p. 501. [Google Scholar]
- Ministry of Economic Development. Order of the Ministry of Economic Development of Russia. On Approval of the Methodology for Calculating Labor Productivity Indicators of an Enterprise, Industry, Subject of the Russian Federation and the Methodology for Calculating Individual Indicators of the National Project “Labor Productivity and Employment Support”. 2019. Available online: http://docs.cntd.ru/document/552128236 (accessed on 10 August 2021).
- Orlova, E.V. Model for operational optimal control of financial recourses distribution in a company. Comput. Res. Model. 2019, 2, 343–358. [Google Scholar] [CrossRef] [Green Version]
- Orlova, E.V. Decision-making techniques for credit resource management using machine learning and optimization. Information 2020, 11, 144. [Google Scholar] [CrossRef] [Green Version]
- Orlova, E.V. Technology for control an efficiency in production and economic system. In Proceedings of the 30th International Business Information Management Association Conference (IBIMA), Madrid, Spain, 8–9 November 2017; pp. 811–818. [Google Scholar]
- Orlova, E.V. Modeling and coordinated control for the production and economic system. In Proceedings of the Mathematical Modeling Session at the International Conference Information Technology and Nanotechnology (MM-ITNT 2017), Samara, Russia, 25–27 April 2017; Volume 1904, pp. 1–6. [Google Scholar]
- Shalev-Shwartz Shai, S.; Ben-David, S. Understanding Machine Learning: From Theory to Algorithms; Cambridge University Press: Cambridge, MA, USA, 2014; p. 499. [Google Scholar]
- Orlova, E.V. Synergetic approach for the coordinated control in production and economic system. In Proceedings of the 30th International Business Information Management Association Conference (IBIMA), Madrid, Spain, 8–9 November 2017; pp. 704–712. [Google Scholar]
- Orlova, E.V. The AI model for identification the impact of irrational factors on the investor’s risk propensity. In Proceedings of the 30th International Business Information Management Association Conference (IBIMA), Madrid, Spain, 8–9 November 2017; pp. 713–721. [Google Scholar]
- Orlova, E.V. Control over chaotic price dynamics in a price competition model. Autom. Remote Control 2017, 78, 16–28. [Google Scholar] [CrossRef]
- Orlova, E.V. Methodology and models for individuals’ creditworthiness management using digital footprint data and machine learning methods. Mathematics 2021, 9, 1820. [Google Scholar] [CrossRef]

| Indicator | Variable | Variable Value or Binary |
|---|---|---|
| Age | age | 20–65 |
| Gender | gender | female (0), male (1) |
| Marital status | mar | Not married (0), married (1) |
| Education | edu | Specialized secondary (0), higher (1) |
| Children | child | 0, 1, 2,… |
| Chronic diseases | chron_dis | no (0), yes (1) |
| Feeling unwell | bad_healh | Infrequently (0), often (1) |
| Self-reported health as weak and unsatisfactory | health_self-ass | no (0), yes (1) |
| Inadequate nutrition | nutr | no (0), yes (1) |
| Bad habits | bad_hab | no (0), yes (1) |
| Individual labor productivity | labor_pert | 136–420 rub (1 ruble is equivalent to 0.01 euro) per hour |
| Index | Value | Index | Value |
|---|---|---|---|
| Mean | 262.7 | Minimum value | 123 |
| Mode | 208 | Maximum value | 416 |
| Median | 231.5 | Standard deviation | 84.2 |
| Variation | 0.36 |
| Variable | Age | Gender | Mar | Edu | Child | Chron_ dis | Bad_ healh | Health_ self-ass | Nutr | Bad_ hab | Labor_ pert |
|---|---|---|---|---|---|---|---|---|---|---|---|
| age | 1.00 | −0.23 | 0.06 | −0.22 | 0.30 | 0.35 | −0.01 | 0.18 | 0.17 | 0.20 | −0.32 |
| gender | −0.23 | 1.00 | 0.20 | 0.07 | 0.03 | 0.04 | 0.18 | −0.03 | −0.10 | 0.01 | 0.34 |
| mar | 0.06 | 0.20 | 1.00 | 0.07 | −0.00 | −0.02 | 0.18 | 0.09 | −0.04 | 0.07 | 0.03 |
| edu | −0.22 | 0.07 | 0.07 | 1.00 | −0.08 | −0.28 | −0.00 | −0.05 | 0.00 | −0.15 | 0.02 |
| child | 0.30 | 0.03 | −0.00 | −0.08 | 1.00 | 0.13 | −0.14 | 0.20 | 0.13 | 0.26 | −0.02 |
| chron_dis | 0.35 | 0.04 | −0.02 | −0.28 | 0.13 | 1.00 | 0.26 | 0.26 | 0.25 | 0.77 | −0.27 |
| bad_healh | −0.01 | 0.18 | 0.18 | −0.00 | −0.14 | 0.26 | 1.00 | 0.48 | 0.21 | 0.31 | 0.02 |
| health_self–ass | 0.18 | −0.03 | 0.09 | −0.05 | 0.20 | 0.26 | 0.48 | 1.00 | 0.54 | 0.41 | −0.31 |
| nutr | 0.17 | −0.10 | −0.04 | 0.00 | 0.13 | 0.25 | 0.21 | 0.54 | 1.00 | 0.18 | −0.20 |
| bad_hab | 0.20 | 0.01 | 0.07 | −0.15 | 0.26 | 0.77 | 0.31 | 0.41 | 0.18 | 1.00 | −0.25 |
| labor_pert | −0.32 | 0.34 | 0.03 | 0.02 | −0.02 | −0.27 | 0.02 | −0.31 | −0.20 | −0.25 | 1.00 |
| Predictor (Regressor) | Regression Coefficient | Regression Coefficient Error | T-Statistics | p-Value |
|---|---|---|---|---|
| age | −5.232 | 2.2219 | −2.35490 | 0.028854 |
| mar*chron_dis | −584.479 | 120.7443 | −4.84064 | 0.000099 |
| gender*bad_healh | 254.329 | 76.3480 | 3.33118 | 0.003329 |
| mar*bad_healh | 111.577 | 49.7048 | 2.24479 | 0.036250 |
| edu*bad_healh | 121.695 | 55.9648 | 2.17450 | 0.041843 |
| chron_dis*bad_healh | 560.109 | 103.1680 | 5.42909 | 0.000026 |
| gender*health_ass | −229.364 | 78.0956 | −2.93696 | 0.008152 |
| edu*health_ass | −108.392 | 43.4358 | −2.49546 | 0.021441 |
| chron_dis*health_ass | −488.851 | 105.3426 | −4.64059 | 0.000158 |
| mar*bad_hab | 516.338 | 108.2071 | 4.77176 | 0.000116 |
| chron_dis*bad_hab | 578.543 | 141.1459 | 4.09890 | 0.000558 |
| bad_healh*bad_hab | −476.916 | 95.9670 | −4.96958 | 0.000074 |
| health_ass*bad_hab | 346.146 | 66.1466 | 5.23302 | 0.000040 |
| gender*edu*bad_healh | 79.240 | 34.3925 | 2.30400 | 0.032080 |
| gender*mar*health_ass | −162.445 | 62.3059 | −2.60721 | 0.016862 |
| gender*edu*health_ass | −84.053 | 34.6773 | −2.42387 | 0.024960 |
| Variable | Average Value of the Variable in the Cluster | |||
|---|---|---|---|---|
| 1 | 2 | 3 | 4 | |
| age | 34.7 | 46.3 | 35.6 | 33.1 |
| gender | 1 | 0 | 1 | 0 |
| mar | 1 | 1 | 1 | 0 |
| edu | 1 | 1 | 0 | 1 |
| child | 1 | 2 | 2 | 0 |
| chron_dis | 0 | 1 | 1 | 0 |
| bad_healh | 0 | 1 | 1 | 1 |
| health_self-ass | 0 | 1 | 0 | 1 |
| nutr | 0 | 1 | 0 | 1 |
| bad_hab | 0 | 1 | 1 | 0 |
| labor_pert | 301.6 | 221.4 | 290.8 | 227.8 |
| cluster size | 191 | 229 | 184 | 98 |
| Variable | Average Value of the Variable in the Cluster | |||
|---|---|---|---|---|
| 1 | 2 | 3 | 4 | |
| age | 34.2 | 34.1 | 41.0 | 41.7 |
| gender | 1 | 0 | 1 | 1 |
| mar | 1 | 1 | 1 | 0 |
| edu | 1 | 1 | 1 | 1 |
| child | 1 | 1 | 2 | 2 |
| chron_dis | 0 | 0 | 1 | 0 |
| bad_healh | 0 | 1 | 1 | 1 |
| health_self-ass | 0 | 1 | 1 | 0 |
| nutr | 0 | 1 | 1 | 0 |
| bad_hab | 0 | 1 | 1 | 1 |
| labor_pert | 294.12 | 287.35 | 224.46 | 265.26 |
| cluster size | 170 | 142 | 241 | 149 |
| Predictor (Regressor) | Regression Coefficient for Models, Different by Employees’ Clusters | |||
|---|---|---|---|---|
| 1 | 2 | 3 | 4 | |
| age | 2.2938 | −3.4964 | 2.4323 | −0.3619 |
| child | −3.8365 | −5.6638 | −6.5767 | −76.8798 |
| gender | −3.8608 | 37.5001 | −0.7216 | −40.0442 |
| mar | 16.3362 | −24.5735 | 38.9882 | −22.7630 |
| edu | −9.5457 | 83.0892 | −0.3464 | 29.0374 |
| chron_dis | −23.6031 | 38.1560 | −0.7990 | −5.0536 |
| bad_healh | 15.9159 | 105.3204 | −20.1630 | −40.0442 |
| health_ass | −30.3469 | 139.8367 | 23.9315 | −40.0442 |
| nutr | −13.0980 | 136.2081 | −12.1418 | 26.6200 |
| bad_hab | −23.6031 | −80.6174 | −3.4200 | −46.6946 |
| Regression intercept | 139.0025 | 249.9718 | 109.6893 | 460.2615 |
| R2 | 0.84 | 0.73 | 0.71 | 0.76 |
| MAPE | 10.3 | 16.6 | 12.1 | 11.6 |
| F-test | 4.1 | 4.1 | 4.6 | 4.3 |
| Cluster | Employee Profile, Reflecting Health Status | Health Improvement Strategy | Management Decisions |
|---|---|---|---|
| 1 | Excellent | Current control | Regular conversations, trainings |
| 4 | Good | Monitoring andprevention | Trainings and monitoring the employees’ health |
| 2 | Satisfactory | Healthy lifestyle prevention | Regular monitoring and implementation of measures to improve health status |
| 3 | Bad | Strong involvement | Regular implementation of activities—promotion of a healthy lifestyle; mass sports; regular spa treatment; wellness programs |
| Cost Item | Cost Value before Management Decisions Implementation, Rub. | Cost Value after Management Decisions Implementation, Rub. | |
|---|---|---|---|
| Optimistic Option | Realistic Option | ||
| Cost for sick leave | 366,125 | 0 | 124,593 |
| Cost for the replacement of absent employee | 2,295,625 | 0 | 1,023,500 |
| Tolal cost | 2,661,750 | 0 | 1,248,093 |
Publisher’s Note: MDPI stays neutral with regard to jurisdictional claims in published maps and institutional affiliations. |
© 2021 by the author. Licensee MDPI, Basel, Switzerland. This article is an open access article distributed under the terms and conditions of the Creative Commons Attribution (CC BY) license (https://creativecommons.org/licenses/by/4.0/).
Share and Cite
Orlova, E.V. Innovation in Company Labor Productivity Management: Data Science Methods Application. Appl. Syst. Innov. 2021, 4, 68. https://doi.org/10.3390/asi4030068
Orlova EV. Innovation in Company Labor Productivity Management: Data Science Methods Application. Applied System Innovation. 2021; 4(3):68. https://doi.org/10.3390/asi4030068
Chicago/Turabian StyleOrlova, Ekaterina V. 2021. "Innovation in Company Labor Productivity Management: Data Science Methods Application" Applied System Innovation 4, no. 3: 68. https://doi.org/10.3390/asi4030068
APA StyleOrlova, E. V. (2021). Innovation in Company Labor Productivity Management: Data Science Methods Application. Applied System Innovation, 4(3), 68. https://doi.org/10.3390/asi4030068