Abstract
We live in an era of big data. Large volumes of complex and difficult-to-analyze data exist in a variety of industries, including the financial sector. In this paper, we investigate the role of big data in enterprise and technology architectures for financial services. We followed a two-step qualitative process for this. First, using a qualitative literature review and desk research, we analyzed and present the data science tools and methods financial companies use; second, we used case studies to showcase the de facto standard enterprise architecture for financial companies and examined how the data lakes and data warehouses play a central role in a data-driven financial company. We additionally discuss the role of knowledge management and the customer in the implementation of such an enterprise architecture in a financial company. The emerging technological approaches offer opportunities for finance companies to plan and develop additional services as presented in this paper.
1. Introduction
In the last decade, the financial industry has experienced enormous transformation in delivery due to digitalization. This transformation is characterized by expanded connectivity and the enhanced speed of information processing on the side of both customers and financial companies such banks (back-office), insurance companies, brokerages, and generally firms that are involved in financial services [1,2,3,4]. Recently, partly because of the digital transformation and partly due to improved regulation and standardization (Payment Services Directive 2 (PSD2), there has been a shift in the use of data in financial companies [5]. New types of business operations, based on big data, have emerged as well [6,7,8]. New patterns of the usage of mobile devices and media have emerged. These patterns appeared in combination with reduced fear or reluctance to use the Internet, which is valid even among older people, so that these phenomena are the new structural drivers for these developments.
FinTech refers to financial sector innovators and disruptors that use ubiquitous technologies, the Internet, and automated information processing. These new solutions can originate in new companies (most commonly startups), established financial service providers, or even in established technology companies. Existing research also distinguishes between “sustaining FinTech”, i.e., established financial service companies that already have a customer base and try to maintain their market position through the use of information technologies, and “disruptive FinTech”, i.e., new companies and startups that challenge established providers by offering new products and services [9]. Under the notion of FinTech, we can understand financial services technologies companies who are service-oriented and intensively use Information Technology (IT) through the digital transformation of their own enterprises [10]. The finance industry has always relied on much data, whereby the application of computer science has always been preferred in the financial sector. However, in the past, they were used to support existing operations rather than in more novel ways [7,11,12]. Thus, FinTech companies are centered on and developed around the intersection of information and communication technologies and finance. They focus on new solutions for existing challenges in the financial industry.
Digital transformation in the financial sector requires the analysis and design of the enterprise architecture and an enterprise engineering exercise to define a modern information system structure and technology architecture to integrate the various digital and online services with the communication networks. The companies in the financial sector can proffer from various e-services by exploiting data analytics to assist with the diverse business requirements for financial e-services of SMEs [13,14].
One of the recent main objectives of knowledge management within an enterprise is the improvement of processes; the other requirement is that the acquired knowledge that comes from the improvement experiment should be efficiently and effectively disseminated among the business processes stakeholders [15]. Currently, there are plenty of tools that originate from Information and Communication Technologies (ICTs) that can be exploited to acquire knowledge through process mining. Process mining means applying a set of algorithms from data science and utilizing the traditional transactional systems such as enterprise resource planning, customer relationships management, and human capital management; furthermore, the Internet offers many opportunities in the form of social networks, Internet of Things (IoT) devices, electronic mailing and instant messages for text, and information and process mining. The data science tool set gives the chance to gain knowledge that supports the strategic and operative decision-making within the enterprise. The various systems—either internal or external—can be used as source systems. Data can be extracted, prepared, ingested, and then stored in a data lake, data warehouse, and data mart in a combination of available technologies.
The data are transformed step-by-step so that they are ready for further analysis to acquire information and knowledge through the application of sophisticated data science algorithms according to the specific requirements for innovative business ideas [16]. Data science and modern information architectures such as data lakes and data warehouses make it possible to very quickly analyze large datasets with heterogeneous structures. Digital transformation enforces innovative business approaches and solutions so that data science yields methods to create data-intensive workflows for collecting, analyzing, interpreting, and assessing the results. Exploratory data analysis empowers the players in the financial industry to define a business model based on data.
The financial industry lags behind the other sectors in the application of most modern data analytics tools and architectures [1]. Once a data analytics platform is installed according to the requirements of financial enterprises, data can be collected from several resources such as transactional systems and the Internet into a data lake. The data sources can include social networks, environmental data, and health statistics from the Internet. The combination of various data sources in an integrated information architecture can assist the industry in different ways. The information architecture can support digital finance across distinct domains. The information system architecture may include algorithms related to digital financial services, e.g., digital factoring, invoicing, and loan calculations. Furthermore, it may contain technologies that support digital investments, trading, crowdfunding, digital money, virtual currencies, and digital payments. Payment services can encompass different types of mobile and contactless or even invisible payment solutions in which technology plays a central role. Insurance companies may employ information technologies where insurers use digital risk calculation or health tracking of customers. They may use technologies in claim support or digital financial advice, e.g., in the form of robo-advisors.
The application of data science in financial services has been wide-ranging. The aim of this paper was two-fold: (1) to review the current literature on the use of data science for various digital finance domains and provide an overview of methods for future researchers and practitioners on possible methods to use and (2) to develop a model of the de facto financial company enterprise architecture, the role of the customer in it, and the role of knowledge management in the companies implementing it.
This article is organized as follows: Section 2 presents the background on trends in research in digitally empowered financial services; Section 3 presents the methodology we employed to come up with the available and proposed solutions for knowledge management and data use in the financial industry; Section 4 reviews scenarios and enterprise architectures for data-empowered financial services and explores how machine learning and data science can help the financial sector; Section 5 discusses and criticizes the impacts of the information presented in this paper; Section 6 concludes the paper.
2. Background
Although an effort has been made in various areas of the financial industry (financing, electronic factoring, investments, payments, insurance, finance advice), an overarching enterprise system supported by software is needed to unite these functions, to solve complex problems, and to serve diverse functions in a complex organization. Our review, therefore, aims to identify the trends and characteristics of the enterprise architecture of a FinTech company in terms of the different functions the enterprise software has to carry out, in response to various data science roles in the company.
2.1. Domains of Application of Data Science in Financial Companies
In this section, we outline the domains in which data science is used currently in financial companies [17,18,19]:
Customer lifecycle value analysis: This approach uses data analysis methods that try to assess the profitability of individual customers (or certain groups of customers) over the lifetime of the relationship and analyze transactions between the company and the customer. The sophisticated models that were developed can provide an accurate estimate of the costs to the company when a customer either purchases or uses a particular product. The model includes the cost of the sales channel, the likelihood of return, the likelihood of the consumer returning for repurchase, the cost of customer service calls, and so on.
Market testing: By using direct mail, direct marketing, mailshot, through changes made on the homepage of the company, promotions, and the application of other techniques, marketing staff can test different sales parameters to determine the customer response to a particular offer. In general, different methods are used for different (ideally randomly selected) (consumer) groups, based on dependent and independent variables that reflect a hypothetical causal relationship. This market testing experiment is evaluated by an appropriate measurement, and the results are compared to gauge the effectiveness of the change.
Price optimization. Also known as revenue management, this technique assumes that the primary explanatory variable of the customer’s purchasing behavior is the price (causality). The most important issue is usually price elasticity or the customer’s reaction (change in demand) to the increase or decrease in the price of the product. Price optimization analyses typically create price elasticity curves to describe the impact of price changes, based on various adjustments in business and sales conditions.
Understanding advert effects: One way to analyze advertisement effects on customers is to use time series analysis. Time-series is a type of statistical data analysis in which samples have been appraised at consecutive times (periods), so this timeline is an important feature of the data. These observations are used to determine whether the condition applied at a given point in time results in a change in the variables examined.
An assessment of the preferences of customers and consumers regarding the combination of certain products and service characteristics by conjoint analysis and the strength and direction of the attraction of certain combinations of attributes: For example, in the case of a car purchase, a consolidated analysis of the characteristics of the car means which factors, such as price, quality, car dealership, etc.—the most important thing for a customer when purchasing a new car.
The recent technological, organizational, and external environment of financial services companies implicates that knowledge management is a technology-intensive branch of business process management. Service engineering and innovation cannot be realized without knowledge that is gained by the application of data science and machine learning. One of the important factors of service innovation is the application of components of the enterprise and information architecture in a novel way [20,21,22,23].
2.2. Data Science Roles in Companies
The foundation of modern knowledge management is the efficacy and effectiveness of information processing and the transformation into actions of the collected knowledge. The original job of knowledge workers involved in knowledge management activities moved in another direction. The knowledge engineers’ primary tasks were to build and maintain knowledge-based systems, which were implemented in software and IT systems. The knowledge-based systems were grounded in logic. These systems interpreted logical rules that were described in the static, axiomatized part of the conceptual structure in description logic; furthermore, for the dynamic part of the knowledge-base, the business rules were formulated in first-order predicate logic, and they were executed by the system. This notwithstanding, the structured and codified knowledge will play an important role in the future; however, the emphasis of knowledge discovery is placed on pattern recognition within a large volume of data. At this point, data science, data management, and all related disciplines come into play [24]. Therefore, the various activities and organizational roles that manage and maintain data collections in an enterprise, especially in a financial services technology company, lay the foundation for knowledge acquisition and management. For this reason, we look over the relevant roles and actors in a knowledge-intensive FinTech company. Data curation is an approach to figure out in the case of heterogeneous data which storage structure can properly deposit various kinds of data as follows: document, image, video, and any other unstructured format. The notion of metadata represents a relevant function in the administration of the information, as metadata exist within the data gathered, along with detailed information about the entities and therefore the data themselves. Metadata are connected to the aggregated data, so data science algorithms can generate metadata from structured, semi-structured, and even unstructured data. The information items and collections have versions that provide opportunities to reconstruct the results and to perform the analyses for the cooperating partners once again. The data curator or the data steward supervises the data asset of the enterprise and is liable for data collection, metadata definition, metadata management, data quality, and the gathering and inputting of data into the system. This set of tasks is carried out in a comprehensive way to ensure data protection, the security of data and information processing, and compliance [25].
The data custodian is accountable for the information technology that is used on the data assets. The duties of the data custodian are as follows: security of information, monitoring, availability of information, performance of the data management system, integrity, and dependability of the information. There are also professional tasks such as ensuring the business continuity of the information architecture, saving/restoring and archiving, realizing the data structure in the phase of physical design, and enforcing the technical standards and guidelines of the organization. This approach makes it possible to create pipelines for methods of data science. The designing, building, testing, integrating, managing, and optimizing of data collections is the responsibility of the data engineer. The data engineer controls the information architecture and perhaps defines the technology layer of the enterprise architecture that produces the information for the enterprise. The data scientist deals with interpreting the data that the data engineer has cleaned and made ready. The data scientist is dedicated to data analysis, and the data engineer concentrates on programming and developing databases—either relational or Not Only SQL style (NoSQL) [26,27]—to support data analytics. The data engineer’s primary task is to understand and specify the requirements of the users. The task of data scientists is principally to define such models of data analysis that users can understand and perceive [28,29].
3. Methodology
We focused on the business information systems and enterprise engineering trends in the domain of digital financial services.
We followed a two-step qualitative process to determine the underlying enterprise architecture, collection, and use of customer data, of the generic data science financial ecosystem. First, we conducted desk research, obtained relevant documentation and related developments in the use of data science methods and tools in financial companies, and came up with the toolbox of data science methods for future researchers or practitioners to use in the domain. Second, we collected data regarding 4 case studies. We relied on the data sources as specified in Table 1. A descriptive review approach was employed to review relevant documentation on the enterprise architecture and to identify the typical patterns in financial e-services, process models, and enterprise architecture. Data regrading the case studies were collected in Spring 2020. Multiple data sources were consulted. First, we collected general information about the companies through their websites, external documents, and sources in our possession. Some participants also provided us with further materials, in the form of business plans or initiative overviews. We also conducted interviews, giving us access to responders’ interpretations of the processes happening inside their respective companies [30]. Then, we moved on to “data triangulation” for the data coming from the case studies, essential for qualitative research such as ours, as this ensures trustworthy and accurate results [31]. We followed an iterative process, initially gathering and considering only one set of secondary sources, before conducting interviews with the founders. Then, we composed another set of sources based on the information derived from the interviews. The data triangulation process considered all the sources (observations, data from interviews with participants, external documents) obtained at different steps in the process (see Appendix A).

Table 1.
Sample overview and data sources specified by case.
From the first step of the analysis, we were able to obtain an overall view of the findings that emerged from the exploratory case analysis. We built a unified framework to organize the results into sets of variables, dimensions, and domains discussed in this paper to offer a full understanding of our multidimensional findings. We consulted Google Scholar as a data source to identify the occurrences of journal and conference publications between 2011 and 2021 that included the following keywords “data science”, “methods”, and “financial company”. The search produced 155 research results. The sources were included only if all the authors agreed that the source was indeed relevant for the study. After the elimination of false positives or papers not relevant to the aim of the paper, a total of 33 papers remained for examination and used for reporting in the data science methods section. The second step of our study was, therefore, aimed at comparing our findings with the enterprise architectures from other domains, and therefore generalizing our model. In Section 2.1, we identify the subdomains of the financial ICT industry. In this second step, we tried to identify typical patterns and usage, looking for similarities and differences in our case studies, and we developed a generic model for enterprise architecture for a data-driven financial company, the primary roles of the functions of different employees in the company, and services that can create extra value for the customer.
4. Findings
Based on our literature review and desk research, we first briefly summarize our research on the latest trends, data analytics, and data science methods used by financial companies. Next, based on the findings from our case companies, we developed the model of the de facto financial company enterprise architecture, the role of the customer in it, and the envisioned role of knowledge management in the companies.
4.1. Data Science Methods Used by Financial Companies
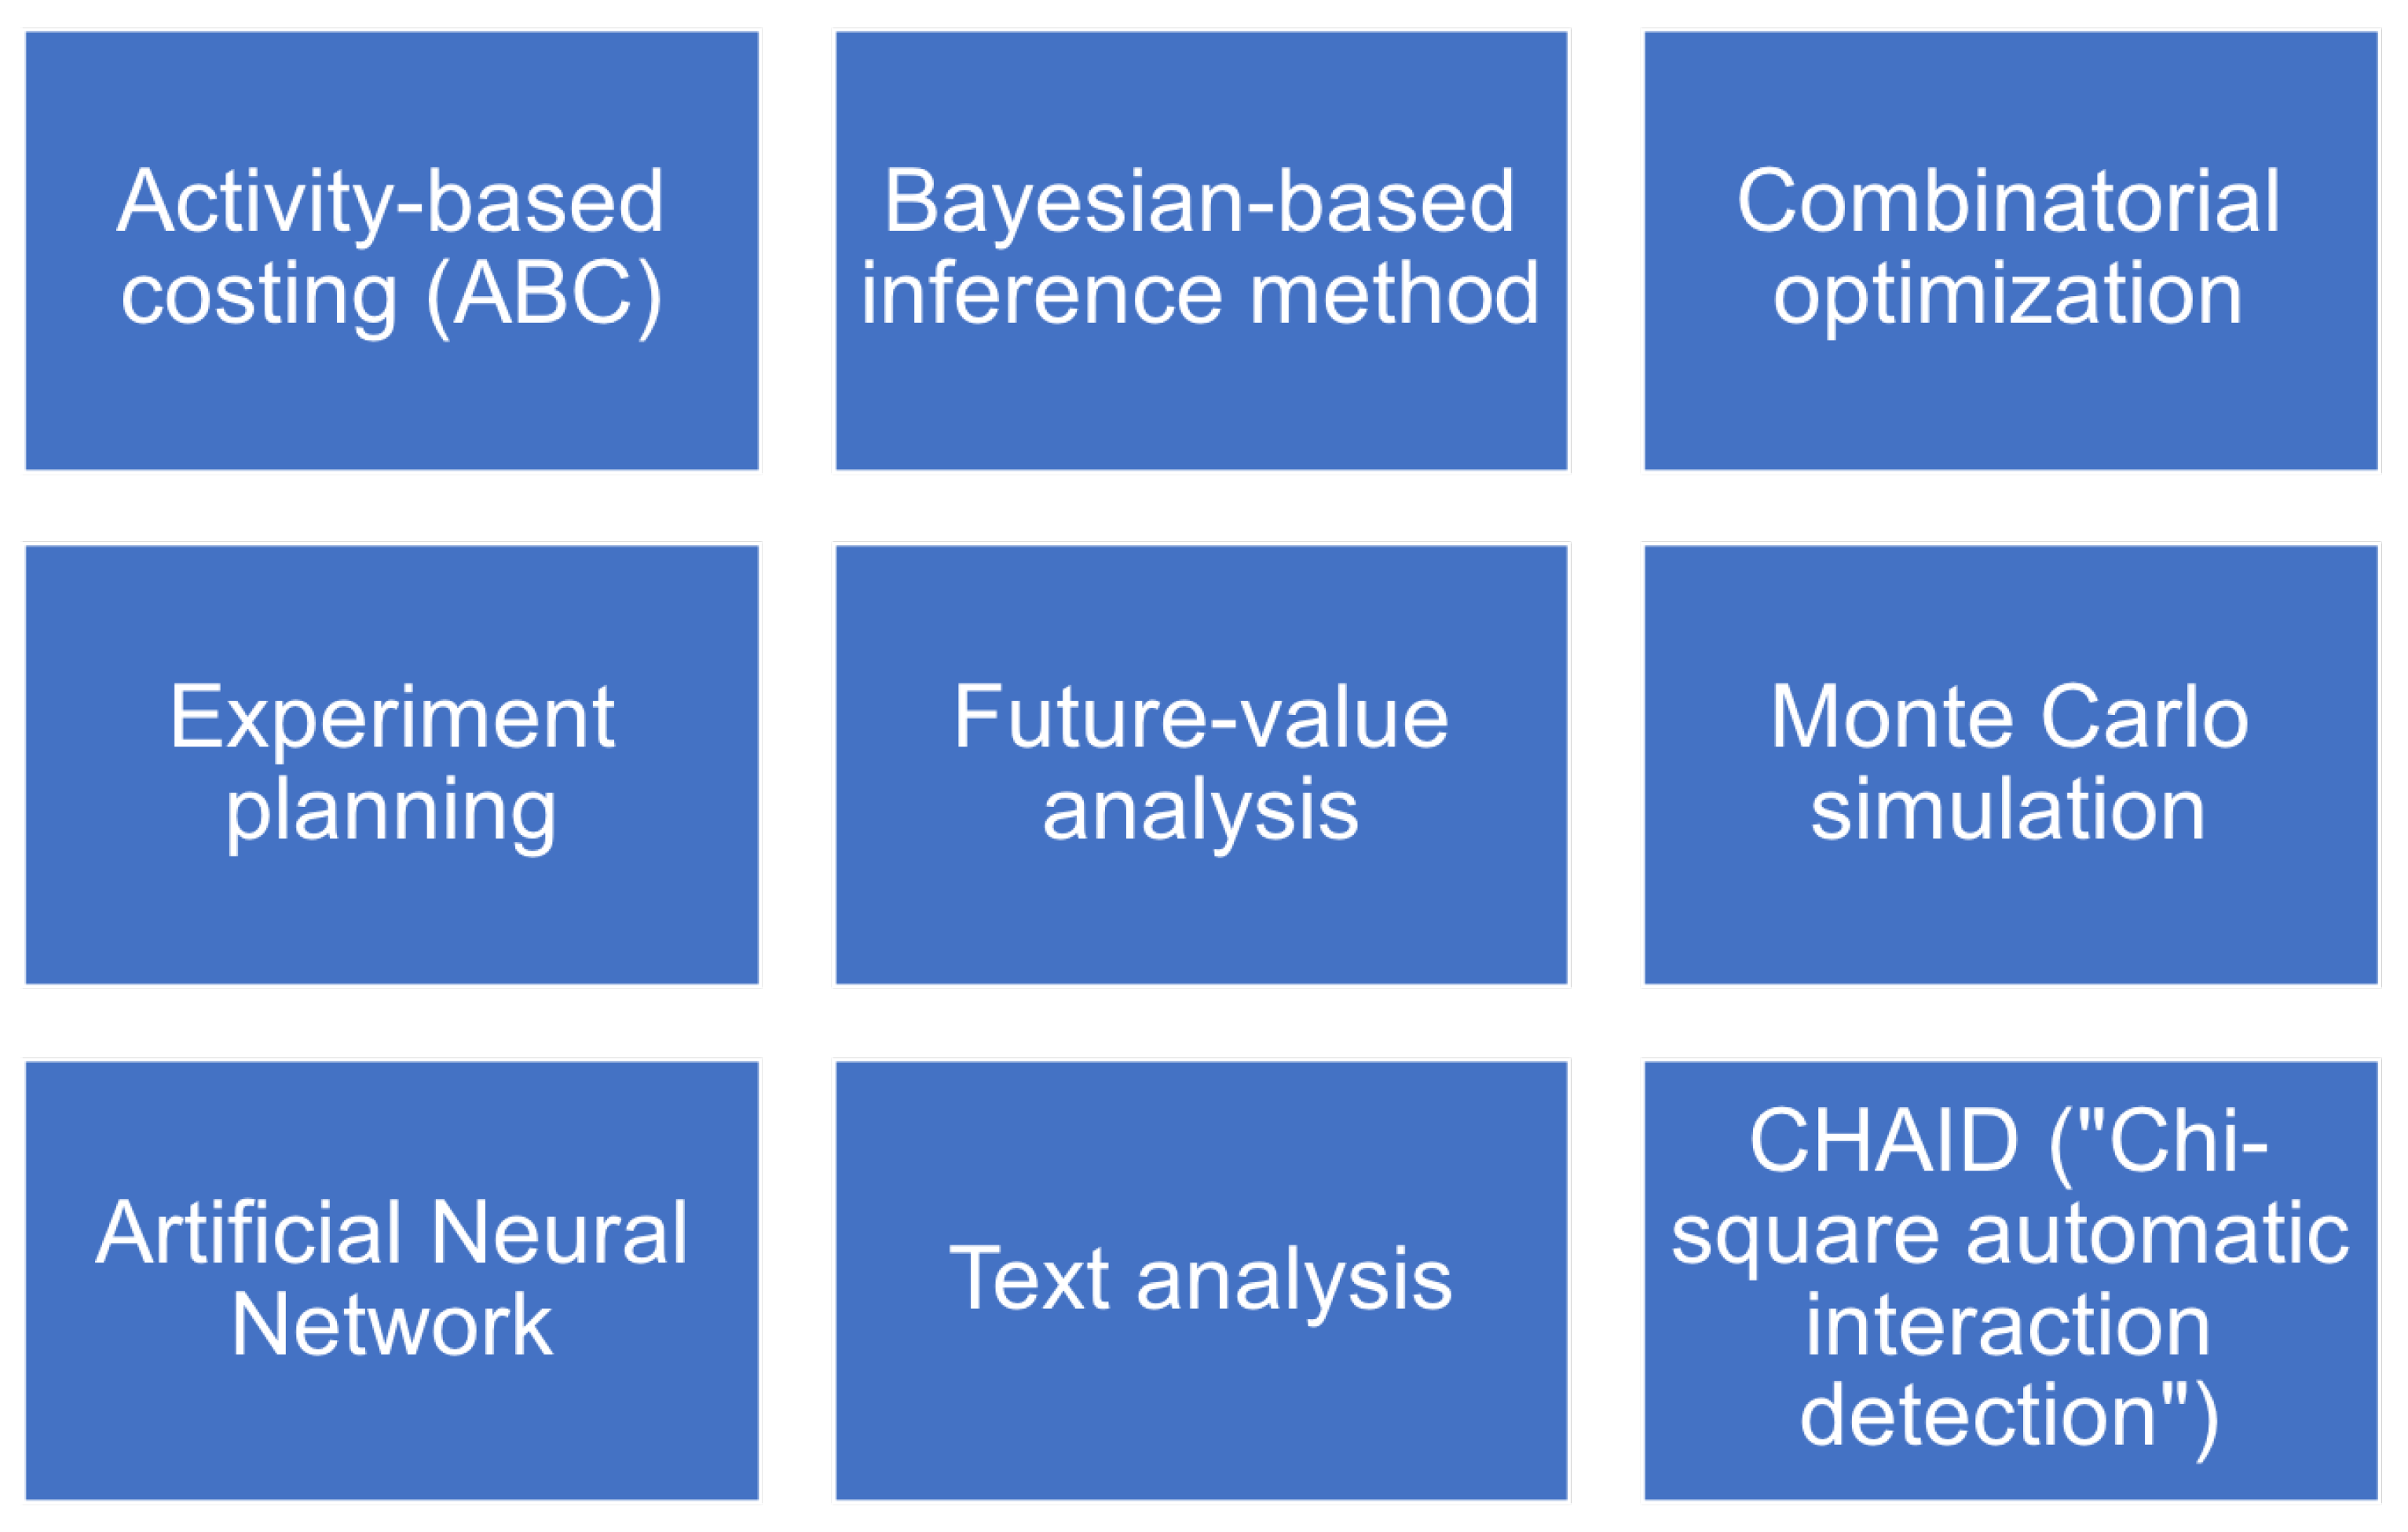
Our literature review and desk research investigation brought us an understanding of the main mathematical algorithms that are currently operational and used for different applications. Figure 1 offers a summary of the tools and methods we present in this section.
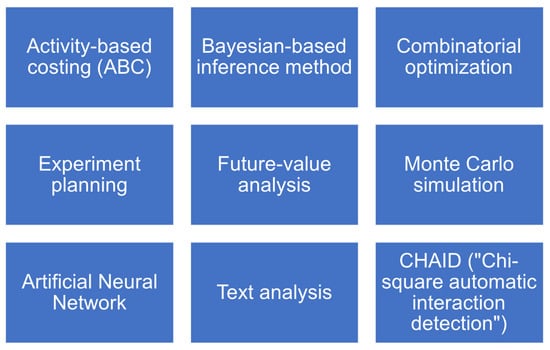
Figure 1.
Different tools and methods a company can use on their data, based on our literature review.
The methods listed before and expounded briefly are employed in businesses in general after executing some steps of digital transformation. The techniques and methods themselves are not FinTech- or financial company-specific; however, the application of these methods requires extensive and intensive tailoring to the specificity of financial firms [19,32]. These techniques comprise essential constituents of the digital transformation of enterprises.
Activity-Based Costing (ABC): The first step in activity-based costing is to correctly distribute costs to the organizational units, cost centers, and/or profit centers such as customer relationship management, business/organizational processes, products, services, or sales channels or the activities, materials, resources, and models that include constituents for the sale of merchandise; the activity-based costing method enables the optimization of prices and costs and the prognostication of the needs for resources. One inconvenience noted in the case of Raiffeisen Bank in Luxembourg was that the model was expensive, complex, and time-consuming because it required many resources and calculations and much updating [33].
Bayesian-based inference method (e.g., revenue forecast): This is based on the Bayes theorem on conditional probability, e.g., the probability of hypothesis considering the income and the cash-flow status of the actual revenue before and after settlement. Previous research [34] has developed a Bayesian-based credit risk stress-testing methodology, which can be implemented by small-to-medium-sized banks, as well as presenting empirical results using data from the recent CCAR implementations.
Combinatorial optimization (e.g., to optimize the product portfolio or to schedule resources for project tasks): This is the effective distribution of scarce resources to attain the best resolution for specific objectives given if several values of the variables (e.g., a given number of employees) are integers (because the employee cannot be divided into parts), and there are many conceivable combinations. This is the so-called integer programming. Reference [35] proposed a novel approach to the combinatorial portfolio selection problem; it employs the Case-Based Reasoning (CBR) approach, based on the Industry Classification Benchmark standards. The paper found that this approach outperformed traditional approaches.
Experiment planning (e.g., to assess the impact of an Internet page, a mailshot, an advertising campaign, etc.). In the simplest experiment, participants were split randomly into two equivalent groups. One group (the reference group) can receive the pilot “program” (e.g., an Internet page or something that the enterprise intends to investigate), and the other team (the comparison or control group) is not exposed to the experiment. If the pilot “program” yields a statistical significance of the difference in the result variable, it is assumed that the hypothesis is true that the “program” has an impact. In the banking industry, considering various credit constructions, the willingness to pay, and the creation of individual offers according to the consumers’ categories is an essential business factor, and thus, experiment planning is taken seriously [36].
Future-value analysis: This is breakdown of market capitalization into the present value (extrapolation of existing economic yields) and forecast, the estimate of future costs, or expectations of future growth. In the financial sector, this approach is often used in the context of risk management to identify risks such as possible poor payers or precarious investment decisions. The use of data analysis methods may not make risk evasion possible, but it does help identify potential risks on time. Data science techniques can help financial sector companies adjust enterprise strategies and business processes to reduce risks [36].
Monte Carlo simulation (e.g., for the evaluation of R&D projects or return on investment): Monte Carlo simulation is a computer procedure that can be employed to estimate certain outcomes or risks. A mathematical model is applied to evaluate the calculations of multiple experimental models for hypothetical alternatives (best, worst, average) and matches the outcomes with the preset probability distributions [37].
Artificial Neural Network: Theoretically, it has been proven that neural networks are able to approximate any continuous nonlinear function, provided sufficient data and enough neurons are available. If there is a nonlinear dependency among the elements of a specific data collection, then neural networks can detect and apply this nonlinear dependency for solutions. This theoretical result is very important in practice. Thus, various financial, economic, corporate, and human behavioral patterns can be modeled by this approach and short-term forecasts can be made by the model (around one year), allowing the enterprise to exploit it to do business [38].
Text analysis, text mining (e.g., the assessment of intangible capabilities and available human capital within the enterprise): Text mining and analysis means that the ranking of the terminology, technical terms, phrases, and documents that are available online should be carried out; moreover, the analysis of their semantic relationships within online texts should be built up [39].
CHAID: This statistical method, is an abbreviation for a method called “Chi-squared Automatic Interaction Detection”, which can be used to isolate groups of clients based on different alternative variables. The analysis creates a tree that represents isolated segments of customers, consumers, and clients. The algorithm works as long as the tree-building algorithm can create branches and leaves that are statistically significant [40].
4.2. Relationships between Data Analytics Methods and Disciplines of Informatics
Next, we organize the methods used and describe their relation to different disciplines of informatics. All the main data analytics methods are within the broader domains of computational intelligence, artificial intelligence, decision support, and data science. We provide an overview of the data methods and disciplines of informatics to which they belong in Table 2, based on [41]. The categorization of the various methods is not strictly adhered to, and some methods may fit into more than one scientific discipline. In an enterprise environment, in financial institutions, and in financial services technology companies, the decision-making is traditionally grounded in data analysis. The rapid development in data management over the past decades has led to a set of tools that are classified into various disciplines of information technology. In data management and capture, there has been an evolution in the data-handling systems’ overarching network and hierarchical, relational, and NoSQL database management systems, then data warehouses, data marts, and data lakes. This progress makes it possible for an enormous volume of data to be collected in databases and accessed on the web by companies. Decision support has been an interdisciplinary area between management, computer sciences, and business administration. It utilizes the methods of operational research in the mathematical background.
Table 2.
Relationships between methods of data analytics and disciplines of informatics [41].
Business intelligence is perceived as data modeling and retrieval that are based on well-organized data warehouses storing high-quality data so that business intelligence creates standard reports. The business requirements for forecasting and in-depth analysis stepped over the services of reporting. The exploratory data analysis along with the multidimensional databases offered approaches that provided techniques for such complex analysis as univariate, bivariate, and multivariate statistical investigation [42,43], i.e., a tool set for multidimensional analysis. The development of interrelated fields such as computational intelligence, artificial intelligence, and data science produced algorithms that combined with the exploratory data analysis laid the foundation for methods that can tackle complex business problems to forecast, predict, and prescribe the deeds of companies [19].
Supervised machine learning algorithms are employed for problems of classification and prediction. The precondition to using supervised learning is to own data that represent the outcomes of interest. These data can be used for “training” the algorithm. Simple linear regression is the simplest example where there is one outcome variable, in which the training data values are known, and there is one predictor (explanatory) variable.
Unsupervised machine learning algorithms can be applied where no outcome variable can be forecast or categorized; therefore, there is no training set and no chance to learn from available cases. Typical techniques that fall into this genre of algorithms are as follows: association rules, dimension reduction methods, and clustering.
Data visualization can be used for graphical representation in tandem with data exploration. Various visualization techniques can be used for data cleaning such as spotting missing values and duplicate rows and columns in a table. It can be applied, furthermore, to determine which variables can be interesting for analysis and which variables seem to be redundant.
Reinforcement learning is not a specific algorithm. Rather, it is an approach that can support goal-directed learning and decision-making. It relates to the learning problem to be solved. The goal of reinforcement learning is to explore which acts will give the maximum results in a given metric. Gradient boosting and neural networks can be used in this scheme.
Natural Language Processing (NLP) is used to extract meaning from text, to generate text, etc. The algorithms are typically based on various machine learning techniques that approximate what human beings can do in similar cases. The NLP methods are used frequently in customer relationships as functions for speech recognition, for answering questions that are generated by human beings in natural language.
Descriptive analytics and statistics are employed to identify data in the past and pinpoint patterns in data samples to describe trends. The tool set that can be applied includes data modeling, data visualization, and regression analysis. The purpose is to examine the business performance by using standard and ad hoc reporting, dashboards, drill-down, and roll-up. Inferential statistics typically uses logistic and linear regression to draw inferences from the set of data.
4.3. The Enterprise Architecture
The business architecture and enterprise architecture are interrelated. The business architecture concentrates on the management, business, and economics side of companies. The enterprise architecture aims at a holistic picture that takes into account the information technology and software aspects besides the aforementioned viewpoints [44,45], especially when we consider service innovation in the case of Financial Services Technology firms (FinTech). One of the model components, besides the economic-related aspects, is the business process definition and conceptualization in business modeling. The business services are yielded by business processes that are supported by services of information systems. Information systems are based on information technologies. New services can be created through service development and planning innovation [46]. In the case of financial services technologies, the innovation of services should fit the categories of either radical or disruptive innovation to achieve market and business success [47,48]. Furthermore, service development happens through service modeling, design, and engineering. FinTech firms are embedded in the technology-intensive, especially the Information Technology (IT)-intensive sectors of the market and business; thereby, the service modeling, design, and engineering should consider and exploit the IT. However, neither the condition of the organizational and business environment, nor the novel application of the available technologies are sufficient to define novel services. To achieve innovative services with the potential of market success, the FinTech company needs a holistic approach that takes into account, on the one hand, the organizational reality through business process management and modeling, and, on the other hand, that regards the fabric of business and data processes, information and information systems, and IT services realized by software and hardware platforms. These latter mentioned constituents can be described and managed with the help of the enterprise architecture in a holistic viewpoint, namely the Zachman architecture framework and/or The Open Group Architecture Framework (TOGAF) (see Table 3) [49,50]. There are methodologies for the systematic planning and design of innovative services that consider the methods of business modeling and the requirement of innovation to create innovative services. The business canvas method is an overarching approach that relies on other relevant methodologies such as the context map, Janus cone, customer system, co-opetition, and value curve. These methods support the investigation and analysis of the current situation and the generation of new ideas [51,52,53]. The analysis and design tool set of the enterprise architecture makes it possible for aspects of technologies and business service requirements to be examined and managed in a unified framework together with the business demands.
Table 3.
An enterprise architecture for a FinTech company based on the Zachman architecture [49].
For this section, we used the findings from our case studies. We analyzed and grouped the different data collected from the case studies, and we drew what would be the generic architecture of a financial company, taking into account and satisfying the different functional needs of the case studies. This architecture should provide the capability to cooperate securely from the consumers’ desktops, business partners, and “suppliers” (business agents, brokers, etc.) on the following lines:
- Business policies: The policies incorporate the strategic management, vision, and the derivation of subpolicies such as security, data protection, etc. This set of policies defines the overarching objectives and the realization of the company vision;
- Business processes at operation: These business processes and workflows are inherently collaborative and operate in a controlled, secure environment in which the acquired knowledge and information assets can be shared securely across diverse business units and, in some cases, silos that are created by necessity because of specific security and data protection constraints;
- Technology level architecture: The technology level architecture—within the Zachman architecture, the three lowest rows in the table, “Physical, Detail (as it was built), Functioning Enterprise (operation of the infrastructure)”—creates the opportunity for collaboration spaces in cyber-space (see Table 3). One communication domain can serve for internal cooperation and one domain the external cooperation, and one domain might be allocated to handling issues related to the data protection, sensitive information, and security. The access rights are addressed in the column “Who”. Since there are several legacy systems within traditional financial companies, integration with the recent technologies is a need. The integration compels the application of a combination of standards and technologies in a disciplined way, and conventional management technologies for data collection such as relational data base management systems and data warehouses should be complemented by technologies such as data lakes, modern data catalogs, data dictionaries, and the methods of data analytics (see Figure 2).
The Zachman and TOGAF architecture can be used to analyze the current situation and then define an abstract enterprise architecture model [49,50]. The abstract enterprise model can be composed of various views of stakeholders and can be grasped by particular artifacts that comprise the viewpoints. The rows of the table (Table 3) present the viewpoints of the involved participants, namely the owner, the strategic planner, the business analyst, the system analyst, the system builder/program designer, and the subcontractor/implementer, explaining also the different functions of the participants in the form of what they do, how, with the help of which tools, in which process they intervene, when in the process they intervene, why they intervene, and their place in the model view. In the context of financial services technologies, the enterprise- and service-architecture-based approaches can assist in the digital transformation of companies and service innovation.
Every cell in the table expounds a descriptive artifact that depicts a particular aspect of the enterprise architecture. In the case of FinTech companies, the strategic planner’s view of functions (“how”) includes a list of business services to be performed; the owner’s aspect of functions constitutes the company’s detailed business model that specifies the activities, information, and control flows and particular responsibilities of actors and roles. The enterprise architecture determines an overall model for each view and makes it possible that various methodologies, methods, and techniques can be used to realize the pieces of the overarching model in every cell. The strategic objectives should include value propositions, the strategy plan described in a balanced scorecard, and methods for modeling the organization. Various methodologies and approaches can be used for developing single artifacts, e.g., Business Process Modeling Notation [55], Unified Modeling Language [56], and Structured Analysis and Design Method [57,58]. The products developed by the methods depict entities, their attributes, data, functions, services, and the relationships among them. Some methods along with the supporting tools allow the functional simulation of business services occurring in the owner and business analyst view to assess the expected performance of the company. Some standards precisely prescribe how to specify the physical design and the implementation at the component level [59]. The formal description of the enterprise architecture provides assistance for consistency and integrity controlling [60]; furthermore, the formal representation of the enterprise architecture supports the digital transformation and service innovation [61].
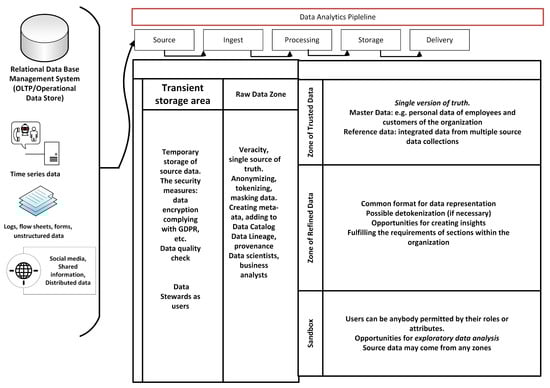
Figure 2.
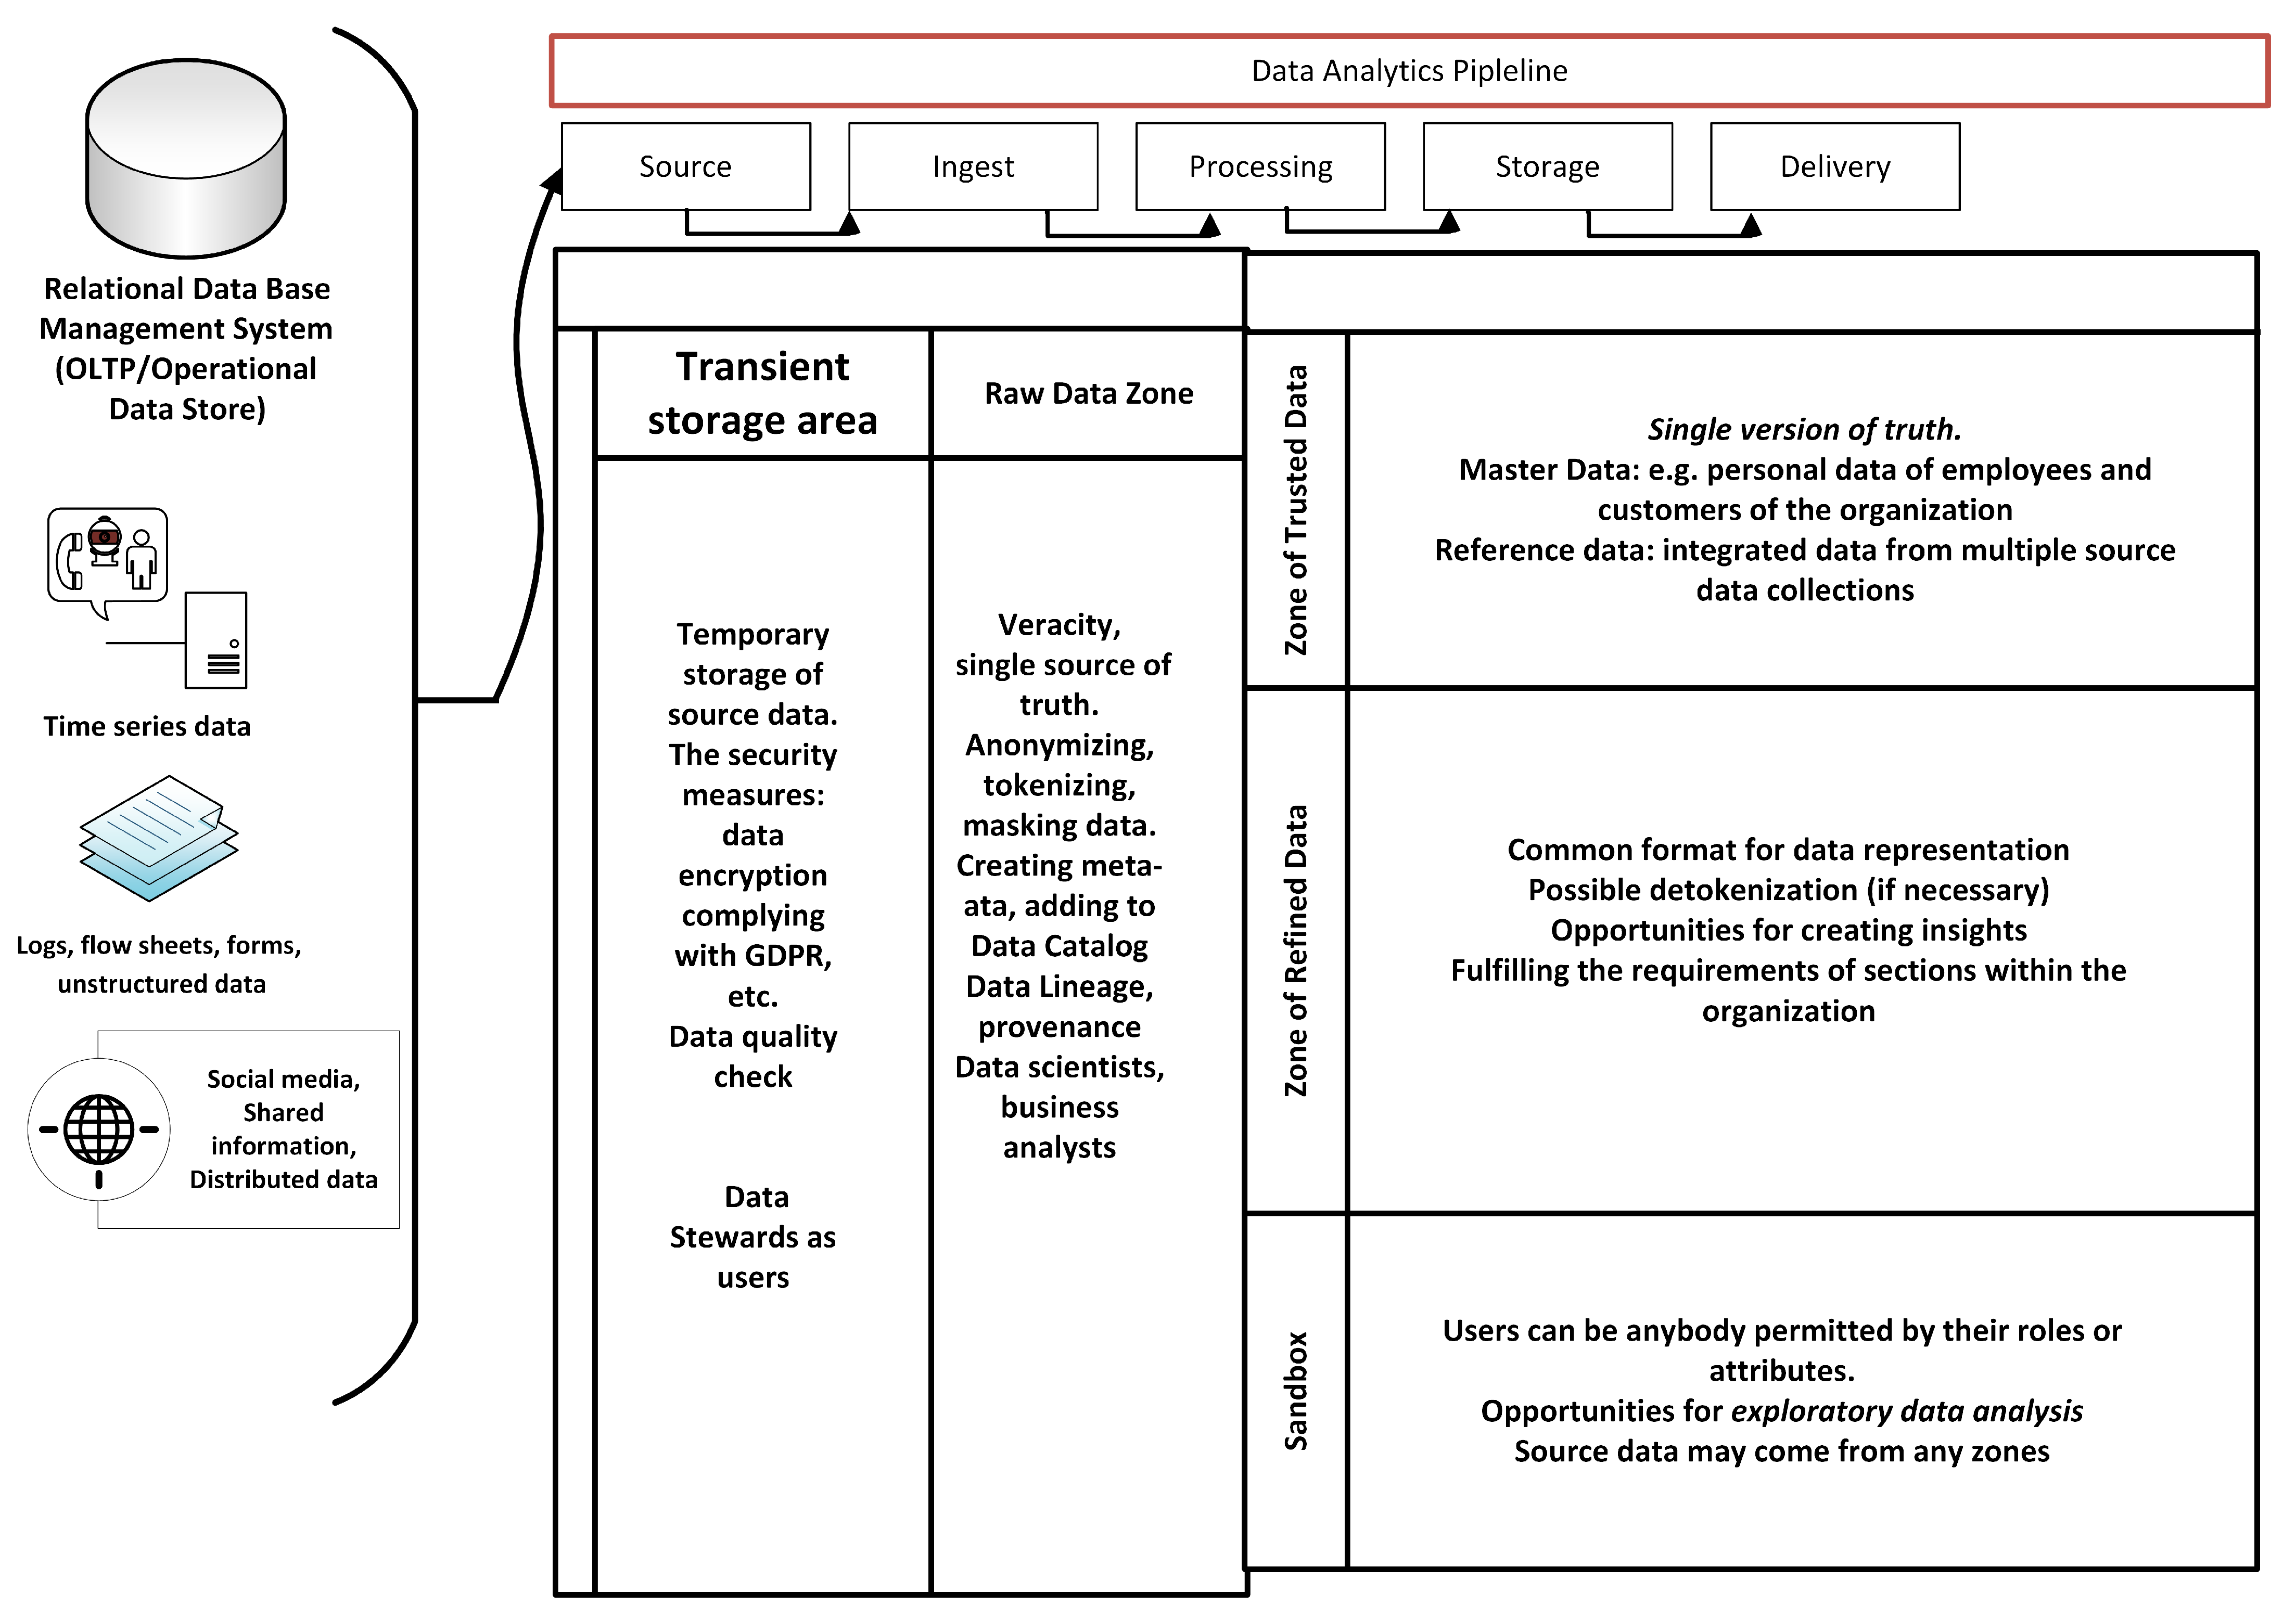
Data lake reference architecture along with the data analytics pipeline a. a In the data analytics pipeline, the information passes five phases, from information being a “Source”, that is raw information for which veracity needs to be checked, to information going through the phases of “Ingest”, “Processing”, “Storage”, and “Delivery”, where the single version of the truth is composed, a common format for data representation is found, and opportunities for creating insights and exploratory data analysis are provided for the company. The editing of the figure was based on [62,63].
Figure 2.
Data lake reference architecture along with the data analytics pipeline a. a In the data analytics pipeline, the information passes five phases, from information being a “Source”, that is raw information for which veracity needs to be checked, to information going through the phases of “Ingest”, “Processing”, “Storage”, and “Delivery”, where the single version of the truth is composed, a common format for data representation is found, and opportunities for creating insights and exploratory data analysis are provided for the company. The editing of the figure was based on [62,63].
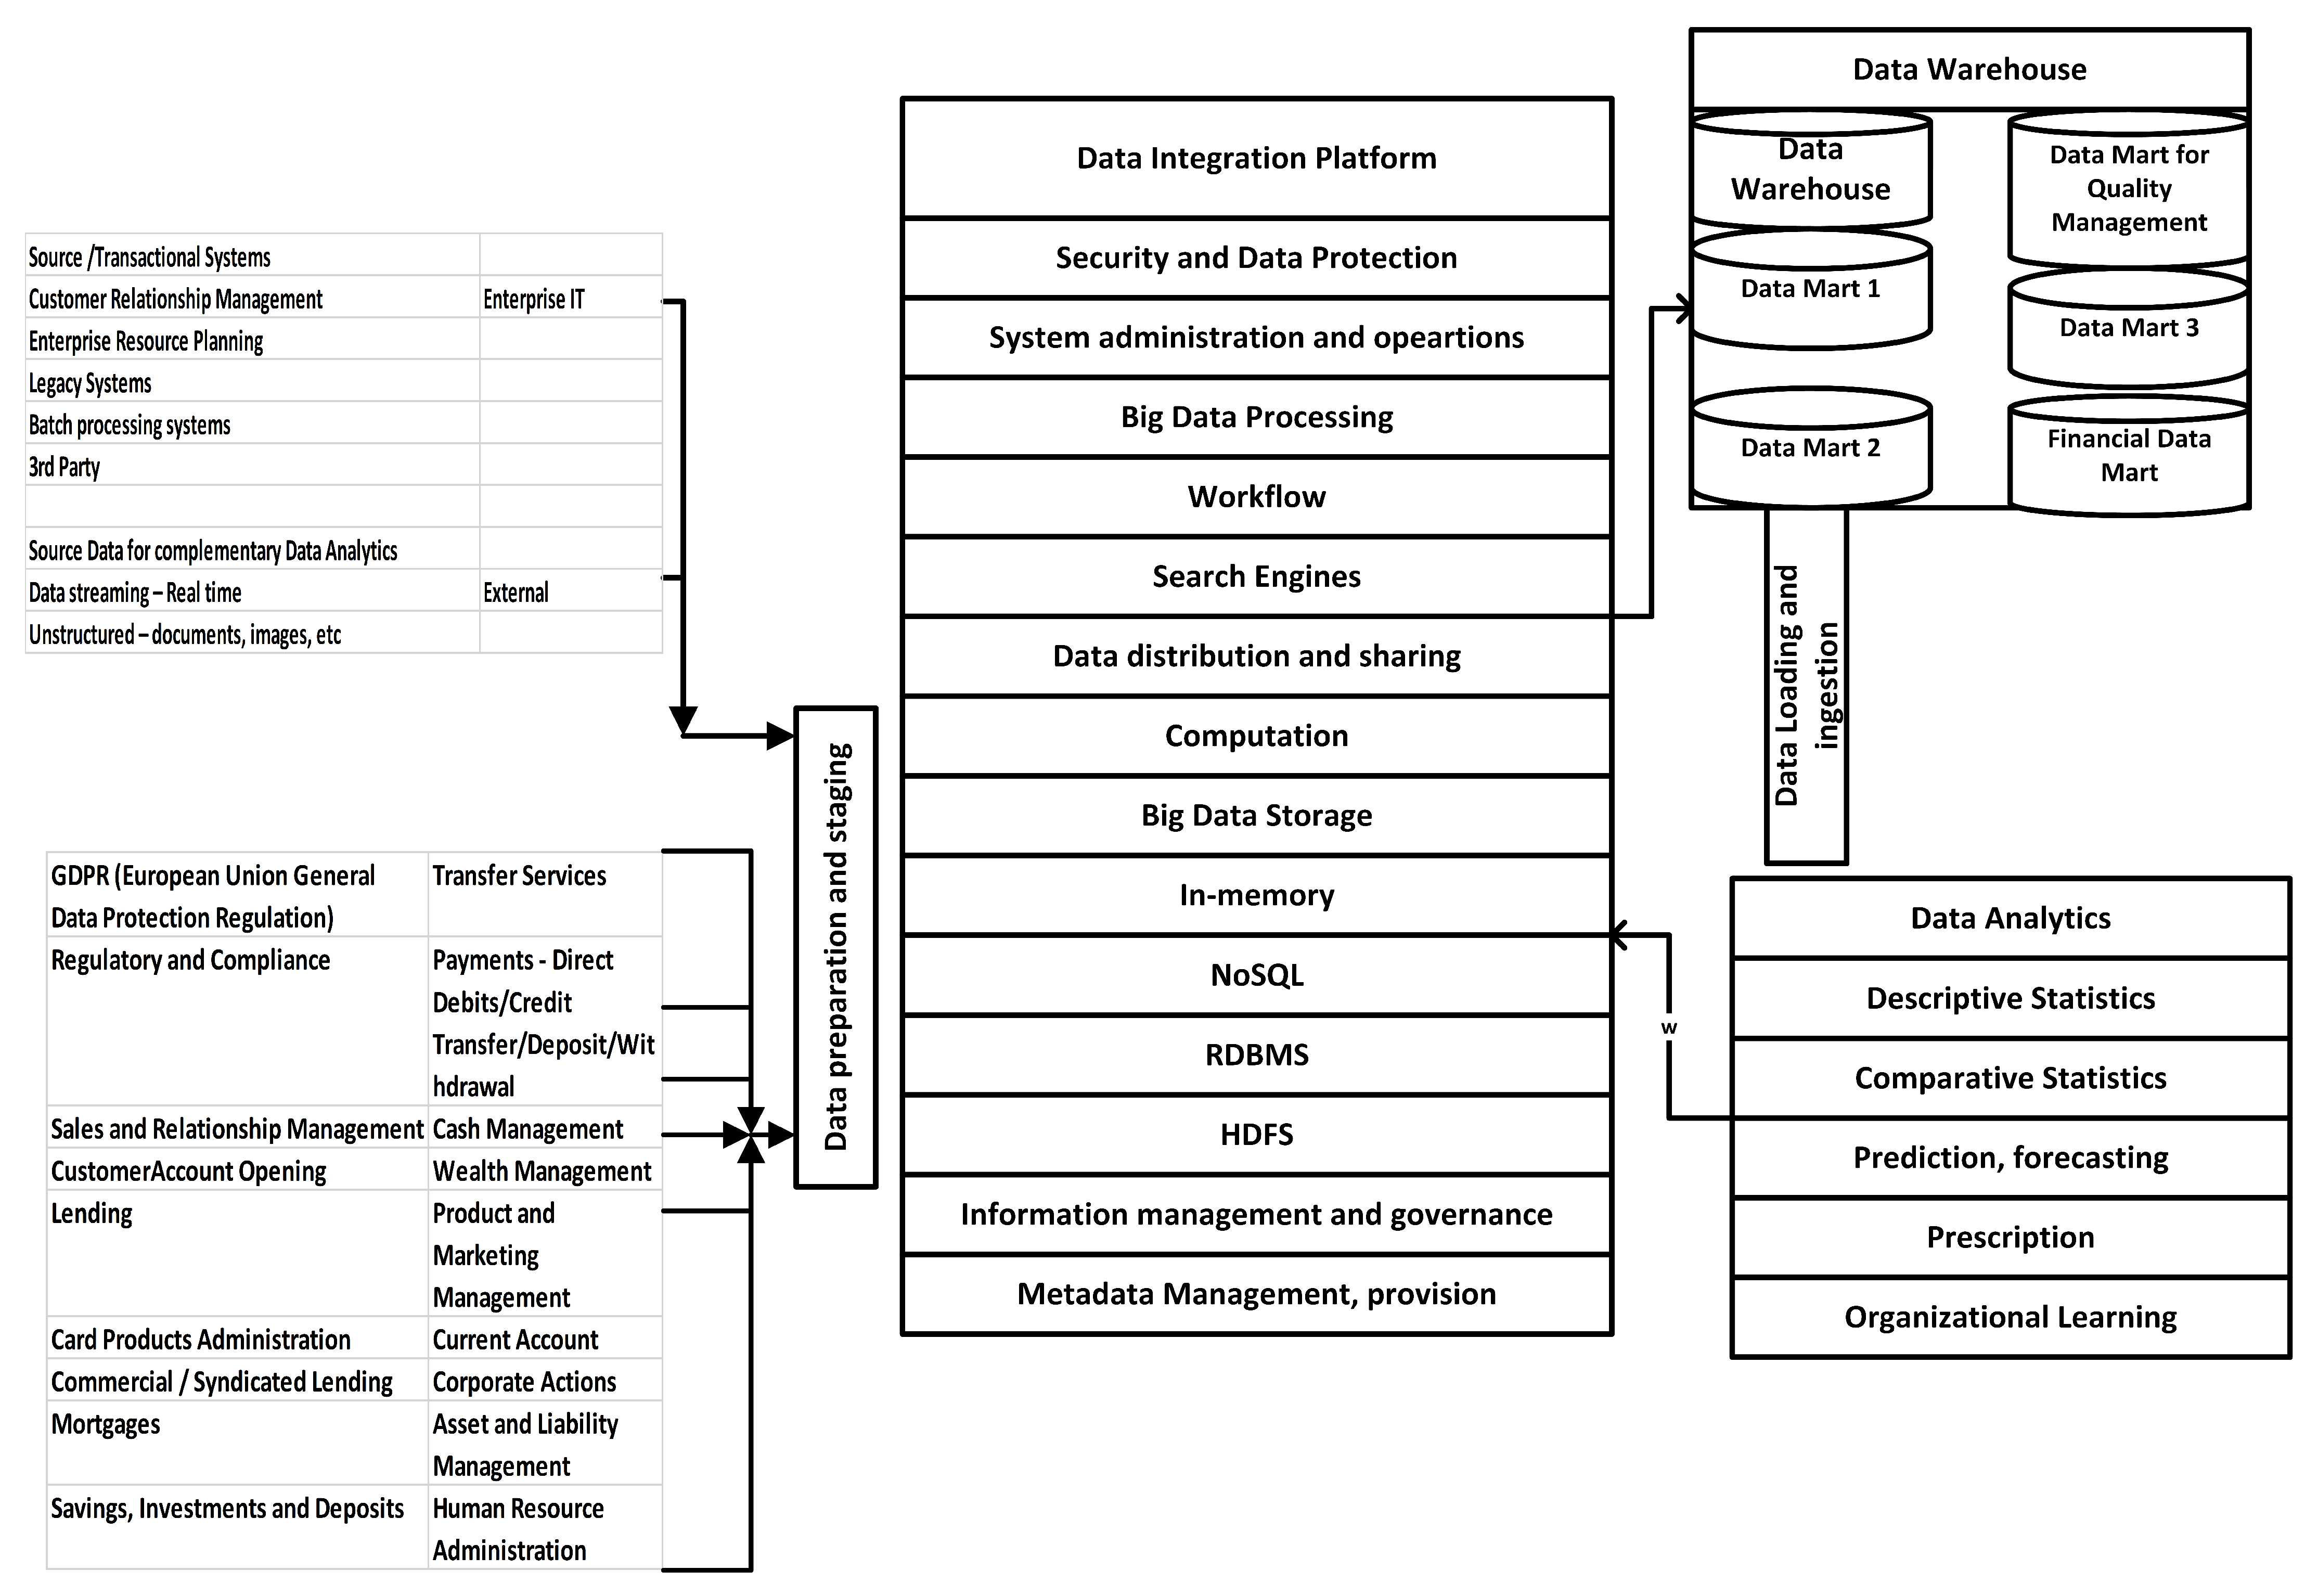
We outlined a component architecture at the level of the technology/functioning enterprise in Figure 3. On the left-hand side, we list the necessary modules for an operating company, that is services that are specific to financial institutions. In the middle of the figure, we collected the services of information technology and infrastructure management that are essential for data processing and data analytics. The data storing architecture can be set up according to the data lake, but a wide spectrum of functions is required to realize efficient and effective data analytics. These functional services can be seen on the right side of the figure in the lower corner, and the techniques of the data analytics can be seen in Table 2. In the upper left corner of the figure, we describe an active symbiosis between the architecture of the data lake and data warehouse/mart that can store the data in a more disciplined and structured way so that the data are readily available for the tabulated structure as the input for the complex data analytics process.

Figure 3.
Data lake and analytics components architecture for a financial services technology company a. a On the left-hand side, we list the necessary modules for an operating company and services that are specific to financial institutions; in the middle, we show the services of Information Technology and Infrastructure Management that are essential for data processing and data analytics; in the bottom-right corner, the techniques for the data analytics can be seen; while in the top-left corner, we describe an active symbiosis between the architecture of the data lake and data warehouse/mart. Sources for creating the figure were from [32,64,65].
The financial sector, especially FinTech companies, is a consumer-focused business. Traditionally, the financial sector has been interested in the segmentation of consumer groups, which can be defined by age, sexual category, activities in cyberspace, societal and monetary situation, and geographical distribution. In the financial sector, business units tailor services and products to satisfy the requirements of each customer segment. Consumers are, of course, not treated equally, and affluent customers are traditionally better cared for. Identifying and especially managing this rich set of customers is important, and using data lakes and data warehouses can considerably improve the procedure of classifying the various target groups. In the data analytics process or so-called data analytics pipeline (Figure 2), the information passes five phases, from information being a “Source” to information going through the phases of “Ingest”, “Processing”, “Storage”, and “Delivery”, where a single version of the truth is composed. In this process, a common format for data representation is found, and opportunities for creating insights and exploratory data analysis are provided for the company.
The advantage of using data lakes lies in the rapid reaction with the right information out of the dataset. In the financial sector, banking, payments, and insurance, the concept of personal touch of services is becoming increasingly valuable and turns out to be the most relevant tool for marketing. Competition between competing companies forces businesses to use these personalized types of services. For instance, a personal recommendation can include how to save money by combining insurance policies or a specific investment construction, which, in combination with the investment, benefits the consumer, etc. (Figure 2).
One of the limits of the application of data lakes will be precisely in this requirement of risk assessment. The issue is how to do it quickly, as the data have been transforming during the analysis. The players of the financial sector may proffer from the development of new or more sophisticated risk models to determine more competitive prices or to provide new innovative services that previously could not be created due to the lack of information. Nevertheless, the information gap is now being filled by available data. In this respect, data lakes make it simpler for data analysts to work in an enterprise environment, and new methods of analysis could be used faster when using data lakes [66,67].
The knowledge of an enterprise has turned into a fundamental resource for companies regarding rivalry. Knowledge management requires much more sophisticated approaches than the governance of the traditional components of the company as financial and human capital and natural resources. Thereby, the knowledge management requires the careful cooperation and orchestration of human resources, business processes, information, and other technologies to bring about the strategic objectives of the company considering financial stability, security, and business expansion in a dynamically changing environment. The knowledge management should consider the organizational culture and structures that make it possible for the actors of the company to work together in a collaborative way, exploiting organizational learning. Business processes should incorporate knowledge management activities as information and knowledge exchange, discovery, storing and archiving, making decisions based on carrying out logical inferences, and the application of knowledge in a company-wide manner. A huge set of information and knowledge technologies should be employed to empower the staff and business activities to obtain actionable knowledge. Figure 3 shows a modern information architecture in the form of a data lake, which consists of two major parts, namely storage facility and information processing. The objective of a data lake is to establish and store data collections in a raw format in a dedicated zone. The idea underlying this solution is that data analysts can retrieve the original data to answer queries in the future that would need the original format without any transformation into a disciplined structure or aggregated form. Thereby, the data lake is an enterprise-wide, centralized storage place that accumulates the raw, source data and the transformed versions as well. To be effective, an essential set of data management services should be available for metadata management, data governance, and support for exploratory data analysis. Knowledge management exploitation relies on effective and efficient information architecture. Systemic metadata management is required since metadata are an extra layer of the data structure that is used by the methods of data analytics [68,69,70].
The overarching metadata of an enterprise can be represented by an appropriate graph structure, semantic net, and ontology [71]. The advantage of ontologies is that an ontology can describe conceptual hierarchies and concept relationships in an accurate way using description logic [72] to formalize inheritance and synonyms–antonyms. Ontologies can be considered as the formal end of the spectrum of structures that depict concepts, their properties, and their relationships and includes lexicons, taxonomies, and the schema of data collections. Such an information architecture makes it possible to apply the semantic search for retrieving data, defining a proper structure of the data, and preparing for data analytics.
5. Discussion
Many stakeholders are facing a fundamental change in their work due to data science.
Therefore, the stakeholders need to understand how the ecosystem is going to change to adopt data science practices and to transform the competencies of stakeholders into new value-creating services for clients or improved operations for the companies. Different disciplines within informatics examine different trends: Computational Intelligence (CI) and Artificial Intelligence (AI) deal with unsupervised machine learning reinforcement learning trends and big data management; Business Intelligence (BI) deals with business reporting and decision-making, multidimensional analysis, natural language processing, and data administration; decision support deals with inferential statistics, predictive modeling, data discovery, visualization, and retrieval. Data science—including computational intelligence, machine learning, statistics, and data management—provides a tool set for problem-solving. Three realms of profession and science come together to respond to the most recent business issues, namely data science is a part of informatics, and knowledge management is a part of management sciences, and business informatics and business administration that contains strategic management and operation. The challenge is to reconcile these domains to give integrated support for decision-making, strategy, and tactical formulation.
This paper provided valuable new insights by determining precisely the role of different data science disciplines in the FinTech domain, the applications, and everyday use cases in which the companies use these technologies in the financial sector and described the future enterprise architecture for a FinTech company based on the Zachman architecture. Moreover, this research demonstrated how data-driven business ecosystems can be studied from a data science perspective and complement their current offering with novel approaches inspired by different business goals, objectives, and rules. While the previous literature had a generic character, this work presented a more in-depth analysis of the use of data science for FinTech companies, possible future architectures, and business logic that might be in place in finance companies. The existing information architectures at finance companies are complex structures, which are only amplified and require further attention to the development of new data science approaches.
These findings can be used by practitioners to analyze changing business informatics practices. Practitioners can then transform their ongoing way of reasoning and practices into the methods that are already suited to the use of modern data science approaches on their data. The technical support would need to perform the mapping between their current architectures and architecture as described in our article and think critically about the actual feasibility of such transformation for their company.
It is important to point out the generalizability of our approach and to underline the limitations of our work in several aspects. First, our example applications did not include all possible subdimensions of the digital finance space (we focused mainly on market research and risk analysis), so in future work, we may need to complement our work in this respect. Second, our research focuses on the data lake reference architecture and data analytics architectures and pipelines based on the Zachman reference model. In future work, we may try to take a more process-oriented point of view and use, for instance, the TOGAF reference model [50]. Third, since the developments in this area are rather fast, our paper might quickly be outdated, and new more modern architectures may become de facto standards for the scope.
Future research considering scenarios and deployment models and enterprise software may enhance the current proposed architecture. Furthermore, future work can build on this study by applying, as proposed, the TOGAF reference model introduced by [50]. This approach might help stakeholders have another point of view of the proposed architecture. Furthermore, future research can focus on the level of ease to transform or potential value created by the implementation of such new architectures for companies and even further detail the new roles, activities, and business models. Finally, we agree with [73] in the call for research on platforms’ ecosystem beyond AI and cryptocurrency segments. Our study on the enterprise architecture for finance companies for that reason is a first and significant step in such a direction. The paper’s contribution is that the disciplined, theoretically grounded architecture approach was applied for financial services technology companies and financial companies in transit during the digital transformation. We collected the techniques, methods, and algorithms from the field of artificial intelligence (data science, machine learning, and computational intelligence) and arranged them in an information architecture that is used in practice. This configuration yields a theoretically grounded pattern and a practical direction on how to apply it in real life. The theoretical results and the practical advice were grounded in empirical case studies and a qualitative literature research.
6. Conclusions and Future Directions
Our paper was guided by the will to explore and understand the current state-of-the-art in the domain of data science approaches employed by financial companies. First, we derived a literature review on the recent advances in the different categories of digital finance segments. Second, we analyzed the steps in the big data analysis process and the application scenarios as observed in the financial domain, with different examples of applications in market research and risk analysis as examples. We proposed an enterprise architecture for FinTech companies and proposed a process for the data collection, analysis, and exploitation of big data.
Many researchers study technology issues related to only specific segments of digital finance—namely payments, cryptocurrencies, or consultants. Thus, they do not provide a holistic overview of how the enterprise architectures should look in companies. We analyzed the process of big data analysis in the context of enterprises. In this way, we can provide detailed overview and analysis of the way the companies can implement digital finance services based on new data science approaches.
We conclude with three practical implications from our work. We described the state-of-the-art data science methods and tools used by practitioners in the field. Each of them was described through some critical use in the financial industry and linked to the type of outcomes it creates for the company. As such, this contributes to the literature by providing necessary conditions to use data science to create value for companies. This study suggested that providing novel or more efficient solutions is at the core of big data and knowledge management for financial companies. Second, the literature review and the interviews we performed for this study explicitly pointed out that the use of novel data science tools and methods for their work is important for the industry. These tools and methods create infrastructural business value for the companies involved in the study and improve their position in the market. Therefore, we provided, based on our literature review, a common infrastructure and reflected on what might be the benefits for companies in implementing it. We aim to empirically test this with companies as part of a future work on which we are currently working. Lastly, this study showed that consumer data are transformed into value by short, frequent, and continuous use of data analytic techniques with dedicated infrastructures. We proposed suited and adequate infrastructures for such value creation and capturing. Challenges remain on how to incorporate these approaches in multidepartmental organizations. Organizations need to have excellent communication between departments to allow for such use of the possibilities offered by big data. When engaging in a setting such as infrastructure, considerations should be made from this perspective as well, and a cross-functional team that is involved in the whole initiative should be formed.
Our future research is along two lines of thought: (i) the information engineering point of view that is based on the MERODE modeling language as a theoretical basis [74]; the MERODE language was developed for enterprise engineering, including business processes and activities, to work out useful patterns for the digital transformation of financial companies; we want to describe the future enterprise FinTech architectures, and apply the TOGAF (Section 4.3, [50]) reference model also so as to extend and expand the findings that were explored by the Zachman architecture; (ii) the innovation and entrepreneurship point of view, based on case studies, in which we will study the innovative business processes of FinTech, InsurTech, and other financial services technology companies that they use to improve their operations by applying the business canvas and techniques that are coupled to it.
Author Contributions
G.P. and B.M. worked on the conceptualization of the raised issue; they wrote the original draft version, then they carried out the editing and revision. Á.T. proofread the draft and revision and supervised the process. B.M. acquired funding to support the creation of the paper. All authors have read and agreed to the published version of the manuscript.
Funding
Thematic Excellence Programme TKP2020-NKA-06 (National Challenges Subprogramme).
Institutional Review Board Statement
Not applicable.
Informed Consent Statement
Not applicable.
Data Availability Statement
The data regarding the literature review part are openly available through Google Scholar, the data regarding the case studies are available on request from the corresponding author.
Acknowledgments
The project was supported by the European Union, cofinanced by the European Social Fund (EFOP-3.6.3-VEKOP-16-2017-00002).
Conflicts of Interest
The authors declare no conflict of interest.
Appendix A
The interview guide was developed on the basis of the conceptual frameworks developed by [75,76,77]. Given the exploratory nature of the study, the questionnaire consisted of open-ended questions. These interviews lasted between 35 min and 60 min. The check list dealt with the following subjects:
- The steps in the process of the use of big data;
- The type of activities the company performs daily;
- The critical success factors of the solution.
Table A1.
Summary of collected data: all sources.
Table A1.
Summary of collected data: all sources.
| Data Type | Quantity |
|---|---|
| Semistructured interviews | 3 |
| Websites | 4 |
| External documents and sources | 25 (3—business plan; 5—reports, 15—informal emails, 2—meeting minutes) |
| Participants observations | 2 (participation in company meetings) |
References
- Vasiljeva, T.; Lukanova, K. Commercial banks and FINTECH companies in the digital transformation: Challenges for the future. J. Bus. Manag. 2016, 11, 25–33. [Google Scholar]
- Harvey, D. Digital transformation in banks: The trials, opportunities and a guide to what is important. J. Digit. Bank. 2016, 1, 136–145. [Google Scholar]
- Pisoni, G. Going digital: Case study of an Italian insurance company. J. Bus. Strategy 2021, 42, 106–115. [Google Scholar] [CrossRef]
- Molnár, B.; Pisoni, G.; Tarcsi, A. Data lakes for insurance industry: Exploring challenges and opportunities for customer behaviour analytics, risk assessment, and industry adoption. In Proceedings of the 17th International Conference on e-Business, Paris, France. 8–10 July 2020; Volume 3, pp. 127–134. [Google Scholar]
- Cortet, M.; Rijks, T.; Nijland, S. PSD2: The digital transformation accelerator for banks. J. Payments Strategy Syst. 2016, 10, 13–27. [Google Scholar]
- Mărăcine, V.; Voican, O.; Scarlat, E. The digital transformation and disruption in business models of the banks under the impact of FinTech and BigTech. Proc. Int. Conf. Bus. Excell. 2020, 14, 294–305. [Google Scholar] [CrossRef]
- Rashwan, A.R.M.S.; Kassem, Z.A.E.A. The role of digital transformation in increasing the efficiency of banks’ performance to enhance competitive advantage. In The Big Data-Driven Digital Economy: Artificial and Computational Intelligence; Springer: Berlin/Heidelberg, Germany, 2021; pp. 325–335. [Google Scholar]
- Pisoni, G.; Molnár, B.; Tarcsi, A. Comparison of two technologies for digital payments: Challenges and future directions. Rev21 2021, 1–11. [Google Scholar] [CrossRef]
- Lee, P. The fintech entrepreneurs aiming to reinvent finance. Euromoney 2015, 46, 42–48. [Google Scholar]
- Fischer, M. Fintech Business Models; Gruyter, Walter de GmbH: Berlin, Germany, 2021. [Google Scholar] [CrossRef]
- Zhuo, J.; Li, X.; Yu, C. How to integrate financial big data and fintech in a real application in banks: A case of the modeling of asset allocation for products based on data. Information 2020, 11, 460. [Google Scholar] [CrossRef]
- Hung, J.L.; He, W.; Shen, J. Big data analytics for supply chain relationship in banking. Ind. Mark. Manag. 2020, 86, 144–153. [Google Scholar] [CrossRef]
- Iqbal, M.; Kazmi, S.H.A.; Manzoor, A.; Soomrani, A.R.; Butt, S.H.; Shaikh, K.A. A study of big data for business growth in SMEs: Opportunities & challenges. In Proceedings of the IEEE 2018 International Conference on Computing, Mathematics and Engineering Technologies (iCoMET), Sukkur, Pakistan, 3–4 March 2018; pp. 1–7. [Google Scholar]
- Marrara, S.; Pejic-Bach, M.; Seljan, S.; Topalovic, A. FinTech and SMEs: The Italian case. In FinTech as a Disruptive Technology for Financial Institutions; IGI Global: Hershey, PA, USA, 2019; pp. 14–41. [Google Scholar]
- Haddad, C.; Hornuf, L. The emergence of the global fintech market: Economic and technological determinants. Small Bus. Econ. 2019, 53, 81–105. [Google Scholar] [CrossRef] [Green Version]
- Naimi-Sadigh, A.; Asgari, T.; Rabiei, M. Digital transformation in the value chain disruption of banking services. J. Knowl. Econ. 2021, 1–31. [Google Scholar] [CrossRef]
- Zhang, D.; Zhou, L. Discovering golden nuggets: Data mining in financial application. IEEE Trans. Syst. Man Cybern. Part C Appl. Rev. 2004, 34, 513–522. [Google Scholar] [CrossRef]
- Gordon, S.; Linoff, M.J.B. Data Mining Techniques; John Wiley & Sons: Hoboken, NJ, USA, 2011. [Google Scholar]
- Akerkar, R. Artificial Intelligence for Business; Springer International Publishing: Berlin/Heidelberg, Germany, 2019. [Google Scholar] [CrossRef]
- Giudici, P. Financial data science. Stat. Probab. Lett. 2018, 136, 160–164. [Google Scholar] [CrossRef]
- Mention, A.L. The future of fintech. Res. Technol. Manag. 2019, 62, 59–63. [Google Scholar] [CrossRef]
- Cao, L.; Yang, Q.; Yu, P.S. Data science and AI in FinTech: An overview. Int. J. Data Sci. Anal. 2021, 12, 81–99. [Google Scholar] [CrossRef]
- Rodriguez, C.; Engel, R.; Kostoska, G.; Daniel, F.; Casati, F.; Aimar, M. Eventifier: Extracting process execution logs from operational databases. Proc. Demonstr. Track BPM 2012, 940, 17–22. [Google Scholar]
- Bengio, Y.; Lecun, Y.; Hinton, G. Deep learning for AI. Commun. ACM 2021, 64, 58–65. [Google Scholar] [CrossRef]
- Witt, M.; Carlson, J.; Brandt, D.S.; Cragin, M.H. Constructing data curation profiles. Int. J. Digit. Curation 2009, 4, 93–103. [Google Scholar] [CrossRef]
- Meier, A.; Kaufmann, M. SQL & NoSQL Databases; Springer: Berlin/Heidelberg, Germany, 2019. [Google Scholar] [CrossRef]
- Deka, G.C. (Ed.) NoSQL; Taylor & Francis Ltd.: Abingdon, UK, 2017. [Google Scholar]
- Beheshti, A.; Benatallah, B.; Nouri, R.; Chhieng, V.M.; Xiong, H.; Zhao, X. Coredb: A data lake service. In Proceedings of the 2017 ACM on Conference on Information and Knowledge Management, Singapore, 6–10 November 2017; pp. 2451–2454. [Google Scholar]
- Beheshti, A.; Benatallah, B.; Nouri, R.; Tabebordbar, A. CoreKG: A knowledge lake service. Proc. VLDB Endow. 2018, 11, 1942–1945. [Google Scholar] [CrossRef]
- Walsham, G. Interpretive case studies in IS research: Nature and method. Eur. J. Inf. Syst. 1995, 4, 74–81. [Google Scholar] [CrossRef]
- Rivkin, J.W.; Siggelkow, N. Patterned interactions in complex systems: Implications for exploration. Manag. Sci. 2007, 53, 1068–1085. [Google Scholar] [CrossRef] [Green Version]
- Marwala, T. Economic Modeling Using Artificial Intelligence Methods; Springer: London, UK, 2013. [Google Scholar] [CrossRef]
- Chow, J.W.Y. Activity based costing: A case study of Raiffeisen Bank of Luxembourg. In Technical Report, EIKV-Schriftenreihe zum Wissens-und Wertemanagement; EconStor: Luxemburg, 2016. [Google Scholar]
- Jacobs, M.; Karagozoglu, A.K.; Sensenbrenner, F. Stress testing and model validation: Application of the Bayesian approach to a credit risk portfolio. J. Risk Model Valid. 2015, 9, 41–70. [Google Scholar] [CrossRef]
- Chanvarasuth, P.; Boongasame, L.; Boonjing, V. An ELECTRE III based CBR approach to combinatorial portfolio selection. Asia Pac. J. Financ. Stud. 2019, 48, 386–409. [Google Scholar] [CrossRef]
- Wu, D.D.; Olson, D.L. Computational simulation and risk analysis: An introduction of state of the art research. Math. Comput. Model. 2013, 58, 1581–1587. [Google Scholar] [CrossRef]
- Wang, H. Monte Carlo Simulation with Applications to Finance; CRC Press: Boca Raton, FL, USA, 2012. [Google Scholar]
- Mittal, L.; Gupta, T.; Sangaiah, A.K. Prediction of credit risk evaluation using naive bayes, artificial neural network and support vector machine. IIOAB J. 2016, 7, 33–42. [Google Scholar]
- Bach, M.P.; Krstić, Ž.; Seljan, S. Big data text mining in the financial sector. In Expert Systems in Finance: Smart Financial Applications in Big Data Environments; Routledge: London, UK, 2019; pp. 80–97. [Google Scholar]
- Wang, Y.; Ni, X.S.; Stone, B. An automatic interaction detection hybrid model for bankcard response classification. In Proceedings of the IEEE 2018 5th International Conference on Systems and Informatics (ICSAI), Nanjing, China, 10–12 November 2018; pp. 1111–1119. [Google Scholar]
- Vercellis, C. Business Intelligence: Data Mining and Optimization for Decision Making; Wiley Online Library: Hoboken, NJ, USA, 2009. [Google Scholar]
- Cleff, T. Exploratory Data Analysis in Business and Economics; Springer: Berlin/Heidelberg, Germany, 2014. [Google Scholar]
- Tukey, J.W. Exploratory Data Analysis; Addison-Wesley: Reading, MA, USA, 1977; Volume 2. [Google Scholar]
- Cretu, L.G. Designing Enterprise Architecture Frameworks: Integrating Business Processes with IT Infrastructure; Taylor & Francis Ltd.: Abingdon, UK, 2016. [Google Scholar]
- Simon, D.; Schmidt, C. Business Architecture Management; Springer International Publishing: Berlin/Heidelberg, Germany, 2015. [Google Scholar] [CrossRef]
- Cardoso, J.; Fromm, H.; Nickel, S.; Satzger, G.; Studer, R.; Weinhardt, C. Fundamentals of Service Systems; Springer International Publishing: Berlin/Heidelberg, Germany, 2015. [Google Scholar] [CrossRef]
- Henderson, R.M.; Clark, K.B. Architectural innovation: The reconfiguration of existing product technologies and the failure of established firms. Adm. Sci. Q. 1990, 35, 9–30. [Google Scholar] [CrossRef] [Green Version]
- Christensen, C.M. The Innovator’s Dilemma: When New Technologies Cause Great Firms to Fail; Harvard Business Review Press: Boston, MA, USA, 2013. [Google Scholar]
- Zachman, J.A. A framework for information systems architecture. IBM Syst. J. 1987, 26, 276–292. [Google Scholar] [CrossRef]
- Josey, A. TOGAF® Version 9.1-A Pocket Guide; Van Haren: VW ’s-Hertogenbosch, The Netherlands, 2016. [Google Scholar]
- Osterwalder, A.; Pigneur, Y. Business Model Generation: A Handbook for Visionaries, Game Changers, and Challengers; John Wiley & Sons: Hoboken, NJ, USA, 2010; Volume 1. [Google Scholar]
- Maglio, P.P.; Kieliszewski, C.A.; Spohrer, J.C. Handbook of Service Science; Springer: Boston, MA, USA, 2010. [Google Scholar] [CrossRef]
- Afuah, A. Business Model Innovation: Concepts, Analysis, and Cases; Routledge: New York, NY, USA, 2014. [Google Scholar]
- Molnár, B.; Mattyasovszky-Philipp, D. An architectural approach to Cognitive Information System. In Proceedings of the 2019 10th IEEE International Conference on Cognitive Infocommunications (CogInfoCom), Naples, Italy, 23–25 October 2019; pp. 459–462. [Google Scholar]
- White, S.A.; Miers, D. BPMN Modeling and Reference Guide: Understanding and Using BPMN; Future Strategies Inc.: Lighthouse Point, FL, USA, 2008. [Google Scholar]
- Larman, C. Applying UML and Patterns: An Introduction to Object Oriented Analysis and Design and Iterative Development; Prentice Hall PTR: Hoboken, NJ, USA, 2004. [Google Scholar]
- Skidmore, S.; Farmer, R.; Mills, G. SSADM Models and Methods, Version 4; Blackwell Pub: Hoboken, NJ, USA, 1992. [Google Scholar]
- Duncan, J. SSADM in Practice: A Version 4 Text; Macmillan International Higher Education: London, UK, 1995. [Google Scholar]
- Suryn, W.; Abran, A.; April, A. ISO/IEC SQuaRE: The Second Generation of Standards for Software Product Quality; Semantic Scholar: Marina del Rey, CA, USA, 2003. [Google Scholar]
- Ori, D.; Molnár, B. A hypergraph based formal description technique for enterprise architecture representation. In Proceedings of the 2018 7th International Congress on Advanced Applied Informatics (IIAI-AAI), Yonago, Japan, 8–13 July 2018; pp. 799–804. [Google Scholar]
- Molnár, B.; Ori, D. Towards a hypergraph-based formalism for enterprise architecture representation to lead digital transformation. In European Conference on Advances in Databases and Information Systems; Springer: Berlin/Heidelberg, Germany, 2018; pp. 364–376. [Google Scholar]
- Inmon, W. Data Lake Architecture: Designing the Data Lake and Avoiding the Garbage Dump; Technics Publications: Bradley Beach, NJ, USA, 2016. [Google Scholar]
- Tomcy John, P.M. Data Lake for Enterprises; Packt Publishing: Birmingham, UK, 2017. [Google Scholar]
- Kimball, R. The Kimball Group Reader: Relentlessly Practical Tools for Data Warehousing and Business Intelligence; Wiley: Indianapolis, IN, USA, 2010. [Google Scholar]
- Tsihrintzis, G.A.; Sotiropoulos, D.N.; Jain, L.C. Machine Learning Paradigms; Springer International Publishing: Berlin/Heidelberg, Germany, 2019. [Google Scholar] [CrossRef]
- Boudreault, M.; Renaud, J.F. Actuarial Finance: Derivatives, Quantitative Models and Risk Management; John Wiley & Sons: Hoboken, NJ, USA, 2019. [Google Scholar]
- Resta, M. Computational Methods for Risk Management in Economics and Finance; MDPI: Basel, Switzerland, 2020. [Google Scholar]
- Riley, J. Understanding Metadata; National Information Standards Organization (NISO): Baltimore, MD, USA, 2017; p. 23. [Google Scholar]
- Greenberg, J. Understanding Metadata and Metadata Schemes. Cat. Classif. Q. 2005, 40, 17–36. [Google Scholar] [CrossRef]
- Baca, M. Introduction to Metadata; Getty Publications: Los Angeles, CA, USA, 2016. [Google Scholar]
- Ma, C.; Molnár, B. Use of Ontology Learning in Information System Integration: A Literature Survey. In Proceedings of the Asian Conference on Intelligent Information and Database Systems, Phuket, Thailand, 23–26 March 2020; Springer: Berlin/Heidelberg, Germany, 2020; pp. 342–353. [Google Scholar]
- Baader, F.; Calvanese, D.; McGuinness, D.; Patel-Schneider, P.; Nardi, D. The Description Logic Handbook: Theory, Implementation and Applications; Cambridge University Press: Cambridge, UK, 2003. [Google Scholar]
- Arslanian, H.; Fischer, F. The Future of Finance: The Impact of FinTech, AI, and Crypto on Financial Services; Springer: Berlin/Heidelberg, Germany, 2019. [Google Scholar]
- Snoeck, M. Enterprise Information Systems Engineering, The MERODE Approach; Springer International Publishing: Berlin/Heidelberg, Germany, 2014. [Google Scholar] [CrossRef]
- Cooper, R.G.; De Brentani, U. New industrial financial services: What distinguishes the winners. J. Prod. Innov. Manag. 1991, 8, 75–90. [Google Scholar] [CrossRef]
- Lievens, A.; Moenaert, R.K.; Jegers, R.S. Linking communication to innovation success in the financial services industry: A case study analysis. Int. J. Serv. Ind. Manag. 1999, 10, 23–48. [Google Scholar] [CrossRef]
- De Brentani, U.; Cooper, R.G. Developing successful new financial services for businesses. Ind. Mark. Manag. 1992, 21, 231–241. [Google Scholar] [CrossRef]
Publisher’s Note: MDPI stays neutral with regard to jurisdictional claims in published maps and institutional affiliations. |
© 2021 by the authors. Licensee MDPI, Basel, Switzerland. This article is an open access article distributed under the terms and conditions of the Creative Commons Attribution (CC BY) license (https://creativecommons.org/licenses/by/4.0/).