
A Comparative Analysis of Oak Wood Defect Detection Using Two Deep Learning (DL)-Based Software

 ,
,  and
and 
Abstract
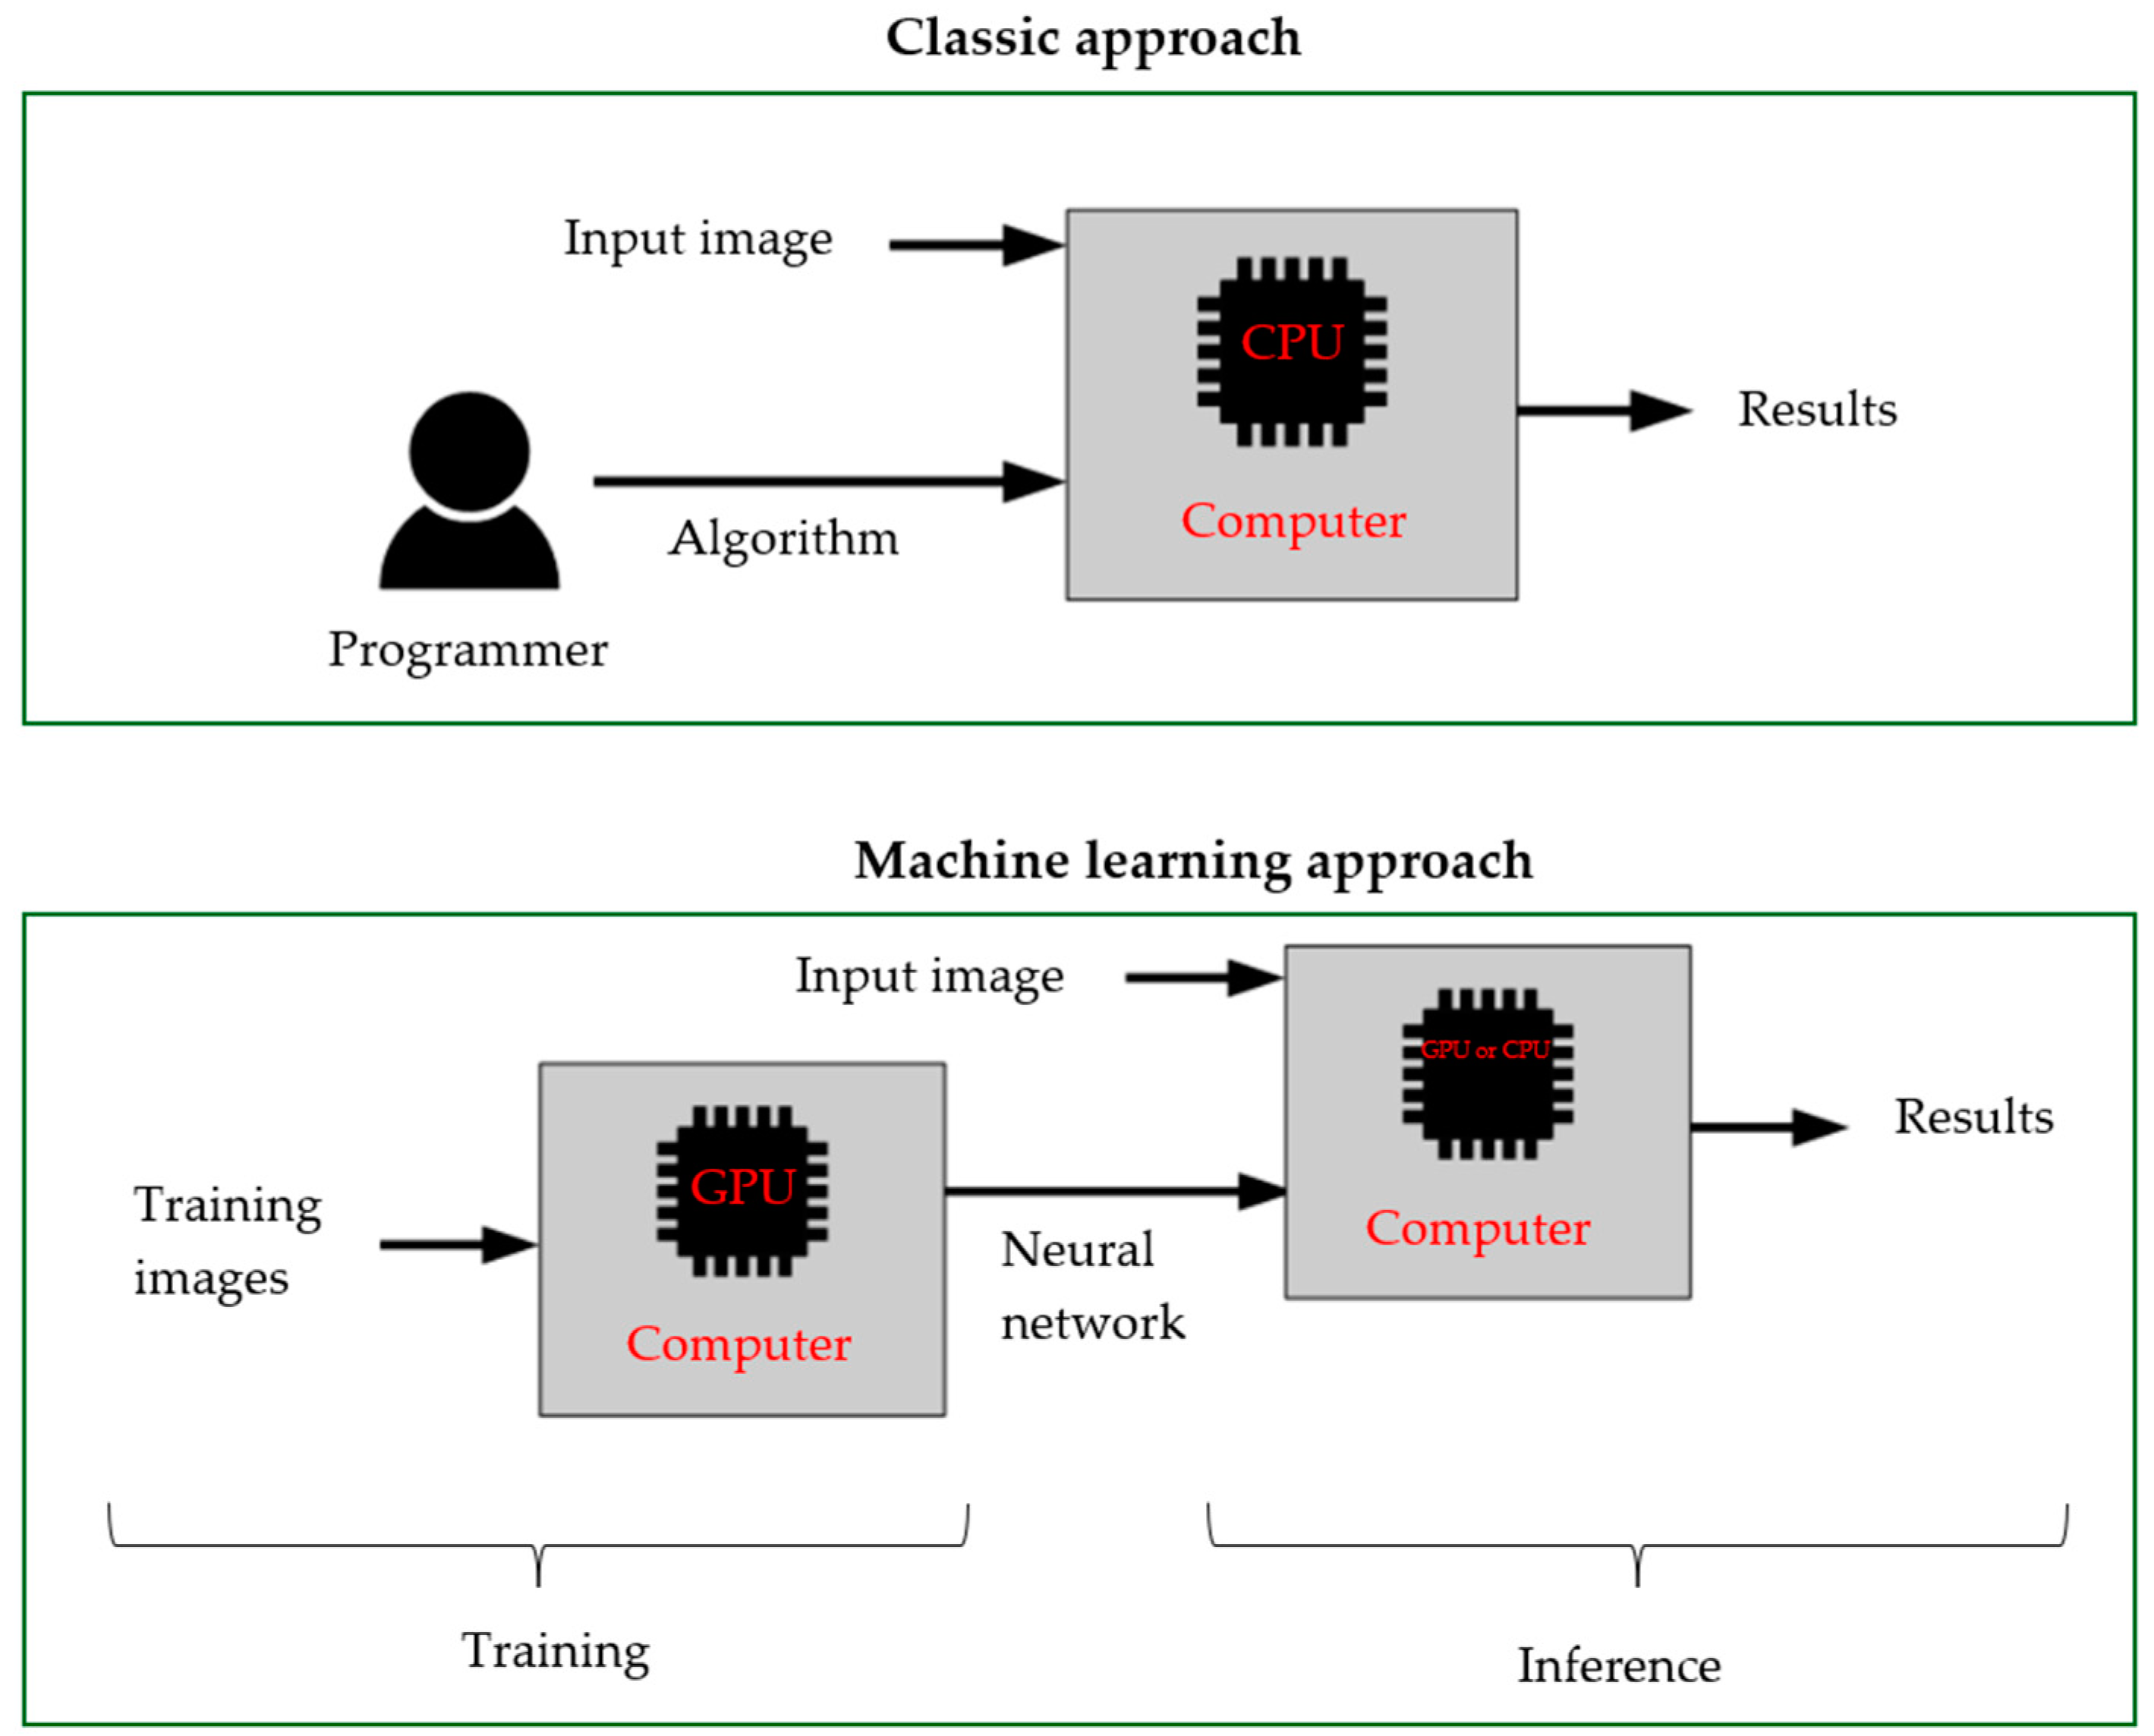
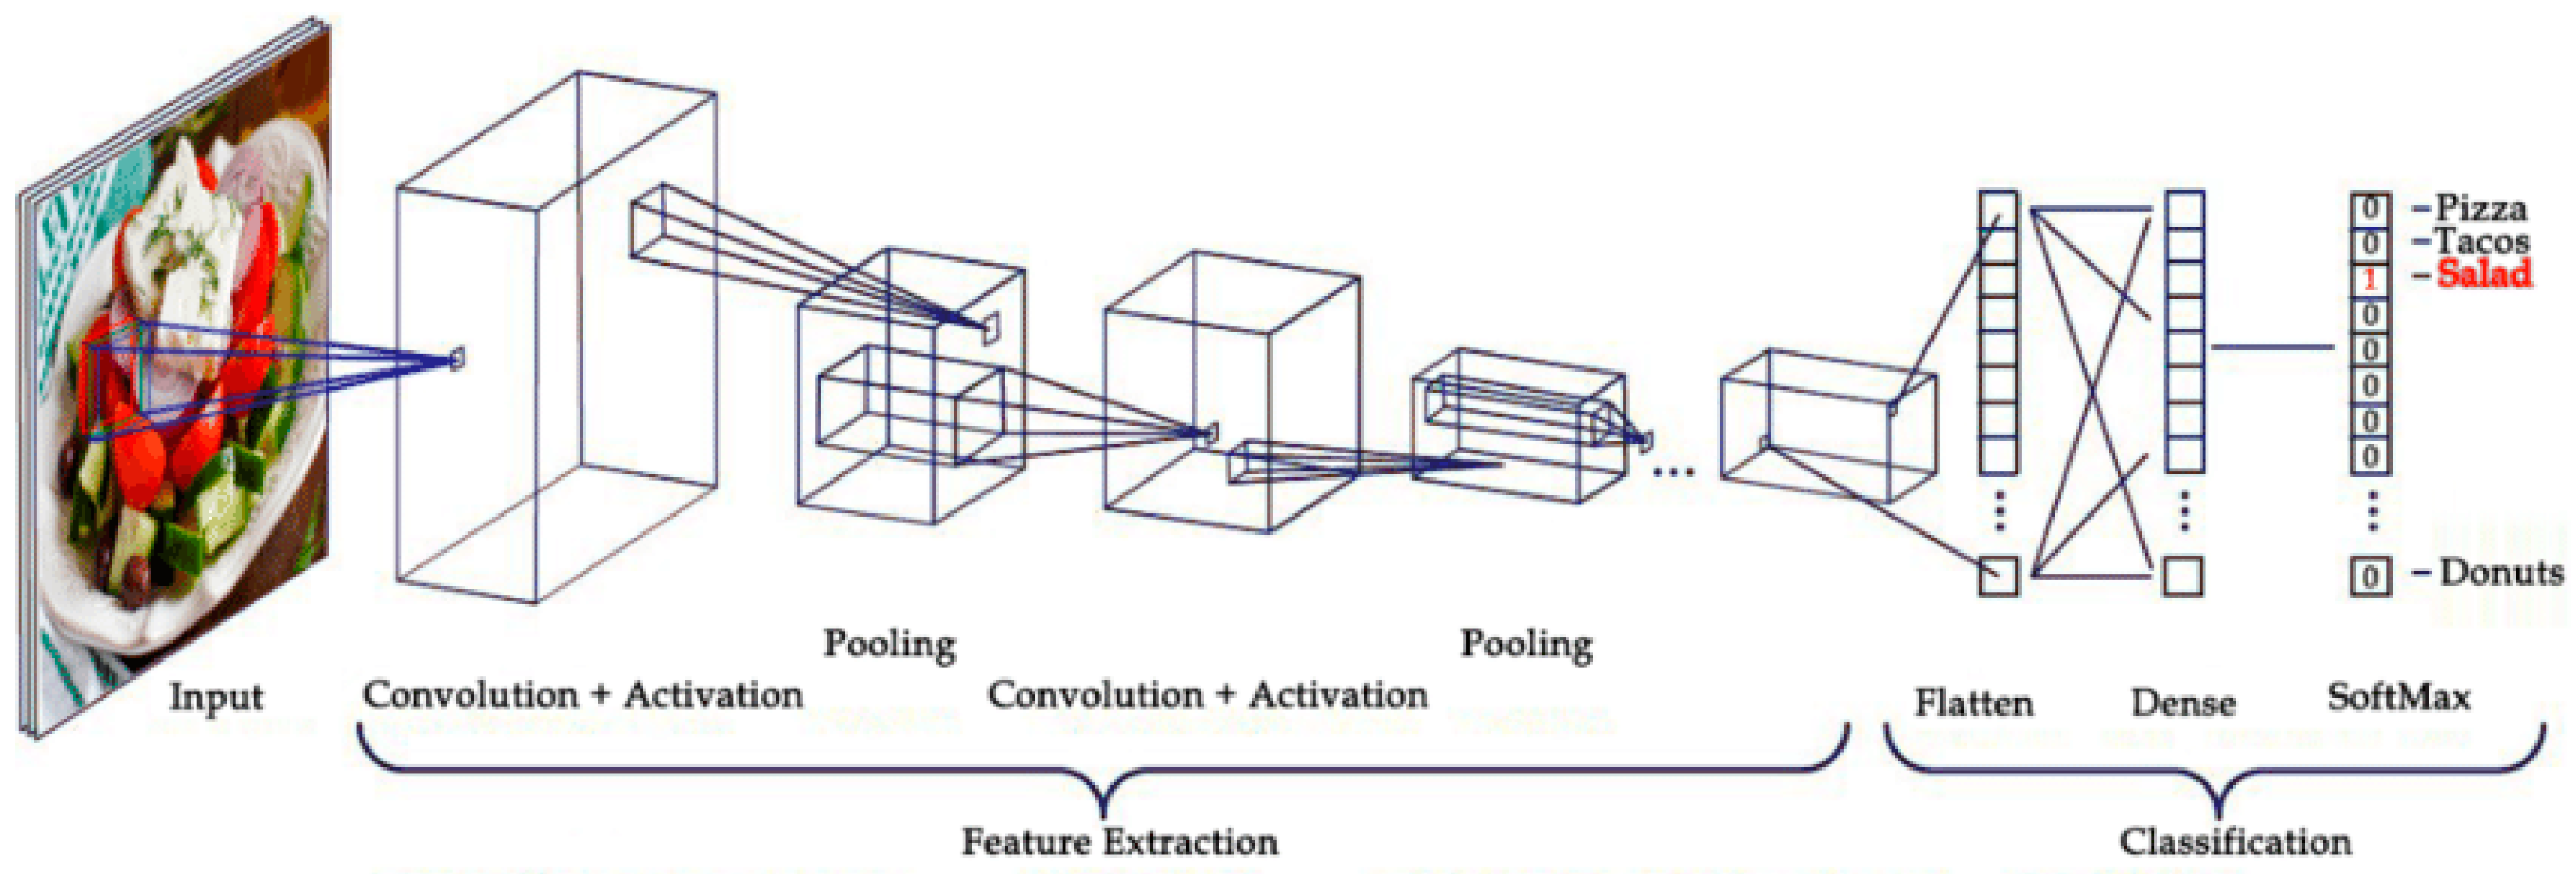
1. Introduction
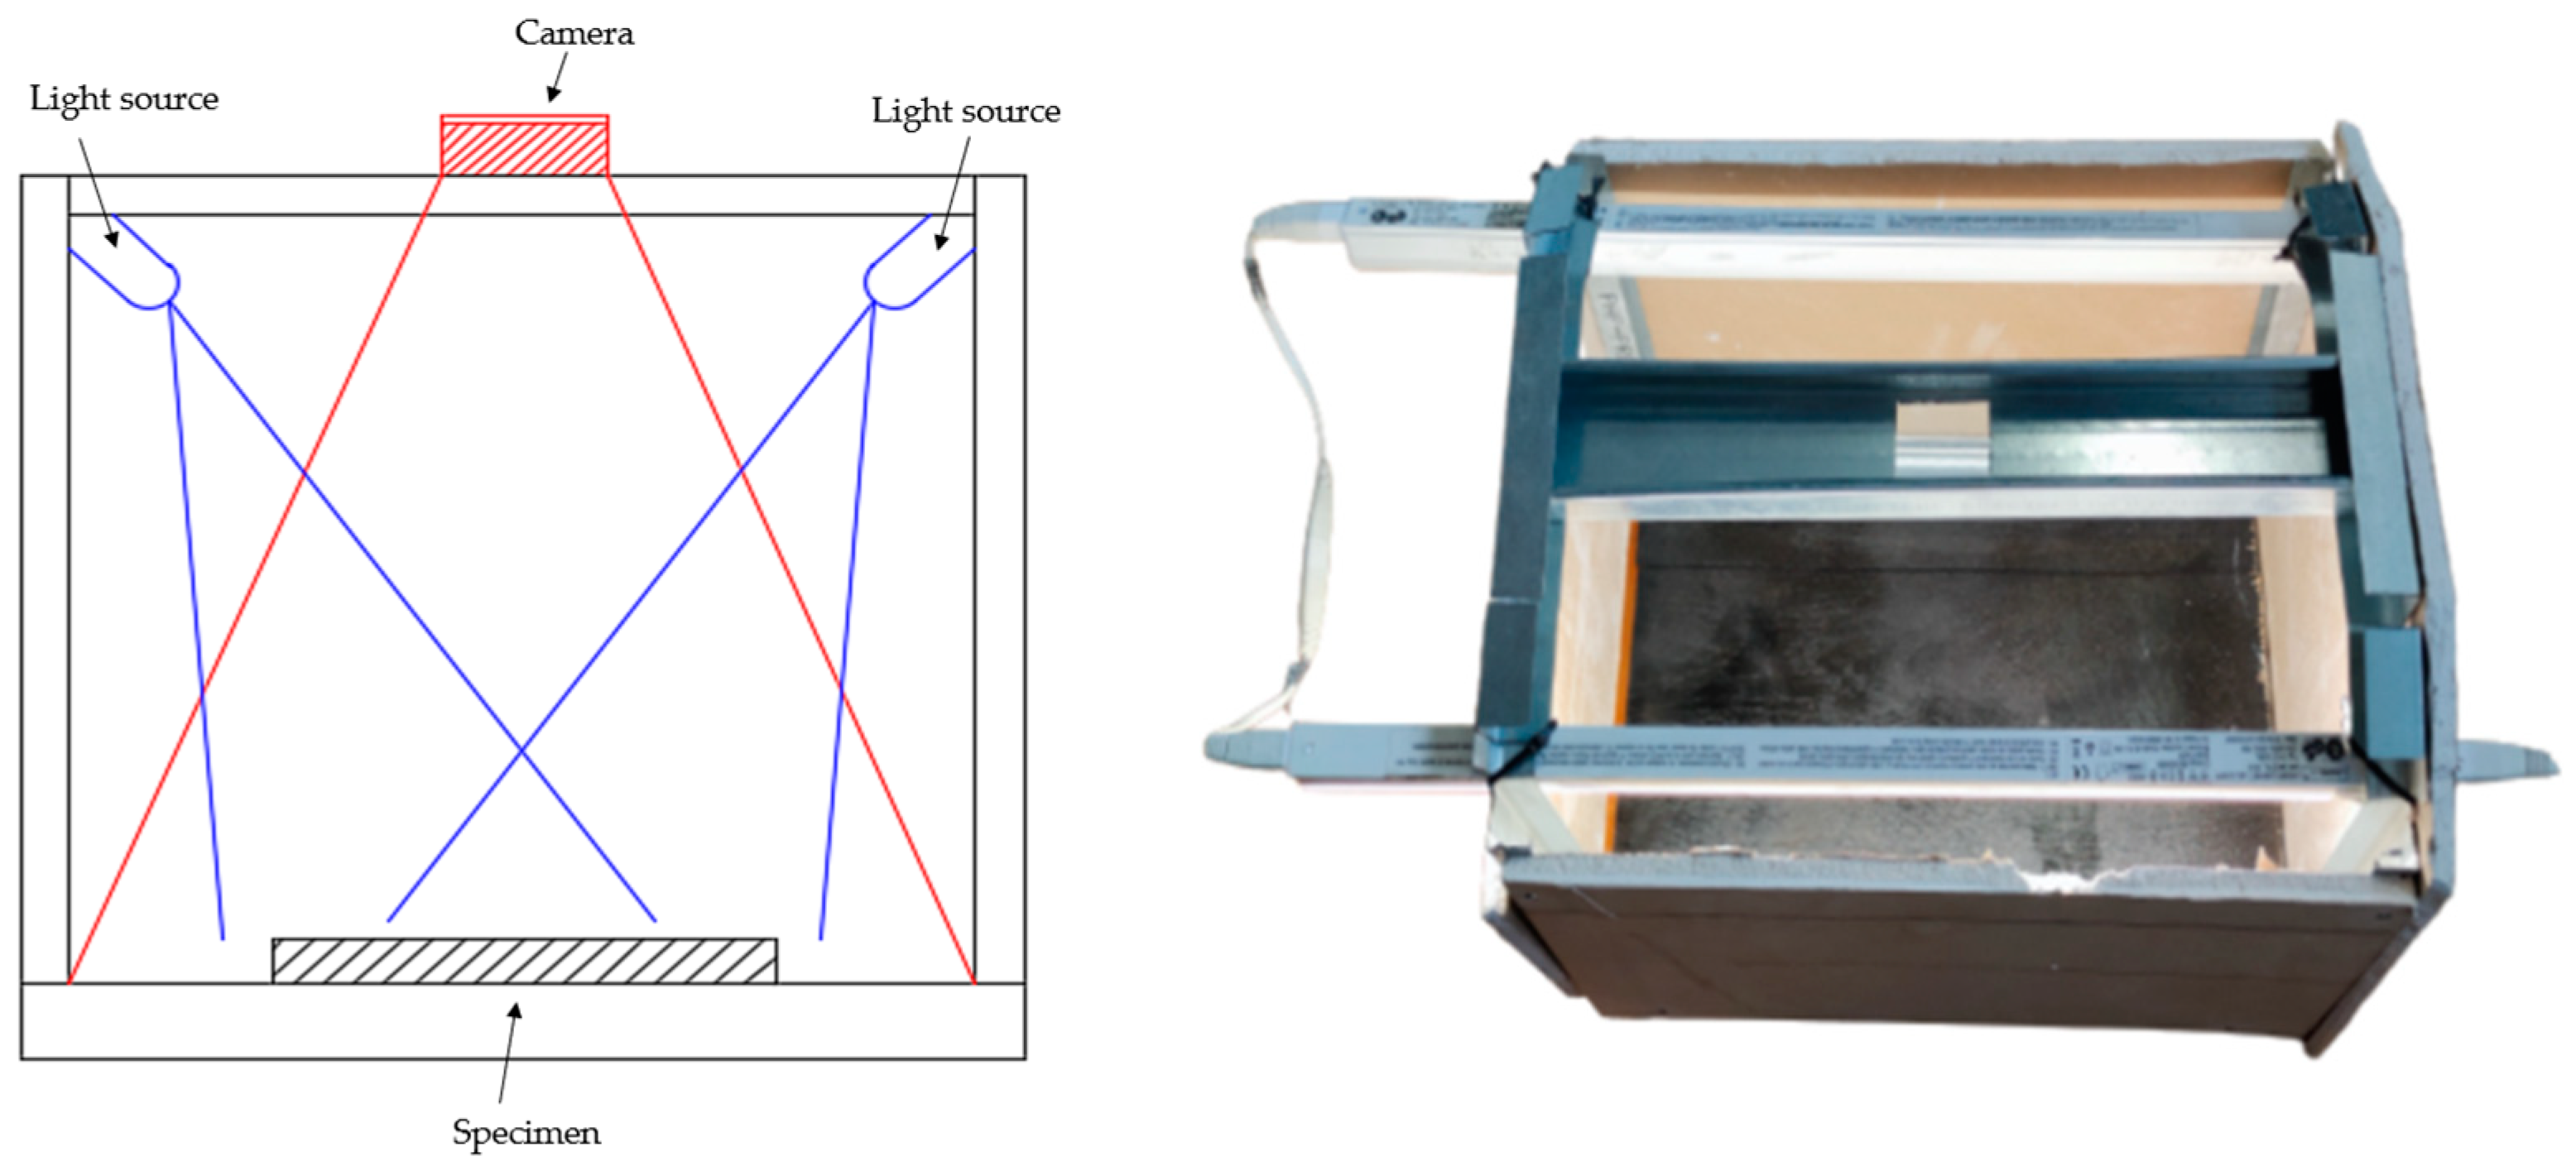
2. Materials and Methods
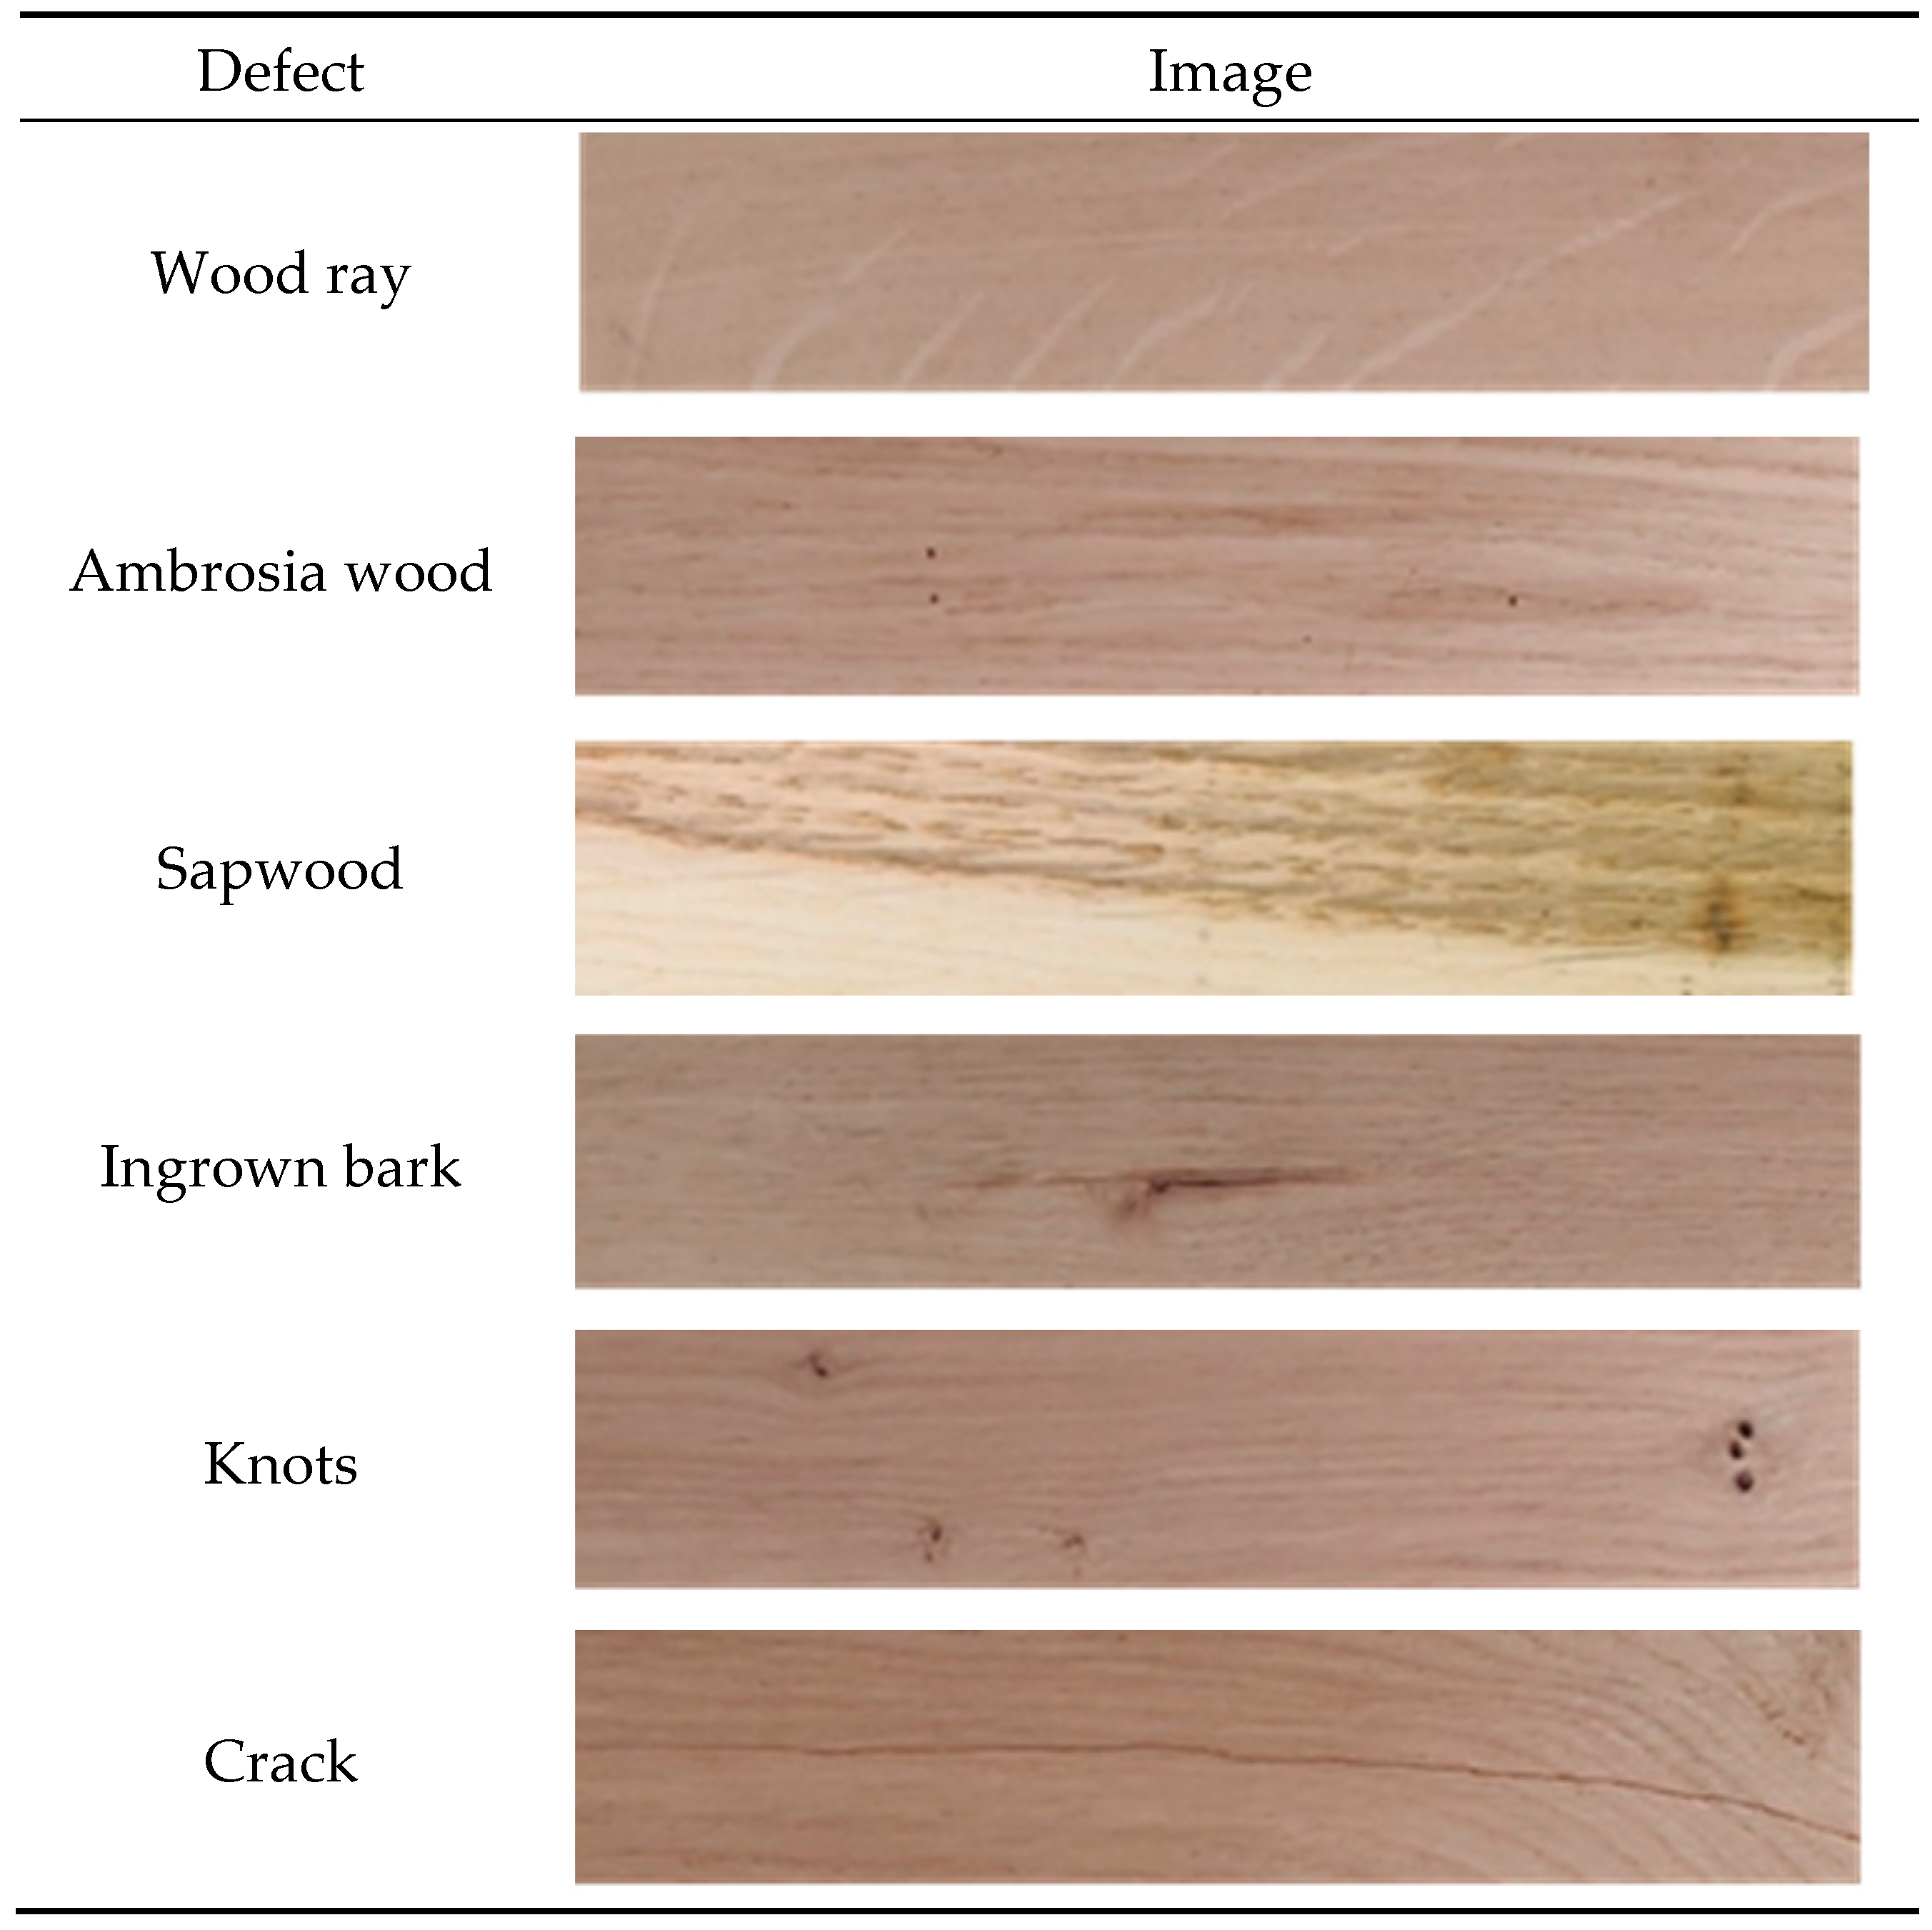
2.1. Material and Observed Defects
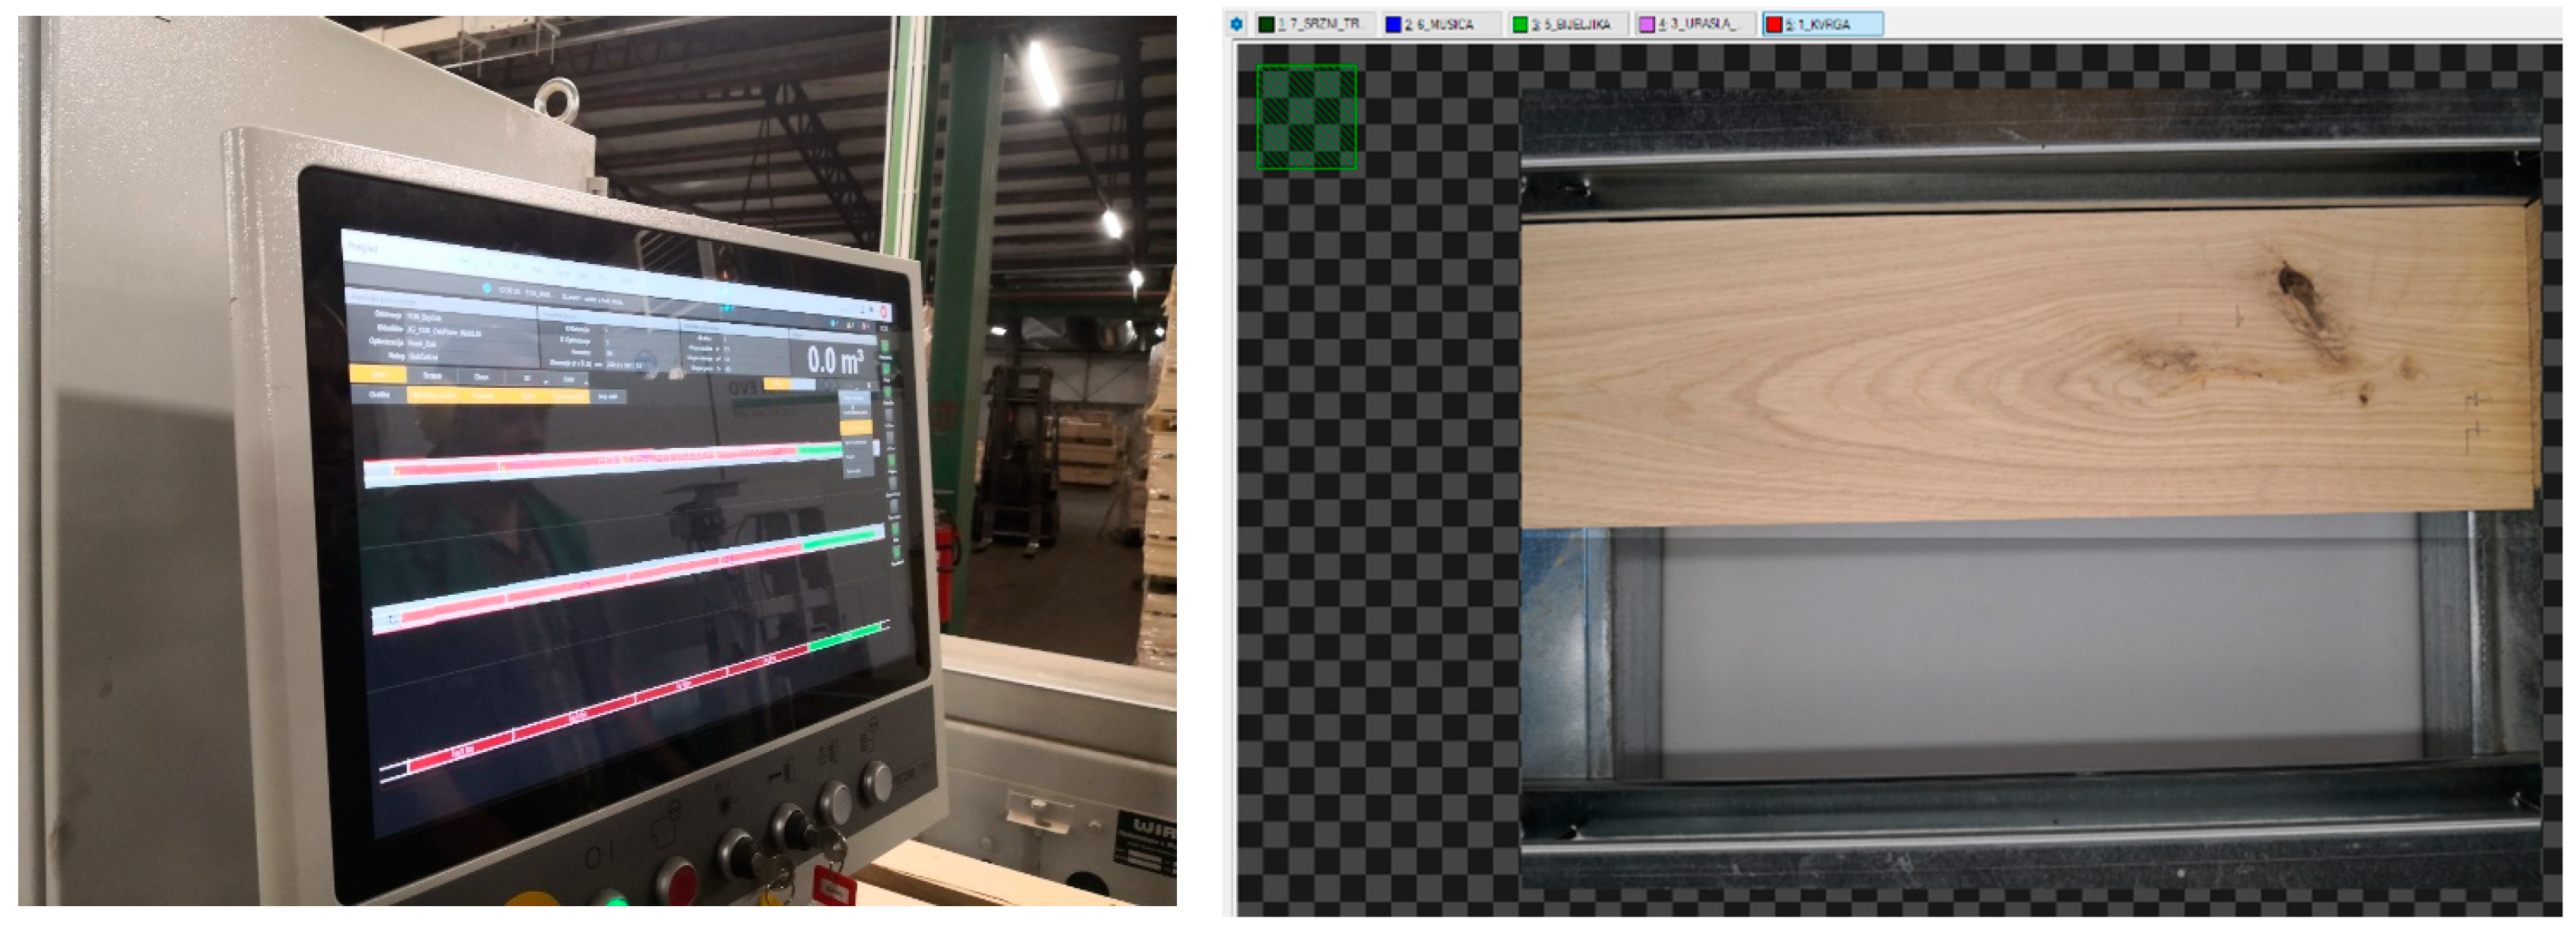
2.2. Software 1
2.3. Software 2
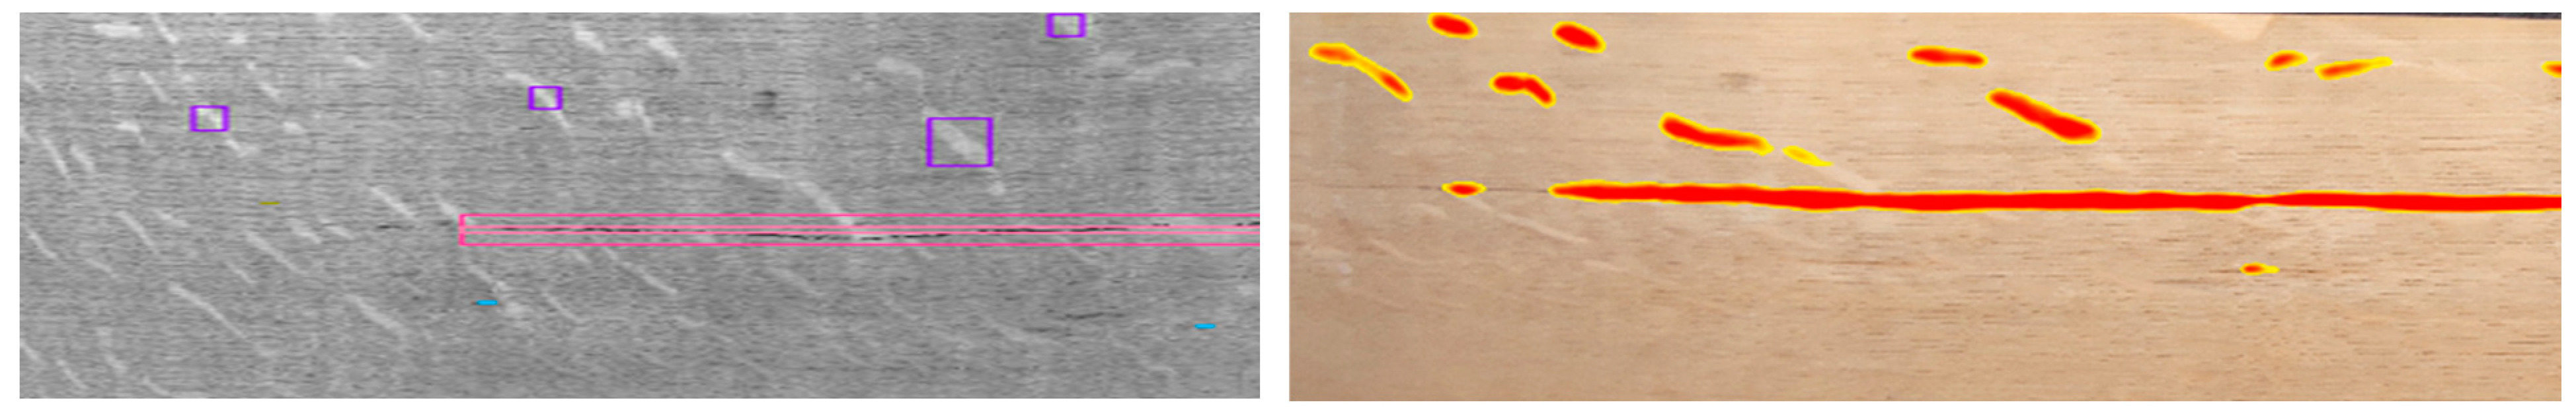
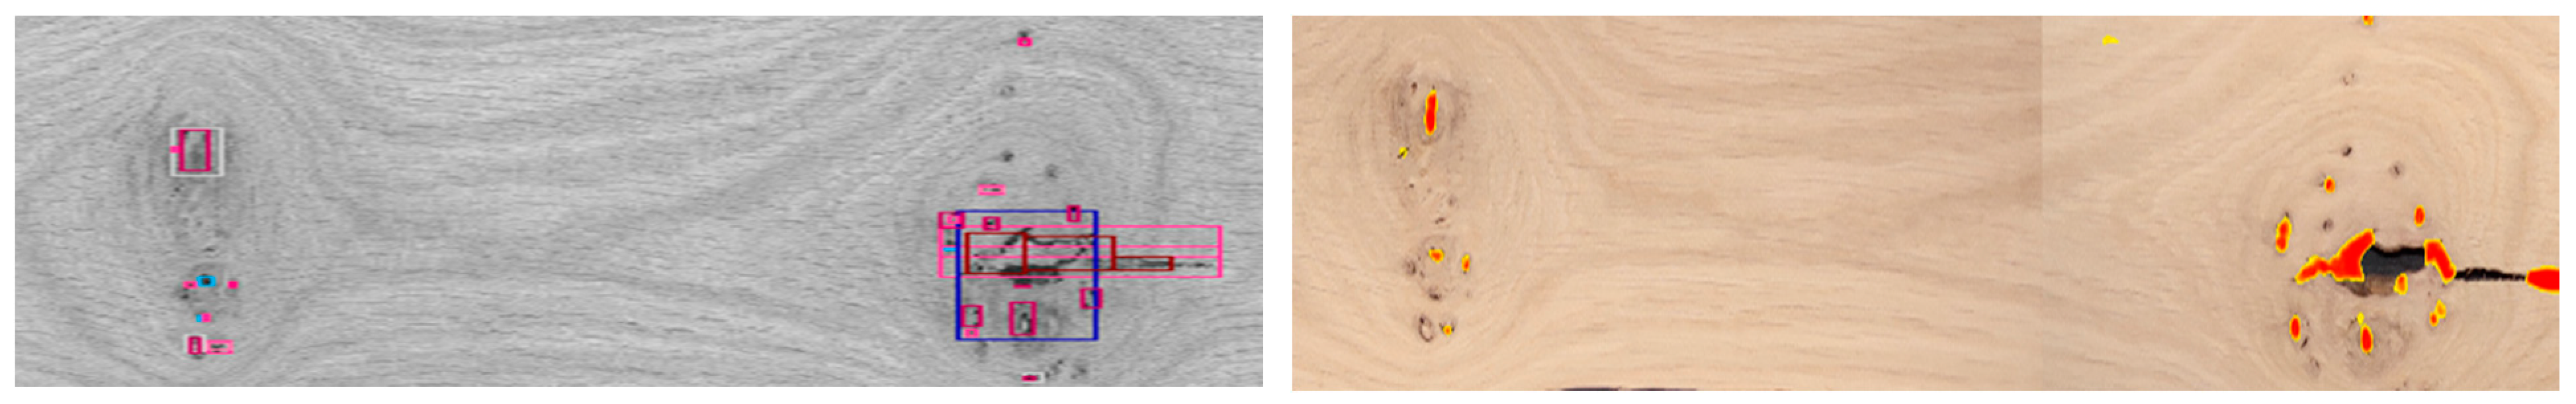
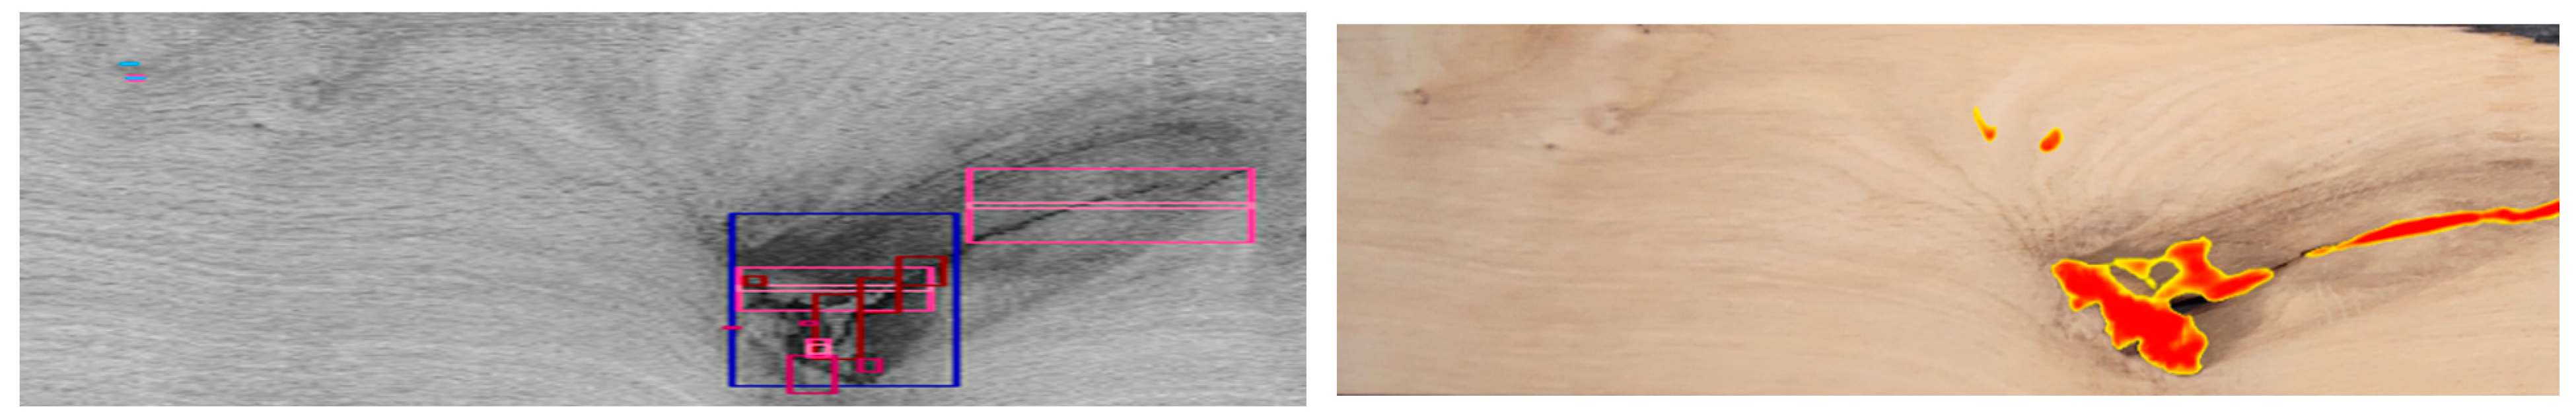
3. Results and Discussion
4. Conclusions
Author Contributions
Funding
Data Availability Statement
Conflicts of Interest
References
- Funck, J.W.; Zhong, Y.; Butler, D.A.; Brunner, C.; Forrer, J. Image segmentation algorithms applied to wood defect detection. Comput. Electron. Agric. 2003, 41, 157–179. [Google Scholar] [CrossRef]
- Ke, Z.N.; Zhao, Q.J.; Huang, C.H.; Ai, P.; Yi, J.G. Detection of wood surface defects based on particle swarm-genetic hybrid algorithm. In Proceedings of the 2016 International Conference on Audio, Language and Image Processing-Proceedings, Shanghai, China, 11–12 July 2016. [Google Scholar]
- Hashim, U.R.; Hashim, S.Z.; Muda, A.K. Automated vision inspection of timber surface defect: A review. J. Teknol. 2015, 77, 127–135. [Google Scholar] [CrossRef]
- Cavalin, P.; Oliveira, L.S.; Koerich, A.L.; Britto, A.S. Wood defect detection using grayscale images and an optimized feature set. In Proceedings of the IECON 2006-32nd Annual Conference on IEEE Industrial Electronics, Paris, France, 6–10 November 2006; pp. 3408–3412. [Google Scholar]
- Zhang, Y.; Xu, C.; Li, C.; Yu, H.; Cao, J. Wood defect detection method with PCA feature fusion and compressed sensing. J. For. Res. 2015, 26, 745–751. [Google Scholar] [CrossRef]
- Norlander, R.; Grahn, J.; Maki, A. Wooden Knot Detection Using ConvNet Transfer Learning. In Lecture Notes in Computer Science, Image Analysis; Paulsen, R., Pedersen, K., Eds.; SCIA: Cham, Switzerland, 2015; Volume 9127. [Google Scholar] [CrossRef]
- Pölzleitner, W.; Schwingshakl, G. Real-time surface grading of profiled wooden boards. Ind. Metrol. 1992, 2, 283–298. [Google Scholar] [CrossRef]
- Qiu, Z.F. A Simple Machine Vision System for Improving the Edging and Trimming Operations Performed in Hardwood Sawmills. Master’s Thesis, Virginia Polytechnic Institute and State University, Blacksburg, VA, USA, 1996. [Google Scholar]
- Schmoldt, D.L.; Li, P.; Abbott, A.L. Machine vision using artificial neural networks with local 3D neighborhoods. Comput. Electron. Agric. 1997, 16, 255–271. [Google Scholar] [CrossRef]
- Qi, D.W.; Zhang, P.; Jin, X.; Zhang, X. Study on wood image edge detection based on Hopfield neural network. In Proceedings of the 2010 IEEE International Conference on Information and Automation, Harbin, China, 20–23 June 2010; pp. 1942–1946. [Google Scholar]
- Ji, X.Y.; Guo, H.; Hu, M.H. Features Extraction and Classification of Wood Defect Based on Hu Invariant Moment and Wavelet Moment and BP Neural Network. In Proceedings of the 12th International Symposium on Visual Information Communication and Interaction (VINCI’2019), Shanghai, China, 20–22 September 2019; Association for Computing Machinery: New York, NY, USA, 2019. Article 37. pp. 1–5. [Google Scholar]
- Mu, H.; Qi, D.W. Pattern Recognition of Wood Defects Types Based on Hu Invariant Moments. In Proceedings of the 2009 2nd International Congress on Image and Signal Processing, Tianjin, China, 17–19 October 2009; pp. 1–5. [Google Scholar]
- Hermanson, J.C.; Wiedenhoeft, A.C. A brief review of machine vision in the context of automated wood identification systems. IAWA J. 2011, 32, 233–250. [Google Scholar] [CrossRef]
- Yang, Y.; Zhou, X.; Liu, Y.; Hu, Z.; Ding, F. Wood Defect Detection Based on Depth Extreme Learning Machine. Appl. Sci. 2020, 10, 7488. [Google Scholar] [CrossRef]
- Available online: https://docs.adaptive-vision.com/current/studio/machine_vision_guide/DeepLearning.html#object_location (accessed on 23 October 2023).
- Taye, M.M. Understanding of Machine Learning with Deep Learning: Architectures, Workflow, Applications and Future Directions. Computers 2023, 12, 91. [Google Scholar] [CrossRef]
- Hinton, G.E.; Osindero, S.; Teh, Y.-W. A fast learning algorithm for deep belief nets. Neural Comput. 2006, 18, 1527–1554. [Google Scholar] [CrossRef] [PubMed]
- Ahmad, J.; Farman, H.; Jan, Z. Deep learning methods and applications. In Deep Learning: Convergence to Big Data Analytics; SpringerBriefs in Computer Science; Springer: Singapore, 2019; pp. 31–42. [Google Scholar]
- Deep Learning Techniques: An Overview|SpringerLink. Available online: https://link.springer.com/chapter/10.1007/978-981-15-3383-9_54 (accessed on 11 March 2023).
- Srinivas, M.; Sucharitha, G.; Matta, A.; Chatterjee, P. Machine Learning Algorithms and Applications; Wiley: Hoboken, NJ, USA, 2021. [Google Scholar] [CrossRef]
- Janiesch, C.; Zschech, P.; Heinrich, K. Machine learning and deep learning. Electron. Mark. 2021, 31, 685–695. [Google Scholar] [CrossRef]
- Mosavi, A.; Ardabili, S.; Varkonyi-Koczy, A.R. List of Deep Learning Models. In Engineering for Sustainable Future; Várkonyi-Kóczy, A., Ed.; INTER-ACADEMIA 2019; Lecture Notes in Networks and Systems; Springer: Cham, Switzerland, 2020. [Google Scholar] [CrossRef]
- Zeiler, M.D.; Fergus, R. Visualizing and understanding convolutional networks. In Computer Vision—ECCV 2014. ECCV 2014. Lecture Notes in Computer Science; Fleet, D., Pajdla, T., Schiele, B., Tuytelaars, T., Eds.; Springer: Cham, Switzerland, 2014; Volume 8689. [Google Scholar] [CrossRef]
- Szegedy, C.; Liu, W.; Jia, Y.; Sermanet, P.; Reed, S.; Anguelov, D.; Erhan, D.; Vanhoucke, V.; Rabinovich, A. Going deeper with convolutions. In Proceedings of the IEEE Conference on Computer Vision and Pattern Recognition (CVPR), Boston, MA, USA, 7–12 June 2015. [Google Scholar]
- Simonyan, K.; Zisserman, A. Very deep convolutional networks for large-scale image recognition. arXiv 2014, arXiv:1409.1556. [Google Scholar]
- Krizhevsky, A.; Sutskever, I.; Hinton, G.E. Imagenet classification with deep convolutional neural networks. Adv. Neural Inf. Process Syst. 2012, 25. [Google Scholar] [CrossRef]
- He, K.; Zhang, X.; Ren, S.; Sun, J. Deep residual learning for image recognition. In Proceedings of the IEEE Conference on Computer Vision and Pattern Recognition (2016), Las Vegas, NV, USA, 27–30 June 2016. [Google Scholar]
- Yang, W.X.; Jin, L.W.; Tao, D.C.; Xie, Z.C.; Feng, Z.Y. DropSample: A new training method to enhance deep convolutional neural networks for large-scale unconstrained handwritten Chinese character recognition. Pattern Recogn. 2016, 58, 190–203. [Google Scholar] [CrossRef]
- He, T.; Liu, Y.; Xu, C.; Zhou, X.; Hu, Z.; Fan, J. A fully convolutional neural network for wood defect location and identification. IEEE Access 2019, 7, 123453–123462. [Google Scholar] [CrossRef]
- Park, J.K.; Kwon, B.K.; Park, J.H.; Kang, D.J. Machine learning-based imaging system for surface defect inspection. Int. J. Precis. Eng. Manuf. Green Technol. 2016, 3, 303–310. [Google Scholar] [CrossRef]
- Urbonas, A.; Raudonis, V.; Maskeliunas, R.; Damaševičius, R. Automated identification of wood veneer surface defects using faster region-based convolutional neural network with data augmentation and transfer learning. Appl. Sci. 2019, 9, 4898. [Google Scholar] [CrossRef]
- Jung, S.Y.; Tsai, Y.H.; Chiu, W.Y.; Hu, J.S.; Sun, C.T. Defect detection on randomly textured surfaces by convolutional neural networks. In Proceedings of the IEEE/ASME International Conference on Advanced Intelligent Mechatronics, Auckland, New Zealand, 9 July 2018; pp. 1456–1461. [Google Scholar]
- Kiourt, C.; Pavlidis, G.; Markantonatou, S. Deep learning approaches in food recognition. In Machine Learning Paradigms: Advances in Deep Learning-based Technological Applications; Springer: Cham, Switzerland, 2020. [Google Scholar]
- Bektas, I.; Tutus, A.; Gültekin, G. The Effect of Sapwood and Heartwood Differences on Mechanical Properties of Fast-Growing Tree Species. Drv. Ind. 2020, 71, 261–269. [Google Scholar] [CrossRef]
- Bozkurt, Y.; Erdin, N. Wood Technology; Publications of Faculty of Forestry; Istanbul University: Istanbul, Turkey, 1997; no. 445. [Google Scholar]
- Chang, Z.; Cao, J.; Zhang, Y. A novel image segmentation approach for wood plate surface defect classification through convex optimization. J. For. Res. 2018, 29, 1789–1795. [Google Scholar] [CrossRef]
- Pahlberg, T.; Thurley, M.; Popovic, D.; Hagman, O. Crack detection in oak flooring lamellae using ultrasound-excited thermography. Infrared Phys. Technol. 2018, 88, 57–69. [Google Scholar] [CrossRef]
- Li, S.; Li, D.; Yuan, W. Wood defect classification based on two-dimensional histogram constituted by LBP and local binary differential excitation pattern. IEEE Access 2019, 7, 145829–145842. [Google Scholar] [CrossRef]
- Chun, T.; Hashim, U.; Ahmad, S.; Salahuddin, L.; Ngo, H.C.; Kasturi, K. A review of the automated timber defect identification approach. IJECE 2023, 13, 2156. [Google Scholar] [CrossRef]
- Gu, I.Y.-H.; Andersson, H.; Vicen, R. Wood defect classification based on image analysis and support vector machines. Wood Sci. Technol. 2010, 44, 693–704. [Google Scholar] [CrossRef]
- Cao, J.; Liang, H.; Lin, X.; Tu, W. Potential of Near-infrared Spectroscopy to Detect Defects on the Surface of Solid Wood Boards. BioRes 2016, 12, 19–28. [Google Scholar] [CrossRef][Green Version]


| Wood Defects | Testing Specimens |
|---|---|
| Wood ray | 11 |
| Ambrosia wood | 5 |
| Sapwood | 5 |
| Ingrown bark | 7 |
| Knots | 27 |
| Crack | 20 |
| Sample | Software 1 | |||||
| Defects | ||||||
| Crack | Knot | Sapwood | Ingrown bark | Ambrosia wood | Wood ray | |
| 1 | + | + | ND − | |||
| 2 | ||||||
| 3 | + | + | ||||
| 4 | + | + | D − | |||
| 5 | + | D − | ||||
| 6 | ND − | + | ||||
| 7 | + | + | ||||
| 8 | + | ND − | + | ND − | ||
| 9 | + | + | ||||
| 10 | ND − | ND − | ||||
| 11 | ND − | |||||
| 12 | ND − | ND − | ||||
| 13 | + | |||||
| 14 | + | + | ||||
| 15 | ND − | ND − | ||||
| 16 | ND − | ND − | ||||
| 17 | ND − | ND − | ||||
| 18 | + | |||||
| 19 | + | ND − | ||||
| 20 | ND − | ND − | + | |||
| 21 | + | + | ||||
| 22 | D − | + | ||||
| 23 | + | + | ||||
| 24 | ND − | + | ND − | |||
| 25 | ND − | |||||
| 26 | + | + | ND − | |||
| 27 | + | + | ND − | |||
| 28 | ND − | |||||
| 29 | + | |||||
| 30 | ND − | ND − | ||||
| 31 | + | |||||
| 32 | + | ND − | ||||
| 33 | + | + | ||||
| 34 | + | + | ||||
| 35 | + | |||||
| 36 | + | |||||
| 37 | + | + | ||||
| 38 | + | + | ||||
| 39 | + | + | ND − | |||
| 40 | + | + | ||||
| Sample | Software 2 | |||||
| Defects | ||||||
| Crack | Knot | Sapwood | Ingrown bark | Ambrosia wood | Wood ray | |
| 1 | + | + | + | |||
| 2 | ||||||
| 3 | + | + | ||||
| 4 | ND − | + | ||||
| 5 | + | |||||
| 6 | D − | ND − | ND − | |||
| 7 | ND − | ND − | ||||
| 8 | + | + | ND − | + | ||
| 9 | ND − | ND − | ||||
| 10 | ND − | ND − | ||||
| 11 | + | |||||
| 12 | + | ND − | ||||
| 13 | + | |||||
| 14 | + | + | ||||
| 15 | + | + | ||||
| 16 | ND − | ND − | ||||
| 17 | ND − | + | ||||
| 18 | ND − | |||||
| 19 | + | + | ||||
| 20 | ND − | + | + | |||
| 21 | + | + | ||||
| 22 | + | |||||
| 23 | + | ND − | ||||
| 24 | ND − | + | + | |||
| 25 | + | |||||
| 26 | + | + | + | |||
| 27 | + | + | ND − | |||
| 28 | ND − | |||||
| 29 | ND − | |||||
| 30 | + | + | ||||
| 31 | + | |||||
| 32 | + | ND − | ||||
| 33 | + | + | ||||
| 34 | + | + | ||||
| 35 | + | |||||
| 36 | + | |||||
| 37 | + | + | ||||
| 38 | + | + | ||||
| 39 | + | + | ND − | |||
| 40 | ND − | + | ||||
| Percentage of Detection [%] | ||||||
|---|---|---|---|---|---|---|
| Crack | Knots | Sapwood | Ingrown Bark | Ambrosia Wood | Wood Ray | |
| Software 1 | 65.00 | 77.78 | 100.00 | 28.57 | 60.00 | 27.27 |
| Software 2 | 75.00 | 70.37 | 80.00 | 42.86 | 20.00 | 81.82 |
Disclaimer/Publisher’s Note: The statements, opinions and data contained in all publications are solely those of the individual author(s) and contributor(s) and not of MDPI and/or the editor(s). MDPI and/or the editor(s) disclaim responsibility for any injury to people or property resulting from any ideas, methods, instructions or products referred to in the content. |
© 2024 by the authors. Licensee MDPI, Basel, Switzerland. This article is an open access article distributed under the terms and conditions of the Creative Commons Attribution (CC BY) license (https://creativecommons.org/licenses/by/4.0/).
Share and Cite
Jambreković, B.; Veselčić, F.; Ištok, I.; Sinković, T.; Živković, V.; Sedlar, T. A Comparative Analysis of Oak Wood Defect Detection Using Two Deep Learning (DL)-Based Software. Appl. Syst. Innov. 2024, 7, 30. https://doi.org/10.3390/asi7020030
Jambreković B, Veselčić F, Ištok I, Sinković T, Živković V, Sedlar T. A Comparative Analysis of Oak Wood Defect Detection Using Two Deep Learning (DL)-Based Software. Applied System Innovation. 2024; 7(2):30. https://doi.org/10.3390/asi7020030
Chicago/Turabian StyleJambreković, Branimir, Filip Veselčić, Iva Ištok, Tomislav Sinković, Vjekoslav Živković, and Tomislav Sedlar. 2024. "A Comparative Analysis of Oak Wood Defect Detection Using Two Deep Learning (DL)-Based Software" Applied System Innovation 7, no. 2: 30. https://doi.org/10.3390/asi7020030
APA StyleJambreković, B., Veselčić, F., Ištok, I., Sinković, T., Živković, V., & Sedlar, T. (2024). A Comparative Analysis of Oak Wood Defect Detection Using Two Deep Learning (DL)-Based Software. Applied System Innovation, 7(2), 30. https://doi.org/10.3390/asi7020030