Article

A Comparative Analysis of Oak Wood Defect Detection Using Two Deep Learning (DL)-Based Software

by
Branimir Jambreković
1,
Filip Veselčić
2,
Iva Ištok
1,
Tomislav Sinković
1,
Vjekoslav Živković
1 and
Tomislav Sedlar
1,*
1
Faculty of Forestry and Wood Technology, University of Zagreb, 10000 Zagreb, Croatia
2
Bjelin Spačva d.o.o., 32100 Vinkovci, Croatia
*
Author to whom correspondence should be addressed.
Appl. Syst. Innov. 2024, 7(2), 30; https://doi.org/10.3390/asi7020030
Submission received: 30 November 2023 / Revised: 12 January 2024 / Accepted: 9 April 2024 / Published: 15 April 2024
(This article belongs to the Special Issue Advancements in Deep Learning and Its Applications)

Abstract

:
The world’s expanding population presents a challenge through its rising demand for wood products. This requirement contributes to increased production and, ultimately, the high-quality and efficient utilization of basic materials. Detecting defects in wood elements, which are inevitable when working with a natural material such as wood, is one of the difficulties associated with the issue above. Even in modern times, people still identify wood defects by visually scrutinizing the sawn surface and marking the defects. Industrial scanners equipped with software based on convolutional neural networks (CNNs) allow for the rapid detection of defects and have the potential to accelerate production and eradicate human subjectivity. This paper evaluates the suitability of defect recognition software in industrial scanners against software specifically designed for this task within a research project conducted using Adaptive Vision Studio, focusing on feature detection techniques. The research revealed that the software installed as part of the industrial scanner is more effective for analyzing knots (77.78% vs. 70.37%), sapwood (100% vs. 80%), and ambrosia wood (60% vs. 20%), while the software derived from the project is more effective for analyzing cracks (70% vs. 65%), ingrown bark (42.86% vs. 28.57%), and wood rays (81.82% vs. 27.27%).

1. Introduction

Wood is a highly enduring construction material that has been utilized for millennia, as indicated by archaeological evidence of dwellings constructed more than 10,000 years ago, meaning wood played a key role as the principal resource for building materials. It is commonly recognized as a naturally renewable, long-lasting, ecologically and economically justifiable material, enabling its versatile application across multiple fields [1]. Furthermore, it exhibits heterogeneity, anisotropy, porosity, fibrous composition, and hygroscopic properties. It is also distinguished by structural imperfections such as live and dead knots, cracks, and discoloration. One of the primary objectives in the production process involves identifying and removing defects that can impact the final product’s aesthetic, physical, and mechanical properties. During production, competent personnel essentially employ visual inspection techniques to remove natural defects [2,3], which are vulnerable to human error and tend to be highly subjective, potentially impacting the general wood utilization rate. As a result, improving the efficiency of utilizing wood is has now been recognized as an active field of research in the scientific community in recent years [4,5]. Enhancing the efficiency and accuracy of identifying wood defects on the wood surface has the potential to enhance wood utilization effectiveness and promote more rational wood consumption [6,7,8,9]. Integrated digital image processing techniques and artificial intelligence algorithms are widely used for detecting and classifying wood knot defects [10]. Fixed feature extractors and categorizing recognition technology have gained significant popularity and widespread utilization [11,12]. The technology consists mainly of computer vision technology, spectral analysis technology, and numerous digital image processing techniques [13]. Significant improvements have been made in detecting wood defects over the past few years by merging computer technology with detection and control principles [14].
Deep learning (DL) represents a significant advancement in machine learning within the realm of computer vision. Utilizing DL, AI-driven assistants can assimilate information from user-provided images, offering solutions for a variety of image analysis tasks. Its primary advantage lies in its ability to tackle previously challenging tasks that were problematic for rule-based algorithms. However, with the rise of deep learning, the emphasis has shifted towards data handling, ensuring the quality of image annotations, and experimenting with various training parameters. These aspects now dominate much of the time dedicated to application development. Deep learning typically involves two primary stages: training and inference. During the training phase, a model is constructed by examining features gleaned from training data. The inference stage entails deploying this model to new images to execute machine vision tasks. Figure 1 shows the classic and machine learning approaches, consisting of training and inference modes.
Deep learning (DL) techniques encompass anomaly detection, feature detection (segmentation), object classification, instance segmentation, point localization, and character recognition [15].
Over recent years, deep learning (DL) has surfaced as a prevalent computational approach in machine learning (ML), demonstrating remarkable outcomes in various intricate cognitive assignments, often comparable to or even surpassing human capabilities [16]. Derived from artificial neural networks (ANN), DL technology has garnered substantial attention in computing for its capacity to efficiently handle large volumes of data. This capacity to learn from extensive datasets is a notable advantage of deep learning [16]. In 2006, Hinton et al. [17] introduced the concept of “deep learning” (DL), which relied on the utilization of artificial neural networks (ANNs). Subsequently, deep learning emerged as a prominent subject, leading to a resurgence in the study of neural networks, thus giving rise to the designation of “new generation neural networks”. The recent prominence of deep learning technology in machine learning, artificial intelligence, data science, and analytics is attributed to its capacity to acquire knowledge from available data. Deep learning (DL) is often regarded as a component of both machine learning (ML) and artificial intelligence (AI). As a result, DL can be viewed as an AI mechanism that mimics the data-processing abilities of the human brain [16]. The algorithms used in deep learning benefit from the augmentation of data generation, enhanced computing capabilities, and the expanding availability of artificial intelligence (AI) as a service. Despite the presence of diverse, unorganized, and interconnected data sources, deep learning empowers robots to address complex problems effectively. The effectiveness of deep learning algorithms improves as they acquire more knowledge and experience [18,19,20,21]. Convolutional neural networks (CNNs), recurrent neural networks (RNNs), denoising autoencoders (DAEs), deep belief networks (DBNs), and long short-term memory (LSTM) networks represent some of the most commonly utilized deep learning techniques, enjoying considerable popularity and extensive adoption. This section provides a comprehensive overview of each method, including a detailed description and an exploration of significant applications [22]. The convolutional neural network (CNN) is well recognized as a prominent framework within the deep learning (DL) field, mainly employed for image processing tasks. The architecture consists of three distinct layers, each incorporating various convolutional, pooling, and fully connected layers [22]. The most common convolutional neural network (CNN) designs are ZFNet [23], GoogLeNet [24], VGGNet [25], AlexNet [26], and ResNet [27].
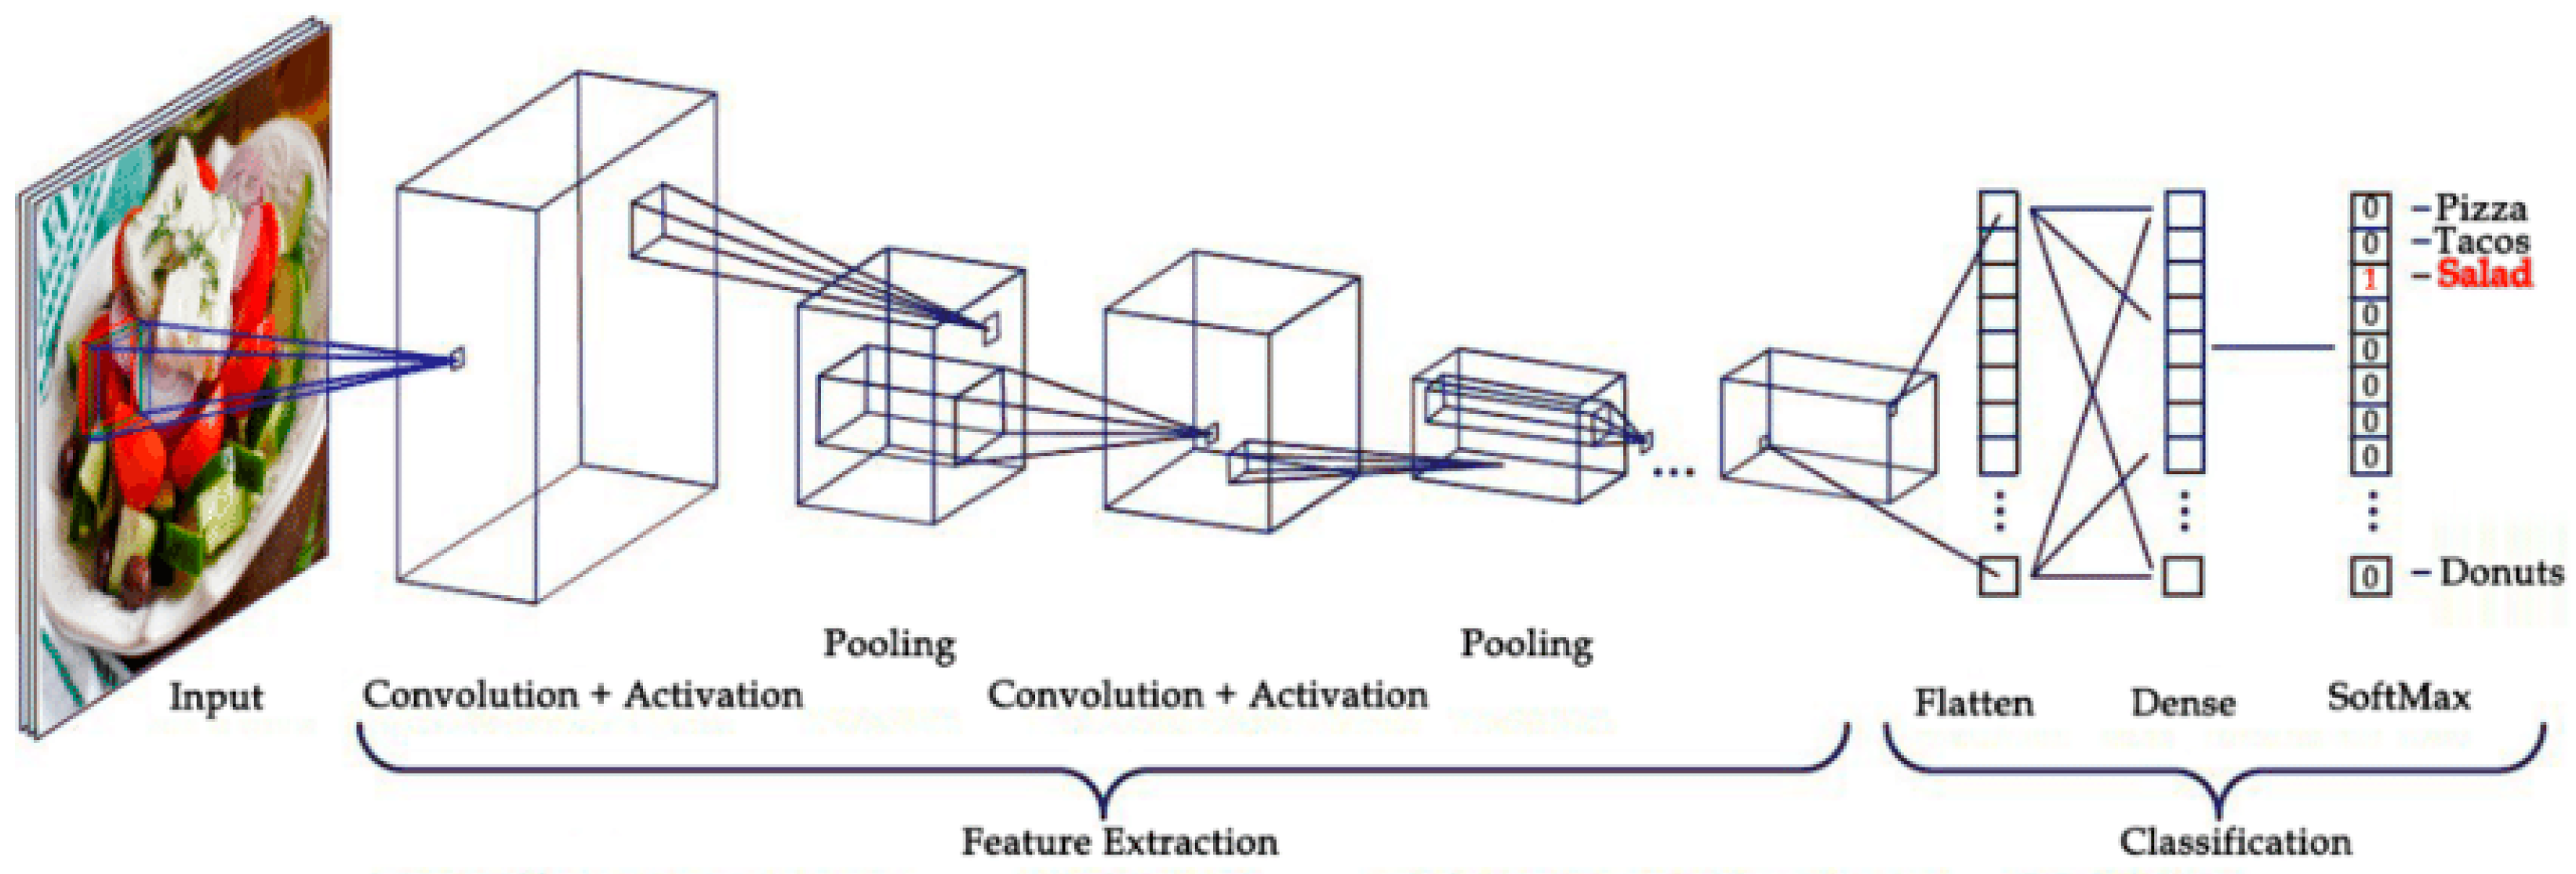
A convolutional neural network (CNN) is an approach that employs an artificial neural network featuring a trainable architecture comprised of numerous layers [28] (Figure 2). Convolutional neural networks (CNNs) offer numerous benefits when applied to image processing tasks [15]; the integration of feature extraction and classification inside a single network structure allows for synchronized training, resulting in an entirely adaptable method. As the image size increases, the extraction of deep feature information is improved. The unique network topology of the system exhibits robust adaptability to various local deformations, image rotations, image translations, and other alterations present in the input image. In the present investigation, the representation of wood was subjected to convolution while simultaneously examining the characteristics of defects. He et al. [29] utilized a mixed, fully convolutional neural network (Mix-FCN) for the automatic detection and categorization of wood flaws using photographs of wood surfaces. Nevertheless, the utilization of computer resources by the Mix-FCN algorithm was excessive for all wood specimens, irrespective of the fact that a significant proportion of these specimens were defect-free, resulting in time inefficiency. The approach suggested by Park et al. [30] involved utilizing a convolutional neural network (CNN) for the automated visual inspection of defects on wood product surfaces. Although this algorithm has shown effectiveness in detecting wood defects, it has yet to be implemented in practical applications. Urbonas et al. [31] employed a pre-trained ResNet152 neural network model in combination with the faster R-CNN to identify surface flaws on wood panels. The researchers reported a high accuracy rate of 96.1%. Nevertheless, this approach solely produces a container that encompasses the wood imperfections rather than the actual flaws’ shapes, compromising the fault incision’s accuracy. Jung et al. [32] employed three separate convolutional neural network (CNN) architectures to classify images of standard wood as well as four different types of defect images. Upon conducting a comparison of the performance of three convolutional neural network (CNN) models, it was noted that the deep CNN demonstrated a significantly high classification accuracy of 99.8% specifically in defect detection. Nonetheless, it is essential to acknowledge that the enlarged network depth led to decreased computational efficiency.
The aim of this study was to perform a comparative analysis of the detection and identification of six different defects observed on oak wood, such as wood ray, ambrosia wood, sapwood, ingrown bark, knots, and cracks, using two different software systems.

2. Materials and Methods

2.1. Material and Observed Defects

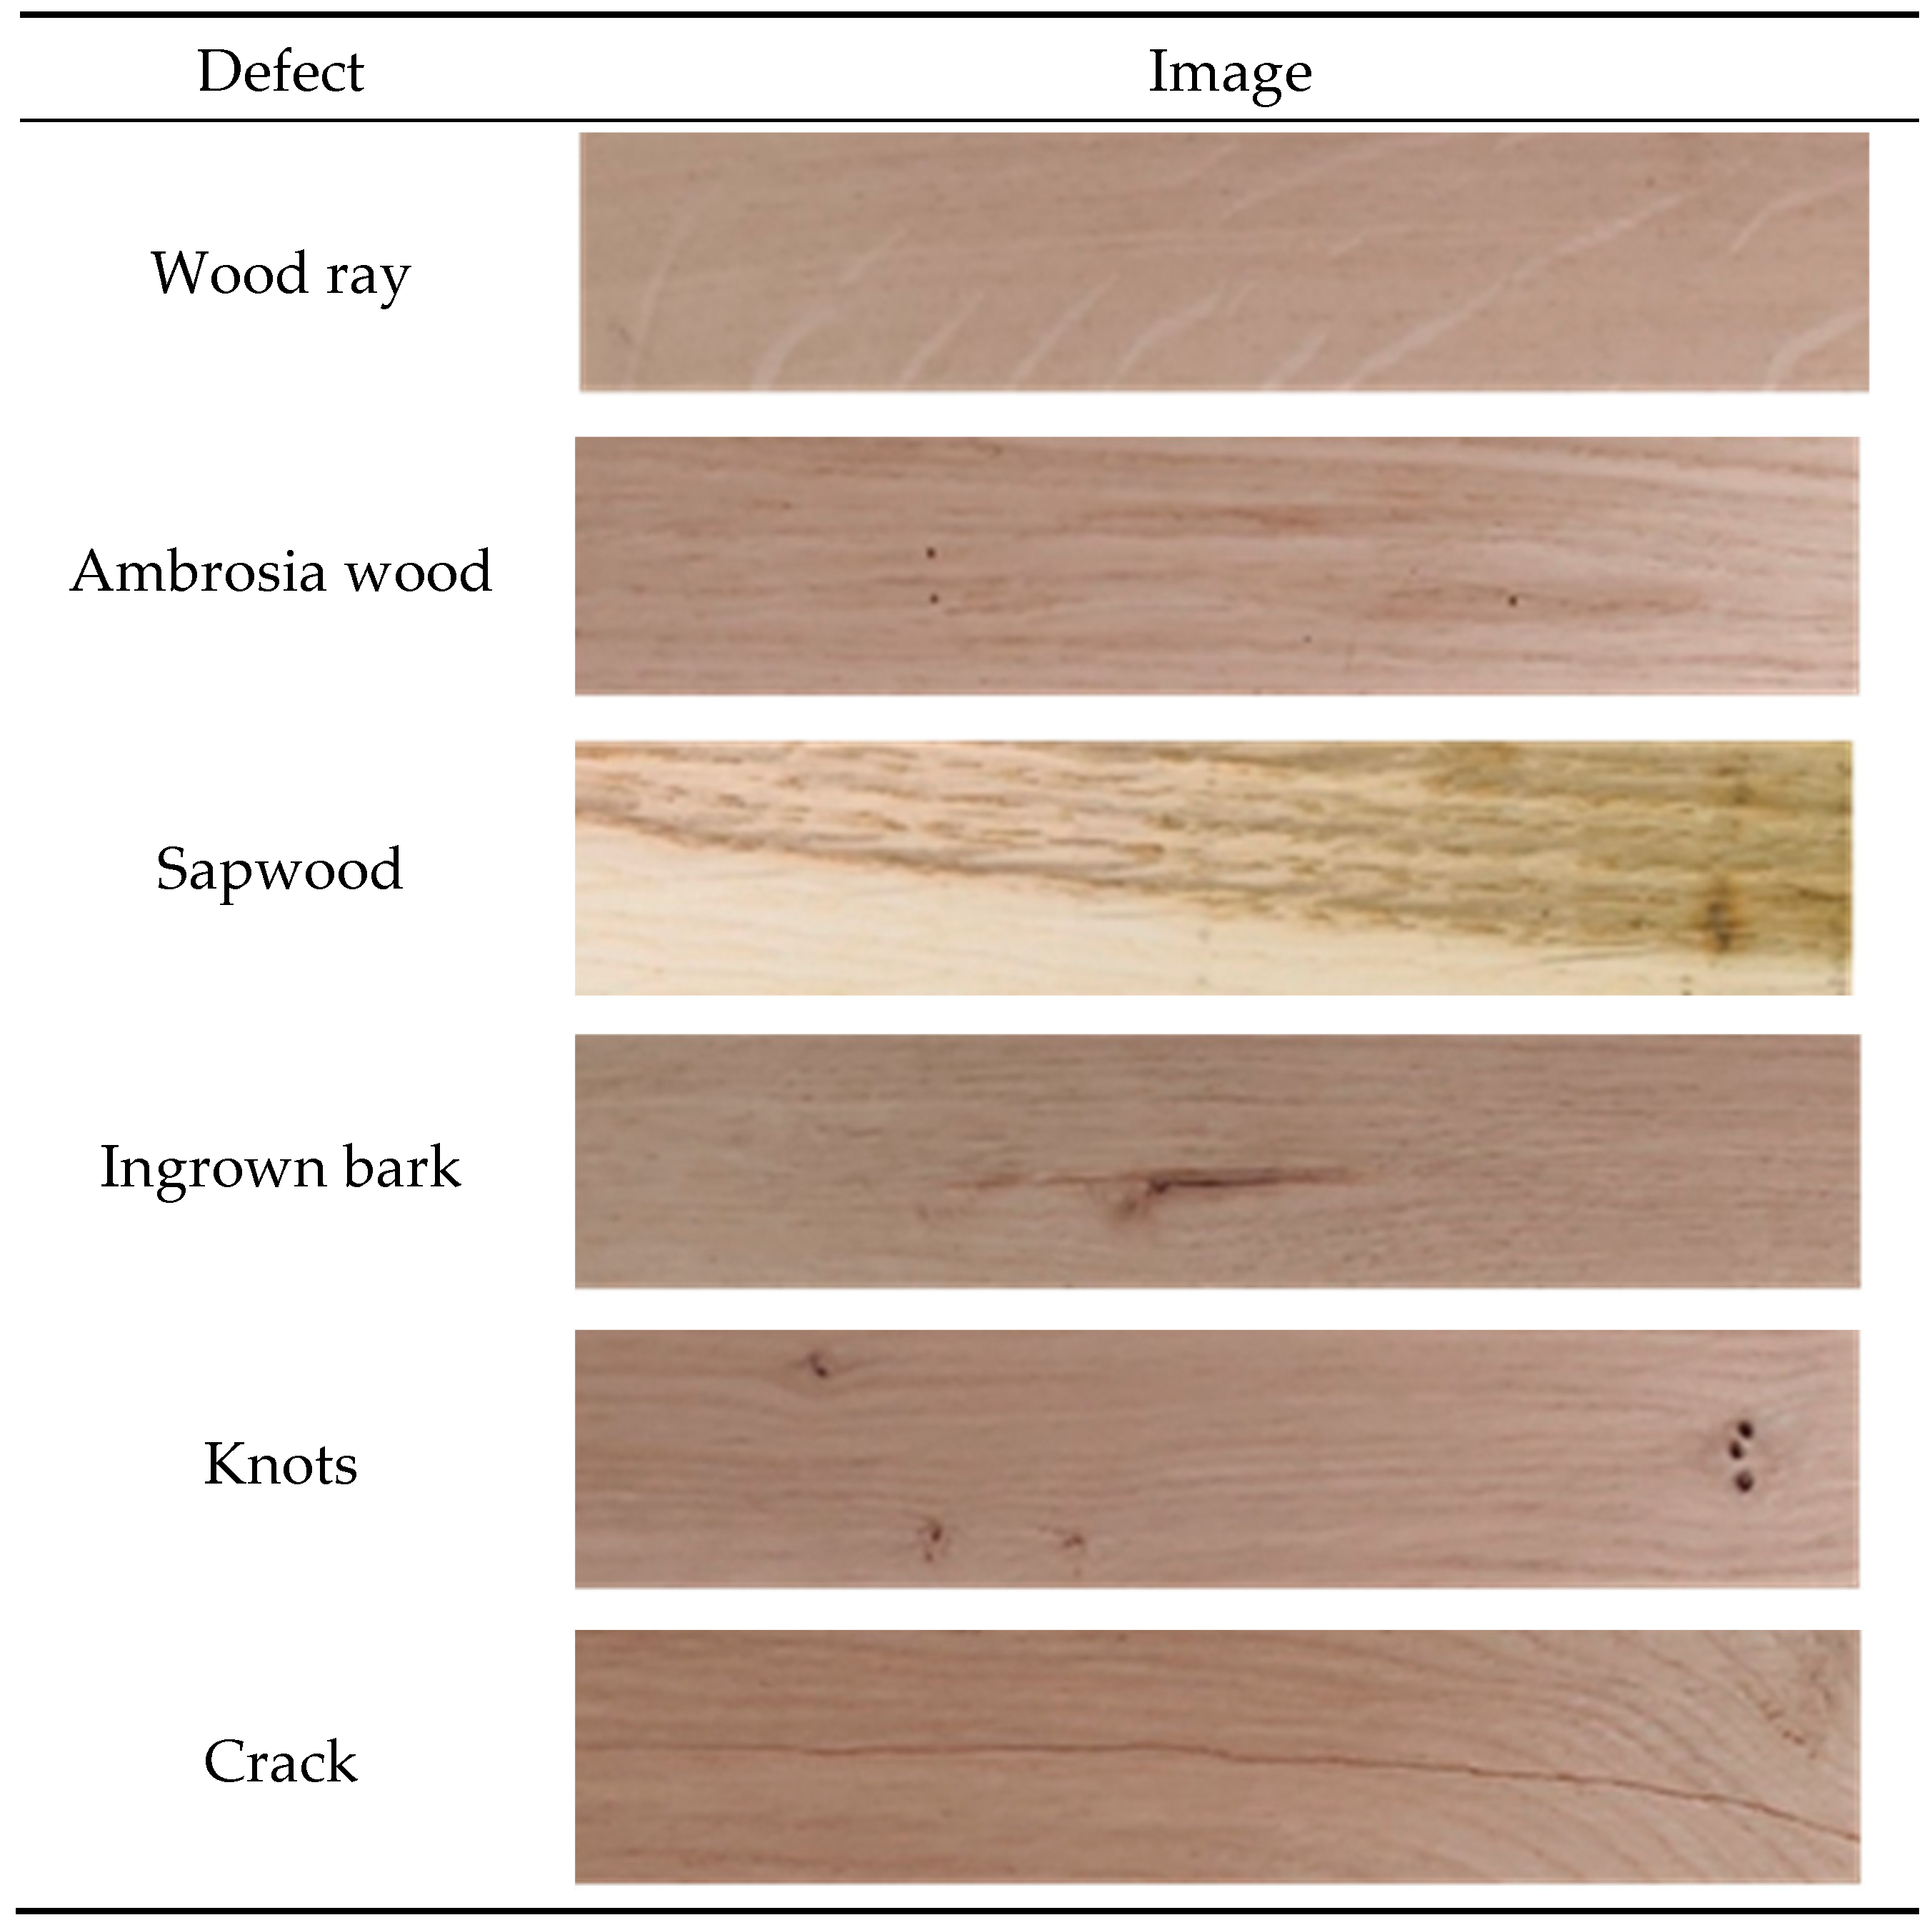
Lamellae manufactured from oak wood were prepared for the study, with dimensions of 700 × 100 × 2 mm (length × width × thickness). The study was conducted on a total of forty lamellae, all of which exhibited at least one of the six defects that were previously identified. The overall database has around 800 pictures, and it is wholly partitioned into clusters of defects intended for analysis and for the comparison of the performance of the two defect detection software. Thirty specimens were purposefully chosen to facilitate a comparative analysis of the software’s performance and its ability to produce accurate outcomes. This approach created a realistic manufacturing scenario, acknowledging that not all defects are uniformly prevalent throughout all saws or lamellae. The number of specimens on which a specific defect was found is presented in Table 1 (data in the table are based on visual assessment).
Wood rays refer to the part of the rays in the inner side of the cambium, the secondary xylem part (they appear on the elements of the radial texture, i.e., radially sawn timber). The mentioned elements are easily recognized as places of greater brightness or mirroring of the surface of the strips. On oak, the defect in the wood rays manifests itself as a wide and bright line, which is much brighter than the rest of the longitudinal tissue. It is important to note that wood rays are a stunning aesthetic feature of oak, but the problem arises when they appear on the veneer when glue penetration occurs during the veneering process. Ambrosia wood has a variety of tiny larval pathways, varying in color from gray to black, which can be found in the wood’s bark, core, sapwood, and heartwood. Occasionally, these hidden pathways stand out by their visual qualities, while they provide significant technological difficulties at other times. The dark color observed in the larval pathways can be attributed to the presence of mycelium from symbiotic fungi. Under favorable conditions, the mycelia of these fungi can extend into the surrounding wood, significantly altering its color to a bright blue. Sapwood is mainly the part of wood that consists of the outer layers closer to the bark. In most cases, it is lighter than the pith, and in a living tree, it contains living cells, reserves substances, and conducts water. In contrast to sapwood, heartwood, consisting of extractives, exhibits greater dryness, weight, and hardness, along with a reduced fiber saturation point and lower hygroscopicity [34]. Moreover, the differentiation between sapwood and heartwood can be entirely attributed to differences in their chemical composition [35]. In addition to what has been previously stated, sapwood was eliminated as a defect since it is less resistant to biological decay. Ingrown bark is a defect that occurs when the wood wholly or partially covers the bark and can be superficial if it only appears on one side of the sawn wood or penetrating if it occurs on both sides. A knot marks a part of a branch that has grown into the trunk and represents a defect that inevitably appears divided according to origin, fusion, growth, size, shape, degree of health, and consistency. A crack is a line of separation of consistent material in the longitudinal direction, and it may appear on the saw’s face, surface, or internals. Their presence significantly decreases the material utilization rate. Figure 3 provides pictures of each of the mentioned defects.

2.2. Software 1

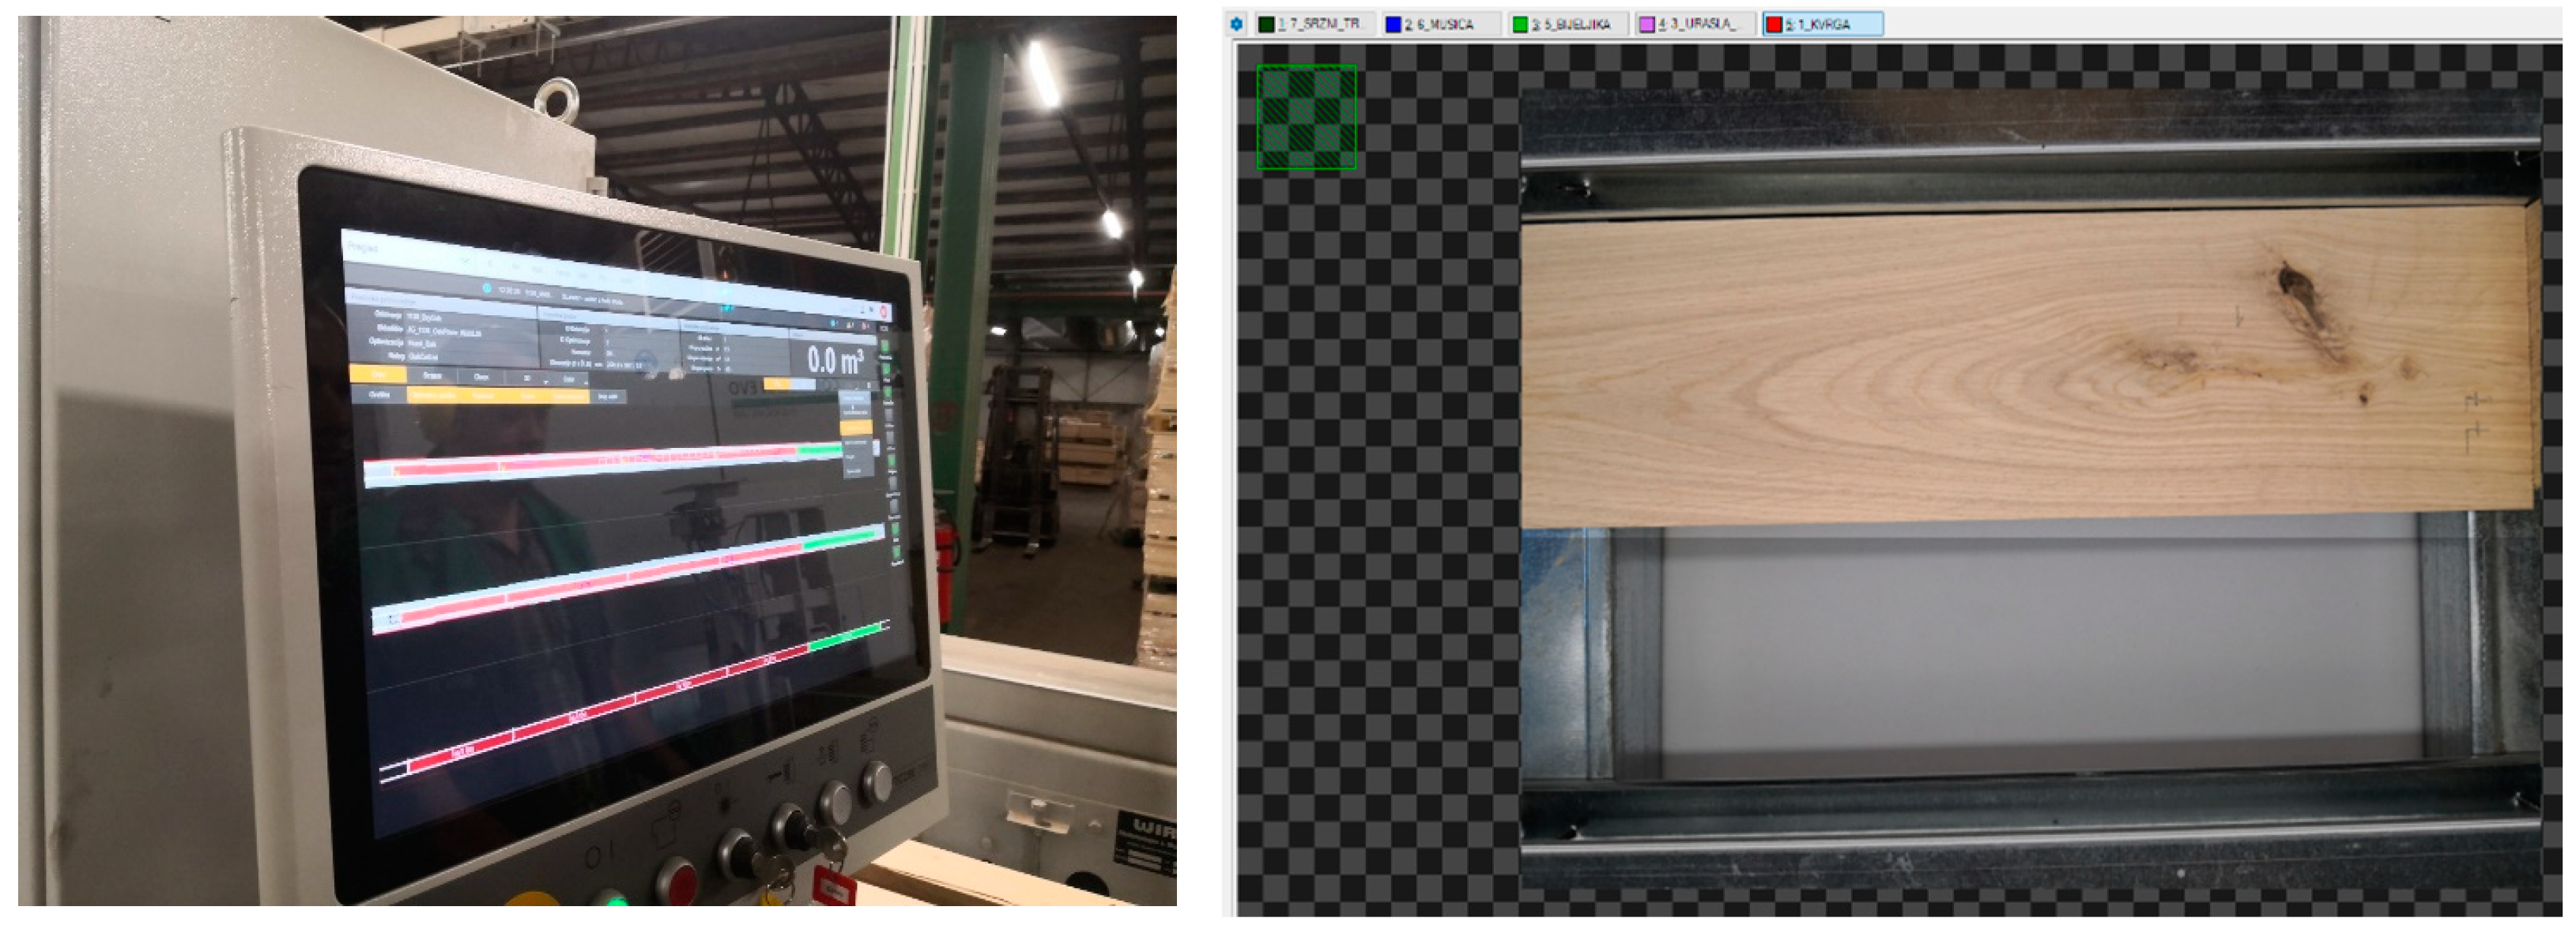
The introduction states that the first software solution comes with the Weinig CombiScan Evo R (LuxScan, Weinig group, Luxembourg, Foetz) industrial scanner (Figure 4). During production, the sawn surface is recorded while moving on both software in a wood-processing company (overlapping and combining multiple images into one combined photo). The first scanner has a maximum field of view of 600 mm and two mounted cameras (on the upper and lower sides of the sawn surfaces), while the second scanner has a maximum field of view of 300 mm and four cameras that encircle the entire sawn surface. Both cameras feature a 300 mm distance and 12 MP resolution. A second scanner was used for comparison.
During this phase of lamellae scanning, no specific preparation was conducted. The lamellae underwent scanning, after which the data and photos capturing identified defects were captured and stored.

2.3. Software 2

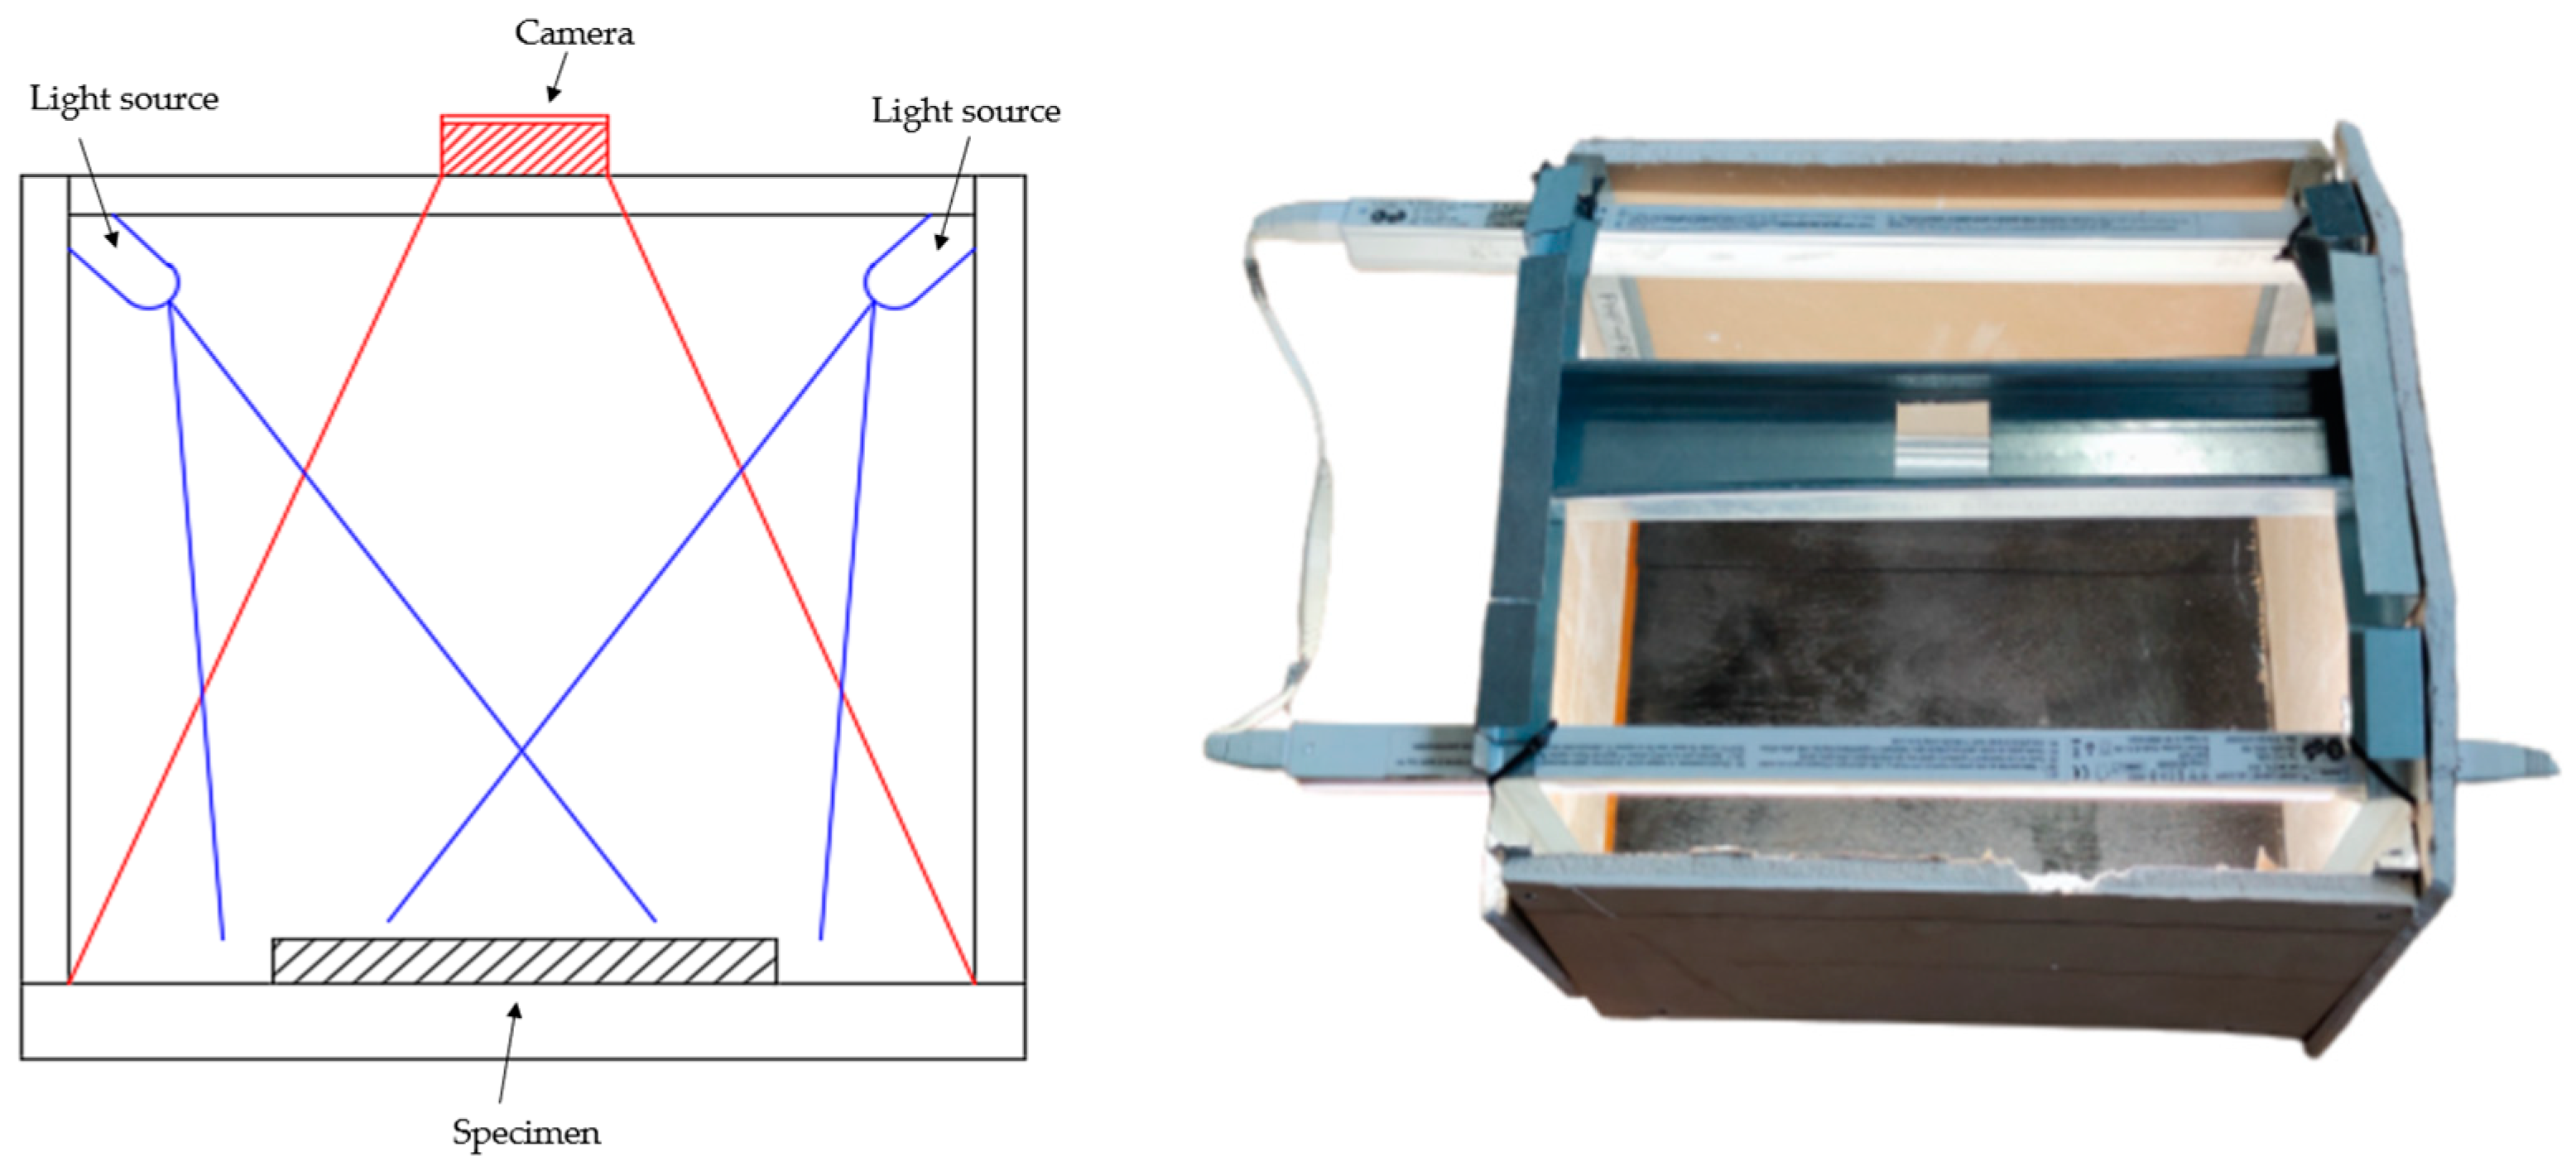
The first step of developing software solutions was laboratory imaging. After laboratory imaging (Figure 5), the photos were stored in a database, which made them available for software recognition. This database was used for training and comparison with software solution 1. The shooting conditions involved capturing images with a 12 MP camera (the same as on the Weinig industrial scanner) positioned with 315 mm between the surface and the camera lens. The illumination for this setup was provided by a 10 W light source, emitting 800 lumens at a color temperature of 4500 K. The camera was positioned at a 45° angle on each side for optimal image capture.
Adaptive Vision Studio is a visual programming platform that employs dataflow-based technology tailored for machine vision applications. It serves as a tool for crafting software solutions capable of generating both standard and tailored algorithms for industrial vision systems. With its comprehensive library of finely tuned image analysis filters, users can design personalized graphical user interfaces (HMI). In essence, it provides a holistic approach to software development for industrial vision systems. In the realm of software development, the construction of effective solutions mandates the utilization of a feature detection (segmentation) model. This model is designed to discern pixel-wise regions indicative of defects or various other features present within images. For example, this algorithm is capable of identifying thoroughfares within satellite imagery or discerning distinct surface patterns characteristic of particular objects. This procedure is commonly denoted as pixel labeling, as it assigns a categorical label to each pixel, albeit without distinguishing individual object instances. Preprepared images were introduced into the program’s editor as input image types (inImage). Notably, the supported pixel formats for input images are restricted to 1 × uint8 and 3 × uint8. Each distinguishing feature was annotated across all training images, or alternatively, the region of interest (ROI) was delimited to encompass solely annotated anomalies. Inadequately or inconsistently annotated features constitute a primary cause of diminished accuracy. Unmarked features serve as negative samples, introducing complexity into the training process. To accommodate potential variation, specific features were annotated with a degree of leniency, aiming to encompass a surplus margin and capture as many errors as feasible. The feature detection mechanism operates as an end-to-end segmentation tool, exhibiting optimal performance when scrutinizing images within a moderately sized square window; hence, a patch size of 96 pixels was implemented. The software promptly returns a catalog of detected anomalies within a mere 2–3 s, allowing for comprehensive inspection of identified defects and evaluation of the software’s efficacy. Both programs are based on the detection of color differences.

3. Results and Discussion

Table 2 displays the results of the defect detection. Green cells labelled with + signs indicate that the defect has been precisely identified. Red cells labelled D − indicate that the software detected a defect that does not exist, whereas red labelled ND − means the software failed to identify an existing defect.
The percentages of successful software defect detection are given in Table 3. Detected defects that did not exist (D −) but were still determined by software were not included in the percentage calculation. Those errors can be explained by the software identifying the color difference (early and late wood) as a defect.
Regarding crack detection, both software have identical levels of recognition (65% vs. 75%), with software 1 being slightly better. A study [36] that utilized the classification and regression tree approach (CART) found the final recognition rate of cracks and pinholes to be up to 96.3%. The study, which explores the application of vibrothermography in detecting cracks in parquet lamellae [37], achieved an accuracy of 80% by utilizing completed local binary pattern histograms to capture the texture image and employing background suppression and thresholding techniques for crack segmentation. In an alternative approach, researchers have developed an identification algorithm that employs the local binary pattern (LBP) and a local binary differential excitation pattern on birch veneer. This method effectively detects cracks and mineral line defects [38]. The study’s findings indicate that the algorithm improves capability in detecting cracks and mineral lines, as evidenced by a precision rate of 0.943. Overall, the percentage of defect detection with both software was relatively low. The percentage of knot detection was also only slightly higher with software 2 (77.78% vs. 70.37%). Under this appellation, all knots, regardless of health, size, or shape, are included. In a study conducted in 2020 [39], machine learning techniques were employed to classify knots and cracks in oak, spruce, and TMT spruce-sawn timber within the wood industry. The findings indicated that a support vector machine (SVM) attained a defect identification accuracy of 75.8%. Furthermore, the k-nearest neighbors (k-NN) algorithm and the decision tree approach achieved accuracies of 74.2% and 71.9%, respectively. The previously mentioned analysis [36] showed that the level of recognition of knots (sound and dead) is, on average, about 90% for the wood species Xyloma congestum. The majority of researchers focused on knots, as they are the most commonly encountered defect in timber, influencing both the structural integrity of the wood and the overall quality of the final product [39]. Additional improvements could be attained comparing the results obtained with the researched software. According to a study conducted in 2010 [40], sound and pin knots generally do not significantly influence the mechanical properties of wood in most applications.
On the other hand, dead knots and knot holes appear to have the opposite effect. The sapwood defect is the only defect successfully detected in 100% of cases with software 1 and 80% with software 2. Such a high level of defect recognition is attributed to the significantly different color of the sapwood from the surrounding wood, so the color difference is significant and easily detected. Both software detected the ingrown bark defect very rarely (28.57% vs. 42.86% in favor of software 2), which is an interesting fact considering that it is easily detected. Ambrosia wood manifests as a tiny defect (dark spots), recognized in only 20% of cases with software 2 and 60% with software 1. Such low detection percentages can be attributed to the software processing photos taken with a 12 MP camera, which may need to provide more sharpness for such small-size defects. The most significant difference between the software was obtained with wood ray (81.82% vs. 27.27% in favor of software 2). The wood ray is shown as a light line, which is shown to be significantly well detected by software 2. Suppose all defects are considered, and the mean value of the successful recognition of all defects is taken. In that case, the first software achieved a detection rate of 59.77% and the second a detection rate of 61.68%, which means that the overall success of defect recognition is slightly better with software 2. According to Cao et al. [41], humans typically reach a reliability of around 70% in wood inspections and are prone to errors due to eye fatigue being a significant aspect of the examination process.
The following figures (Figure 6, Figure 7, Figure 8, Figure 9, Figure 10 and Figure 11) will visually display and compare the results of several individual specimens. The Software 1 detection results are on the left, while those of software 2 are on the right. The left and right images represent an identical specimen; the only difference is in the software used.
In specimen 34, both software accurately identified the cracks and wood rays. However, software 2 outperformed with a greater percentage of wood ray recognition.
In specimen 37, both software identified defects identically. Software 1 found a few additional knots in the lower left corner despite this.
Similar to specimen 37, software 1 better recognizes the small knot in specimen 38, while everything else is recognized equally. Both software achieve great recognition results.
It is observed in specimen 7 that software 1 is able to detect ambrosia wood, whereas software 2 fails to detect it completely. Table 2 shows that software 1 is generally better at detecting ambrosia wood.
In specimen 8, both software were able to detect the crack accurately. However, software 1 failed to detect knots and wood rays but successfully detected ingrown bark. On the other hand, software 2 successfully detected knots and wood rays but failed to detect ingrown bark.
In specimen 17, both software failed to detect the knot. However, software 2 detected wood rays, while software 1 failed and generally demonstrates a low detection of wood rays (27.27%).

4. Conclusions

This research aimed to compare the detection of defects that appear on oak (cracks, knots, sapwood, ambrosia wood, and wood rays) by using software that was installed as a part of the industrial scanner for the company and a software that was developed within the research project. Knots, sapwood, and ambrosia wood are defects better detected with the software installed in the industrial scanner. In contrast, cracks, ingrown bark, and wood rays are defects better detected with the software developed within the project. It is important to emphasize that all the differences are more or less slight, but the industrial scanner very poorly detects ingrown bark and wood ray. This result shows that the software installed in the industrial scanner will have to be improved by the manufacturer so that elements containing defects are not improperly classified. To maximize wood processing, accurate wood defect detection is essential. This software solution could serve a critical role, starting from the initial phases of the sawmill processing of logs into sawn boards, to the control check for building wood beams, to the classification of wood flooring boards into different classes, etc.
For subsequent research, it is imperative to ensure an equal representation of defects of each type, given the substantial variation in defect counts across the 40 analyzed specimens (knots were identified in 27 specimens, while sapwoods were only identified in 5). This approach, which involved testing 40 specimens as part of an actual situation, meant that an equal number of defects could not be achieved on a certain number of elements. The software solution developed as part of the project expects further upgrades and improvements, i.e., training with additional wood specimens. In summary, there are still many opportunities for growth and solutions to be found.

Author Contributions

Conceptualization, T.S. (Tomislav Sinković), B.J. and T.S. (Tomislav Sedlar); methodology, T.S. (Tomislav Sinković) and B.J.; software, B.J. and F.V.; validation, I.I., T.S. (Tomislav Sedlar) and V.Ž.; formal analysis, B.J., F.V. and I.I.; investigation, B.J., T.S. (Tomislav Sinković), V.Ž. and F.V.; resources, T.S. (Tomislav Sedlar) and T.S. (Tomislav Sinković); data curation, B.J., F.V. and T.S. (Tomislav Sinković); writing—original draft preparation, B.J. and F.V.; writing—review and editing, V.Ž., I.I. and T.S. (Tomislav Sedlar); visualization, B.J., I.I. and T.S. (Tomislav Sedlar); supervision, T.S. (Tomislav Sinković), V.Ž. and I.I.; project administration, B.J. and F.V.; funding acquisition, T.S. (Tomislav Sedlar). All authors have read and agreed to the published version of the manuscript.

Funding

The software solutions and presented results are the outcome of a research project funded by the European Regional Development Fund in Croatia, within the project “Research at the Spačva d.d. Company to develop Innovative Solid Slavonian Oak Doors” (Grant NR KK.01.2.1.01.0117), conducted jointly by the Faculty of Forestry and Wood Technology and the company Spačva d.d.

Data Availability Statement

The data presented in this study are available upon request from the corresponding author.

Conflicts of Interest

The authors declare no conflicts of interest.

References

  1. Funck, J.W.; Zhong, Y.; Butler, D.A.; Brunner, C.; Forrer, J. Image segmentation algorithms applied to wood defect detection. Comput. Electron. Agric. 2003, 41, 157–179. [Google Scholar] [CrossRef]
  2. Ke, Z.N.; Zhao, Q.J.; Huang, C.H.; Ai, P.; Yi, J.G. Detection of wood surface defects based on particle swarm-genetic hybrid algorithm. In Proceedings of the 2016 International Conference on Audio, Language and Image Processing-Proceedings, Shanghai, China, 11–12 July 2016. [Google Scholar]
  3. Hashim, U.R.; Hashim, S.Z.; Muda, A.K. Automated vision inspection of timber surface defect: A review. J. Teknol. 2015, 77, 127–135. [Google Scholar] [CrossRef]
  4. Cavalin, P.; Oliveira, L.S.; Koerich, A.L.; Britto, A.S. Wood defect detection using grayscale images and an optimized feature set. In Proceedings of the IECON 2006-32nd Annual Conference on IEEE Industrial Electronics, Paris, France, 6–10 November 2006; pp. 3408–3412. [Google Scholar]
  5. Zhang, Y.; Xu, C.; Li, C.; Yu, H.; Cao, J. Wood defect detection method with PCA feature fusion and compressed sensing. J. For. Res. 2015, 26, 745–751. [Google Scholar] [CrossRef]
  6. Norlander, R.; Grahn, J.; Maki, A. Wooden Knot Detection Using ConvNet Transfer Learning. In Lecture Notes in Computer Science, Image Analysis; Paulsen, R., Pedersen, K., Eds.; SCIA: Cham, Switzerland, 2015; Volume 9127. [Google Scholar] [CrossRef]
  7. Pölzleitner, W.; Schwingshakl, G. Real-time surface grading of profiled wooden boards. Ind. Metrol. 1992, 2, 283–298. [Google Scholar] [CrossRef]
  8. Qiu, Z.F. A Simple Machine Vision System for Improving the Edging and Trimming Operations Performed in Hardwood Sawmills. Master’s Thesis, Virginia Polytechnic Institute and State University, Blacksburg, VA, USA, 1996. [Google Scholar]
  9. Schmoldt, D.L.; Li, P.; Abbott, A.L. Machine vision using artificial neural networks with local 3D neighborhoods. Comput. Electron. Agric. 1997, 16, 255–271. [Google Scholar] [CrossRef]
  10. Qi, D.W.; Zhang, P.; Jin, X.; Zhang, X. Study on wood image edge detection based on Hopfield neural network. In Proceedings of the 2010 IEEE International Conference on Information and Automation, Harbin, China, 20–23 June 2010; pp. 1942–1946. [Google Scholar]
  11. Ji, X.Y.; Guo, H.; Hu, M.H. Features Extraction and Classification of Wood Defect Based on Hu Invariant Moment and Wavelet Moment and BP Neural Network. In Proceedings of the 12th International Symposium on Visual Information Communication and Interaction (VINCI’2019), Shanghai, China, 20–22 September 2019; Association for Computing Machinery: New York, NY, USA, 2019. Article 37. pp. 1–5. [Google Scholar]
  12. Mu, H.; Qi, D.W. Pattern Recognition of Wood Defects Types Based on Hu Invariant Moments. In Proceedings of the 2009 2nd International Congress on Image and Signal Processing, Tianjin, China, 17–19 October 2009; pp. 1–5. [Google Scholar]
  13. Hermanson, J.C.; Wiedenhoeft, A.C. A brief review of machine vision in the context of automated wood identification systems. IAWA J. 2011, 32, 233–250. [Google Scholar] [CrossRef]
  14. Yang, Y.; Zhou, X.; Liu, Y.; Hu, Z.; Ding, F. Wood Defect Detection Based on Depth Extreme Learning Machine. Appl. Sci. 2020, 10, 7488. [Google Scholar] [CrossRef]
  15. Available online: https://docs.adaptive-vision.com/current/studio/machine_vision_guide/DeepLearning.html#object_location (accessed on 23 October 2023).
  16. Taye, M.M. Understanding of Machine Learning with Deep Learning: Architectures, Workflow, Applications and Future Directions. Computers 2023, 12, 91. [Google Scholar] [CrossRef]
  17. Hinton, G.E.; Osindero, S.; Teh, Y.-W. A fast learning algorithm for deep belief nets. Neural Comput. 2006, 18, 1527–1554. [Google Scholar] [CrossRef] [PubMed]
  18. Ahmad, J.; Farman, H.; Jan, Z. Deep learning methods and applications. In Deep Learning: Convergence to Big Data Analytics; SpringerBriefs in Computer Science; Springer: Singapore, 2019; pp. 31–42. [Google Scholar]
  19. Deep Learning Techniques: An Overview|SpringerLink. Available online: https://link.springer.com/chapter/10.1007/978-981-15-3383-9_54 (accessed on 11 March 2023).
  20. Srinivas, M.; Sucharitha, G.; Matta, A.; Chatterjee, P. Machine Learning Algorithms and Applications; Wiley: Hoboken, NJ, USA, 2021. [Google Scholar] [CrossRef]
  21. Janiesch, C.; Zschech, P.; Heinrich, K. Machine learning and deep learning. Electron. Mark. 2021, 31, 685–695. [Google Scholar] [CrossRef]
  22. Mosavi, A.; Ardabili, S.; Varkonyi-Koczy, A.R. List of Deep Learning Models. In Engineering for Sustainable Future; Várkonyi-Kóczy, A., Ed.; INTER-ACADEMIA 2019; Lecture Notes in Networks and Systems; Springer: Cham, Switzerland, 2020. [Google Scholar] [CrossRef]
  23. Zeiler, M.D.; Fergus, R. Visualizing and understanding convolutional networks. In Computer Vision—ECCV 2014. ECCV 2014. Lecture Notes in Computer Science; Fleet, D., Pajdla, T., Schiele, B., Tuytelaars, T., Eds.; Springer: Cham, Switzerland, 2014; Volume 8689. [Google Scholar] [CrossRef]
  24. Szegedy, C.; Liu, W.; Jia, Y.; Sermanet, P.; Reed, S.; Anguelov, D.; Erhan, D.; Vanhoucke, V.; Rabinovich, A. Going deeper with convolutions. In Proceedings of the IEEE Conference on Computer Vision and Pattern Recognition (CVPR), Boston, MA, USA, 7–12 June 2015. [Google Scholar]
  25. Simonyan, K.; Zisserman, A. Very deep convolutional networks for large-scale image recognition. arXiv 2014, arXiv:1409.1556. [Google Scholar]
  26. Krizhevsky, A.; Sutskever, I.; Hinton, G.E. Imagenet classification with deep convolutional neural networks. Adv. Neural Inf. Process Syst. 2012, 25. [Google Scholar] [CrossRef]
  27. He, K.; Zhang, X.; Ren, S.; Sun, J. Deep residual learning for image recognition. In Proceedings of the IEEE Conference on Computer Vision and Pattern Recognition (2016), Las Vegas, NV, USA, 27–30 June 2016. [Google Scholar]
  28. Yang, W.X.; Jin, L.W.; Tao, D.C.; Xie, Z.C.; Feng, Z.Y. DropSample: A new training method to enhance deep convolutional neural networks for large-scale unconstrained handwritten Chinese character recognition. Pattern Recogn. 2016, 58, 190–203. [Google Scholar] [CrossRef]
  29. He, T.; Liu, Y.; Xu, C.; Zhou, X.; Hu, Z.; Fan, J. A fully convolutional neural network for wood defect location and identification. IEEE Access 2019, 7, 123453–123462. [Google Scholar] [CrossRef]
  30. Park, J.K.; Kwon, B.K.; Park, J.H.; Kang, D.J. Machine learning-based imaging system for surface defect inspection. Int. J. Precis. Eng. Manuf. Green Technol. 2016, 3, 303–310. [Google Scholar] [CrossRef]
  31. Urbonas, A.; Raudonis, V.; Maskeliunas, R.; Damaševičius, R. Automated identification of wood veneer surface defects using faster region-based convolutional neural network with data augmentation and transfer learning. Appl. Sci. 2019, 9, 4898. [Google Scholar] [CrossRef]
  32. Jung, S.Y.; Tsai, Y.H.; Chiu, W.Y.; Hu, J.S.; Sun, C.T. Defect detection on randomly textured surfaces by convolutional neural networks. In Proceedings of the IEEE/ASME International Conference on Advanced Intelligent Mechatronics, Auckland, New Zealand, 9 July 2018; pp. 1456–1461. [Google Scholar]
  33. Kiourt, C.; Pavlidis, G.; Markantonatou, S. Deep learning approaches in food recognition. In Machine Learning Paradigms: Advances in Deep Learning-based Technological Applications; Springer: Cham, Switzerland, 2020. [Google Scholar]
  34. Bektas, I.; Tutus, A.; Gültekin, G. The Effect of Sapwood and Heartwood Differences on Mechanical Properties of Fast-Growing Tree Species. Drv. Ind. 2020, 71, 261–269. [Google Scholar] [CrossRef]
  35. Bozkurt, Y.; Erdin, N. Wood Technology; Publications of Faculty of Forestry; Istanbul University: Istanbul, Turkey, 1997; no. 445. [Google Scholar]
  36. Chang, Z.; Cao, J.; Zhang, Y. A novel image segmentation approach for wood plate surface defect classification through convex optimization. J. For. Res. 2018, 29, 1789–1795. [Google Scholar] [CrossRef]
  37. Pahlberg, T.; Thurley, M.; Popovic, D.; Hagman, O. Crack detection in oak flooring lamellae using ultrasound-excited thermography. Infrared Phys. Technol. 2018, 88, 57–69. [Google Scholar] [CrossRef]
  38. Li, S.; Li, D.; Yuan, W. Wood defect classification based on two-dimensional histogram constituted by LBP and local binary differential excitation pattern. IEEE Access 2019, 7, 145829–145842. [Google Scholar] [CrossRef]
  39. Chun, T.; Hashim, U.; Ahmad, S.; Salahuddin, L.; Ngo, H.C.; Kasturi, K. A review of the automated timber defect identification approach. IJECE 2023, 13, 2156. [Google Scholar] [CrossRef]
  40. Gu, I.Y.-H.; Andersson, H.; Vicen, R. Wood defect classification based on image analysis and support vector machines. Wood Sci. Technol. 2010, 44, 693–704. [Google Scholar] [CrossRef]
  41. Cao, J.; Liang, H.; Lin, X.; Tu, W. Potential of Near-infrared Spectroscopy to Detect Defects on the Surface of Solid Wood Boards. BioRes 2016, 12, 19–28. [Google Scholar] [CrossRef]
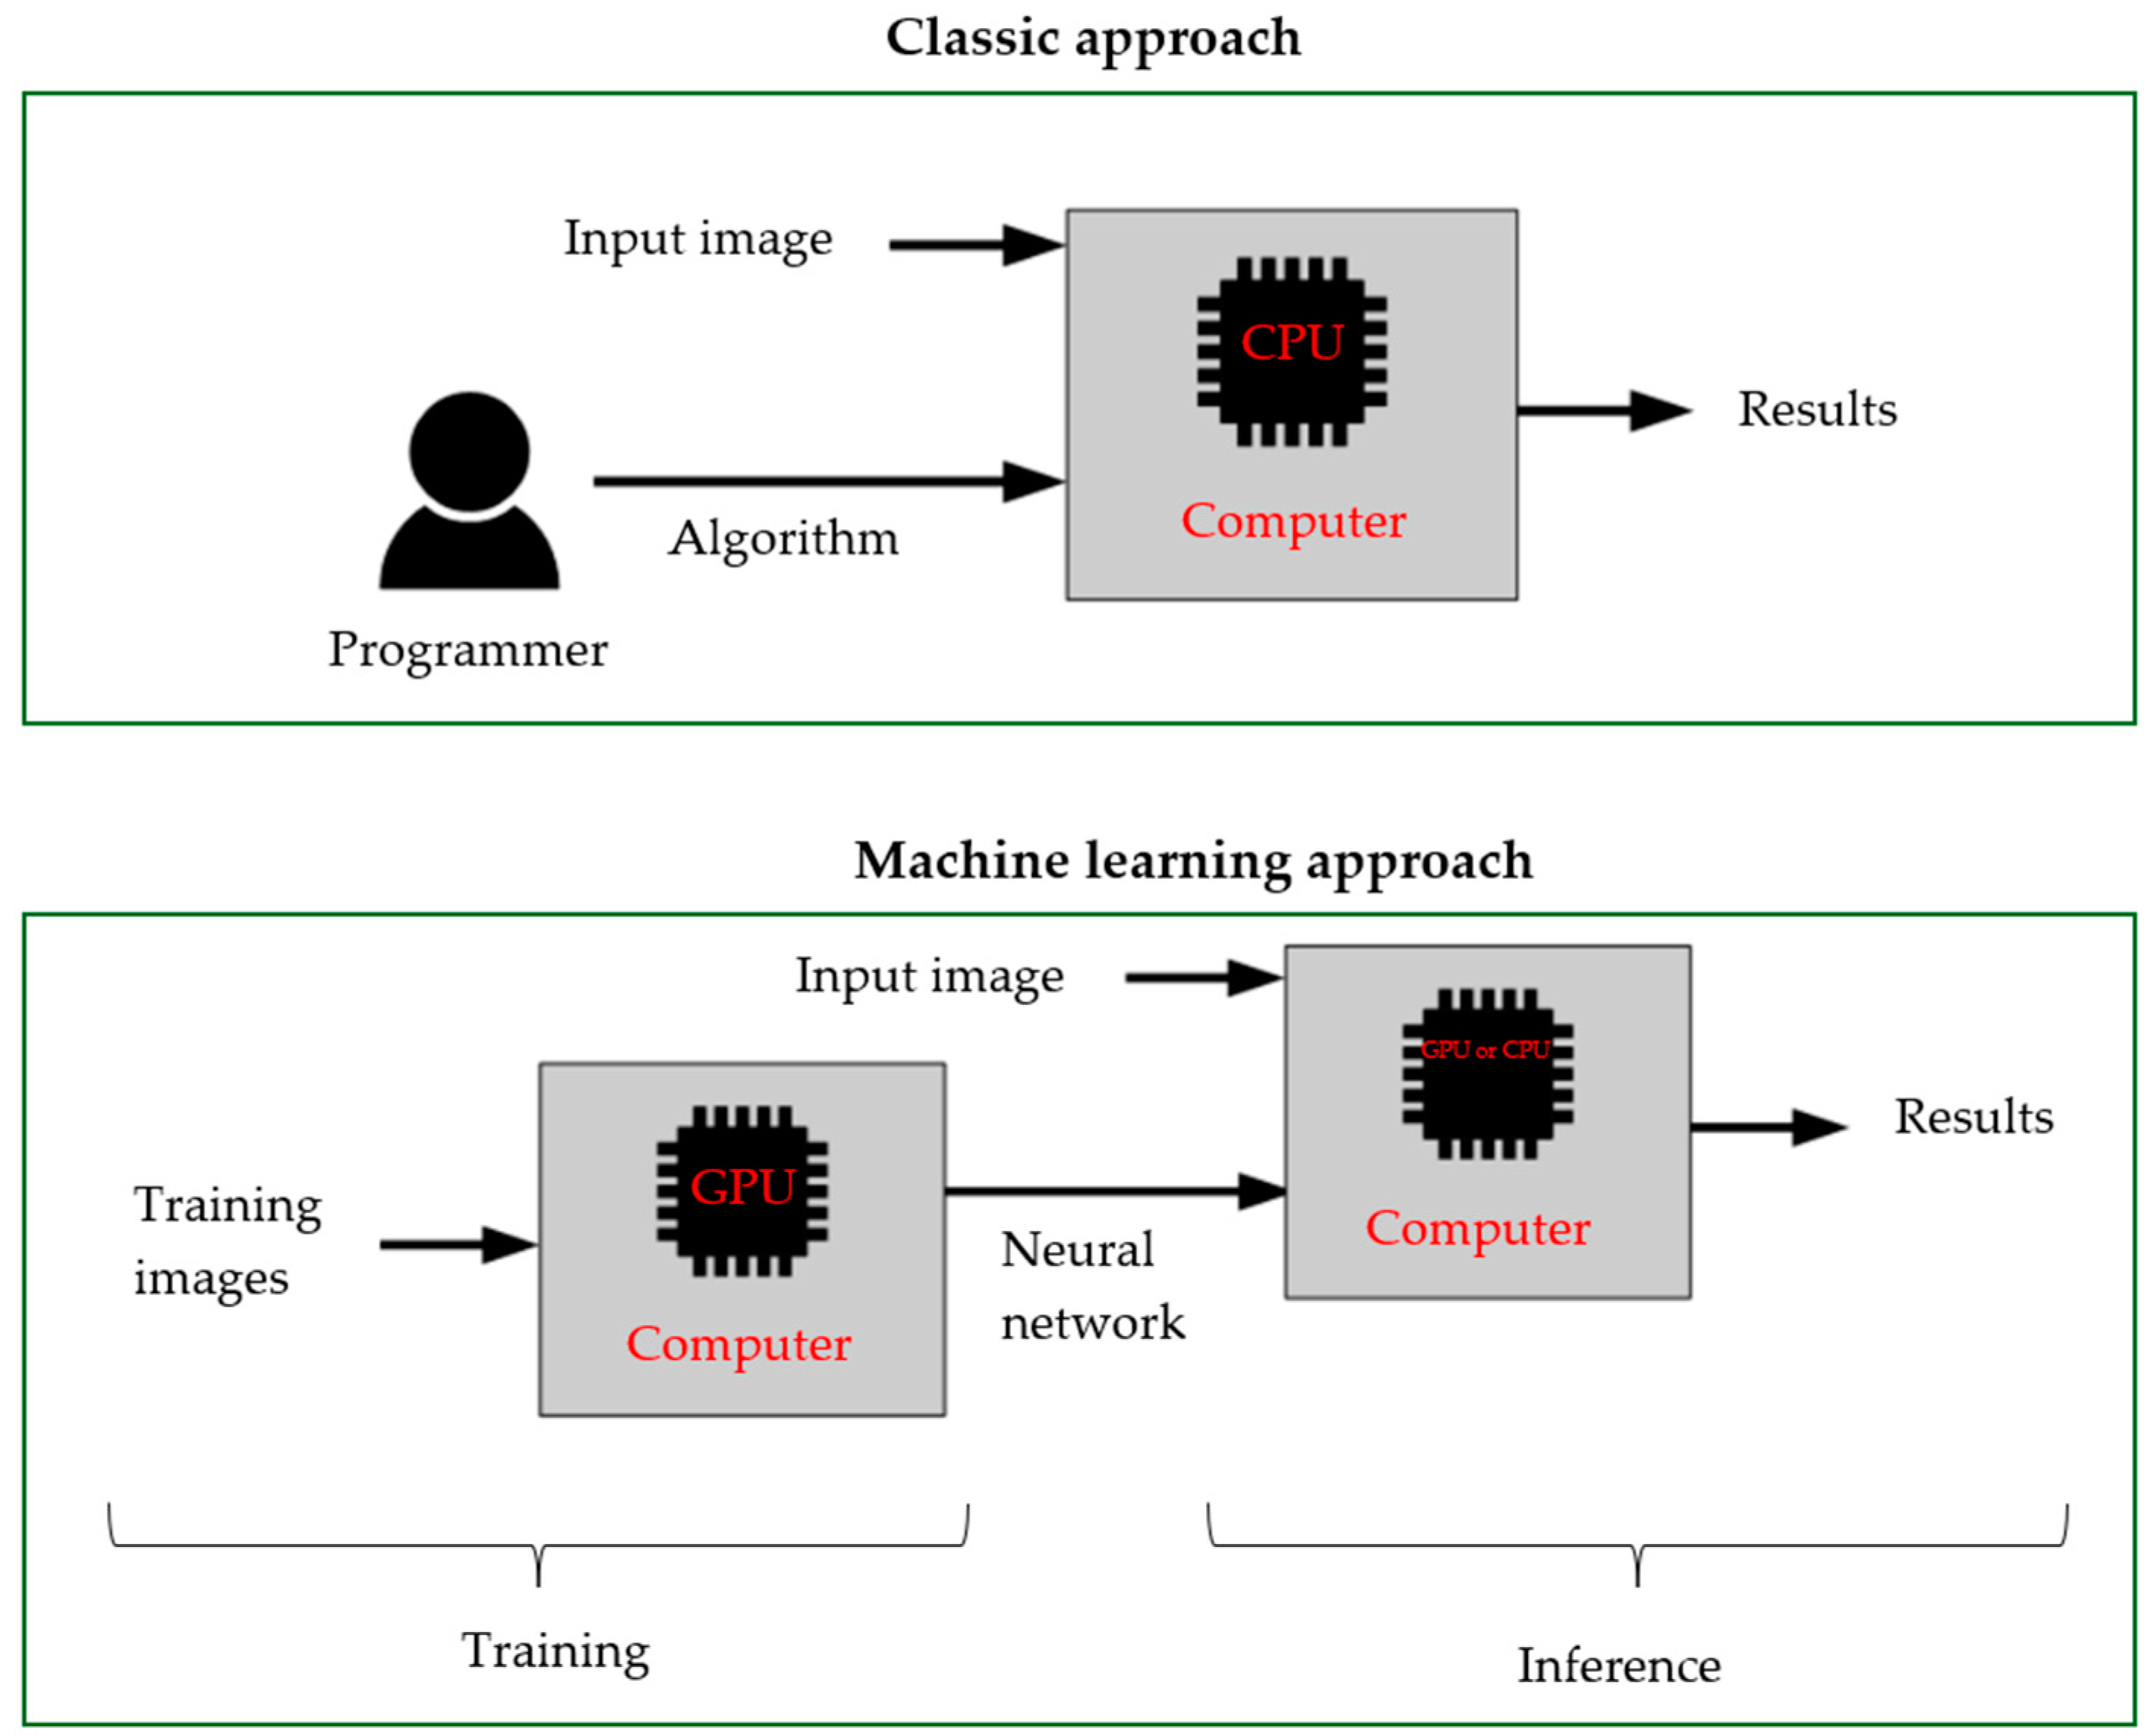
Figure 1. Schematic illustration of the classic approach where the algorithm is designed manually and the machine learning approach where a training set of labeled images is required [15].
Asi 07 00030 g001
Figure 2. A simple CNN architecture [33].
Asi 07 00030 g002
Figure 3. Images of six wood defects that occur on oak wood.
Asi 07 00030 g003
Figure 4. Visual representation of the scanned photo on the first software.
Asi 07 00030 g004
Figure 5. Laboratory equipment for taking photographs.
Asi 07 00030 g005
Figure 6. Defect detection on specimen 34 (left—software 1 image; right—software 2 image).
Asi 07 00030 g006
Figure 7. Defect detection on specimen 37 (left—software 1 image; right—software 2 image).
Asi 07 00030 g007
Figure 8. Defect detection on specimen 38 (left—software 1 image; right—software 2 image).
Asi 07 00030 g008
Figure 9. Defect detection on specimen 7 (left—software 1 image; right—software 2 image).
Asi 07 00030 g009
Figure 10. Defect detection on specimen 8 (left—software 1 image; right—software 2 image).
Asi 07 00030 g010
Figure 11. Defect detection on specimen 17 (left—software 1 image; right—software 2 image).
Asi 07 00030 g011
Table 1. Six different wood defects and their occurrence on specimens.
Wood DefectsTesting
Specimens
Wood ray11
Ambrosia wood5
Sapwood5
Ingrown bark7
Knots27
Crack20
Table 2. Results of defect detection on the wood surface.
SampleSoftware 1
Defects
CrackKnotSapwoodIngrown barkAmbrosia woodWood ray
1++ ND −
2
3 + +
4++ D −
5 +D −
6 ND −+
7 + +
8+ND − + ND −
9 + +
10ND − ND −
11ND −
12ND − ND −
13 +
14 ++
15ND − ND −
16ND − ND −
17 ND − ND −
18 +
19 + ND −
20 ND − ND − +
21++
22D −+
23++
24 ND − +ND −
25 ND −
26++ ND −
27++ ND −
28ND −
29 +
30ND − ND −
31 +
32 + ND −
33++
34+ +
35 +
36 +
37++
38++
39++ ND −
40++
SampleSoftware 2
Defects
CrackKnotSapwoodIngrown barkAmbrosia woodWood ray
1++ +
2
3 + +
4ND −+
5 +
6D −ND −ND −
7 ND − ND −
8++ ND − +
9 ND − ND −
10ND − ND −
11+
12+ ND −
13 +
14 ++
15+ +
16ND − ND −
17 ND − +
18 ND −
19 + +
20 ND − ++
21++
22 +
23+ND −
24 ND − ++
25 +
26++ +
27++ ND −
28ND −
29 ND −
30++
31 +
32 + ND −
33++
34+ +
35 +
36 +
37++
38++
39++ ND −
40ND − +
Table 3. Software defect detection percentage of all selected defects.
Percentage of Detection [%]
CrackKnotsSapwoodIngrown BarkAmbrosia WoodWood Ray
Software 165.0077.78100.0028.5760.0027.27
Software 275.0070.3780.0042.8620.0081.82
Disclaimer/Publisher’s Note: The statements, opinions and data contained in all publications are solely those of the individual author(s) and contributor(s) and not of MDPI and/or the editor(s). MDPI and/or the editor(s) disclaim responsibility for any injury to people or property resulting from any ideas, methods, instructions or products referred to in the content.