Article

Pedestrian Behavior in Static and Dynamic Virtual Road Crossing Experiments

1
Institute for Sustainability and Innovation in Structural Engineering—ISISE, Advanced Production & Intelligent Systems—ARISE, Department of Civil Engineering, University of Minho, 4800-058 Guimarães, Portugal
2
CCG/ZGDV Institute, Campus de Azurém, 4800-058 Guimarães, Portugal
3
Centre of Mathematics, Department of Mathematics, University of Minho, 4800-058 Guimarães, Portugal
*
Authors to whom correspondence should be addressed.
Appl. Syst. Innov. 2024, 7(5), 94; https://doi.org/10.3390/asi7050094
Submission received: 6 June 2024 / Revised: 6 September 2024 / Accepted: 25 September 2024 / Published: 29 September 2024

Abstract

:
Virtual studies involving pedestrians have gained relevance due to the advantage of not exposing them to actual risk, and simulation setups have benefitted from rapid technical advancements, becoming increasingly complex and immersive. However, it remains unclear whether complex setups affecting participants’ freedom of movement impact their decision-making. This research evaluated the effects of a more realistic approach to studying pedestrian crossing behavior by comparing a perception-action task requiring participants to walk effectively along a semi-virtual crosswalk with a similar experiment using static crossing conditions. Using a CAVE system, two real-world streets were modeled in two different virtual scenarios, varying vehicle speed patterns and distance from the crosswalk. Visual stimuli were presented to two groups of 30 participants, with auditory stimuli adapted accordingly. The impact of various factors on participants’ crossing decisions was evaluated by examining the percentage of crossings, crossing start time, and time-to-passage. Overall, the experimental approach did not significantly affect participants’ crossing decisions.

1. Introduction

Several studies have been conducted in the last two decades to determine which factors may influence pedestrian behavior and decision-making during interactions with motorized traffic. For instance, when crossing roads, the approaches are diversified and evolved to better-controlled methods, as can be seen in the literature [1,2,3,4,5,6,7,8,9,10,11,12,13,14,15,16,17,18,19,20,21]. The data collection method arises as a differentiation feature. Generally, the data collection method in these studies fits within one of the following categories: field observations, surveys, semi-controlled experiments, and virtual reality (VR) simulations [13,22,23]. The most commonly used method for collecting data is direct observation of real-life interactions, which typically involves recording videos of the action [24].
Those recordings, however, are limited to the used camera’s field of vision and may fail to capture essential parts of the scene, like the trajectory of approaching vehicles. Other alternatives, such as following the trajectory of pedestrians through GPS instrumentation or Bluetooth/Wi-Fi sensors, also have limitations, such as imprecise location, and they do not allow the collection of data regarding other traffic agents involved in the interaction [14,23]. Surveys are the most often used method to obtain data for qualitative analysis. They are achieved through online or paper questionnaires, face-to-face, or through telephone interviews [25]. While they are a relatively simple way of collecting data, they have the disadvantage of relying on self-assessment of the respondents, which can be strongly biased and fail to accurately portray their actions in real situations. Additionally, they require large samples of participants to produce meaningful data [23]. Semi-controlled experiments usually analyze factors such as gait dynamics and pedestrian spatial organization along predefined paths [26,27,28]. This method has the advantage of partly restricting environment variability, which enables more accurate conclusions to be drawn about the studied phenomena. However, implementing experimental controls in real-world conditions can be difficult from a practical standpoint, even if only partial control is intended.
Concurrently, some experiments have been performed using virtual reality simulators in which the test participant visualizes a crossing situation and must choose between going/not going options by clicking a button, e.g., [29,30,31,32,33], or by actually moving along the virtual crossroad, e.g., [22,34,35,36,37,38]. Simulator-based experiments are complicated by the need for physical space to carry them out, and dependence on expensive equipment. However, they have several advantages compared with similar experiments conducted in the real world. They avoid most hurdles required to ensure participants’ safety in natural environments while allowing more control over experimental conditions and tasks [39]. However, participants are aware that they are part of a virtual study, which might prevent them from fully experiencing risk and could influence their decisions. Some studies have already begun addressing this issue in virtual experiments [40].
VR-based pedestrian crossing simulators can be divided into two categories: those relying on head-mounted displays (HMDs) or the ones using Cave Automatic Virtual Environments (CAVE) technology [34]. Compared to HMD solutions, projection-based simulators allow the participants greater freedom of movement. By using a power-wall configuration and a motion tracking system to project the intended scenario with a perspective adjusted to the physical location of the participant, this type of simulator allows participants to conduct the act of crossing simply by walking, without the use of instruments such as treadmills or joysticks [34].
The fact that participants can move freely should make the simulator more realistic and immersive. Previous research has found that the quality of each simulator is associated with the capacity to induce in the participants the feeling of being present in the virtual environment and not just perceiving it as a digital image [35]. This, in turn, depends on the environment’s realism and the simulator’s usability, which is supported by the quality of the graphical representation, sound, and interaction possibilities.
Still, it is not known if simulations in which the participant can walk have a measurable impact on participants’ decision-making. Thus, the role of participants’ free movement on their decision-making should also be assessed.
The research carried out for this work aimed to compare pedestrians’ crossing behavior using a perception-action task based on data extracted from static and dynamic virtual experiments. This main aim links to the question of the benefits of putting extra effort into performing a more realistic approach in which the participants were required to walk effectively along a semi-virtual crosswalk.
The contributions of the work are not only methodological, introducing dynamic features in the virtual experiments, such as pedestrian movement and spatialized sound, but also behavioral. To reach the main objective, this study assessed how both the noise emitted by approaching vehicles and their movement patterns impact pedestrians’ decision-making when crossing the street. It also examined factors related to vehicle speed and distance and experimental conditions (static and dynamic), which all influence crossing decisions and interactions with vehicles.
Participant diversity and sample size are critical factors in research, especially when exploring human behavior across diverse demographic groups. In this study, efforts were made to include participants from various backgrounds, encompassing different age groups, genders, and cultural contexts. The authors recognize that individuals from different age groups may exhibit distinct cognitive abilities and risk perceptions. For example, younger participants may be more inclined toward risky behavior, while older participants often prioritize safety and caution. Although the authors acknowledge the limitations related to participant diversity and sample size, it is important to note that the sample size, though not large, is consistent with those used in similar studies in the field, as mentioned earlier.
Taking advantage of the ability of the CAVE system to truly isolate the users from the real world and involve them in a traffic environment [39], a comparison was made between previously published results from an experiment conducted with static crossing evaluation conditions [41] and another experiment in which participants were confronted with a dynamic crossing evaluation condition, meaning that the crossing decision was made by walking along the virtual crosswalk.

2. Materials and Methods

2.1. Participants

A sample of 30 adults was recruited from the University of Minho community in Portugal. These participants performed an experiment under a dynamic crossing evaluation condition. Since it aimed to compare two experimental approaches, the static approach and the dynamic approach, data from the static experiment was retrieved from Soares et al.’s [41] study. Thus, the complete sample had 60 participants. Table 1 compares the demographic characteristics of the two participant groups.
Before the experiments, all participants answered a questionnaire regarding their hearing, visual, and mobility conditions. None of them reported any impairing condition. All participants gave their written informed consent. The experiments were conducted following the principles stated in the 1964 Declaration of Helsinki.

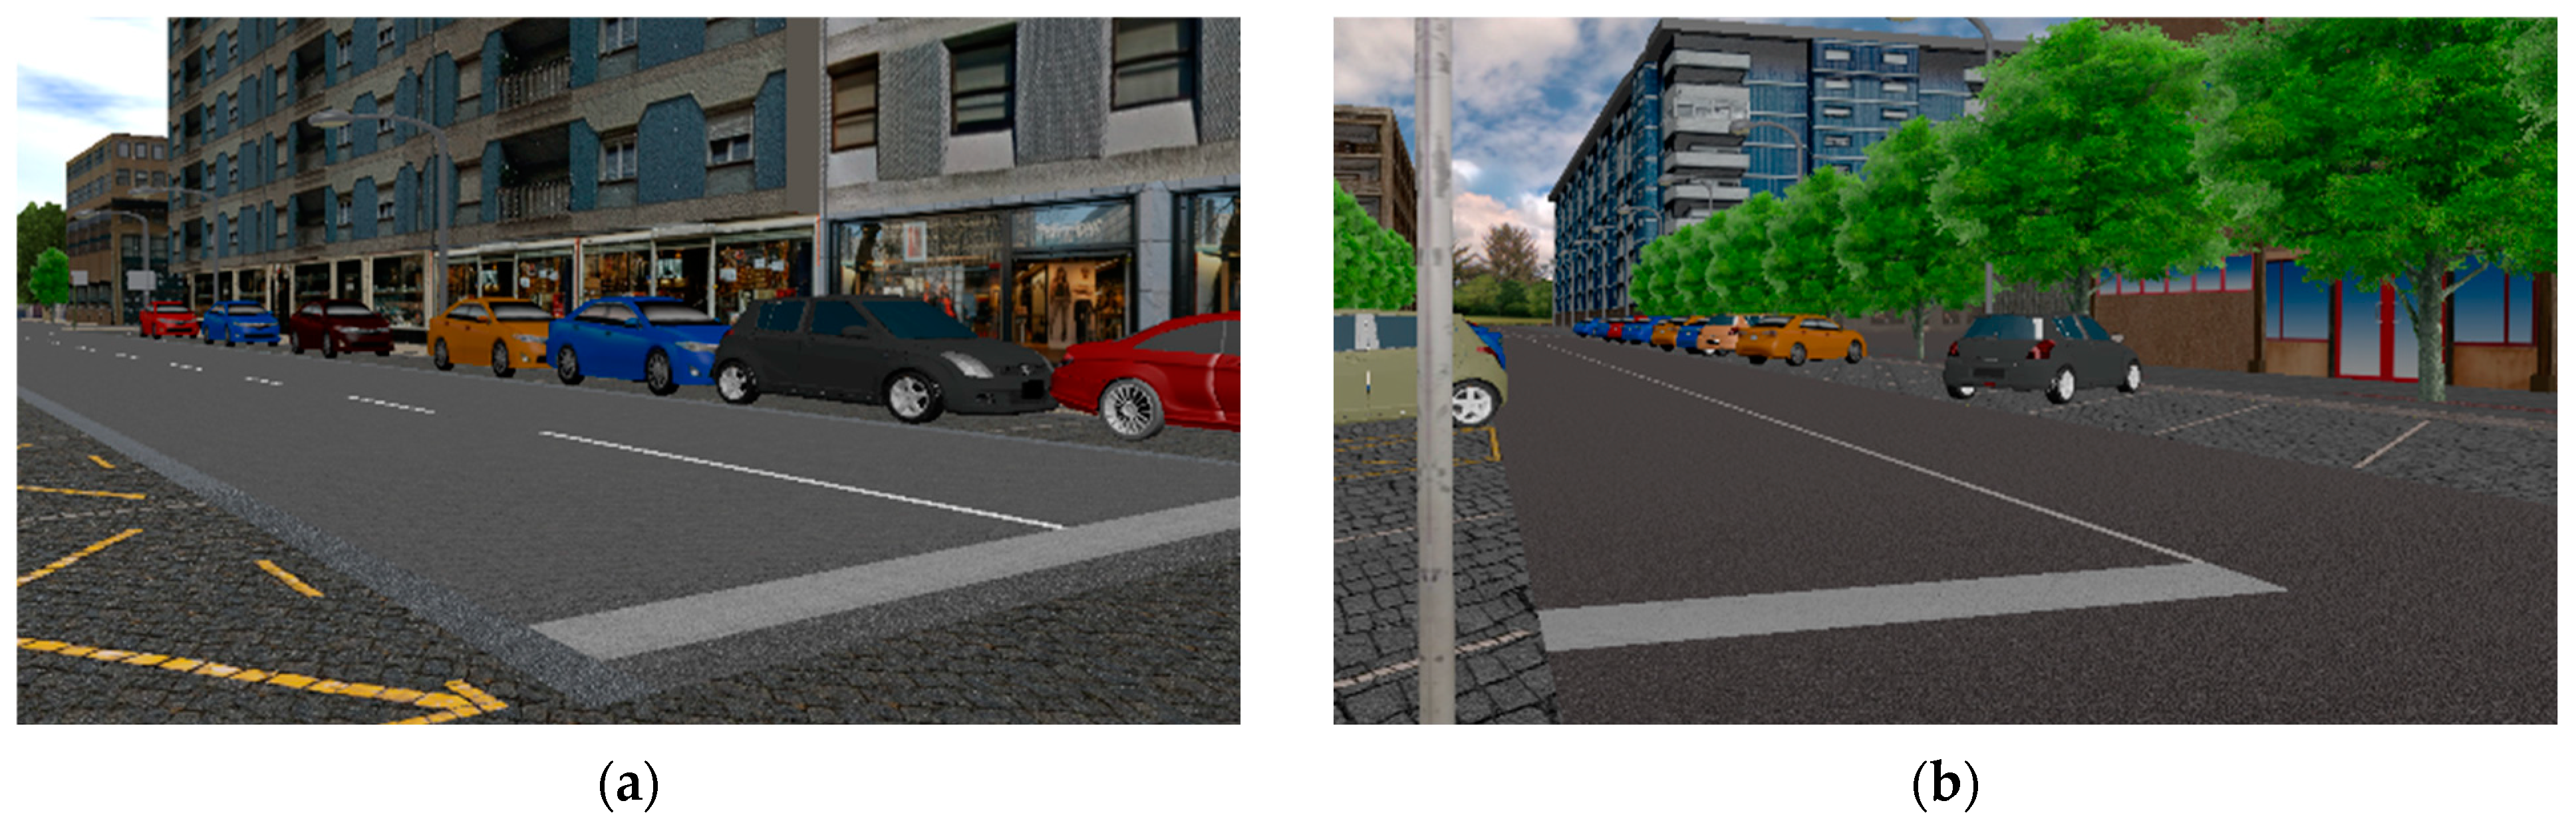
2.2. Virtual Environment

Two real-world streets, 25 de Abril street (25A) in Braga and Teixeira de Pascoais street (TP) in Guimarães, were modeled in two distinct virtual scenarios. The development process for each scenario was similar. Initially, measurements were taken, including the length and width of crosswalks and their markings, road width, sidewalk width, and the dimensions of parking spaces and roads. Next, these scenarios were modeled using Blender 2.79a [42], an open-source 3D computer graphics software that uses Python for scripting. Various architectural details such as buildings, vertical signs, and vegetation were included, and textures for pavements and buildings were added to enhance the realism of the simulation (Figure 1). A similar process was used in previous studies, such as that by Soares et al. [43].
The same two virtual scenarios from previous experimental studies and the method used to model the vehicle’s movement were used in this experiment [41]. It involved the use of the data collected with the analysis of the 2 h video recorded in each one of the streets modeled, clustering the trajectories and speeds into three distinct categories: (i) constant speed; (ii) slow down; and (iii) stop, and defining the characteristics of the movement of the virtual vehicle. The ten conditions considered in this study are described in Table 2.
Regarding the sounds used in the experiments, the vehicle emitted sounds recorded from a Kia Ceed SW with a gasoline combustion engine using the static approach. This vehicle was equipped with ContiEcoContact3 195/65-R15 tires, and the recordings were made using a Brüel and Kjaer pulse analyzer type 3560-C combined with a Brüel and Kjaer Head and Torso Simulator (HATS) Type 4128-C with ear simulators Type 4158-C and 4159-C, as described in Soares et al. [43]. Table 3 displays the main characteristics of the audio stimuli used in the static experimental approach. The term dB(A) associated with the acoustic parameters refers to A-weighted sound pressure levels, which express the relative loudness of sounds as perceived by the human ear. The measurement time represents the duration of the stimuli, in seconds, and the dynamic range is the difference between the maximum and the minimum sound levels. These parameters are relevant to compare with the CPX auralized sounds to guarantee that both sound groups are similar.
Using the dynamic approach, the vehicle emitted auralized sounds acquired through the Close Proximity (CPX) measurements. The CPX acquisitions were simultaneously performed by the Controlled Pass-By (CPB) ones. The mentioned vehicle was instrumented with two Brüel and Kjaer microphones type 4189 mounted on the back-right w heel and linked to the Brüel and Kjaer Pulse Analyzer type 3560-C with an arrangement following the EN ISO 11819-2 [44] descriptions. The signal captured by the CPX microphones was predominantly tire road noise.
The sounds recorded through the CPX method were submitted to an auralization routine that outputs corresponding binaural CPB-like samples. This allowed a subject to hear a sound that appeared to come from the approaching vehicle (that was being observed on the projection screen).
The auralization routine of the CPX captured signal consisted of the analytical formulation of a transfer function that inputs a mono signal and outputs a propagated equivalent binaural signal at an arbitrary far-field point. It started with characterizing a tire-road noise-equivalent source position and power and resulted in an auditory binaural signal plausibly perceived as one emitted by a real vehicle for an arbitrary far-field listener position. For detailed information about the auralization of the CPX sounds, see Pereira et al. [45]. It was applied to simulate the noise emitted by a virtual vehicle approaching a crosswalk.
In this study, the listener position and orientation within the simulator were tracked by a Vicon MoCap system and sent through the BlenderVR add-on to a Max spatial audio processor. Source coordinates were sent from a Blender “virtual world” model, incorporating an animated vehicle trajectory. The auralization routine reacts dynamically to receiver motion and head orientation. Table 4 presents the main characteristics of the stimuli audio component of the static experimental approach. Comparing the values of the acoustic indicators of CPX auralized sounds (Table 4) with those regarding the CPB recordings (Table 3), the differences observed are minimal, validating the auralized sound samples exported by the routine previously described.

2.3. Stimuli

The same visual stimuli were presented to both groups of participants, changing only the auditory ones. The ten conditions were repeated five times for each participant (refer to Table 2). Throughout the experiment, 100 stimuli were presented in a random order (10 movement conditions × 5 repetitions × 2 streets). The 3D virtual model of the approaching vehicle used in the experiment was the Kia Ceed SW (Figure 2).

2.4. Instruments

The projection image is 8 m wide and generated by three DLP Christie Mirage S + 4K projectors with a 1400 × 1050 pixels resolution, placed side-by-side. The scene is projected stereoscopically (participants wear 3D goggles) with a frame rate of 60 fps. A motion tracking system was used to determine the position of tracking points placed on headphones worn by participants. This enabled the capture of the position and orientation of the participants’ heads and the adjustment of the visual scene to match their perspective. CPB and CPX auralized sounds were played synchronously with the corresponding visual stimuli on the headphones using the VLC media player in static and dynamic approaches, respectively. Both approaches amplified the sound through a Sony TA-AV570 Audio Video Amplifier. Acoustic levels were calibrated to match those recorded during the initial sessions. A similar procedure was used in previous studies, such as that by Soares et al. [43].

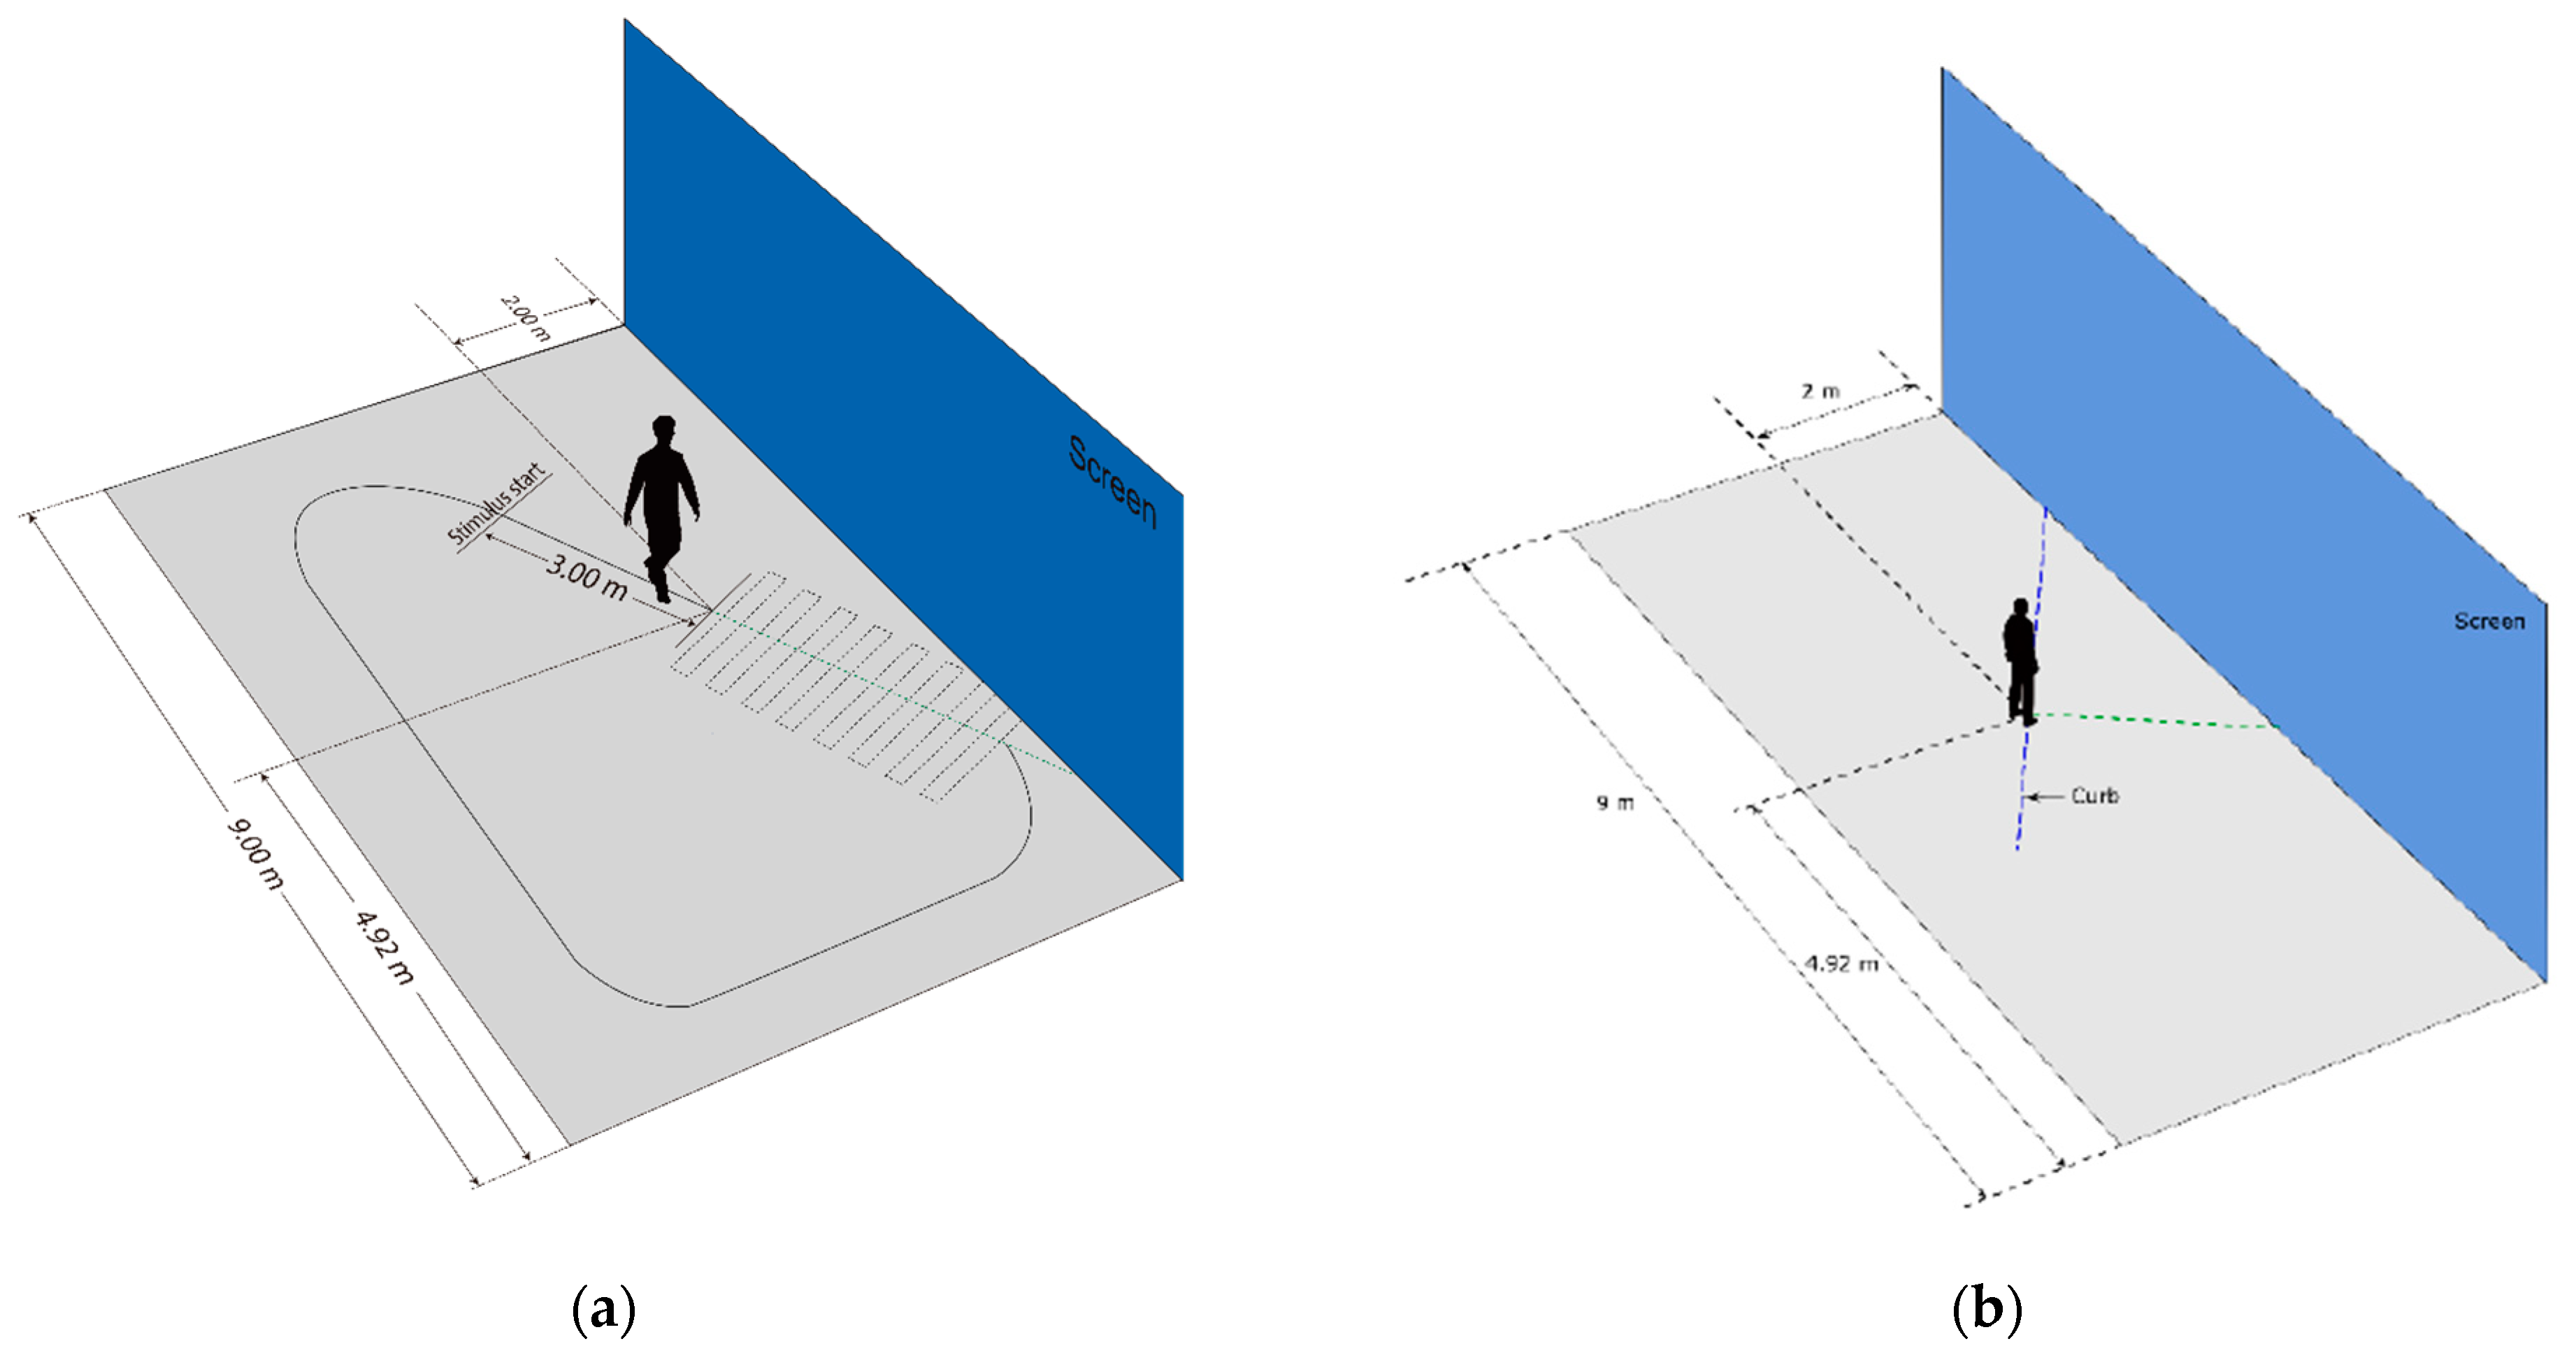
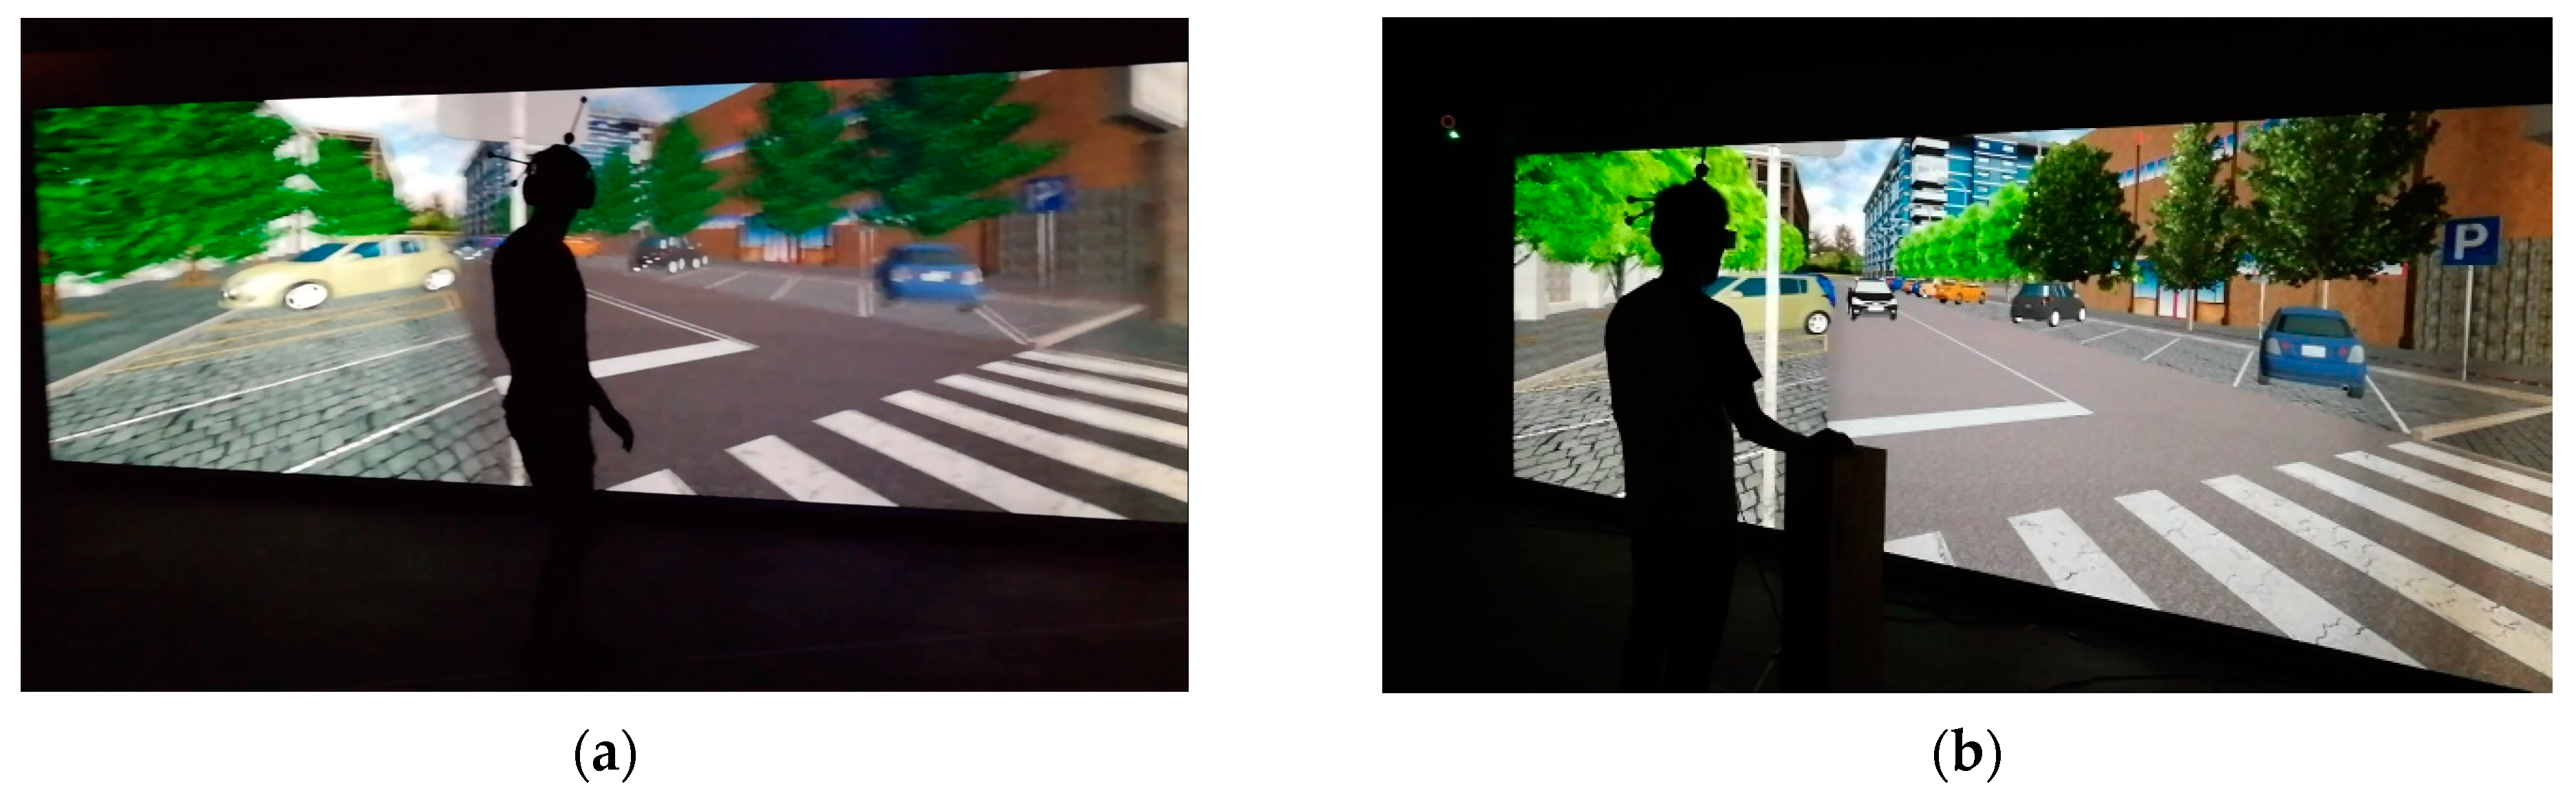
2.5. Experimental Procedure

In the dynamic approach, each participant was placed in a predefined point of the room where they had to start the experiment. The visual scene was rotated 45° with the screen. Participants were instructed to put on the headset and 3D glasses while listening to the instructions and tasked with walking along a predefined circuit around the CAVE room and crossing the virtual crosswalk when they felt safe. If they did not decide to cross during a trial, they were told to wait on the curb for the vehicle to pass by them and then to walk again to complete the circuit into the subsequent trial. Each stimulus was presented when the participant was 3 m away from the curb (see Figure 3a).
For the static procedure, participants were required to stand in front of the screen (wearing the 3D glasses with markers and headphones), with their hands on a mouse placed on a wooden stand. They were asked to avoid moving their head (rotation or translation) to minimize the difference between their position and that of one of the virtual listeners (considering that the CPB sounds were acquired in a static position). The virtual scene was built to ensure that participants were able to see the car from the moment it appeared in the virtual world (no occlusions from other virtual elements). Crossings were only considered valid if the mouse click occurred before the car had entirely stopped or passed by. Figure 4 shows an example of the performance of both experiments.
The participants completed an experimental session of two main blocks, one using the 25A scenario and others using the TP scenario, preceded by a training block composed of 4 stimuli. A gap of 5 min or more (depending on the participant’s will) was included between the two main blocks for resting purposes.

2.6. Analysis

The study analyzed how various variables influenced participants’ decision-making regarding crossing, focusing on the percentage of crossings, crossing start time, and time-to-passage (TTP)—the time until the vehicle reaches the observer’s position.
The percentage of crossings for each participant was calculated by assuming that: (i) in the static approach, a decision to cross was considered to have occurred in the trials in which the computer mouse was clicked before the vehicle had stopped or passed by the participants’ position; and, (ii) in dynamic approach, a decision to cross was considered to have happened in the trials in which the participants crossed the half-length of the semi-virtual crosswalk before the vehicle stopped or passed in front of them. Since the participant’s task was to cross the virtual road effectively, counting the number of crashes in the dynamic approach (contrary to the static approach) was possible. The crossing start time, corresponding to the time from the beginning of the stimulus presentation until the moment when the participant clicked the mouse or took the first step on the crosswalk, was also registered.
A three-way repeated measures ANOVA was used to assess the influence of the experimental approach, vehicle initial speed, vehicle speed pattern, and vehicle initial distance on the percentage of crossings. Additionally, mixed-effects regression models were employed to evaluate the crossing start time and TTP, with random effects included for the participant and fixed effects defined for the abovementioned variables. The adoption of LMMs was justified by the presence of missing values in the data, matching to trials in which participants did not cross. A similar analysis was conducted in previous research [41].
Statistical analysis of pedestrian behavior in observational or experimental studies presents challenges due to its inherent complexity. LMMs offer a comprehensive and flexible approach, making them particularly effective for longitudinal or complex shared data. They are adept at addressing issues such as missing and skewed data, allowing researchers to identify meaningful relationships within the data.
When applied to the analysis of pedestrian behavior, LMMs provide sophisticated statistical tools that offer insights into the complex interactions between pedestrians and their environment. These models enable researchers to account for correlated data structures, handle non-normally distributed outcomes, and capture intricate relationships between predictors and pedestrian behavior.
The analysis of the results was done in two stages: in the first stage, the conditions characterized by constant speed patterns were analyzed, since, only in these cases, there was a variation of the vehicle’s initial distance. In the second stage, the data regarding all speed patterns were analyzed, considering only the conditions with 30 m of initial distance for the constant speed trials. In this way, it was ensured that the analysis of the vehicles’ speed patterns’ effect on the participants’ responses was carried out under equal conditions.

3. Results

3.1. Constant Speed Patterns

Figure 5 and Figure 6 illustrate the overall distribution of the data across participants and conditions. In these figures, the circle’s position along the axis represents the mean response time, while the size of the circle indicates the number of crossings. Additionally, the line depicted shows the standard error of the mean. Participants are vertically arranged based on their mean crossing start time. In general, with few exceptions, the participants took more time to start to cross in the dynamic approach than in static, irrespective of the condition. Table 5 and Table 6 summarize the descriptive statistics by condition, in terms of percentage of crossings and crashes, crossing start time, and TTP, to complement the information presented in the following figures.

3.1.1. Percentage of Crossings

A three-way repeated-measures ANOVA was conducted to examine the percentage of crossings with intra-subject variables vehicle initial distance (3) and vehicle speed (2), and the inter-subject variable experimental approach (2), as factors (see Figure 7). The experimental approach did not significantly influence the participants’ percentage of crossings F(1, 58) = 0.07, η2 = 0.01, p = 0.79. The main effect of vehicle speed was observed, F(1, 58) = 116.21, η2 = 0.67, p < 0.01, with values higher for the 20 km/h condition compared to the 30 km/h condition. The main effect of vehicle initial distance was also observed, F(2, 116) = 90.99, η2 = 0.61, p < 0.01, with post hoc tests revealing that the percentage of crossings increased significantly with the initial distance (p < 0.01).
A significant interaction of speed × initial distance was also found, F(2, 116) = 49.74, η2 = 0.46, p < 0.01. A post hoc comparison between initial distances and each level of speed revealed that, for 20 km/h, significant differences were observed between the distance levels (25 m/30 m: p < 0.01, 25 m/35 m: p < 0.01, 30 m/35 m: p = 0.01). For 30 km/h, significant differences were only found between 25 and 35 m (p = 0.04). The experimental approach × initial speed and experimental approach × initial distance interactions were also significant, F(1, 58) = 4.79, η2 = 0.08, p = 0.03, and F(2, 116) = 9.21, η2 = 0.14, p < 0.01, respectively.
The Bonferroni post hoc tests conducted to compare each level of speed within the experimental approaches revealed significant differences between the percentage of crossings regarding the initial speeds of 20 and 30 km/h in both experimental approaches, static (p < 0.01) and dynamic (p < 0.01). In turn, in the dynamic approach, there were significant differences between the percentage of crossings regarding all the initial distances (25 m/30 m: p < 0.01, 25 m/35 m: p < 0.01, 30 m/35 m: p < 0.01). The static experiment verified the same (25 m/30 m: p < 0.01, 25 m/35 m: p < 0.01, 30 m/35 m: p = 0.05).
The experimental approach × speed × initial distance interaction also had a significant effect on the percentage of crossings, F(2, 116) = 12.79, η2 = 0.18, p < 0.01. Bonferroni post hoc tests were conducted, comparing the experimental approaches within each level of speed with each level of initial distance. Only when the vehicle approached the crosswalk at 20 km/h and from 35 m was the percentage of crossings significantly higher for the dynamic approach than for the static one (p < 0.01).
In both experimental approaches, participants tended to cross more frequently when the vehicle speed was lower and its initial position was distant from the crosswalk. At 20 km/h, the increase in distance resulted in greater growth of the crossings percentage, which was even more evident in the participants’ responses who performed the dynamic experiment (see Figure 7). However, these percentages do not mean properly safe crossings.
One advantage of the dynamic approach was that it allowed for identifying the occurrence of crashes. Considering the values presented in Table 5, it is possible to note that a considerable portion of the crossings made by participants resulted in a crash, particularly when the vehicle approached at 20 km/h from the shorter distance and 30 km/h from 30 m.

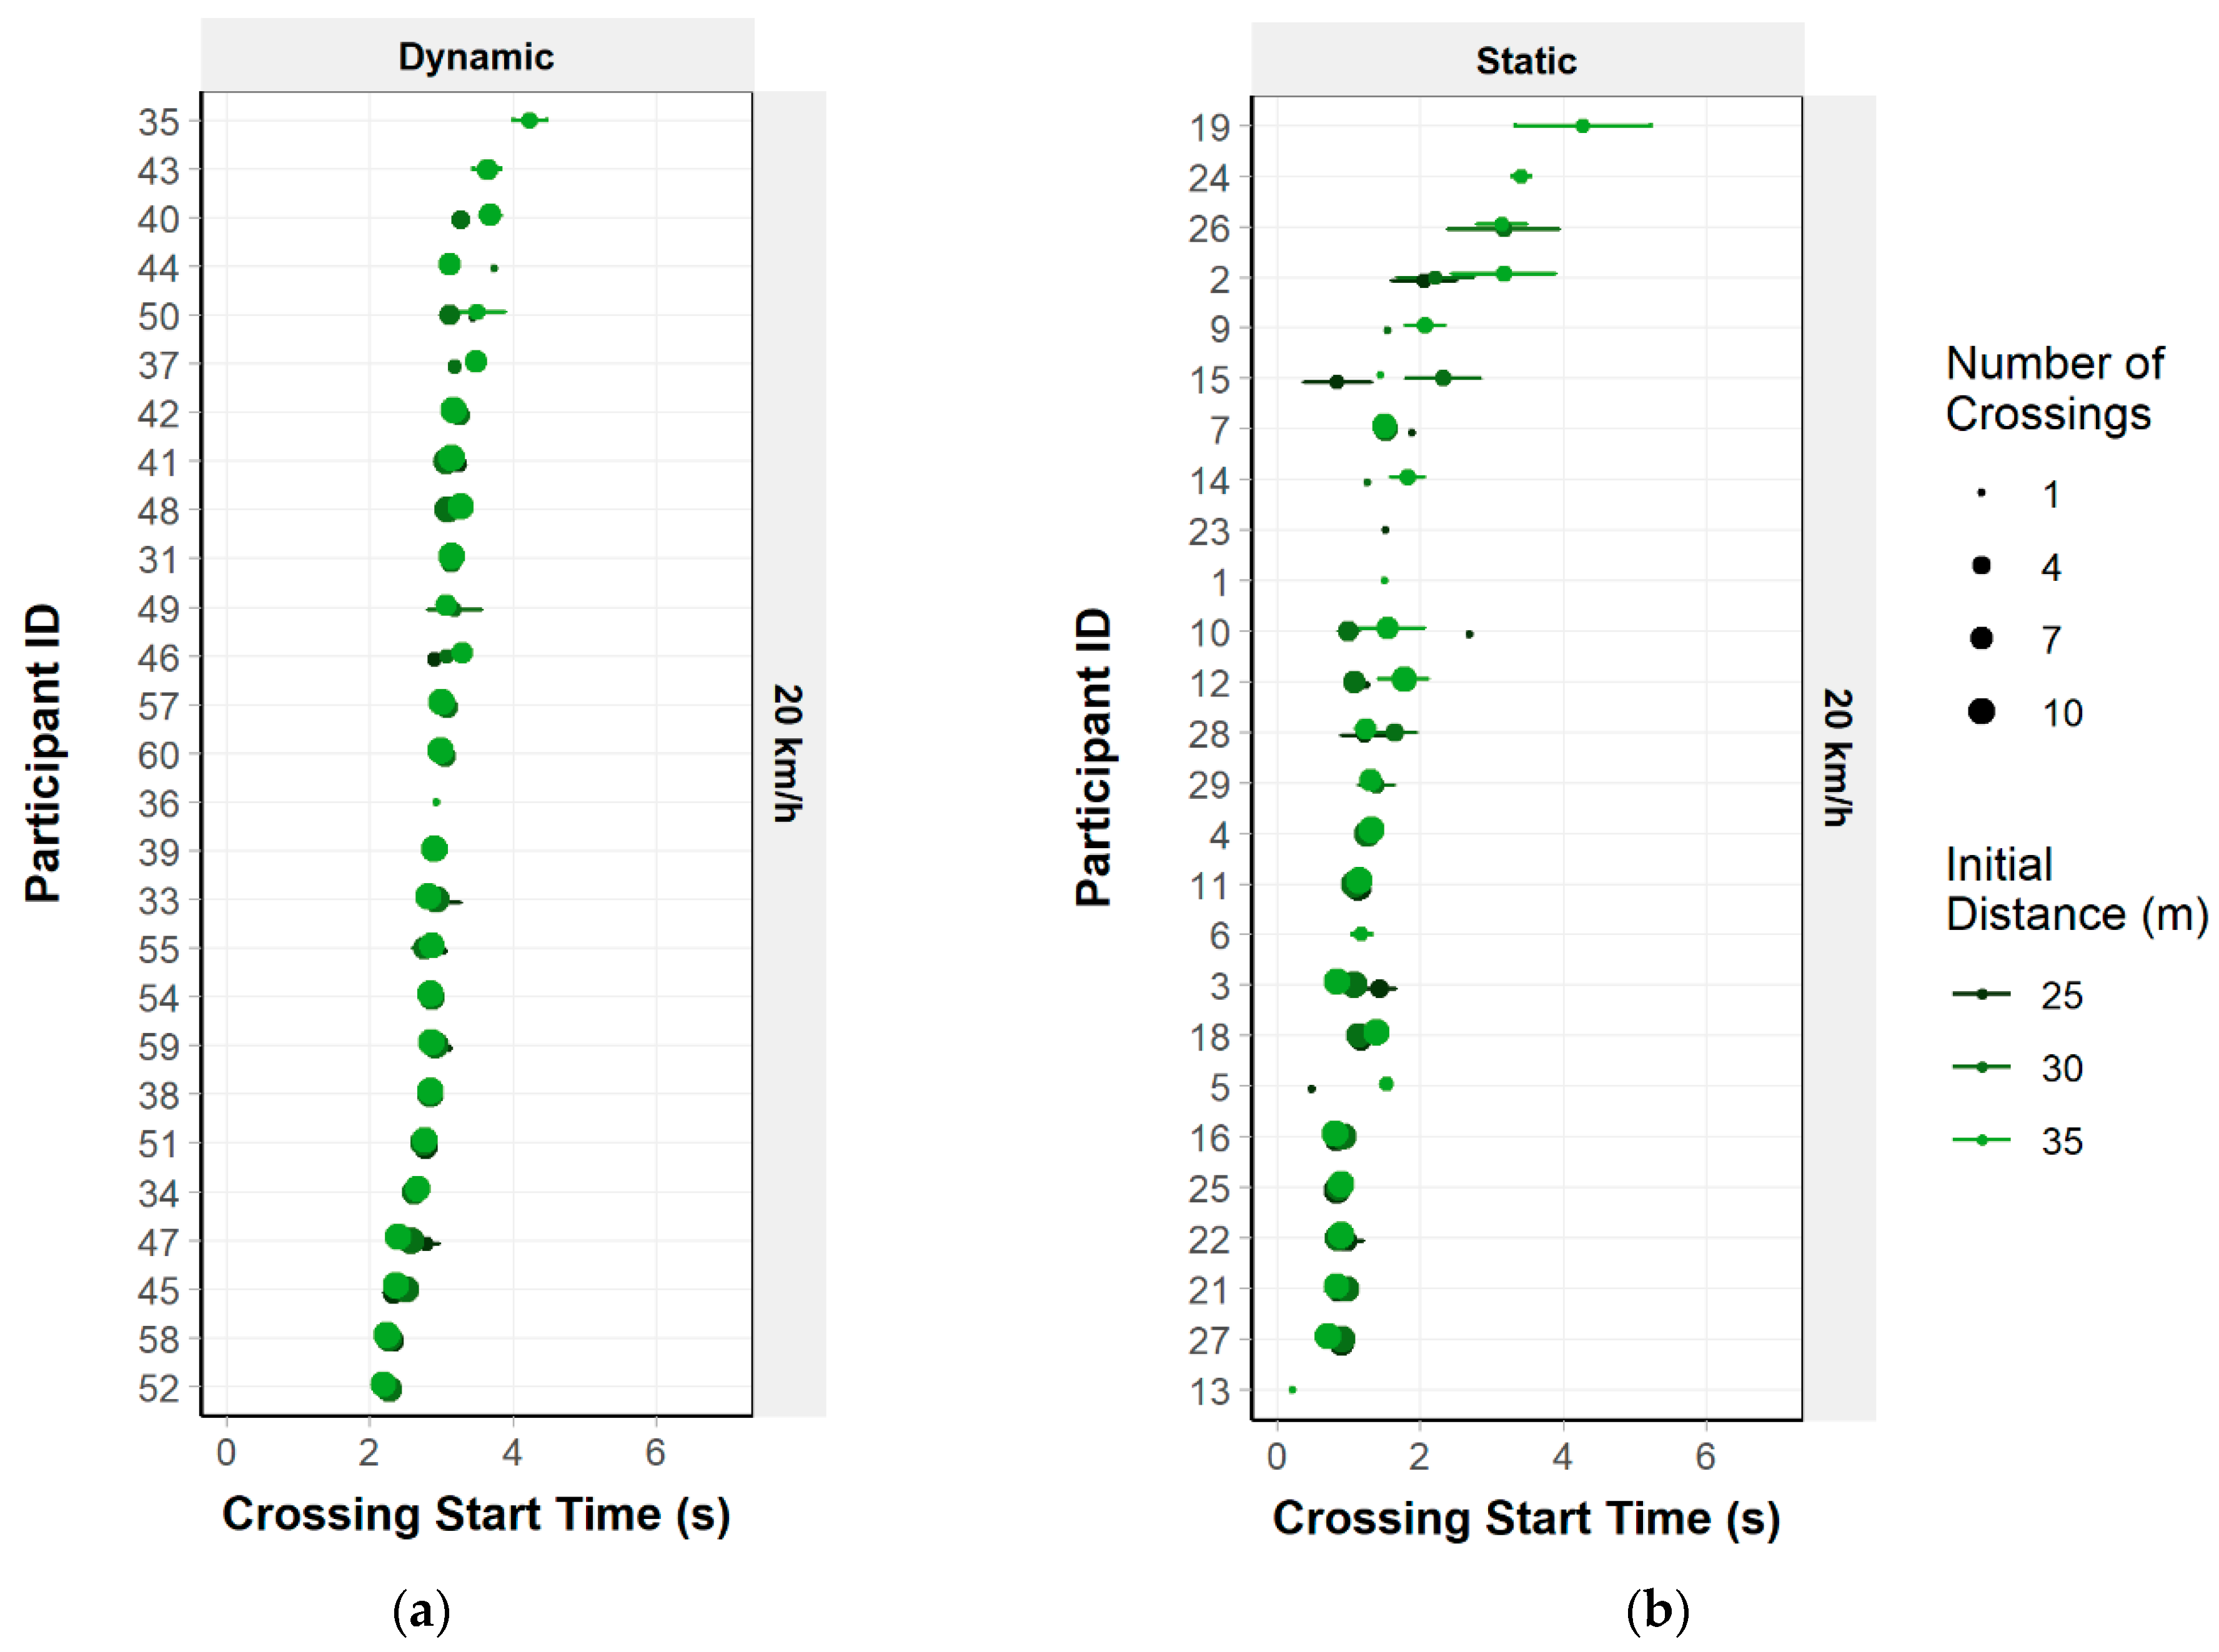
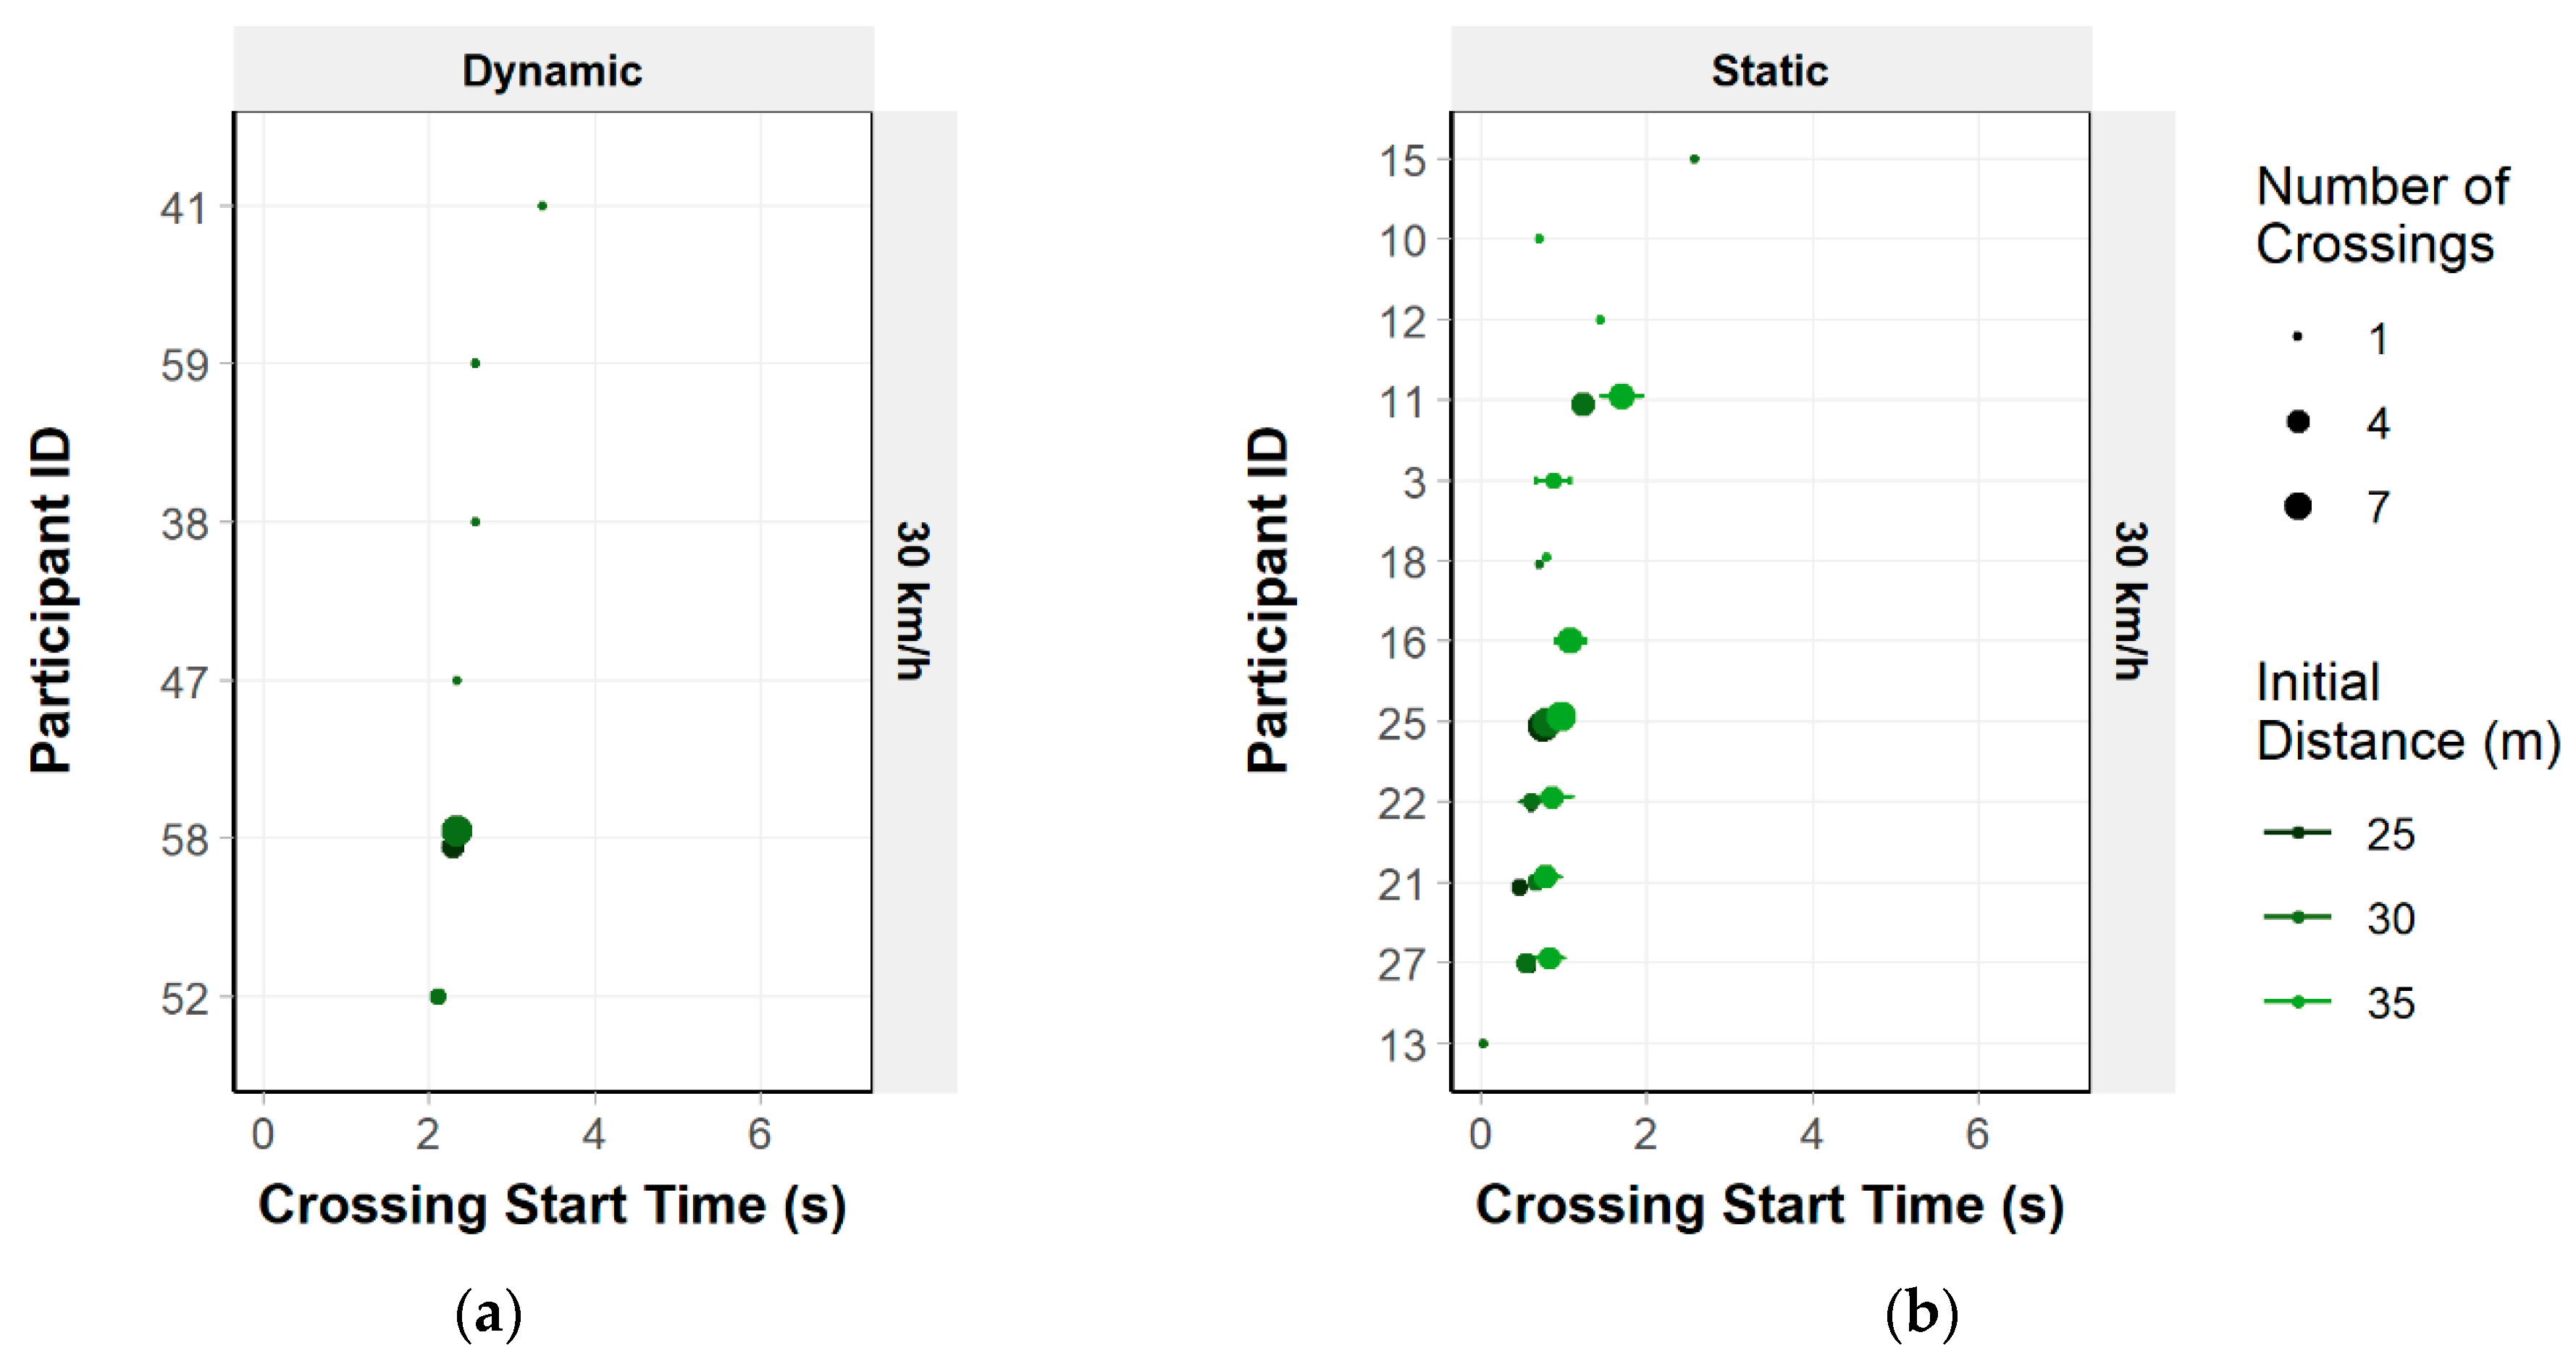
3.1.2. Crossing Start Time

A visual inspection of the residual plots revealed deviations from homoscedasticity and skewness of crossing start time distribution, so the model considered to analyze this variable was fitted by applying a logarithmic transformation to the crossing start time, which corrected the deviations. This way, an LMM of the log (crossing start time) with random effects included for the participants and fixed effects for the initial speed, initial distance, and experimental approach was fitted. Satterthwaite’s tests showed significant effects of the experimental approach, F(1, 53.08) = 46.40, p < 0.01, and initial speed, F(1, 790.60) = 3.77, p = 0.05. There was no effect from the initial distance, nor from any interaction between the considered variables.
Participants in the static approach were quicker to start the crossing than in the dynamic approach, b = −0.90, t(58.79) = −6.57, p < 0.01. When the vehicle approached the crosswalk at 30 km/h, participants started to cross sooner, b = −0.24, t(789.50) = −2.11, p = 0.04. Considering these results and Figure 8, which shows the crossing start time as a function of vehicle initial distance, initial speed, and experimental approach, it is noticeable that the participants’ decisions to cross tended to be faster at the highest speed and when they had not walked to perform the crossing task.

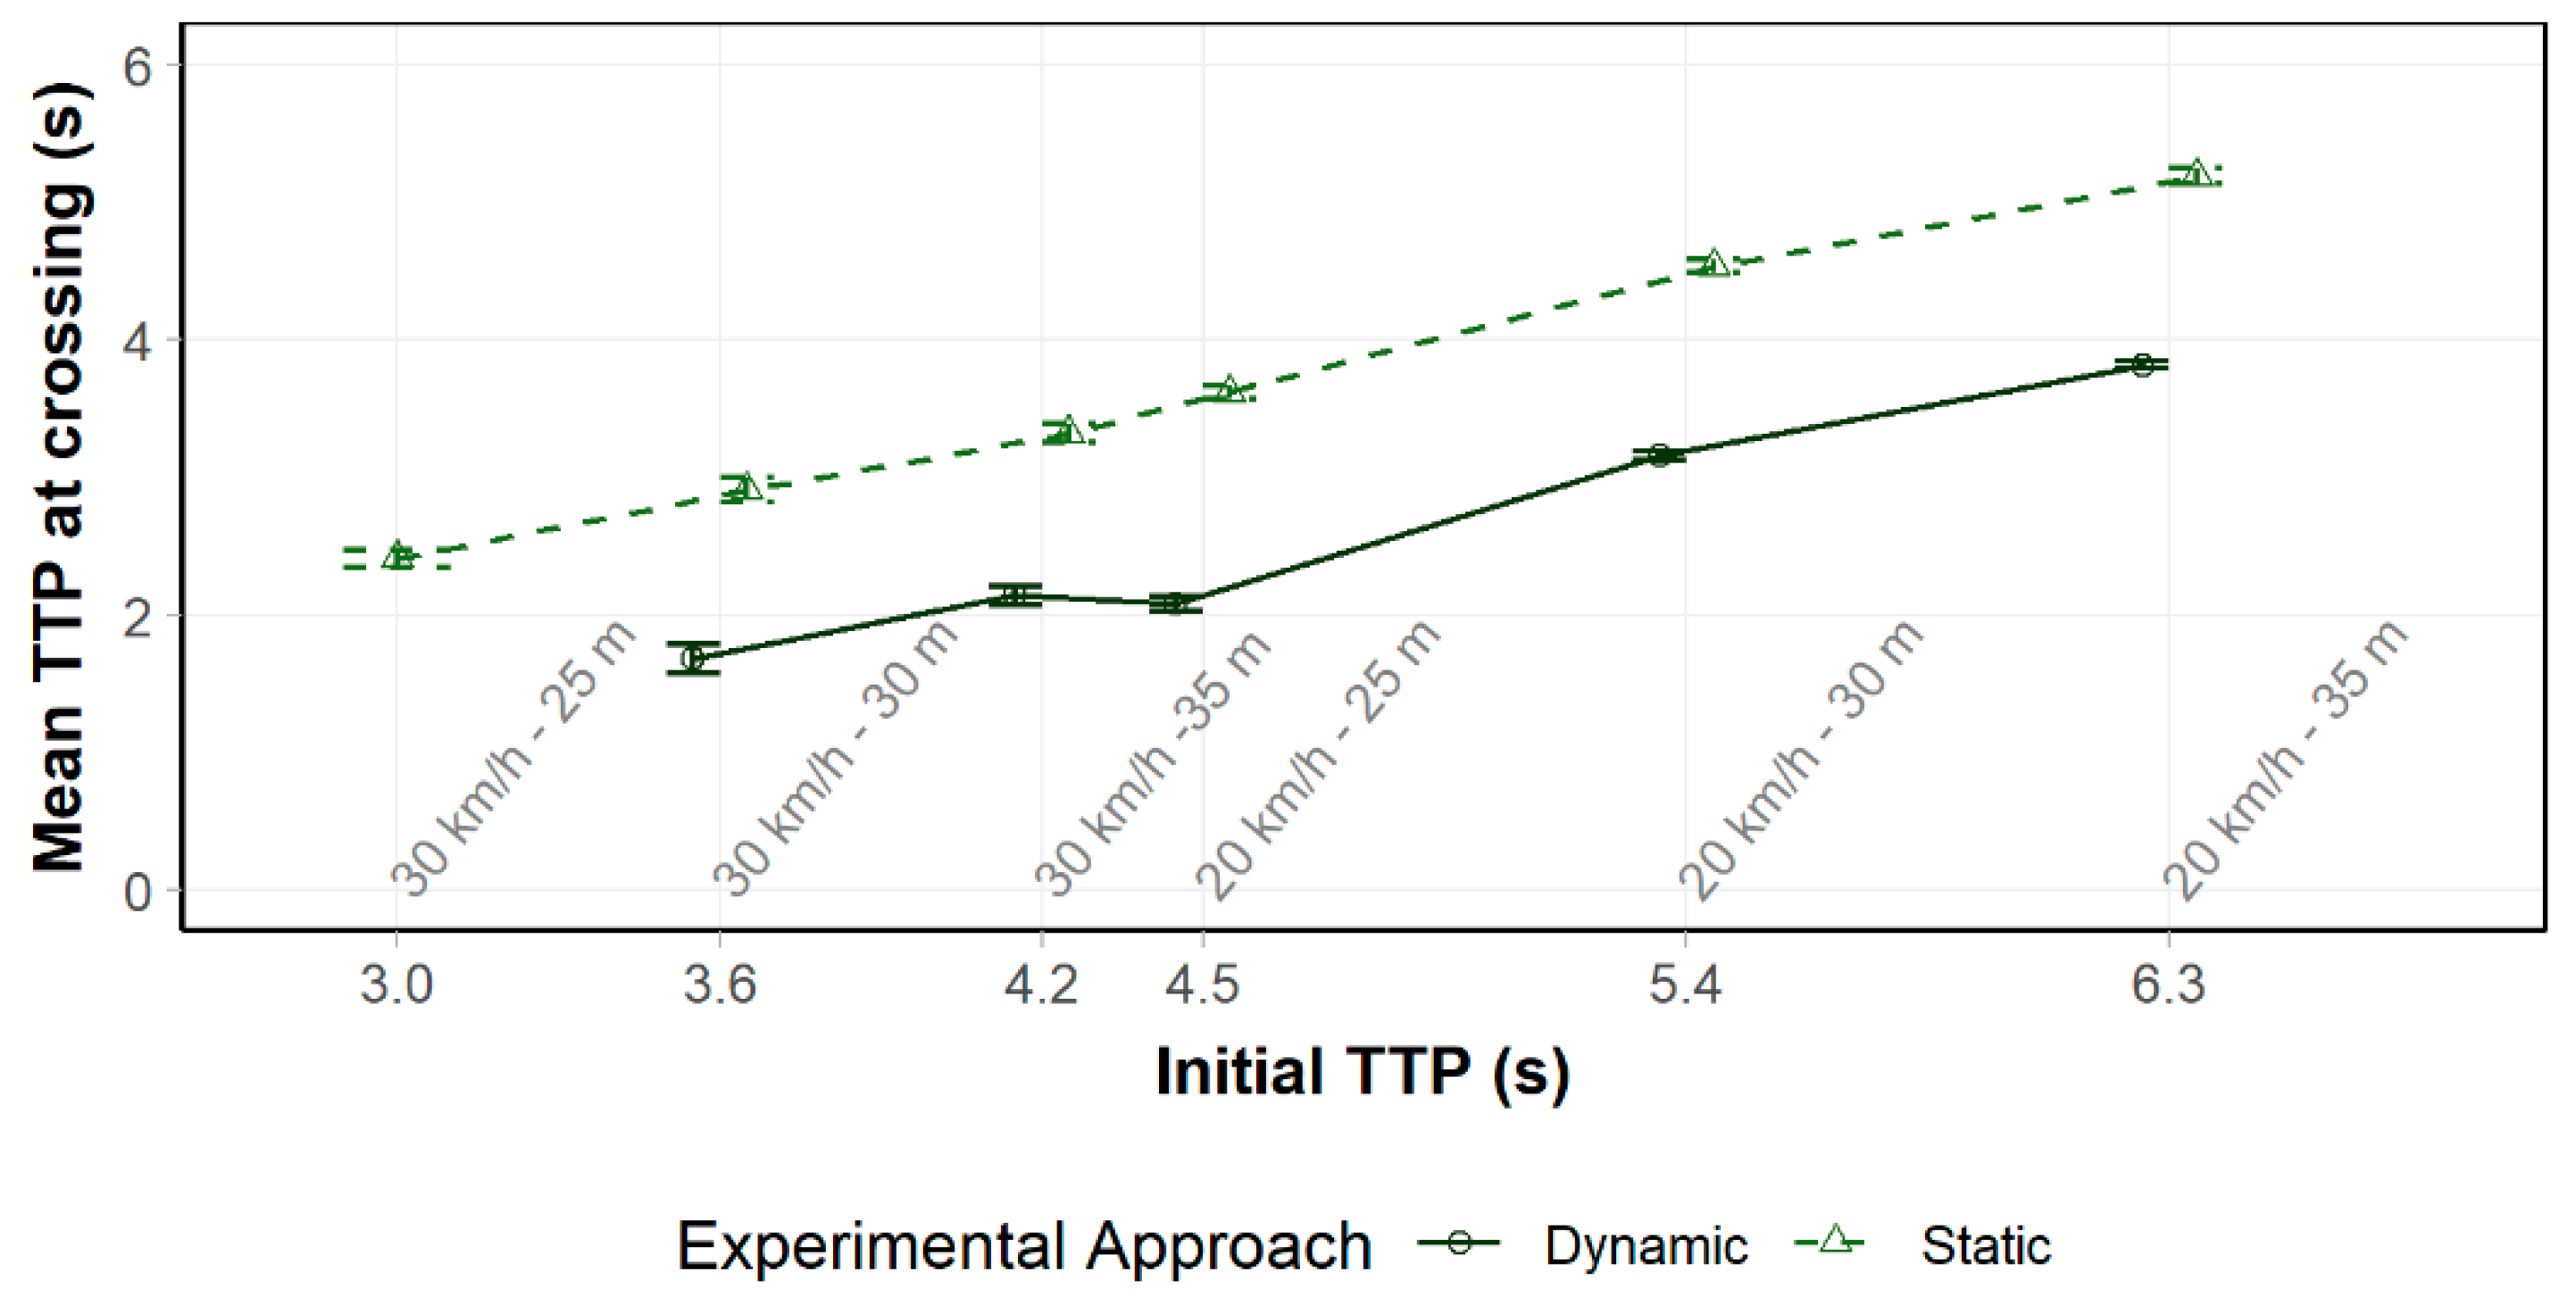
3.1.3. Time-to-Passage

The TTP at the crossing moment appears to vary linearly with the initial TTP (when the vehicle appears), particularly for the results of the static experiment. This can be explained by the overall slight variations in the crossing start time (Figure 9).
Nevertheless, as one can see in Table 5, in the dynamic experiment, there were considerable percentages of crashes, particularly for the speed of 20 km/h with the vehicle starting its movement 25 m before the crosswalk and for the speed of 30 km/h from the initial distance of 30 m.

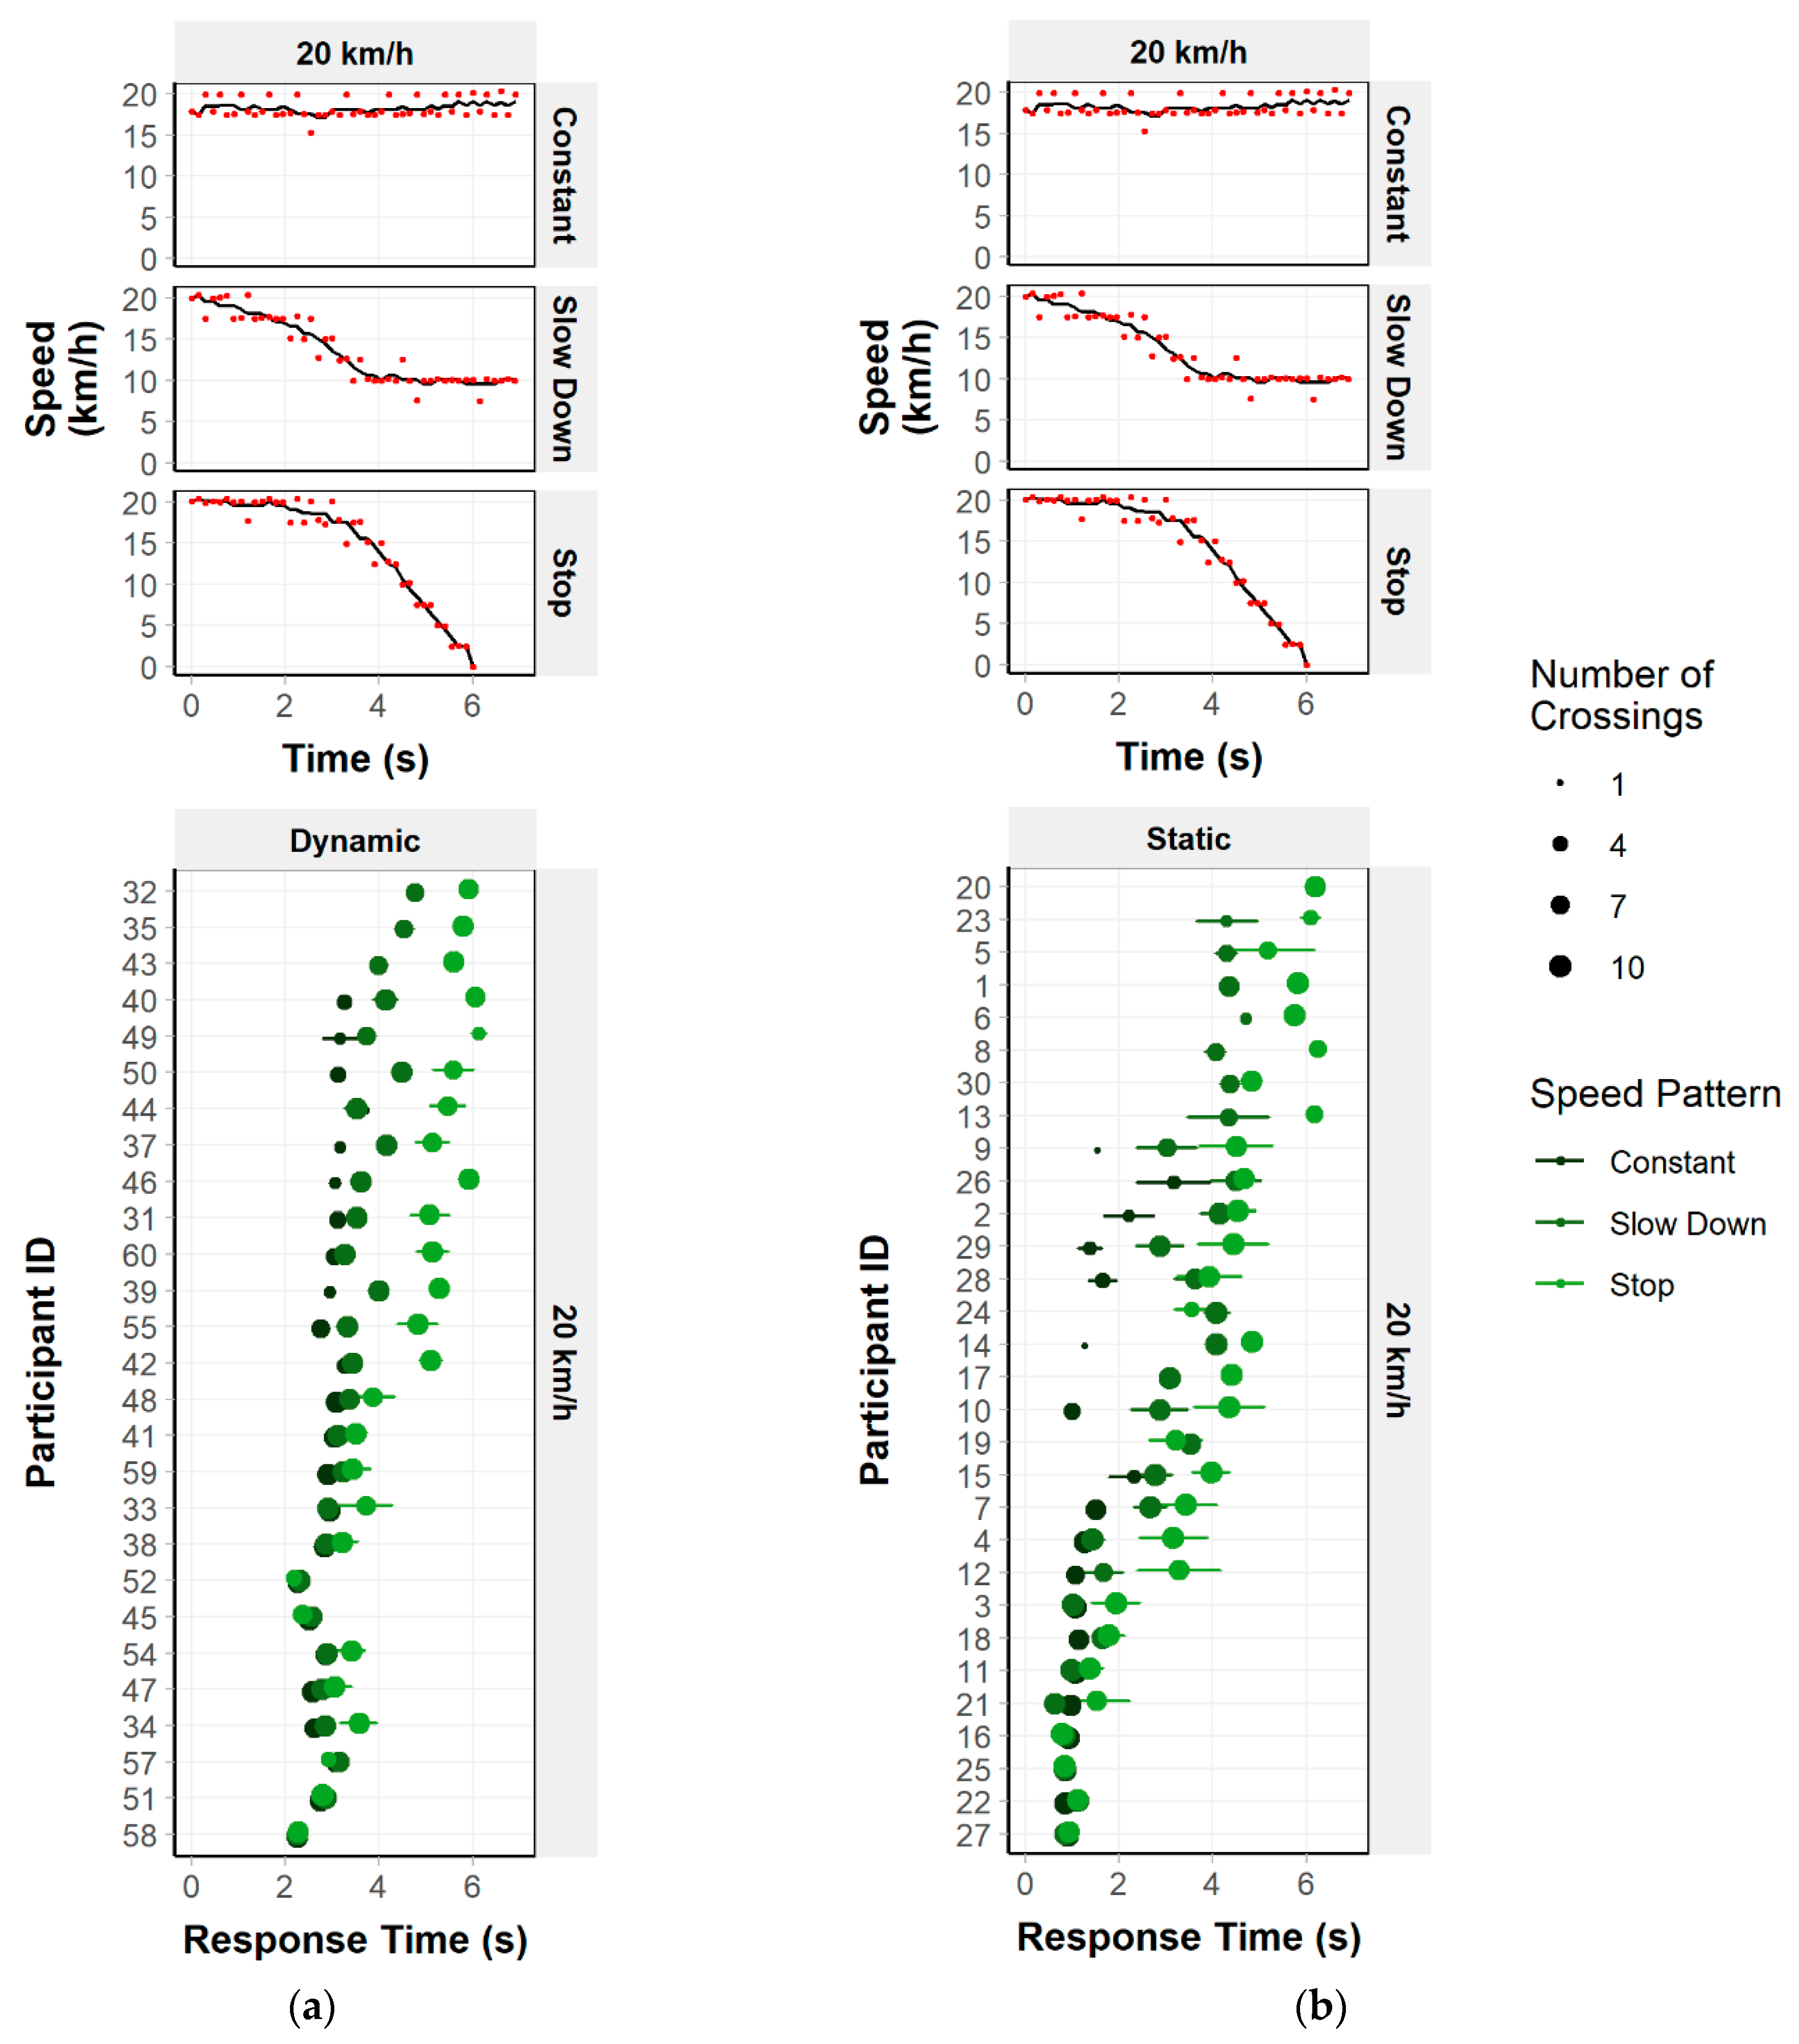
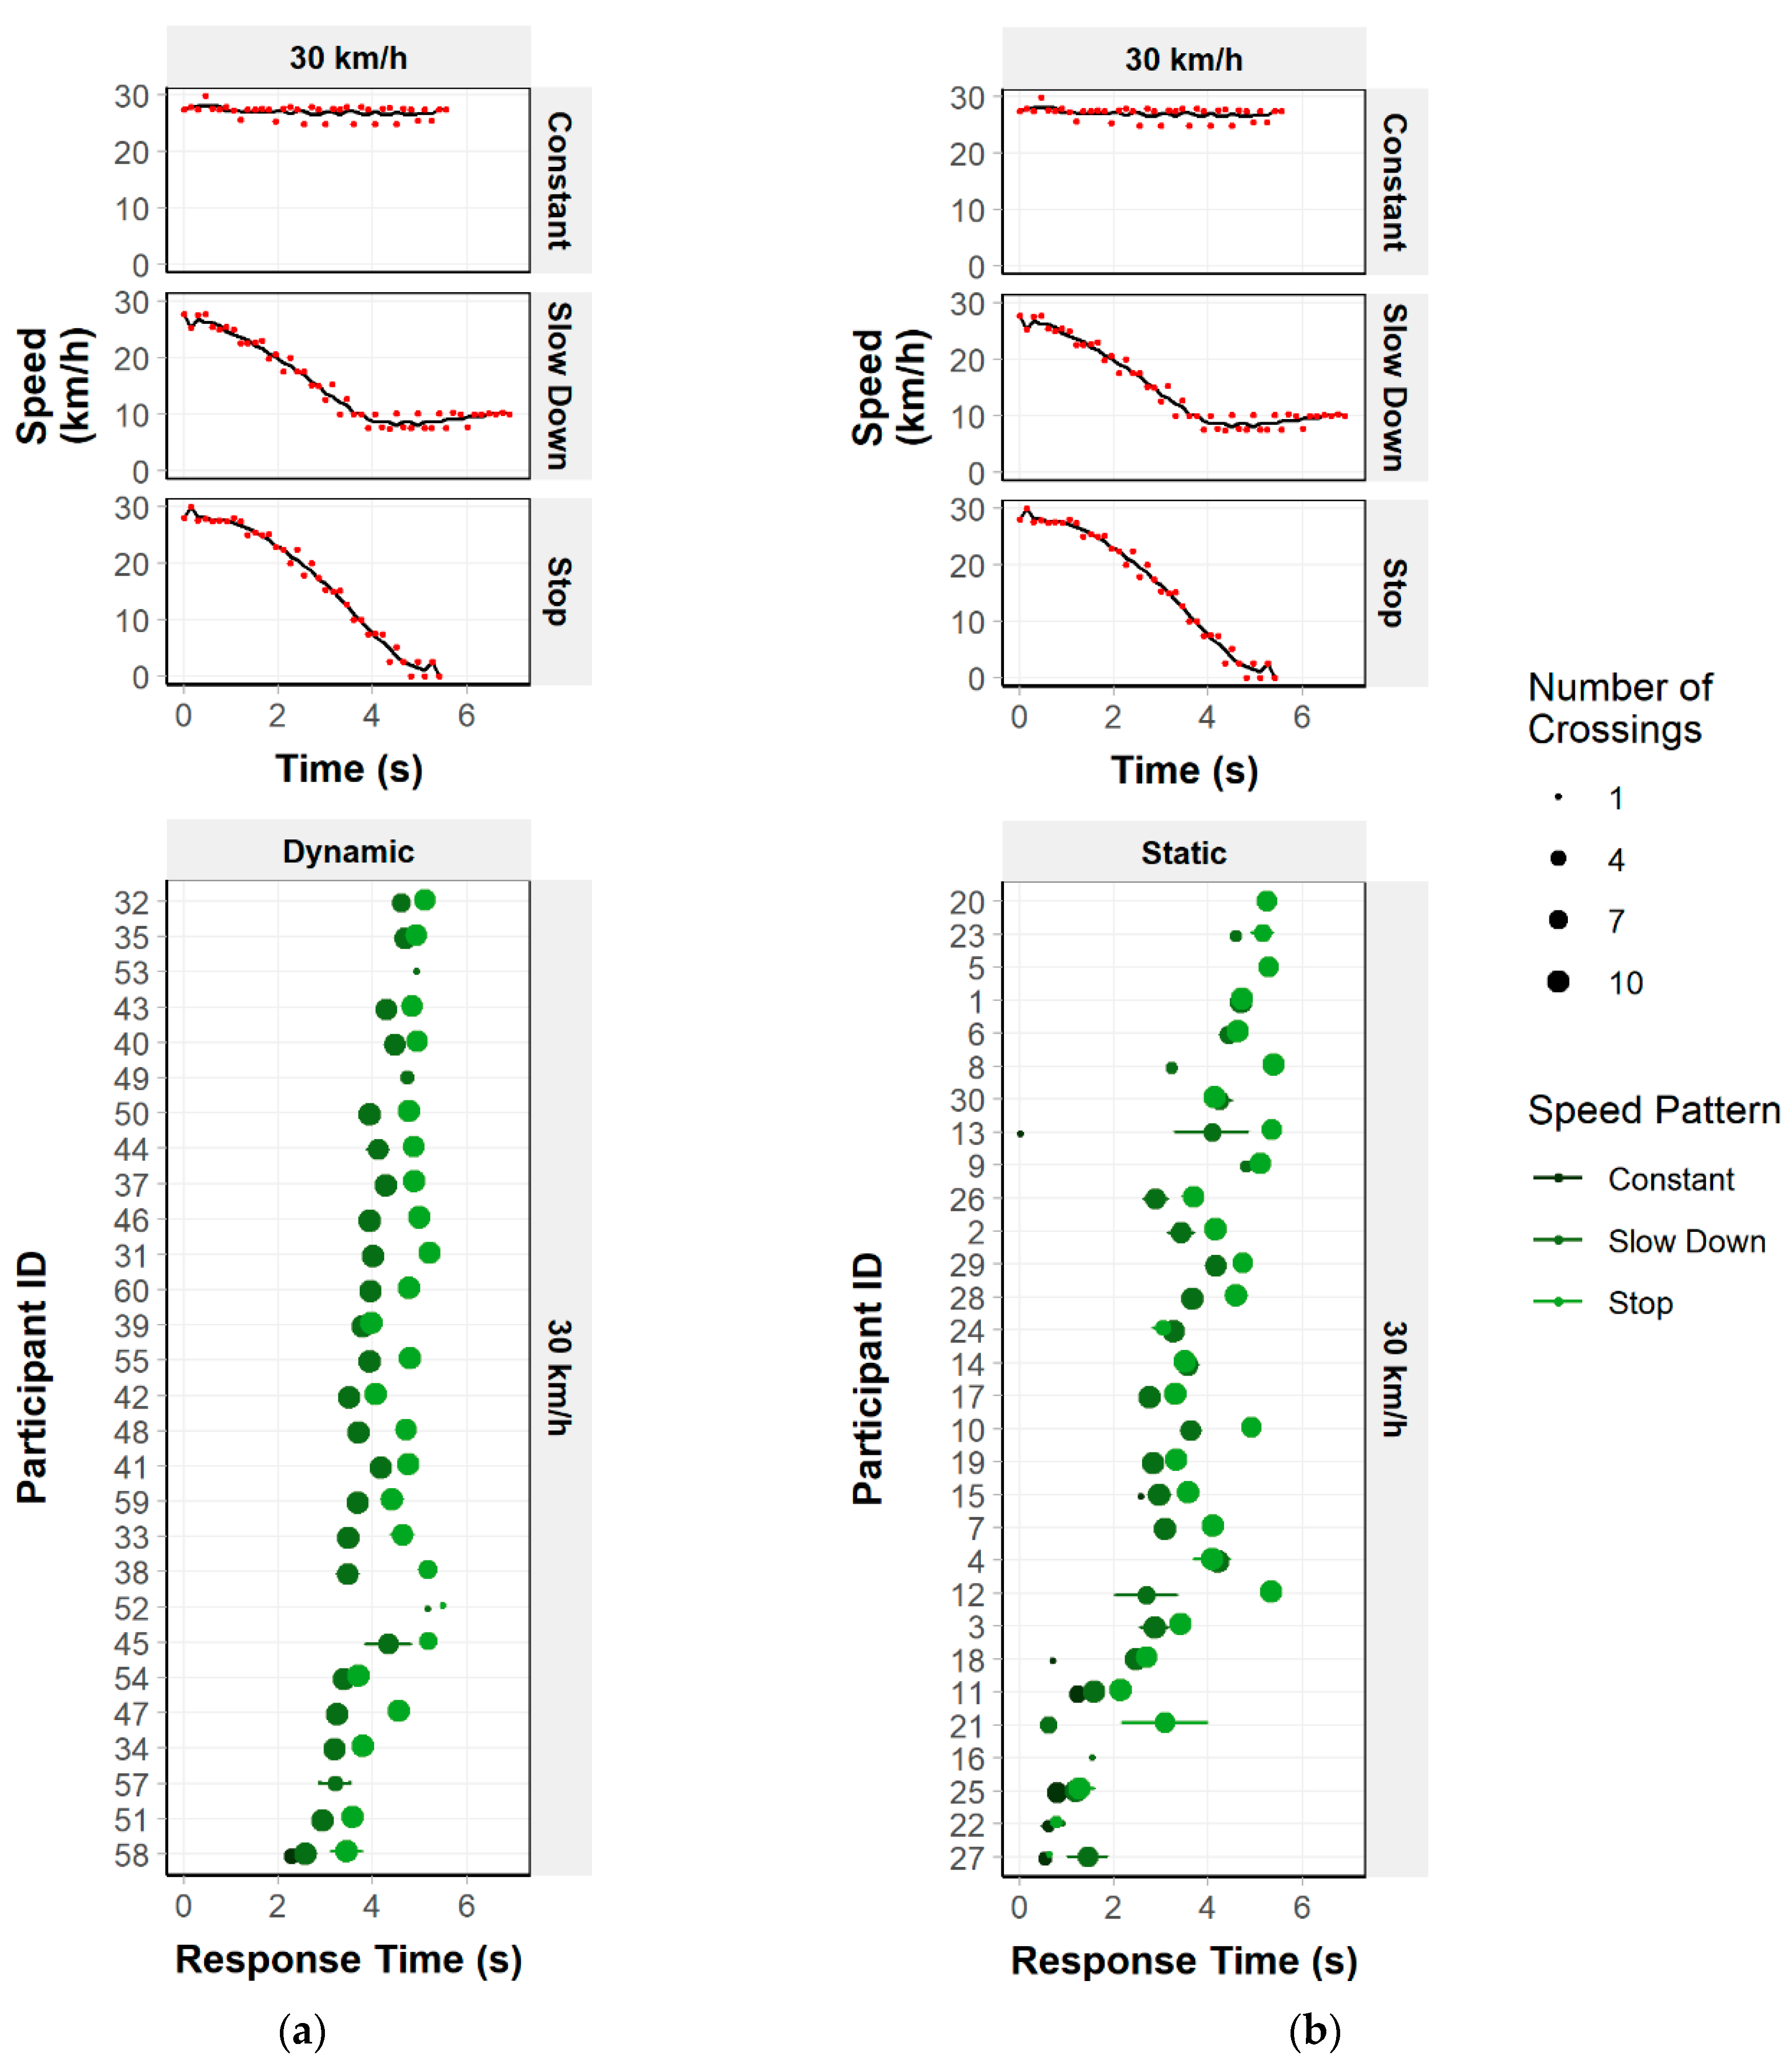
3.2. Different Speed Patterns

Figure 10 and Figure 11 show the crossing data for each participant and condition, as well as the speed profile of the vehicle. The circle’s location along the axis represents the mean crossing start time, the size of the circle depicts the crossing number, and the line indicates the standard error of the mean. It is possible to note in both experimental approaches that the crossing number increases considerably for the slowing down and stopping patterns, and is particularly more evident in the dynamic approach.
Table 7 and Table 8 show the summary of descriptive statistics for the condition in terms of the percentage of crossings and crashes, crossing start time, and TTP regarding the different speed patterns.

3.2.1. Percentage of Crossings

The percentage of crossings was also examined through a three-way repeated-measures ANOVA. The initial speed, vehicle speed pattern, and the experimental approach were the considered factors. Some main effects were found for the initial speed, F(1, 58) = 41.82, η2 = 0.42, p < 0.01, and speed pattern, F(2, 116) = 146.18, η2 = 0.72, p < 0.01, but not for the experimental approach F(1, 58) = 0.03, η2 < 0.01, p = 0.87. A significant effect for the initial speed × speed pattern interaction was also found, F(2, 116) = 49.33, η2 = 0.46, p < 0.01.
Post hoc tests using Bonferroni were conducted to compare the different speed patterns and the initial speed within the speed profiles. In general, there was a significant increase in the crossing percentage from constant to slowing down (p < 0.01) and from constant to stopping (p < 0.01), but not from slowing down to stopping (p = 1.00). Contrasts within each speed pattern show differences involving 20 and 30 km/h for the speed constant (p < 0.01) and for slowing down (p = 0.03) but not for stopping (p = 0.28).
The experimental approach × speed pattern × initial speed interaction also had a significant effect on the percentage of crossings, F(2, 116) = 4.72, η2 = 0.08, p = 0.01. Bonferroni post hoc tests which were conducted to compare the initial speed within the experimental approaches with each speed pattern showed that only in the dynamic approach and in constant speed patterns (p < 0.01), and in the static approach in constant (p < 0.01) and slowing down patterns (p = 0.04), there were significant differences in the percentage of crossings when compared with both initial speeds.
The results indicate that participants crossed significantly more when the vehicle slowed down or stopped (see Figure 12). They also showed that the participants crossed more when the vehicle approached at 20 km/h than at 30 km/h. Still, this difference was only significant when the vehicle approached at a constant speed or slowed down. Importantly, no differences were found between experimental approaches in the participants’ crossing decision when comparing the different vehicle speed patterns of approach to the crosswalk.

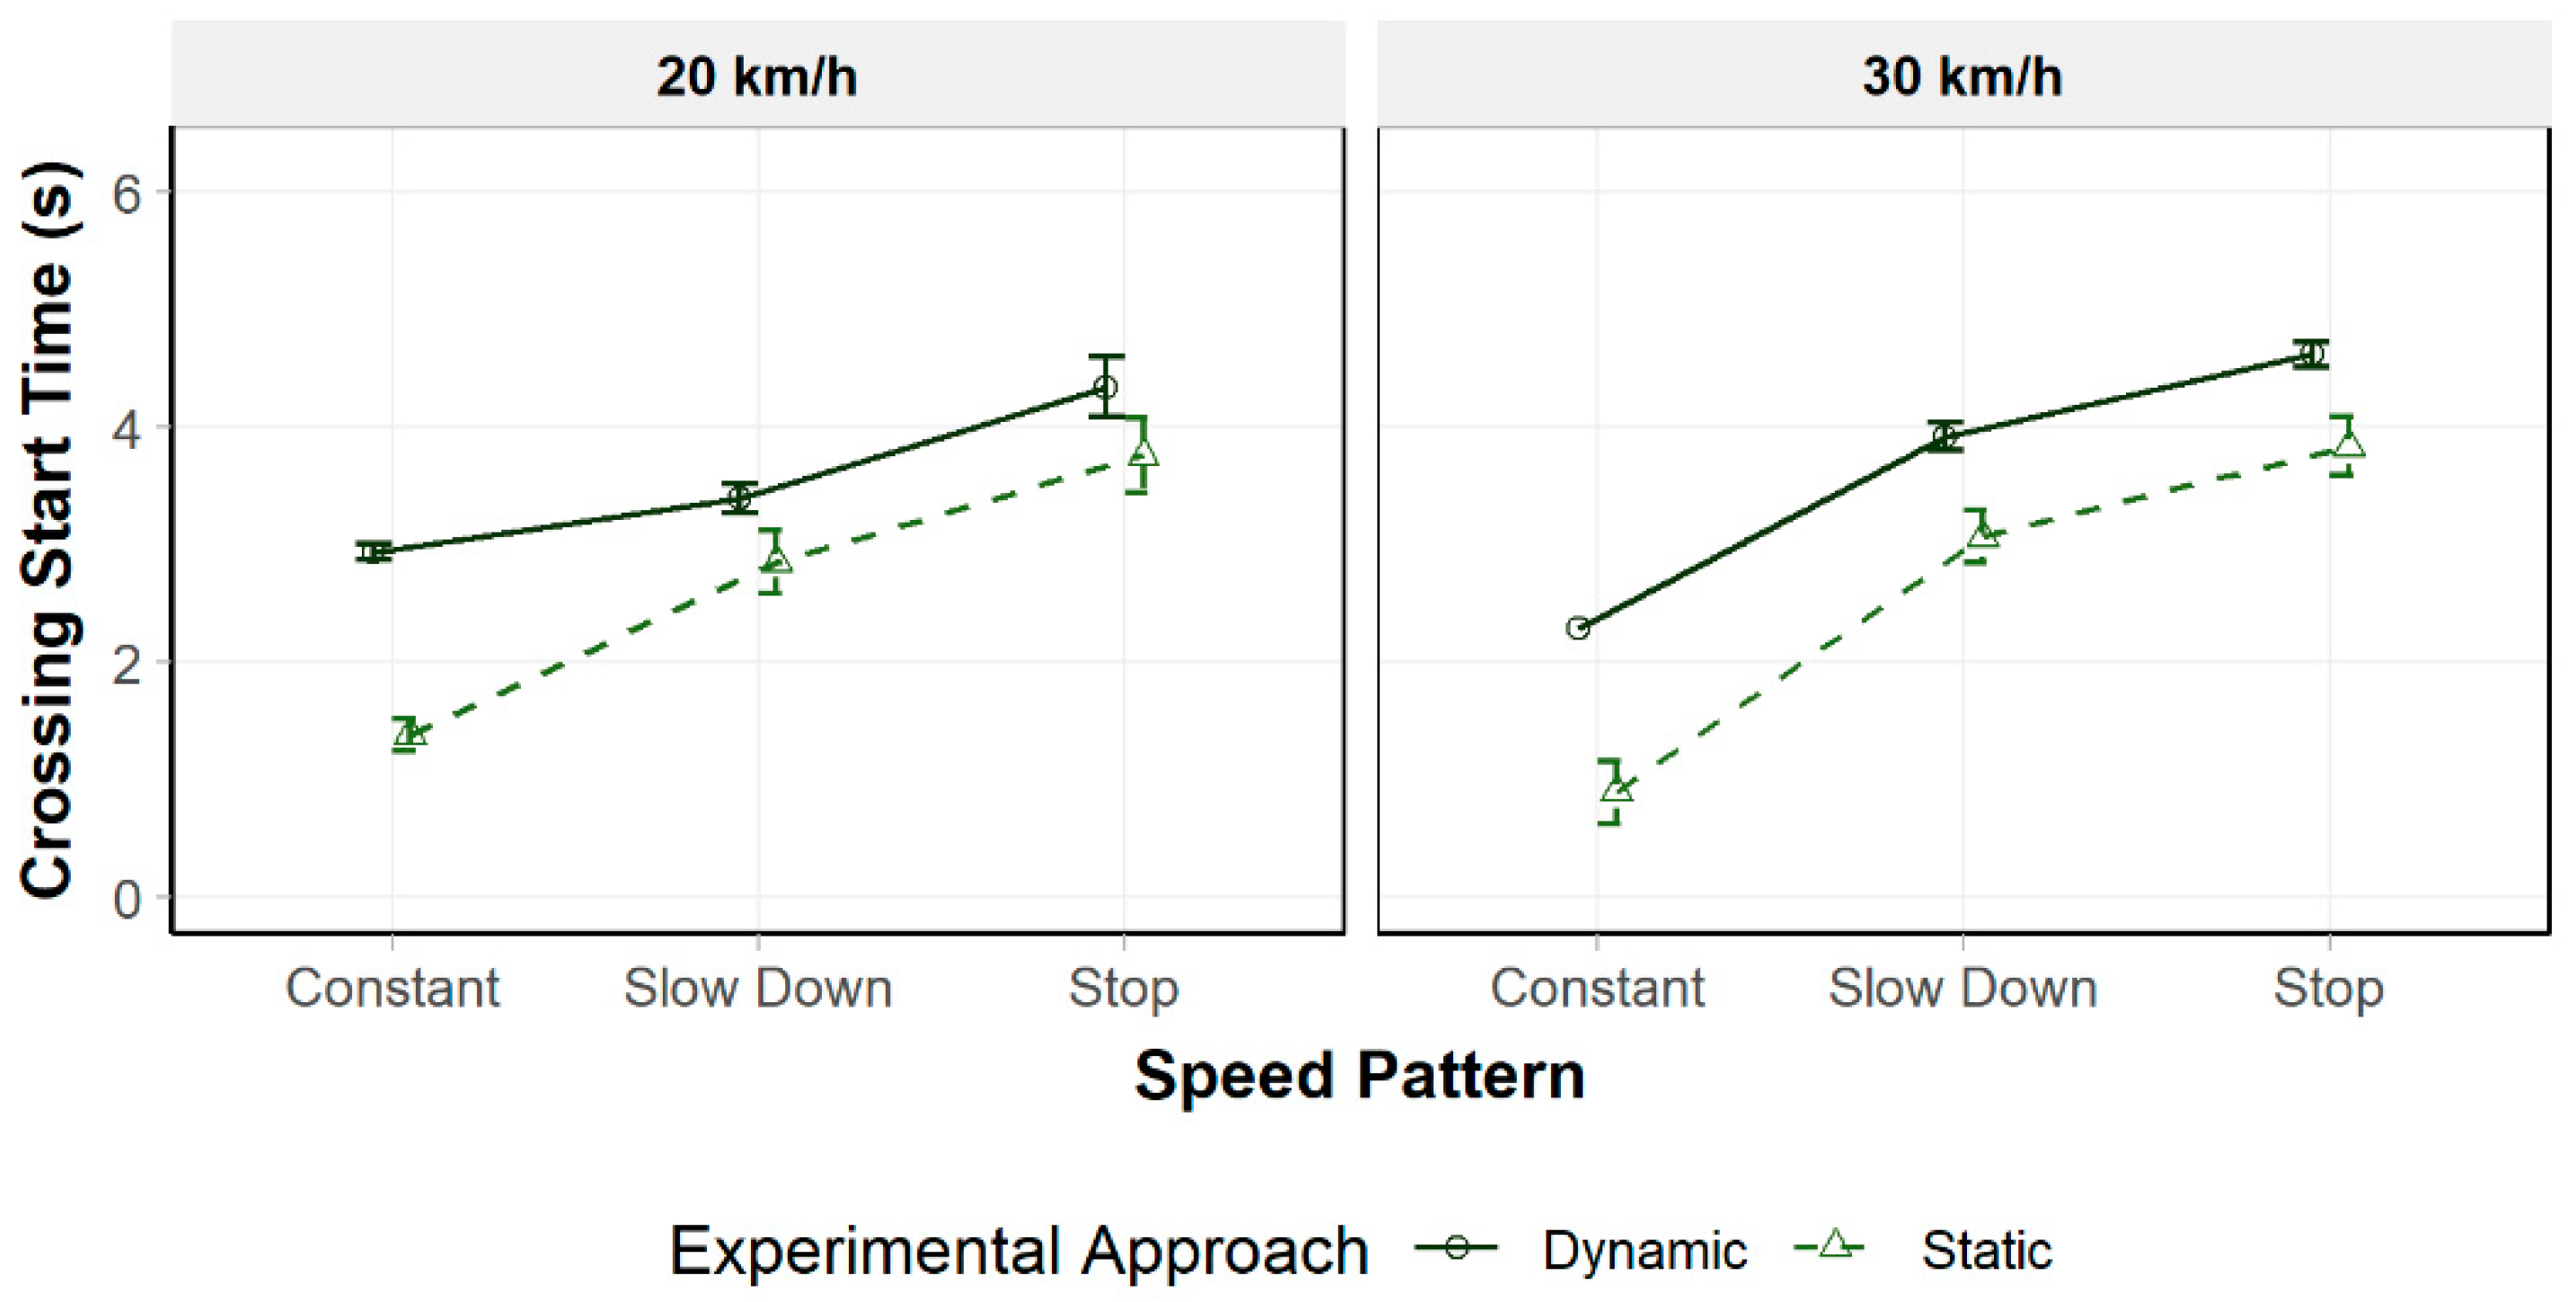
3.2.2. Crossing Start Time

An LMM of the crossing start time with random effects was included for the participants, and fixed effects for the initial speed, speed pattern, and experimental approach were fitted. A visual inspection of the residual plot indicated no deviations from skewness or homoscedasticity. Satterthwaite’s tests exhibited significant effects of vehicle initial speed, F(1, 2167.54) = 9.73, p < 0.01, speed pattern, F(2, 2168.20) = 187.69, p < 0.01, experimental approach, F(1, 66.85) = 6.71, p = 0.01, and interaction between speed pattern and initial speed, F(1, 2165.70) = 3.42, p = 0.03. None of the interactions of the experimental approach with the other variables were significant.
The model was refitted, discarding the experimental approach’s interaction with the other variables, and contrasts were used to compare the different initial speeds, the speed patterns, the interaction between both, and the experimental approaches. Although the results of Satterthwaite’s tests have revealed that initial speed explains the participants’ crossing start time, contrasts showed that the crossing start time was not significantly different when comparing the initial speed of 30 km/h to the 20 km/h, b = 0.21, t(2172.19) = 1.08, p = 0.28.
Regarding the speed patterns, differences were found between constant and slowing down patterns, b = 0.43, t(2172.08) = 6.12, p < 0.01, and between constant and stopping, b = 1.32, t(2173.78) = 18.84, p < 0.01, indicating a significant increase in crossing start time from constant to slowing down and also from constant to stopping. A third contrast was used to compare the experimental approach, showing that participants were significantly quicker to decide in the static experiment than those who performed the dynamic experiment, b = −0.64, t(55.45) = −2.40, p = 0.02. The last contrast done to assess the differences between the initial speeds of 20 km/h and 30 km/h within the speed pattern revealed no significant differences in crossing start time caused by the interactions between all the levels of initial speed and speed pattern variables.
Figure 13 shows that the crossing start time distribution is very similar between the different initial speeds, except for the point corresponding to the dynamic approach’s constant speed pattern. An apparent increase in the time participants spent from the constant speed pattern to the slowing down, and the stopping, is also shown. Considering the results of the analysis of the percentage of crossing and the response time, it is observed that, such as in the static experiment, in the dynamic experiment, the participants felt they had more time to cross the road safely when the vehicle speed varied, having waited until the vehicle slowed down and crossed.
However, the most notorious difference seen in Figure 13, also evidenced by Figure 8, is between the experimental approaches. In the dynamic approach, participants spent, on average, about 0.8 s more to make their crossing decision than those who performed the static experiment. This difference was already expected. In the static experiment, the participants were placed at the same point on the curb during the entire experiment, from the start till the end of each stimulus. In contrast, in the dynamic experiment, the participants had to walk 3 m after the stimulus had started until they reached the curb and crossed.

3.2.3. Time-to-Passage

An LMM of TTP with the subject ID as the random effect and vehicle initial speed, speed pattern, and experimental approach as fixed factors was also fitted. Satterthwaite’s tests showed significant effects of speed pattern, F(2, 2179.55) = 27.98, p < 0.01, and an interaction effect between speed pattern and initial speed, F(2, 2168.94) = 25.93, p < 0.01. There was no significant effect of the initial speed, F(1, 2178.94) = 0.39, p = 0.53, nor of the experimental approach, F(1, 99.46) = 0.93, p = 0.34.
The model was refitted, discarding the experimental approach factor, and the different speed patterns were compared using contrasts. The first one compared the constant and slowing down speed patterns, resulting in non-significant differences. A second contrast compared the constant and stopping patterns and showed a non-significant difference between them. Another contrast compared the constant and slowing down patterns for each one of the different initial speeds, revealing once again a non-significant difference between them. Lastly, a fourth contrast showed significant differences between the constant and stopping patterns within each one of the different initial speeds, b = 3.68, t(2183.91) = 3.16, p < 0.01, showing that the TTP was notably longer for the stopping action when the initial speed of the vehicle was 30 km/h (see Figure 14).
The TTP for the slowing down pattern is similar to the ones for the constant. Nevertheless, the percentage of crossings was notoriously higher, indicating that participants had made a substantially different risk assessment, believing that the vehicle would stop. The significant increase in TTP for the 30 km/h also helps to explain that. Additionally, it shows that, in both experimental approaches, the participants waited for the vehicle to almost stop before starting to cross.
No significant differences were found between experimental approaches. However, Figure 14 shows, particularly for the stop pattern and the initial speed of 30 km/h, that the participants who performed the dynamic experiment had accepted higher TTPs. The opposite can be said regarding the stimuli corresponding to the constant speed pattern, considering both initial speeds.

4. Discussion

The capacity to make participants feel that they are actually present in the virtual environment determines the realism of the environment and the usability of the simulator [35]. This will depend on the quality of the graphical representation, sound, and interaction possibilities. This study compares the results of an experimental approach where participants were standing still with another one in which they were asked to walk along a crosswalk. The goal was to assess the impact of the interaction between the participant and the virtual environment on crossing decision-making.
Regarding the crossing decisions observed when the vehicle approached the participants at a constant speed, the vehicle speed and initial distance were the most determining variables for the participants’ crossing decisions. The percentage of crossings only differed between the two experimental approaches when the vehicle approached at 20 km/h from the initial distance of 35 m, i.e., in the most favorable condition to cross and in which the percentage of crossings was higher. Such as in the static experimental approach, crossing percentages increased with vehicle initial distance in the dynamic method and decreased with its speed. These results confirm again the important role of vehicle speed in crossing decisions when balanced with the distance weight, contrasting with Feldstein and Dyszak’s [46] results.
Crossing start times were not affected by the initial distance. However, the vehicle speed and the experimental approach had a significant impact on the participants’ time to decide to cross. In both experimental approaches, higher speeds have prompted faster decisions. As for the experimental approach’s effect, it can be easily explained by the distance of 3 m that participants had to walk after the beginning of the stimuli presentation and before reaching the curb in the dynamic experiment. Except for one particular condition (a speed of 30 km/h and an initial distance of 25 m), the crossing start times assumed the same trend in both experimental methods. In the dynamic approach, the crossing start times were, on average, 1.58 s higher than in the static experiment. Observations with both experimental approaches showed that a faster-moving vehicle led to less time to decide [47].
Again, the higher speeds and close distances have prompted a similar sense of urgency, accelerating the decision processes. However, this had a repercussion on the accuracy of judgments. In the dynamic experiment, where it was possible to determine the number of crashes, considering the values presented in Table 5, they expressively occurred when vehicle speed was the highest and when the vehicle approached the crosswalk at 20 km/h from the shortest distance. Thus, with both experimental approaches, it was possible to note that the TTP and the crossing start time were directly related when the vehicle approached at a constant speed.
Regarding the analysis of the stimuli considering the three different types of speed patterns, the results showed that the initial speed of the vehicle had a significant influence on the percentage of crossings, with the participants crossing more often when the vehicle started at 20 km/h, and on the crossing start time. This is valid particularly for the dynamic experiment, since through the execution of the static experiment, it was verified that the crossing start time (response time) was significantly longer when the vehicle approached the crosswalk at an initial speed of 30 km/h.
Participants crossed more when the vehicle varied its speed (slowing down and stopping patterns). In these patterns, most of the static experiment participants and all the participants of the dynamic experiment waited for a speed considerably lower than the initial speed to cross the virtual road. The crossing start time was longer in the dynamic compared to the static experiment. However, as for the constant speed pattern, the delay in crossing decision-making verified in the dynamic experiment is defined by the distance the participants had to walk before arriving at the crosswalk and not by a better ponderation made before the crossing, as indicated by the similarity between the percentage of crossings for both experimental approaches.
The TTP analysis showed that, for both experimental approaches, only the condition characterized by the stopping pattern with an initial speed of 30 km/h was significantly different from the others. For this condition, the participants crossed mostly when the vehicle speed was almost 0 km/h, making the TTP higher than in the other conditions. The TTP values for the different speed pattern analyses confirm the similarity between both experimental approaches.
On the other hand, the choice of the approach to be implemented in each study must depend on the information one intends to obtain. The dynamic approach allows for calculating surrogate safety indicators such as post-encroachment time (PET), minimum time-to-crossing, or time-to-arrival [48]. Additionally, it allows one to perform the crossing task in a similar way to that which is occurring in the real world. However, an experiment in which participants walk along a crosswalk is technically more demanding than one in which they click on a button to signal when they decide to cross. Dynamic designs require more complex implementations to achieve realistic sound and image depictions of the virtual environment that are congruent with the participant’s movements. These characteristics must be well pondered in the design phase of each study. The static experience can be more effective when applied in studies where a significant amount of detailed information is unnecessary. In contrast, the dynamic experience can be useful for studies on pedestrian behavior in which movement is a required behavior variable.

5. Conclusions

This work aimed to assess pedestrian crossing behavior through two simulation methods: (i) the static approach, in which the participants were required to decide when they would cross the road by clicking on a button, standing in the same position during the whole experiment; and (ii) the dynamic approach, in which the participants were instructed to cross the virtual road, walking along a semi-virtual crosswalk. For example, the sound and the possibility of letting participants move freely make the simulator more realistic and immersive, allowing them to have a more complete interaction with the virtual world.
The overall analysis reveals that the experimental approach was not a determinant factor in the participants’ crossing decision task. Vehicle speed and initial distance, as well as speed profile, were the variables used by participants to make their decision.
The static approach has the advantage of making the experimental task simpler and less time-consuming, with instructions easily assimilated and performed by the participants. On the other hand, the dynamic is more naturalistic. It allows for gathering a greater quantity of information, such as participants’ speed and position and the determination of crash occurrence. Both experimental approaches were valid for studying the pedestrians’ crossing decision-making. The use of each of the approaches in future studies must be considered depending on the desired type of information and the detail intended.
The choice between a static or dynamic experimental approach should be made based on the specific goals of the study. It is relevant to consider the advantages and disadvantages of each methodology. The dynamic approach is more naturalistic and allows for a comprehensive evaluation of pedestrians’ decision-making, as well as their gait and movement parameters. The static approach focuses solely on analyzing decision-making and is quicker for participants to complete.
The sample size of 30 participants was chosen based on several factors, including feasibility and comparison with similar studies in the field. The authors recognize that this sample size is not extensive, and this limitation should be addressed in the future by including a wider demographic sample, with children and seniors. It will allow us to explore these aspects in more detail and provide a comprehensive understanding of the behavior across all age groups.
This study considered the noise of one vehicle passing by. Further studies should analyze the effect of more complex auditory scenarios on pedestrians’ crossing behavior by considering multiple vehicles, additional trajectory types, and obstacles that may impede participants’ vision. This will allow for an overall assessment of auditory cues in pedestrian decision-making, especially given the increasing prevalence of low-noise vehicles. While controlling variables allowed for a more systematic approach to this study, the authors acknowledge that this approach may simplify the experimental setup and potentially limit the findings.

Author Contributions

Conceptualization, F.S., E.S. and E.F.F.; methodology, F.S.; software, F.S. and F.P.; validation, F.S.; formal analysis, F.S.; investigation, F.S.; resources, F.S., E.S. and E.F.F.; data curation, F.S. and S.F.; writing—original draft preparation, F.S.; writing—review and editing, F.S., E.S., S.F., R.A. and E.F.F.; visualization, F.S.; supervision, E.F.F. and E.S.; project administration, E.F.F. and E.S.; funding acquisition, F.S. and E.F.F. All authors have read and agreed to the published version of the manuscript.

Funding

This work was partly financed by FCT/MCTES through national funds (PIDDAC) under the R&D Unit Institute for Sustainability and Innovation in Structural Engineering (ISISE), under reference UIDB/04029/2020 (https://doi.org/10.54499/UIDB/04029/2020, accessed on 24 May 2024), and under the Associate Laboratory Advanced Production and Intelligent Systems ARISE under reference LA/P/0112/2020. This work was financed by national funds through FCT—Foundation for Science and Technology, under grant agreement SFRH/BD/131638/2017 attributed to the first author. IMPACT—IMProving users’ sAfety perCepTion of shared streets: Auditory, visual and geometry-based strategies, ref. 2022.06271.PTDC, funded by FCT—Foundation for Science and Technology, through national funds (https://doi.org/10.54499/2022.06271.PTDC, accessed on 24 May 2024).

Informed Consent Statement

Informed consent was obtained from all subjects involved in the study.

Data Availability Statement

The data in this study are available upon request from the corresponding author.

Conflicts of Interest

The authors declare no conflicts of interest.

References

  1. Bernhoft, I.M.; Carstensen, G. Preferences and Behaviour of Pedestrians and Cyclists by Age and Gender. Transp. Res. Part F Traffic Psychol. Behav. 2008, 11, 83–95. [Google Scholar] [CrossRef]
  2. Ewing, R.; Dumbaugh, E. The Built Environment and Traffic Safety: A Review of Empirical Evidence. J. Plan. Lit. 2009, 23, 347–367. [Google Scholar] [CrossRef]
  3. Ezzati Amini, R.; Katrakazas, C.; Antoniou, C. Negotiation and Decision-Making for a Pedestrian Roadway Crossing: A Literature Review. Sustainability 2019, 11, 6713. [Google Scholar] [CrossRef]
  4. Granié, M.A.; Brenac, T.; Montel, M.C.; Millot, M.; Coquelet, C. Influence of Built Environment on Pedestrian’s Crossing Decision. Accid. Anal. Prev. 2014, 67, 75–85. [Google Scholar] [CrossRef]
  5. Holland, C.; Hill, R. The Effect of Age, Gender and Driver Status on Pedestrians’ Intentions to Cross the Road in Risky Situations. Accid. Anal. Prev. 2007, 39, 224–237. [Google Scholar] [CrossRef]
  6. Ishaque, M.M.; Noland, R.B. Behavioural Issues in Pedestrian Speed Choice and Street Crossing Behaviour: A Review. Transp. Rev. 2008, 28, 61–85. [Google Scholar] [CrossRef]
  7. Johansson, C.; Gårder, P.; Leden, L. The Effect of Change of Code on Safety and Mobility for Children and Elderly as Pedestrians at Marked Crosswalks: A Case Study Comparing Sweden to Finland. In Proceedings of the Annual TRB Meeting, Washington, DC, USA, 11–15 January 2004. [Google Scholar]
  8. LaScala, E.A.; Gerber, D.; Gruenewald, P.J. Demographic and Environmental Correlates of Pedestrian Injury Collisions: A Spatial Analysis. Accid. Anal. Prev. 2000, 32, 651–658. [Google Scholar] [CrossRef] [PubMed]
  9. Leden, L. Pedestrian Risk Decrease with Pedestrian Flow. A Case Study Based on Data from Signalized Intersections in Hamilton, Ontario. Accid. Anal. Prev. 2002, 34, 457–464. [Google Scholar] [CrossRef] [PubMed]
  10. Lin, P.-S.; Kourtellis, A.; Wang, Z.; Guo, R. Understanding Interactions between Drivers and Pedestrian Features at Signalized Intersections; Florida Department of Transportation: Tallahassee, FL, USA, 2015. [Google Scholar]
  11. Moyano Díaz, E. Theory of Planned Behavior and Pedestrians’ Intentions to Violate Traffic Regulations. Transp. Res. Part F Traffic Psychol. Behav. 2002, 5, 169–175. [Google Scholar] [CrossRef]
  12. Oxley, J.A.; Ihsen, E.; Fildes, B.N.; Charlton, J.L.; Day, R.H. Crossing Roads Safely: An Experimental Study of Age Differences in Gap Selection by Pedestrians. Accid. Anal. Prev. 2005, 37, 962–971. [Google Scholar] [CrossRef]
  13. Papadimitriou, E.; Lassarre, S.; Yannis, G. Introducing Human Factors in Pedestrian Crossing Behaviour Models. Transp. Res. Part F Traffic Psychol. Behav. 2016, 36, 69–82. [Google Scholar] [CrossRef]
  14. Papadimitriou, E.; Lassarre, S.; Yannis, G. Pedestrian Risk Taking While Road Crossing: A Comparison of Observed and Declared Behaviour. Transp. Res. Procedia 2016, 14, 4354–4363. [Google Scholar] [CrossRef]
  15. Papadimitriou, E.; Lassarre, S.; Yannis, G. Human Factors of Pedestrian Walking and Crossing Behaviour. Transp. Res. Procedia 2017, 25, 2002–2015. [Google Scholar] [CrossRef]
  16. Papadimitriou, E.; Yannis, G.; Golias, J. Analysis of Pedestrian Exposure to Risk in Relation to Crossing Behavior. Transp. Res. Rec. 2012, 2299, 79–90. [Google Scholar] [CrossRef]
  17. Rosenbloom, T.; Ben-Eliyahu, A.; Nemrodov, D. Children’s Crossing Behavior with an Accompanying Adult. Saf. Sci. 2008, 46, 1248–1254. [Google Scholar] [CrossRef]
  18. Sucha, M.; Dostal, D.; Risser, R. Pedestrian-Driver Communication and Decision Strategies at Marked Crossings. Accid. Anal. Prev. 2017, 102, 41–50. [Google Scholar] [CrossRef]
  19. Sueur, C.; Class, B.; Hamm, C.; Meyer, X.; Pelé, M. Different Risk Thresholds in Pedestrian Road Crossing Behaviour: A Comparison of French and Japanese Approaches. Accid. Anal. Prev. 2013, 58, 59–63. [Google Scholar] [CrossRef]
  20. Turner, S.; Fitzpatrick, K.; Brewer, M.; Park, E.S. Motorist Yielding to Pedestrians at Unsignalized Intersections: Findings from a National Study on Improving Pedestrian Safety. Transp. Res. Rec. 2006, 1982, 1–12. [Google Scholar] [CrossRef]
  21. Zegeer, C.V.; Carter, D.L.; Hunter, W.W.; Stewart, J.R.; Huang, H.; Do, A.; Sandt, L. Index for Assessing Pedestrian Safety at Intersections. Transp. Res. Rec. 2006, 1982, 76–83. [Google Scholar] [CrossRef]
  22. Deb, S.; Strawderman, L.J.; Carruth, D.W. Investigating Pedestrian Suggestions for External Features on Fully Autonomous Vehicles: A Virtual Reality Experiment. Transp. Res. Part F Traffic Psychol. Behav. 2018, 59, 135–149. [Google Scholar] [CrossRef]
  23. Feng, Y.; Duives, D.; Daamen, W.; Hoogendoorn, S. Data Collection Methods for Studying Pedestrian Behaviour: A Systematic Review. Build. Environ. 2021, 187, 107329. [Google Scholar] [CrossRef]
  24. Lassarre, S.; Bonnet, E.; Bodin, F.; Papadimitriou, E.; Yannis, G.; Golias, J. A GIS-Based Methodology for Identifying Pedestrians’ Crossing Patterns. Comput. Environ. Urban Syst. 2012, 36, 321–330. [Google Scholar] [CrossRef]
  25. Deb, S.; Rahman, M.M.; Strawderman, L.J.; Garrison, T.M. Pedestrians’ Receptivity toward Fully Automated Vehicles: Research Review and Roadmap for Future Research. IEEE Trans. Hum.-Mach. Syst. 2018, 48, 279–290. [Google Scholar] [CrossRef]
  26. Cao, S.; Zhang, J.; Song, W.; Shi, C.; Zhang, R. The Stepping Behavior Analysis of Pedestrians from Different Age Groups via a Single-File Experiment. J. Stat. Mech. Theory Exp. 2018, 2018, 33402. [Google Scholar] [CrossRef]
  27. Fu, L.; Cao, S.; Shi, Y.; Chen, S.; Yang, P.; Fang, J. Walking Behavior of Pedestrian Social Groups on Stairs: A Field Study. Saf. Sci. 2019, 117, 447–457. [Google Scholar] [CrossRef]
  28. Wei, X.; Lv, W.; Song, W.; Li, X. Survey Study and Experimental Investigation on the Local Behavior of Pedestrian Groups. Complexity 2015, 20, 87–97. [Google Scholar] [CrossRef]
  29. Charron, C.; Festoc, A.; Guéguen, N. Do Child Pedestrians Deliberately Take Risks When They Are in a Hurry? An Experimental Study on a Simulator. Transp. Res. Part F Traffic Psychol. Behav. 2012, 15, 635–643. [Google Scholar] [CrossRef]
  30. Meir, A.; Oron-Gilad, T.; Parmet, Y. Can Child-Pedestrians’ Hazard Perception Skills Be Enhanced? Accid. Anal. Prev. 2015, 83, 101–110. [Google Scholar] [CrossRef]
  31. Schwebel, D.C.; Gaines, J.; Severson, J. Validation of Virtual Reality as a Tool to Understand and Prevent Child Pedestrian Injury. Accid. Anal. Prev. 2008, 40, 1394–1400. [Google Scholar] [CrossRef] [PubMed]
  32. Thomson, J.A.; Tolmie, A.K.; Foot, H.C.; Whelan, K.M.; Sarvary, P.; Morrison, S. Influence of Virtual Reality Training on the Roadside Crossing Judgments of Child Pedestrians. J. Exp. Psychol. Appl. 2005, 11, 175–186. [Google Scholar] [CrossRef] [PubMed]
  33. Zito, G.A.; Cazzoli, D.; Scheffler, L.; Jäger, M.; Müri, R.M.; Mosimann, U.P.; Nyffeler, T.; Mast, F.W.; Nef, T. Street Crossing Behavior in Younger and Older Pedestrians: An Eye- and Head-Tracking Study. BMC Geriatr. 2015, 15, 1–10. [Google Scholar] [CrossRef] [PubMed]
  34. Cavallo, V.; Dommes, A.; Dang, N.T.; Vienne, F. A Street-Crossing Simulator for Studying and Training Pedestrians. Transp. Res. Part F Traffic Psychol. Behav. 2019, 61, 217–228. [Google Scholar] [CrossRef]
  35. Feldstein, I.; Dietrich, A.; Milinkovic, S.; Bengler, K. A Pedestrian Simulator for Urban Crossing Scenarios. IFAC-PapersOnLine 2016, 49, 239–244. [Google Scholar] [CrossRef]
  36. Morrongiello, B.A.; Corbett, M.; Milanovic, M.; Pyne, S.; Vierich, R. Innovations in Using Virtual Reality to Study How Children Cross Streets in Traffic: Evidence for Evasive Action Skills. Inj. Prev. 2015, 21, 266–270. [Google Scholar] [CrossRef] [PubMed]
  37. Simpson, G.; Johnston, L.; Richardson, M. An Investigation of Road Crossing in a Virtual Environment. Accid. Anal. Prev. 2003, 35, 787–796. [Google Scholar] [CrossRef]
  38. Sween, R.; Deb, S.; Carruth, D.W.; Waddell, D.; Furuichi, M. Development of an Effective Pedestrian Simulator for Research. In Advances in Human Aspects of Transportation; Stanton, N.A., Landry, S., Di Bucchianico, G., Vallicelli, A., Eds.; Springer: Cham, Switzerland, 2017; pp. 183–191. ISBN 978-3-319-41682-3. [Google Scholar]
  39. Deb, S.; Carruth, D.W.; Sween, R.; Strawderman, L.; Garrison, T.M. Efficacy of Virtual Reality in Pedestrian Safety Research. Appl. Ergon. 2017, 65, 449–460. [Google Scholar] [CrossRef]
  40. Fu, Q.-W.; Liu, Q.-H.; Hu, T. Multi-objective optimization research on VR task scenario design based on cognitive load. Facta Univ. Ser. Mech. Eng. 2024, 22, 293–313. [Google Scholar] [CrossRef]
  41. Soares, F.; Silva, E.; Pereira, F.; Silva, C.; Sousa, E.; Freitas, E. To Cross or Not to Cross: Impact of Visual and Auditory Cues on Pedestrians’ Crossing Decision-Making. Transp. Res. Part F Traffic Psychol. Behav. 2021, 82, 202–220. [Google Scholar] [CrossRef]
  42. Blender Foundation. (n.d.). 2.79—Blender.org. Available online: https://www.blender.org/download/releases/2-79/ (accessed on 28 May 2024).
  43. Soares, F.; Silva, E.; Pereira, F.; Silva, C.; Sousa, E.; Freitas, E. The Influence of Noise Emitted by Vehicles on Pedestrian Crossing Decision-Making: A Study in a Virtual Environment. Appl. Sci. 2020, 10, 2913. [Google Scholar] [CrossRef]
  44. EN ISO 11819-2; Acoustics—Measurement of the Influence of Road Surfaces on Traffic Noise—Part 2: The Close-Proximity Method. ISO: London, UK, 2017.
  45. Pereira, F.; Soares, F.; Silva, C.; Sousa, E.; Freitas, E. CPX Based Synthesis for Binaural Auralization of Vehicle Rolling Noise to an Arbitrary Positioned Stander-by Receiver. Appl. Acoust. 2021, 182, 108211. [Google Scholar] [CrossRef]
  46. Feldstein, I.; Dyszak, G. Road Crossing Decisions in Real and Virtual Environments: A Comparative Study on Simulator Validity. Accid. Anal. Prev. 2020, 137, 105356. [Google Scholar] [CrossRef] [PubMed]
  47. Lobjois, R.; Cavallo, V. The Effects of Aging on Street-Crossing Behavior: From Estimation to Actual Crossing. Accid. Anal. Prev. 2009, 41, 259–267. [Google Scholar] [CrossRef] [PubMed]
  48. Johnsson, C.; Laureshyn, A.; De Ceunynck, T. In Search of Surrogate Safety Indicators for Vulnerable Road Users: A Review of Surrogate Safety Indicators. Transp. Rev. 2018, 38, 765–785. [Google Scholar] [CrossRef]
Figure 1. The two virtual scenarios: (a) 25A; and (b) TP.
Asi 07 00094 g001
Figure 2. Model of the vehicle used in the virtual experiment.
Asi 07 00094 g002
Figure 3. Spatial layout of the room: (a) dynamic; (b) static [41].
Asi 07 00094 g003
Figure 4. Participant performing the experiment: (a) dynamic; (b) static [41].
Asi 07 00094 g004
Figure 5. Participants’ responses ordered by average of Crossing Start Times, per initial distance, regarding the 20 km/h speed, for constant speed pattern and each experimental approach: (a) dynamic; and (b) static.
Asi 07 00094 g005
Figure 6. Participants’ responses ordered by average of Crossing Start Times, per initial distance, regarding the 30 km/h speed, for constant speed pattern and each experimental approach: (a) dynamic; and (b) static.
Asi 07 00094 g006
Figure 7. Percentage of crossings and mean standard error as a function of the experimental approach, per initial distance and initial speed, for constant speed pattern.
Asi 07 00094 g007
Figure 8. Crossing start time and respective mean standard error as a function of the experimental approach, per initial distance and initial speed, for constant speed pattern.
Asi 07 00094 g008
Figure 9. Mean values of TTP at the moment of crossing as a function of the TTP at the beginning of the trial, using the experimental approach, for constant speed pattern.
Asi 07 00094 g009
Figure 10. Participants’ responses ordered by average of Crossing Start Time, for the initial speed of 20 km/h, per speed pattern and experimental approach: (a) dynamic; and (b) static.
Asi 07 00094 g010
Figure 11. Participants’ responses ordered by average of Crossing Start Time, for the initial speed of 30 km/h, per speed pattern and experimental approach: (a) dynamic; and (b) static.
Asi 07 00094 g011
Figure 12. Percentage of crossings and mean standard error as a function of the experimental approach, per initial speed and speed pattern.
Asi 07 00094 g012
Figure 13. Crossing start time and respective mean standard error as a function of the experimental approach, per initial speed and speed pattern.
Asi 07 00094 g013
Figure 14. TTP and mean standard error as a function of the experimental approach, per initial speed and speed pattern.
Asi 07 00094 g014
Table 1. Participants’ demographic characteristics.
Experimental ApproachTotal
StaticDynamic
Age24–60 years
(M = 39.70; SD = 12.11)
23–57 years
(M = 39.17; SD = 10.44)
23–60 years
(M = 39.88; SD = 11.20)
Sex46% Male;
54% Female
57% Male;
43% Female
52% Male;
48% Female
M = mean, SD = standard deviation of age.
Table 2. Characteristics of the vehicle movement in the different conditions presented in the experiment by Soares et al. [41].
ConditionVi (km/h)Vf (km/h)Di.mov (m)Di (m)Df (m)
1202035--
2303035--
3202030--
4303030--
5202025--
6303025--
7301030255
82010301510
920030155.50
1030030205.50
Vi = initial speed; Vf = final speed; Di.mov = vehicle’s distance at the start of the simulation; Di = vehicle’s initial distance to pedestrian; Vf = vehicle’s final distance to pedestrian.
Table 3. Acoustic characteristics of the stimuli regarding the static approach (CPB sounds).
Indicator 1Condition
12345678910
LAeq (dB(A))66.2265.6765.2371.0970.5870.1958.5960.0458.9061.04
LAmax (dB(A))72.8172.8172.8177.4977.4977.4961.1264.2863.9366.15
L5 (dB(A))72.2772.0871.8576.8876.8376.7760.7063.7463.4065.46
L10 (dB(A))71.0970.6870.2876.1975.7575.3160.4363.4562.7563.93
L50 (dB(A))62.7261.8960.9867.6766.9365.8558.1757.3457.8960.52
L90 (dB(A))57.8157.3256.1260.0960.2859.9756.4256.0652.8052.65
Measurement time (s)6.457.508.404.805.556.157.507.0510.209.30
Dynamic range (dB(A))28.1528.1528.1532.8332.8332.8316.4619.6219.2721.50
1 Values of the acoustic indicators for the sound recorded by the HATS’s left channel (left ear): LAeq = equivalent continuous sound level A-weighted; LAmax = maximum continuous sound level A-weighted; Lx = sound level exceeded for x% of the measurement period.
Table 4. Acoustic characteristics of the stimuli regarding the dynamic approach (CPX auralized sounds).
Indicator 1Condition
12345678910
LAeq (dB(A))66.3565.7565.3271.0770.4970.1058.8061.6459.1562.49
LAmax (dB(A))72.7072.6772.8978.1678.0377.7162.0365.8363.3266.34
L5 (dB(A))71.6871.8171.7777.1676.9376.6061.6565.1762.9165.65
L10 (dB(A))70.5670.7470.3375.8375.3875.0561.2664.9562.1565.48
L50 (dB(A))62.5462.6561.3967.8266.6166.0358.9061.7158.7562.13
L90 (dB(A))57.2756.9855.6561.1560.9660.7651.3750.4755.2155.73
Measurement time (s)6.457.508.404.805.556.157.57.0510.209.30
Dynamic range (dB(A))25.4725.4425.6630.9330.8030.4814.8018.6016.0919.11
1 Values of the acoustic indicators for the sound acquired by the channel (left ear): LAeq = equivalent continuous sound level A-weighted; LAmax = maximum continuous sound level A-weighted; Lx = sound level exceeded for x% of the measurement period.
Table 5. Descriptive statistics of the percentage of crossings and crashes for each trial with constant speed pattern.
Experimental ApproachVi (km/h)Di.mov (m)CrossingsCrashes
Mean (%)SD (%)SE (%)(%)
Static202523.0031.905.82
3041.3042.307.73
3549.3040.707.43
30254.3316.803.06
307.6717.703.24
3512.7022.904.18
Dynamic202512.3019.803.6159.50
3054.3039.907.280.61
3574.0035.006.390.90
30250000
301.337.301.3375.00
355.0016.803.0620.00
Vi = initial speed; Di.mov = vehicle’s distance at the start of the simulation; mean (%) = mean, SD (%) = standard deviation, SE (%) = standard error of the percentage of crossings.
Table 6. Descriptive statistics of crossing start time and TTP for each trial regarding the constant speed pattern.
Experimental ApproachVi (km/h)Di.mov (m)Crossing Start TimeTTP
Mean (s)SD (s)SE (s)Mean (s)SD (s)SE (s)
Static20251.070.450.053.620.410.05
301.180.580.054.530.520.05
351.310.820.075.220.750.06
30250.690.190.052.410.230.06
300.870.490.102.910.430.09
351.050.500.083.320.430.07
Dynamic20252.740.350.062.080.340.06
302.830.370.033.160.370.03
352.930.460.033.810.390.03
3025------
302.280.150.081.680.210.10
352.410.300.082.140.250.06
Vi = initial speed; Di.mov = vehicle’s distance at the start of the simulation; mean (s) = mean, SD (s) = standard deviation, SE (s) = standard error of time.
Table 7. Descriptive statistics of percentage of crossings and crashes for all the speed patterns.
Experimental ApproachVi (km/h)Speed PatternCrossingsCrashes
Mean (%)SD (%)SE (%)(%)
Static20Constant41.3042.307.73
Slow Down80.3027.104.95
Stop87.7017.903.28
30Constant7.6717.703.24
Slow Down69.3035.806.54
Stop82.7028.405.18
Dynamic20Constant54.3039.907.280.61
Slow Down85.0030.605.590
Stop79.0032.705.980
30Constant1.337.301.3375.00
Slow Down79.3034.206.253.36
Stop75.7038.707.070
Vi = initial speed; mean (%) = mean, SD (%) = standard deviation, SE (%) = standard error of crossing percentage.
Table 8. Descriptive statistics of crossing start time and TTP for all the speed patterns.
Experimental ApproachVi (km/h)Speed PatternCrossing Start TimeTTP
Mean (s)SD
(s)
SE
(s)
Mean (s)SD
(s)
SE
(s)
Static20Constant1.180.580.054.530.520.05
Slow Down2.631.630.114.120.580.04
Stop3.642.190.144.686.070.37
30Constant0.870.490.102.910.430.09
Slow Down3.101.240.093.060.330.02
Stop4.011.300.086.8310.500.67
Dynamic20Constant2.830.370.033.160.370.03
Slow Down3.360.790.053.800.350.02
Stop4.341.510.103.864.960.32
30Constant2.280.150.081.680.210.10
Slow Down3.810.710.053.080.340.02
Stop4.560.670.047.3411.500.77
Vi = initial speed; mean (s) = mean, SD (s) = standard deviation, SE (s) = standard error of time.
Disclaimer/Publisher’s Note: The statements, opinions and data contained in all publications are solely those of the individual author(s) and contributor(s) and not of MDPI and/or the editor(s). MDPI and/or the editor(s) disclaim responsibility for any injury to people or property resulting from any ideas, methods, instructions or products referred to in the content.

