
Data Management Maturity Model—Process Dimensions and Capabilities to Leverage Data-Driven Organizations Towards Industry 5.0


Abstract
1. Introduction
2. Background and Methodology
2.1. Data-Driven Organization
2.2. Maturity Model
2.3. Methodology
3. Data Management Maturity Model
3.1. Phase 1—Scope
3.1.1. Model Context and Objectives
3.1.2. Definition of Model Focus
3.1.3. Definition of Stakeholders
3.1.4. Initial Literature Review
3.1.5. Definition of Research Objective and Question
3.2. Phases 2 and 3—Design and Populate
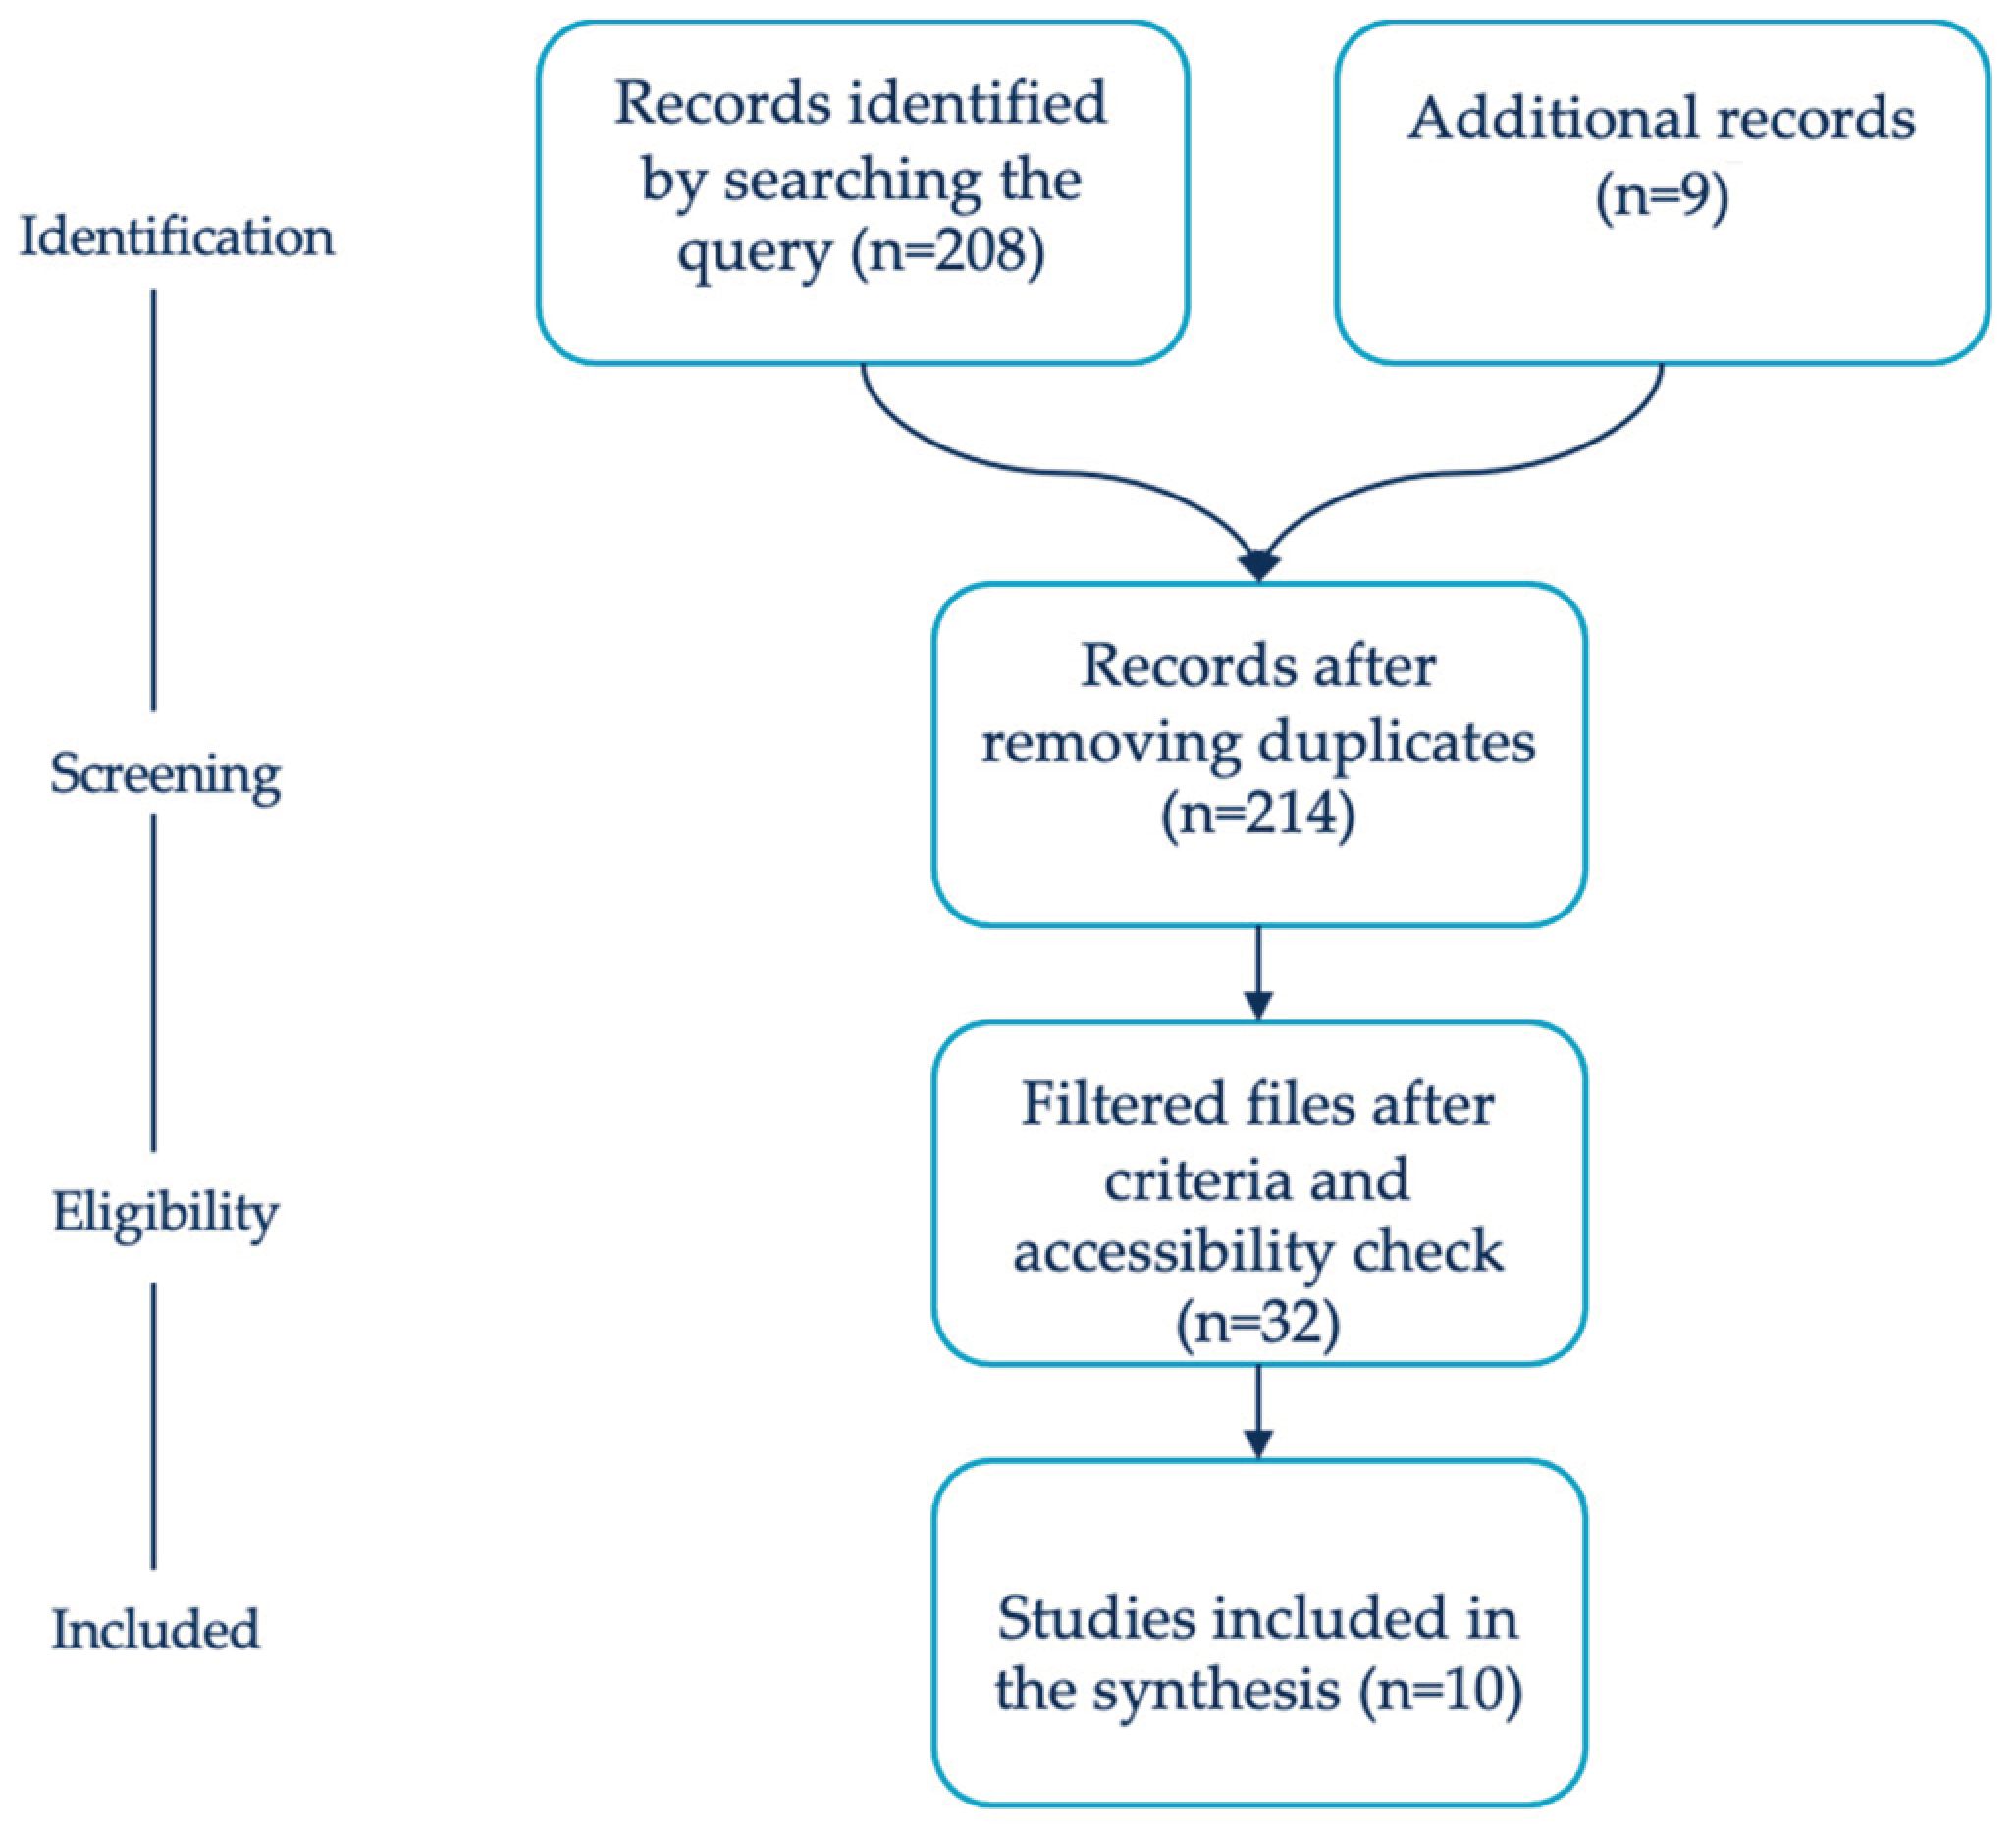
3.2.1. Systematic Literature Review
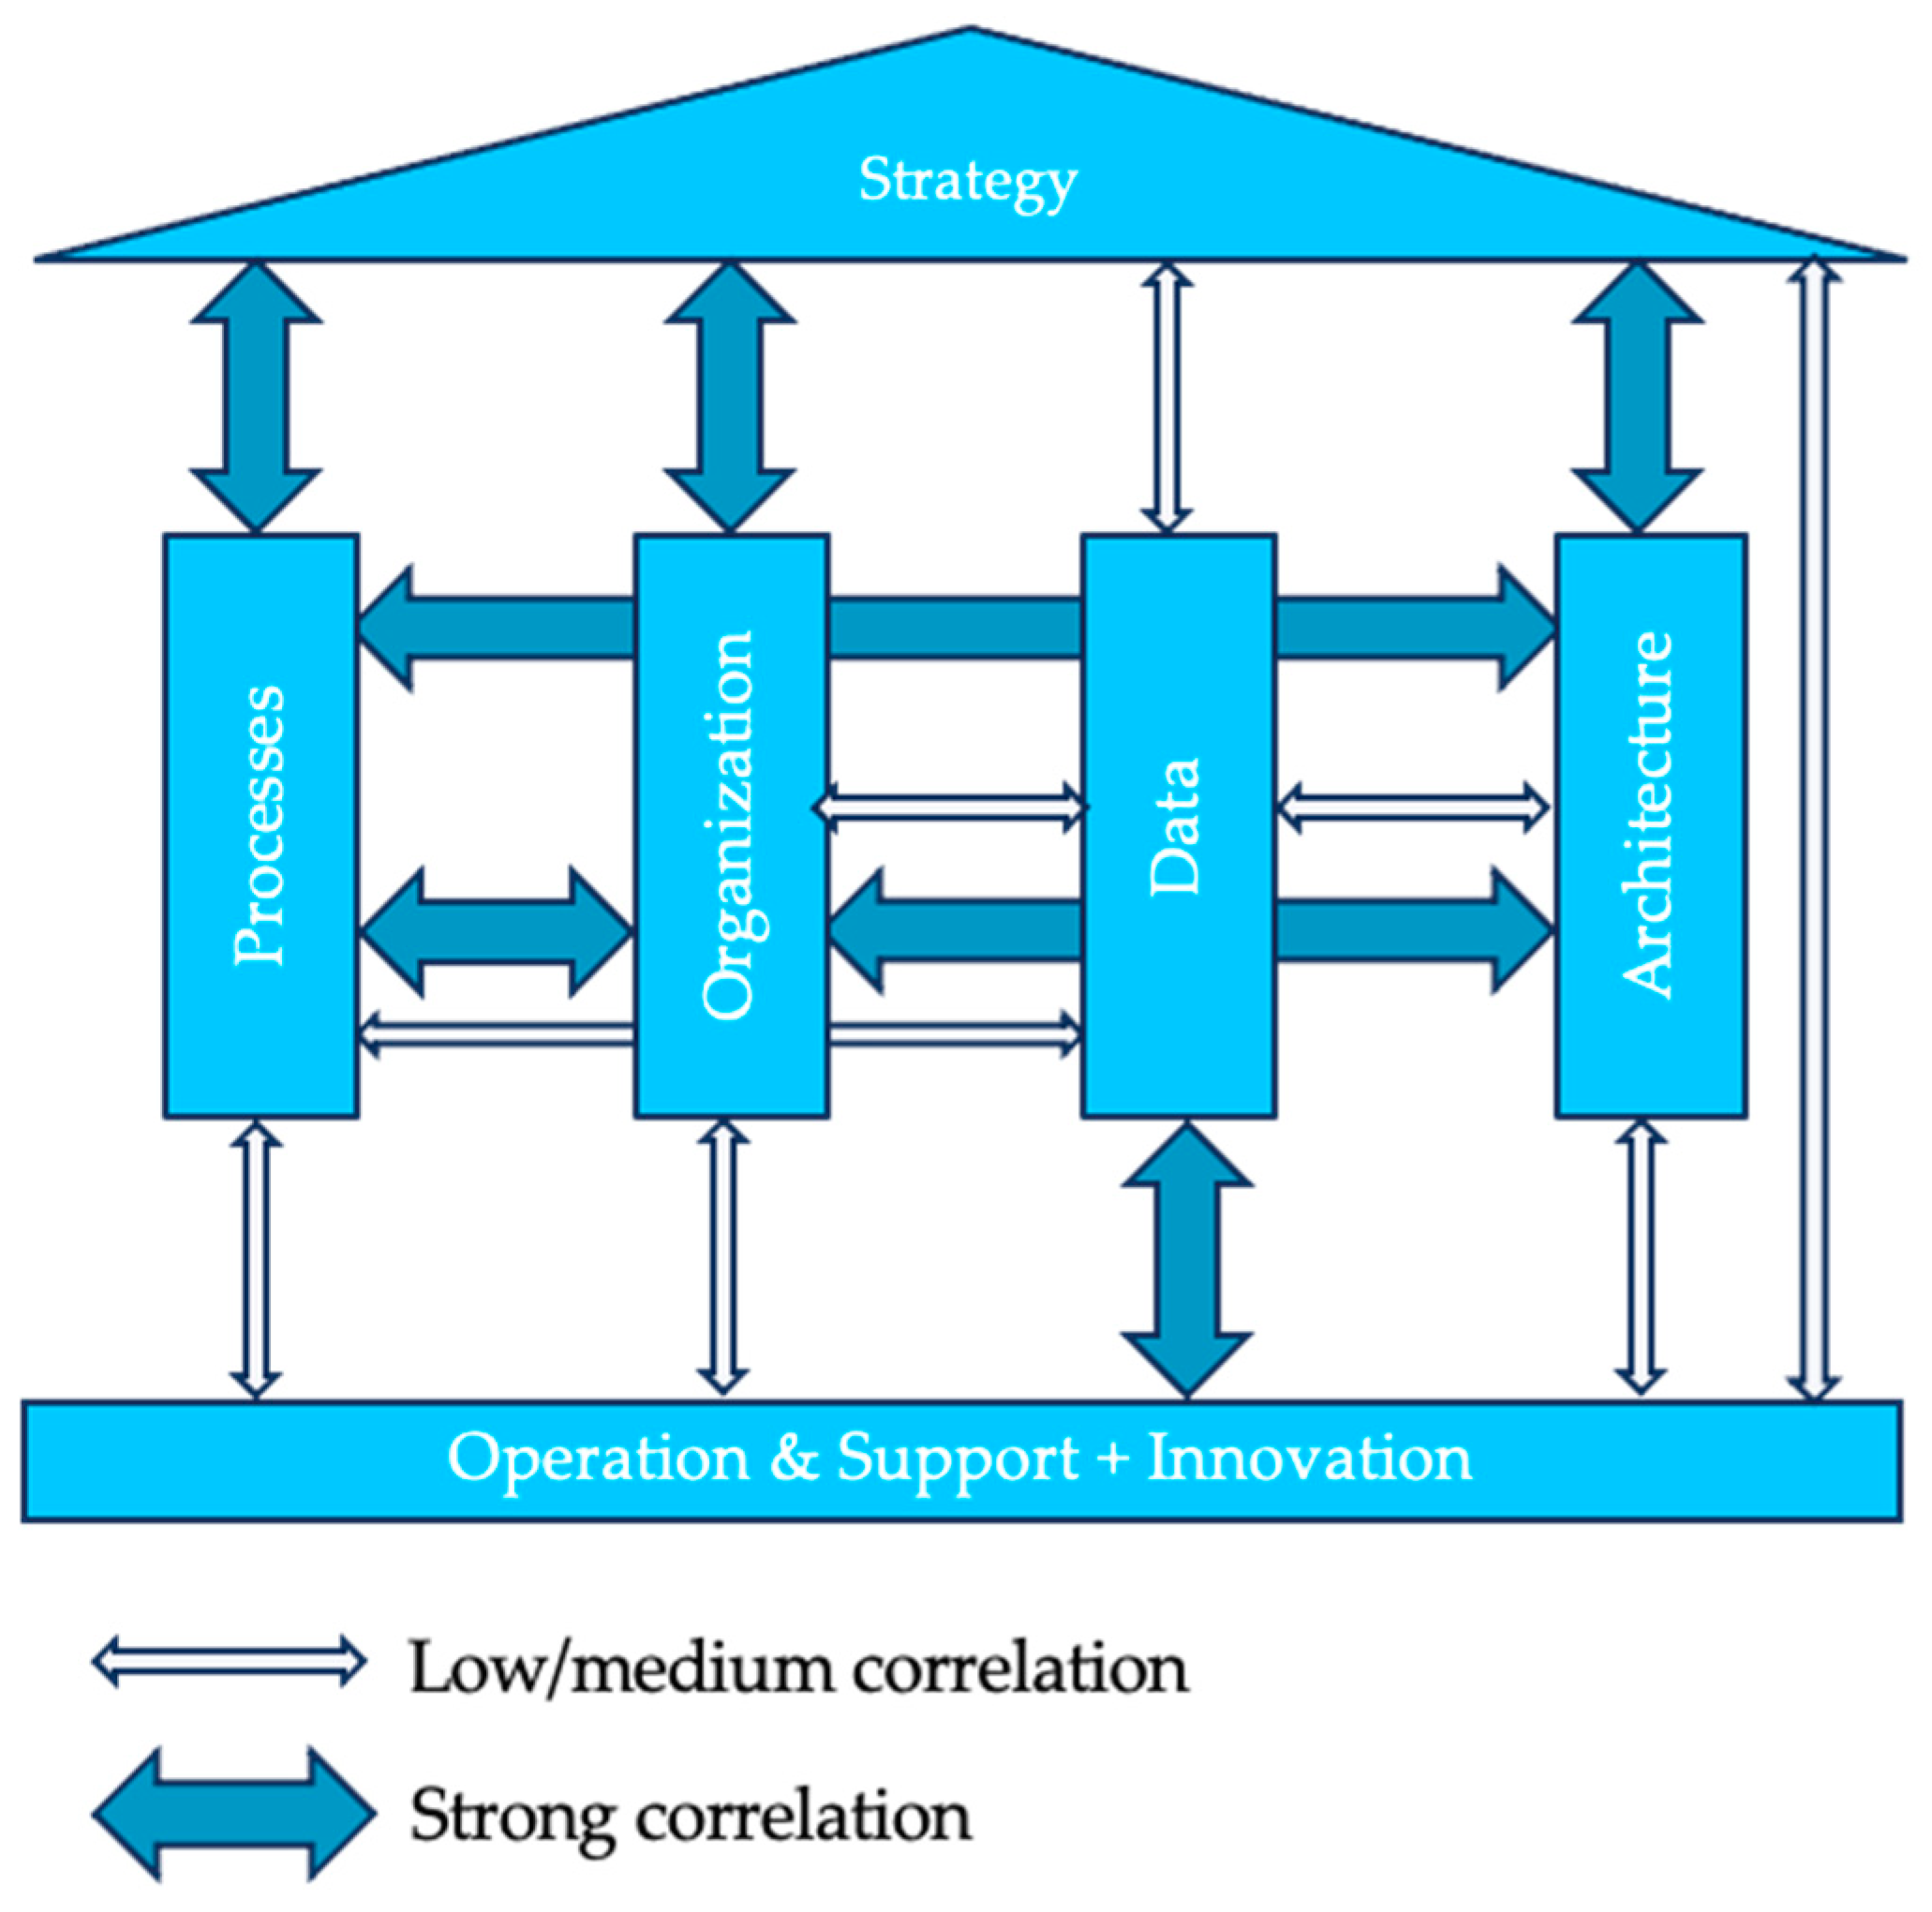
3.2.2. Maturity Model Structure and Content
3.2.3. Definition of Dimensions and Capabilities
3.2.4. Definition of Maturity Levels
3.3. Phase 4—Test
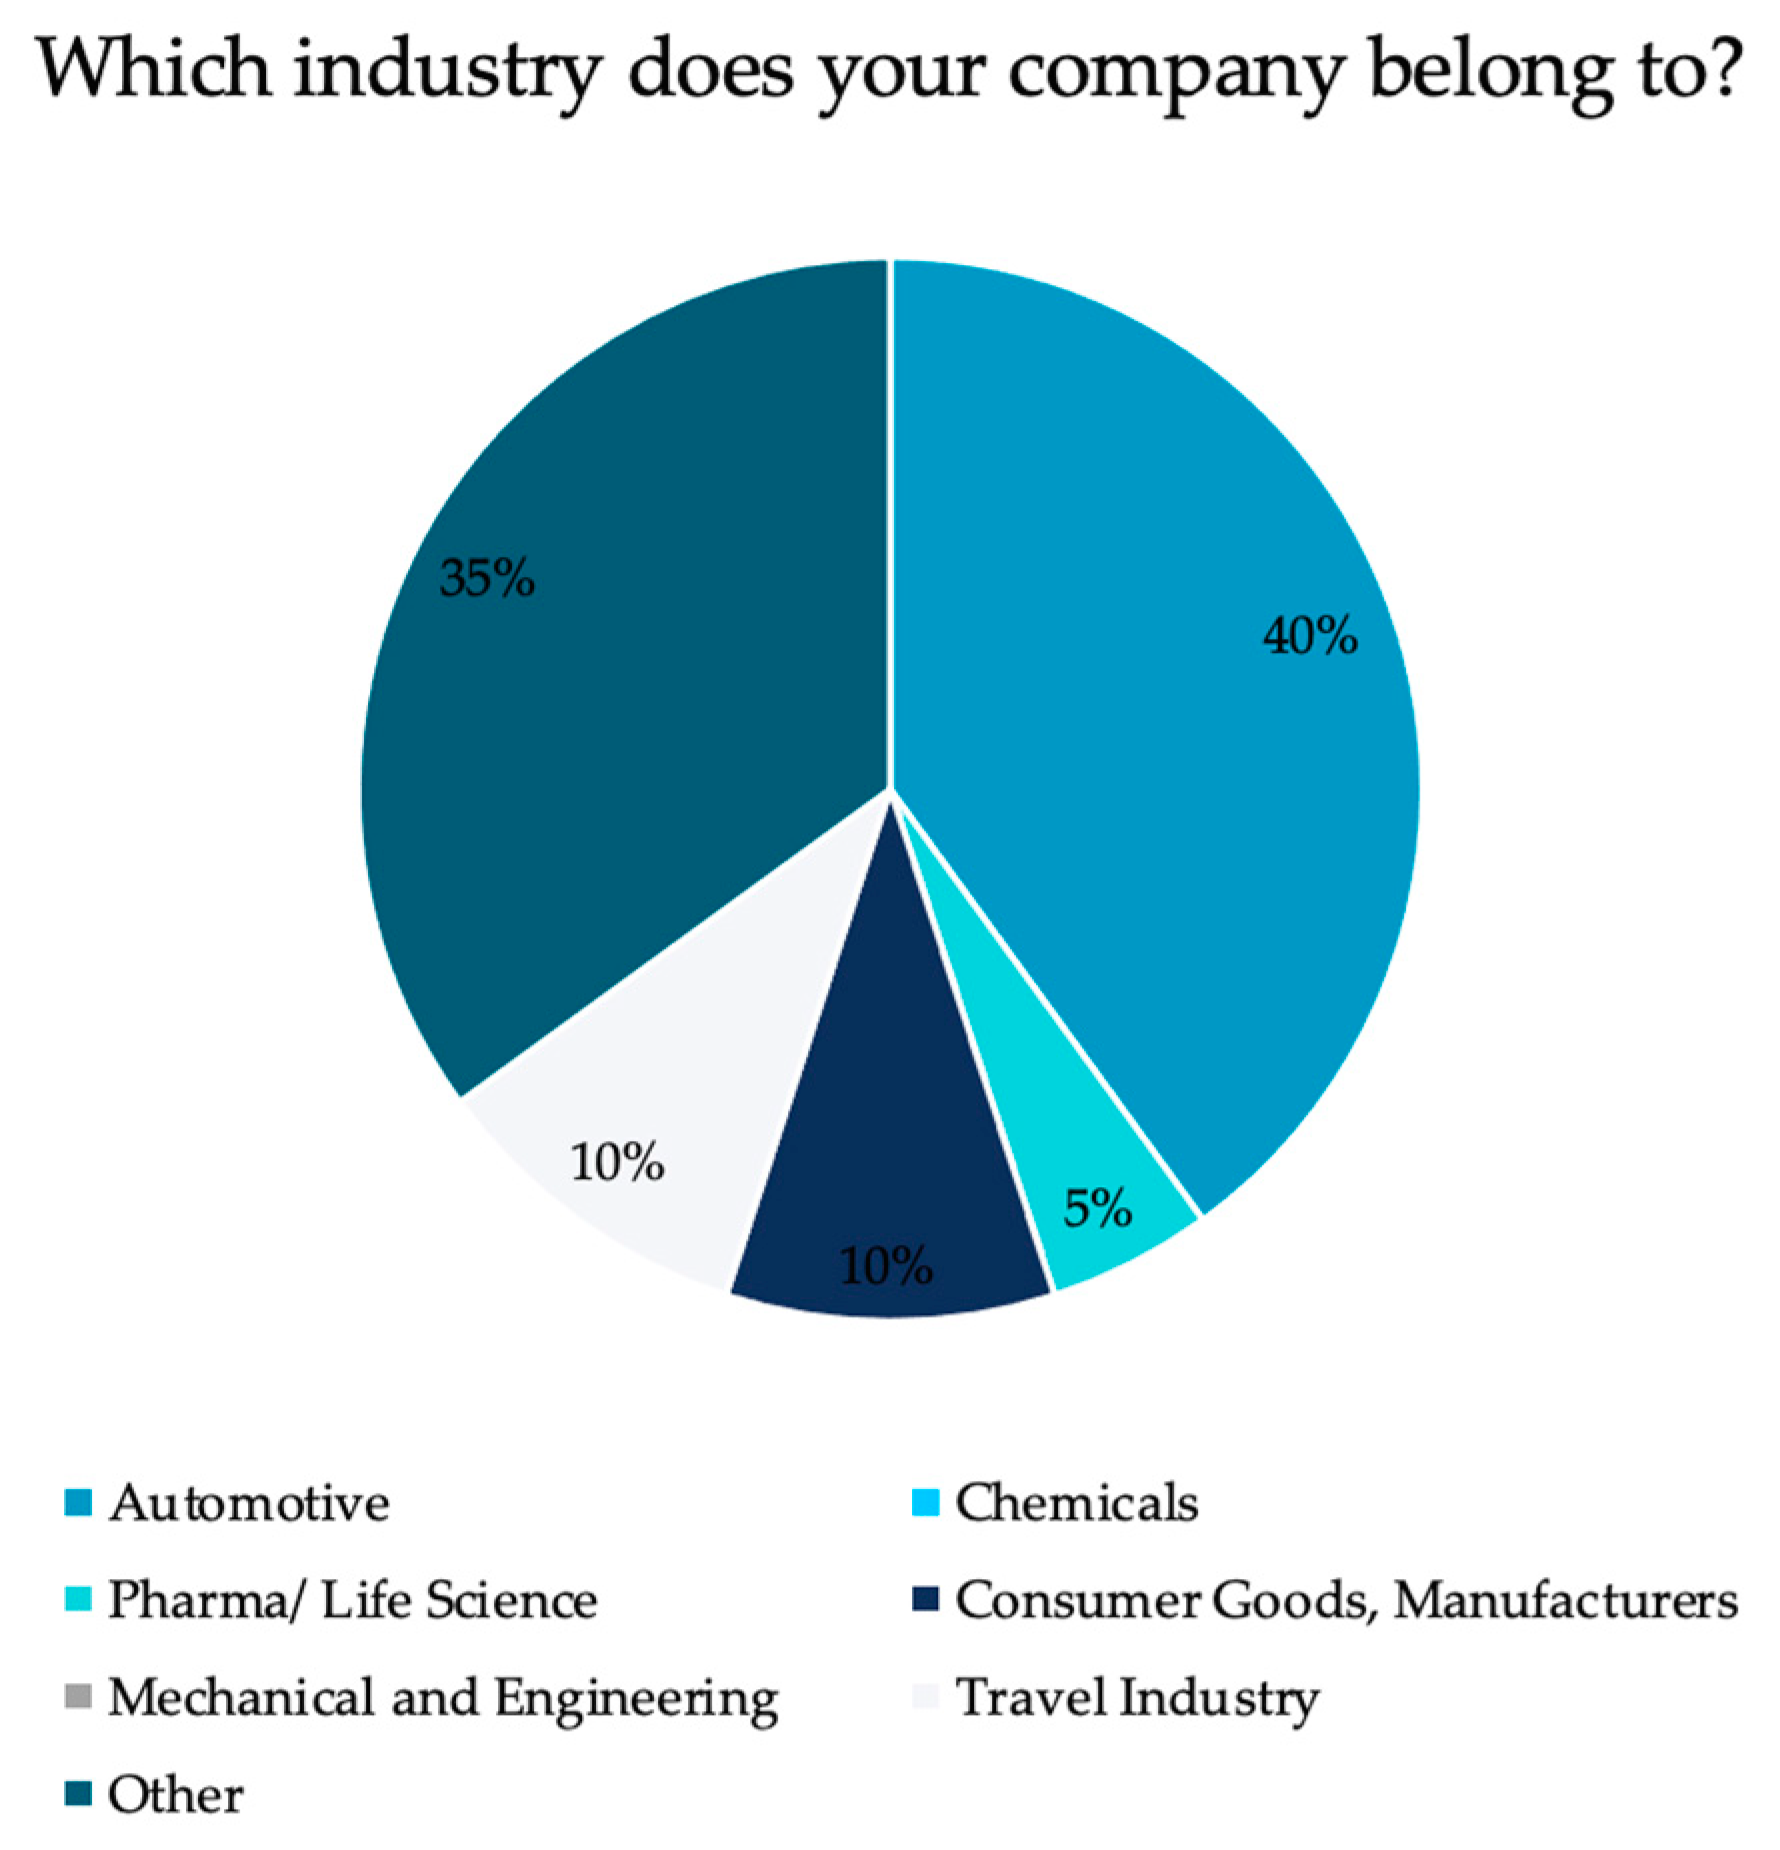
3.3.1. Industry Survey
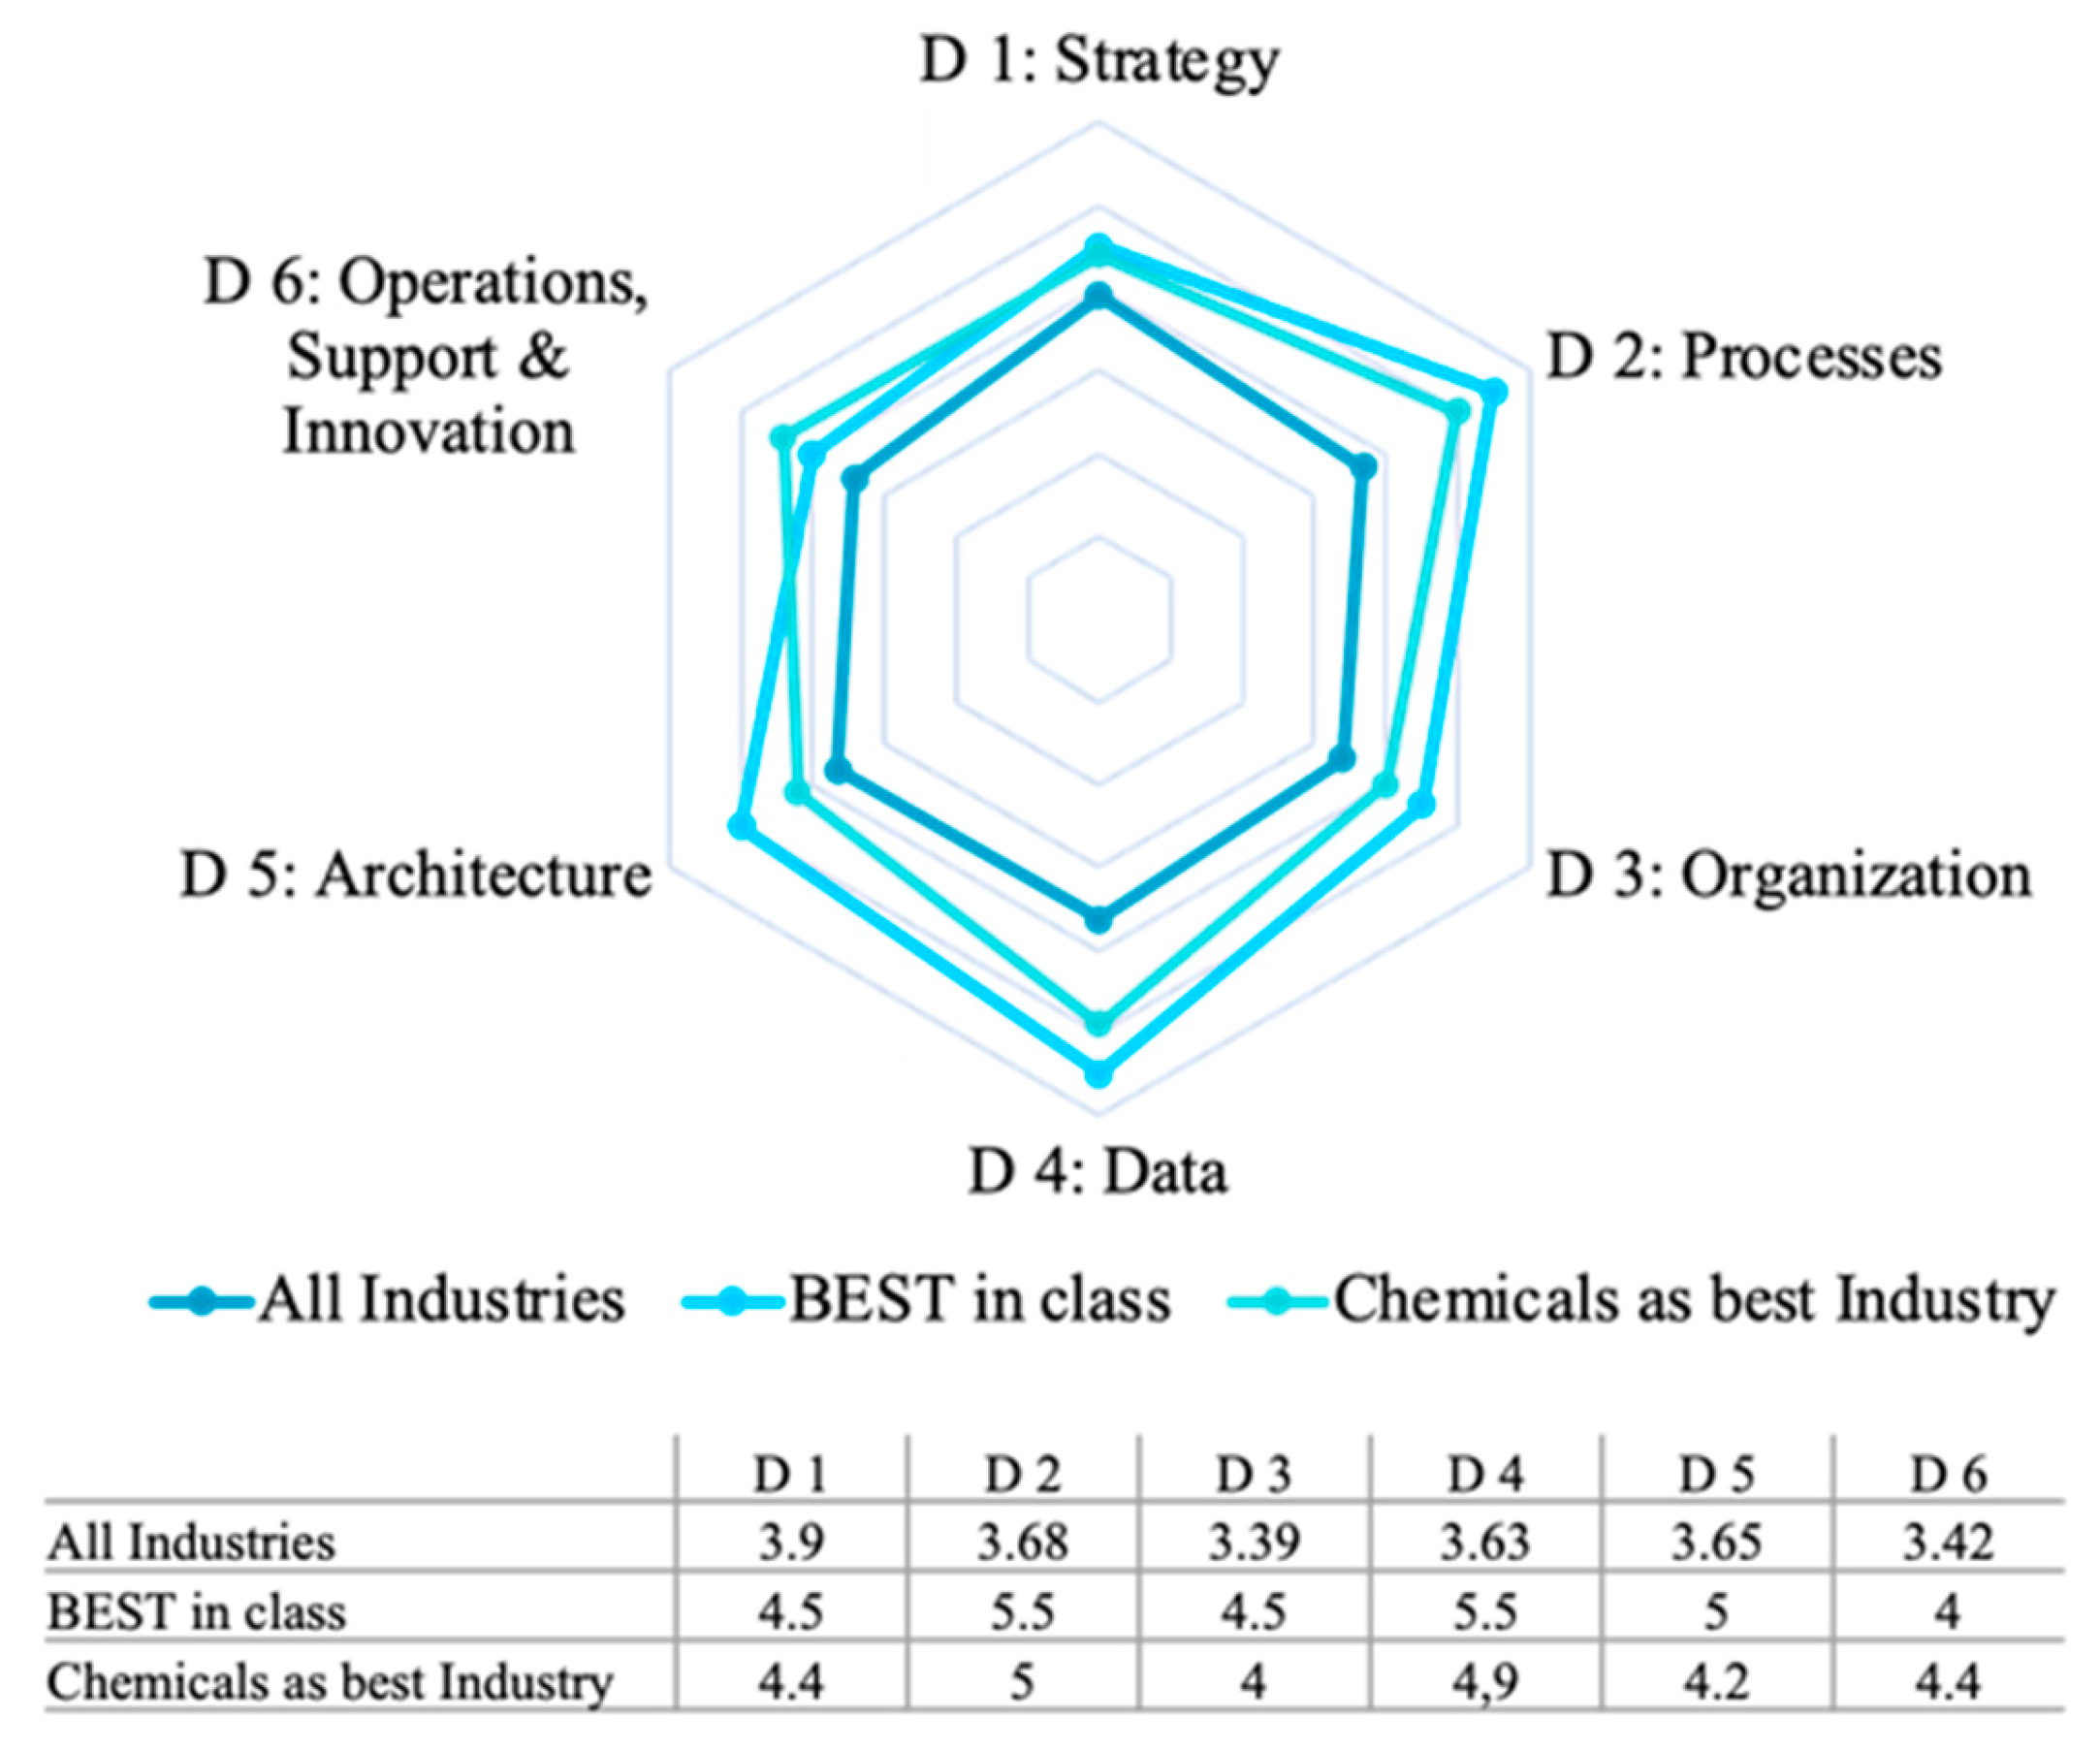
3.3.2. Evaluation of Process Dimensions and Maturity Levels
3.4. Phase 5—Deploy
3.4.1. Short Assessment
3.4.2. Feedback Gathering
3.4.3. Evaluation of Results
3.5. Phase 6—Maintain
4. Discussion, Limitations, and Conclusions
Author Contributions
Funding
Informed Consent Statement
Data Availability Statement
Acknowledgments
Conflicts of Interest
Appendix A

| Maturity Model | Process Dimension | Capabilities |
|---|---|---|
| Data Management Maturity Model (DMMM) [18] | Enterprise and Intent | Business Strategy, Culture, and People |
| Data Management | Data Collection and Availability, Metadata Management and Data Quality, Data Storage and Preservation, Data Distribution and Consumption, Data Analytics/processing/Transformation, Data Governance, Data Monitoring and Logging | |
| Systems | Architecture and Infrastructure, Data Integration, Security | |
| Data Operations | Processes, Data Deployment, and Delivery | |
| DAMA-DMBOK [29] | Data Governance | Goals and Principles Organization and Culture Activities Deliverables Roles and Responsibilities Practices and Techniques Technology |
| Data Architecture Management | ||
| Data Development | ||
| Database Operations Management | ||
| Data Security Management | ||
| Reference and Master Data Management | ||
| Data Warehousing and Business Intelligence Management | ||
| Meta Data Management | ||
| Data Quality Management | ||
| Gartner Enterprise Information Management Maturity Model (EIM) [29,30] | Vision Strategy Metrics Governance People (Org/Roles) Process (Life Cycle) Infrastructure | |
| Data Management Maturity Model (CMMI) [20,31] | Data Management Strategy | Data Management Strategy Communications Data Management Function Business Case Funding |
| Data Governance | Governance Management Business Glossary Metadata Management | |
| Data Quality | Data Quality Strategy Data Profiling Data Quality Assessment Data Cleansing | |
| Data Operations | Data Requirements Definition Data Lifecycle Management Provider Management | |
| Platform and Architecture | Architectural Approach Architectural Standards Data Management Platform Data Integration Historical Data and Archiving | |
| Supporting Processes | Measurement and Analytics | |
| Process Management | ||
| Process Quality Assurance | ||
| Risk Management | ||
| Configuration Management | ||
| Data Management Capability Assessment Model (DCAM) [29,32] | Data Management Strategy Data Management Business Case and Funding Model Data Management Program Data Governance Data Architecture Technology Architecture Data Quality Data Operations | |
| IBM Data Governance Council Maturity Model (DGMM) [20,31] | Organizational Structures Stewardship Policy Value Creation Data Risk Management and Compliance Information Security and Privacy Data Architecture Data Quality Management Classification and Metadata Information Lifecycle Management Audit Information, Logging, and Reporting | |
| Stanford Data Governance Maturity Model (Stanford DGMM) [20,31] | Awareness | People, Policies, Capabilities |
| Formalization | ||
| Metadata | ||
| Stewardship | ||
| Data Quality | ||
| Master Data | ||
| Oracle Corporation Model [21] | Data Source Profiling Data Strategy Definition Data Consolidation Plan Definition Data Maintenance Data Utilization | |
| Master Data Management Maturity Model (MD3M) [21,33] | Data Model | Definition of Master Data, Master Data Model, Data Landscape |
| Data Quality | Assessment of Data Quality, Impact on Business, Awareness of Quality Gaps, Improvement | |
| Usage and Ownership | Data Usage, Data Ownership, Data Access | |
| Data Protection | Data Protection | |
| Maintenance | Storage, Data Lifecycle | |
| Dataflux [20,31] | Architecture Governance Management Identification Integration BPM of Master Data | |
| Digital Readiness Assessment Maturity Model (DREAMY) [19] | Technology Internet Connectivity Leadership Equipment/Tools Cloud Storage Skill Requirement Productivity Work Environment Workflow Employee Engagement Data Management Teamwork Knowledge Sharing Decision Making Collaboration Transparency | |
| Digital Maturity based on SCP and DCV [23] | Strategy Market Operations Culture Technology | |
| Data-Driven Organization Maturity Model [24] | Organization Technology Decision Process People Analytics | |
| Data-Drivenness Process Capability Determination Model (DDPCDM) [8] | Change Management Skill and Talent Management Strategic Alignment Sponsorship and Portfolio Management Organizational Learning |
| Nr. | Question | Possible Answers |
|---|---|---|
| 1 | Please enter the name of your company: | Open text answer |
| 2 | Please enter the name of your department: | Open text answer |
| 3 | If you want to receive the results of the present study, please enter your email address: | Open text answer |
| 4 | To which industry does your company belong? | Automotive |
| Chemicals | ||
| Pharma/Life Science | ||
| Consumer Goods, Manufacturers | ||
| Mechanical and Engineering | ||
| Travel Industry | ||
| Other | ||
| 5 | What is the revenue of your company? (in million EUR) | <100 |
| 100–250 | ||
| 251–500 | ||
| 501–1000 | ||
| 1001–5000 | ||
| >5001 | ||
| 6 | What is the size of your company? (Employees) | 1–5000 |
| 5,001–20,000 | ||
| 20,001–50,000 | ||
| 50,001–100,000 | ||
| >100,000 | ||
| 7 | Does your company have a data strategy? | Yes |
| No | ||
| 8 | How much does your data strategy influence your company’s strategic decisions? | Not at all |
| Very weak | ||
| Relatively weak | ||
| Predominantly | ||
| Relatively | ||
| Relatively strong | ||
| Very strong | ||
| 9 | How much does your data strategy influence your daily business? | Not at all |
| Very weak | ||
| Relatively weak | ||
| Predominantly | ||
| Relatively | ||
| Relatively strong | ||
| Very strong | ||
| 10 | How do you assess the added value of your data strategy about your business goals? | Very low (0–10%) |
| Low (11–25%) | ||
| Below average (26–40%) | ||
| Average (41–60%) | ||
| Above average (61–75%) | ||
| High (76–90%) | ||
| Very high (91–100%) | ||
| 11 | How comprehensively are roles and responsibilities related to data implemented in your organization? | Not at all |
| Very weak | ||
| Relatively weak | ||
| Predominantly | ||
| Relatively | ||
| Relatively strong | ||
| Very strong | ||
| 12 | How comprehensively are data processes (e.g., creation of data, use of data) implemented in your company? | Not at all |
| Very weak | ||
| Relatively weak | ||
| Predominantly | ||
| Relatively | ||
| Relatively strong | ||
| Very strong | ||
| 13 | How much is the handling of data influenced by company policies and standards? | Not at all |
| Very weak | ||
| Relatively weak | ||
| Predominantly | ||
| Relatively | ||
| Relatively strong | ||
| Very strong | ||
| 14 | How automated are your data processes (e.g., creation of new master data)? | Not at all |
| Very weak | ||
| Relatively weak | ||
| Predominantly | ||
| Relatively | ||
| Relatively strong | ||
| Very strong | ||
| 15 | To what extent does your company address the issue of data architecture? | Not at all |
| Very weak | ||
| Relatively weak | ||
| Predominantly | ||
| Relatively | ||
| Relatively strong | ||
| Very strong | ||
| 16 | How comprehensively are your metadata processes implemented? | Not at all |
| Very weak | ||
| Relatively weak | ||
| Predominantly | ||
| Relatively | ||
| Relatively strong | ||
| Very strong | ||
| 17 | Do you plan to implement a specific data architecture in your company, or have you already implemented a data architecture? | Yes |
| No | ||
| I don’t know | ||
| 18 | If you answer yes, which one? | Open text answer |
| 19 | How often are decisions made in your organization based on opinions or gut feelings? | Never |
| Hardly | ||
| Rarely | ||
| Occasionally | ||
| Predominantly | ||
| Mostly | ||
| Always | ||
| 20 | How well are your employees trained in data and analytics skills? | Not at all |
| Very weak | ||
| Relatively weak | ||
| Predominantly | ||
| Relatively | ||
| Relatively strong | ||
| Very strong | ||
| 21 | How often are data and analytics used to make decisions in the company? | Never |
| Hardly | ||
| Rarely | ||
| Occasionally | ||
| Predominantly | ||
| Mostly | ||
| Always | ||
| 22 | How often are decisions evaluated retrospectively based on data and analytics? | Never |
| Hardly | ||
| Rarely | ||
| Occasionally | ||
| Predominantly | ||
| Mostly | ||
| Always | ||
| 23 | Would you describe your company as data literate? | Yes |
| No | ||
| 24 | How often do you use data to develop new business models? | Never |
| Hardly | ||
| Rarely | ||
| Occasionally | ||
| Predominantly | ||
| Mostly | ||
| Always | ||
| 25 | How regularly is data quality measured in your company? | Never |
| Hardly | ||
| Rarely | ||
| Occasionally | ||
| Predominantly | ||
| Mostly | ||
| Always | ||
| 26 | How would you rate the current data quality in your company? | Very low (0–10%) |
| Low (11–25%) | ||
| Below average (26–40%) | ||
| Average (41–60%) | ||
| Above average (61–75%) | ||
| High (76–90%) | ||
| Very high (91–100%) | ||
| 27 | How would you rate your company’s business performance in terms of classical financial indicators (sales, revenue) over the past year? | Not at all |
| Very weak | ||
| Relatively weak | ||
| Pre-dominantly | ||
| Relatively | ||
| Relatively strong | ||
| Very strong | ||
| 28 | How do you assess your company’s future competitiveness? | Very low (0–10%) |
| Low (11–25%) | ||
| Below average (26–40%) | ||
| Average (41–60%) | ||
| Above average (61–75%) | ||
| High (76–90%) | ||
| Very high (91–100%) | ||
| 29 | How do you evaluate the innovative power of your company? | Very low (0–10%) |
| Low (11–25%) | ||
| Below average (26–40%) | ||
| Average (41–60%) | ||
| Above average (61–75%) | ||
| High (76–90%) | ||
| Very high (91–100%) | ||
| 30 | How do you rate the employee satisfaction in your company? | Very low (0–10%) |
| Low (11–25%) | ||
| Below average (26–40%) | ||
| Average (41–60%) | ||
| Above average (61–75%) | ||
| High (76–90%) | ||
| Very high (91–100%) | ||
| 31 | How well are you able to understand the needs and requirements of your customers and offer appropriate solutions? | Not at all |
| Very weak | ||
| Relatively weak | ||
| Predominantly | ||
| Relatively | ||
| Relatively strong | ||
| Very strong | ||
| 32 | How much has your company invested in digitalization in recent years? | Not at all |
| Very weak | ||
| Relatively weak | ||
| Predominantly | ||
| Relatively | ||
| Relatively strong | ||
| Very strong | ||
| 33 | How do they assess the degree of digitalization in your company? | Very low (0–10%) |
| Low (11–25%) | ||
| Below average (26–40%) | ||
| Average (41–60%) | ||
| Above average (61–75%) | ||
| High (76–90%) | ||
| Very high (91–100%) | ||
| 34 | If you have further comments or questions, please feel free to share them with us. | Open text answer |
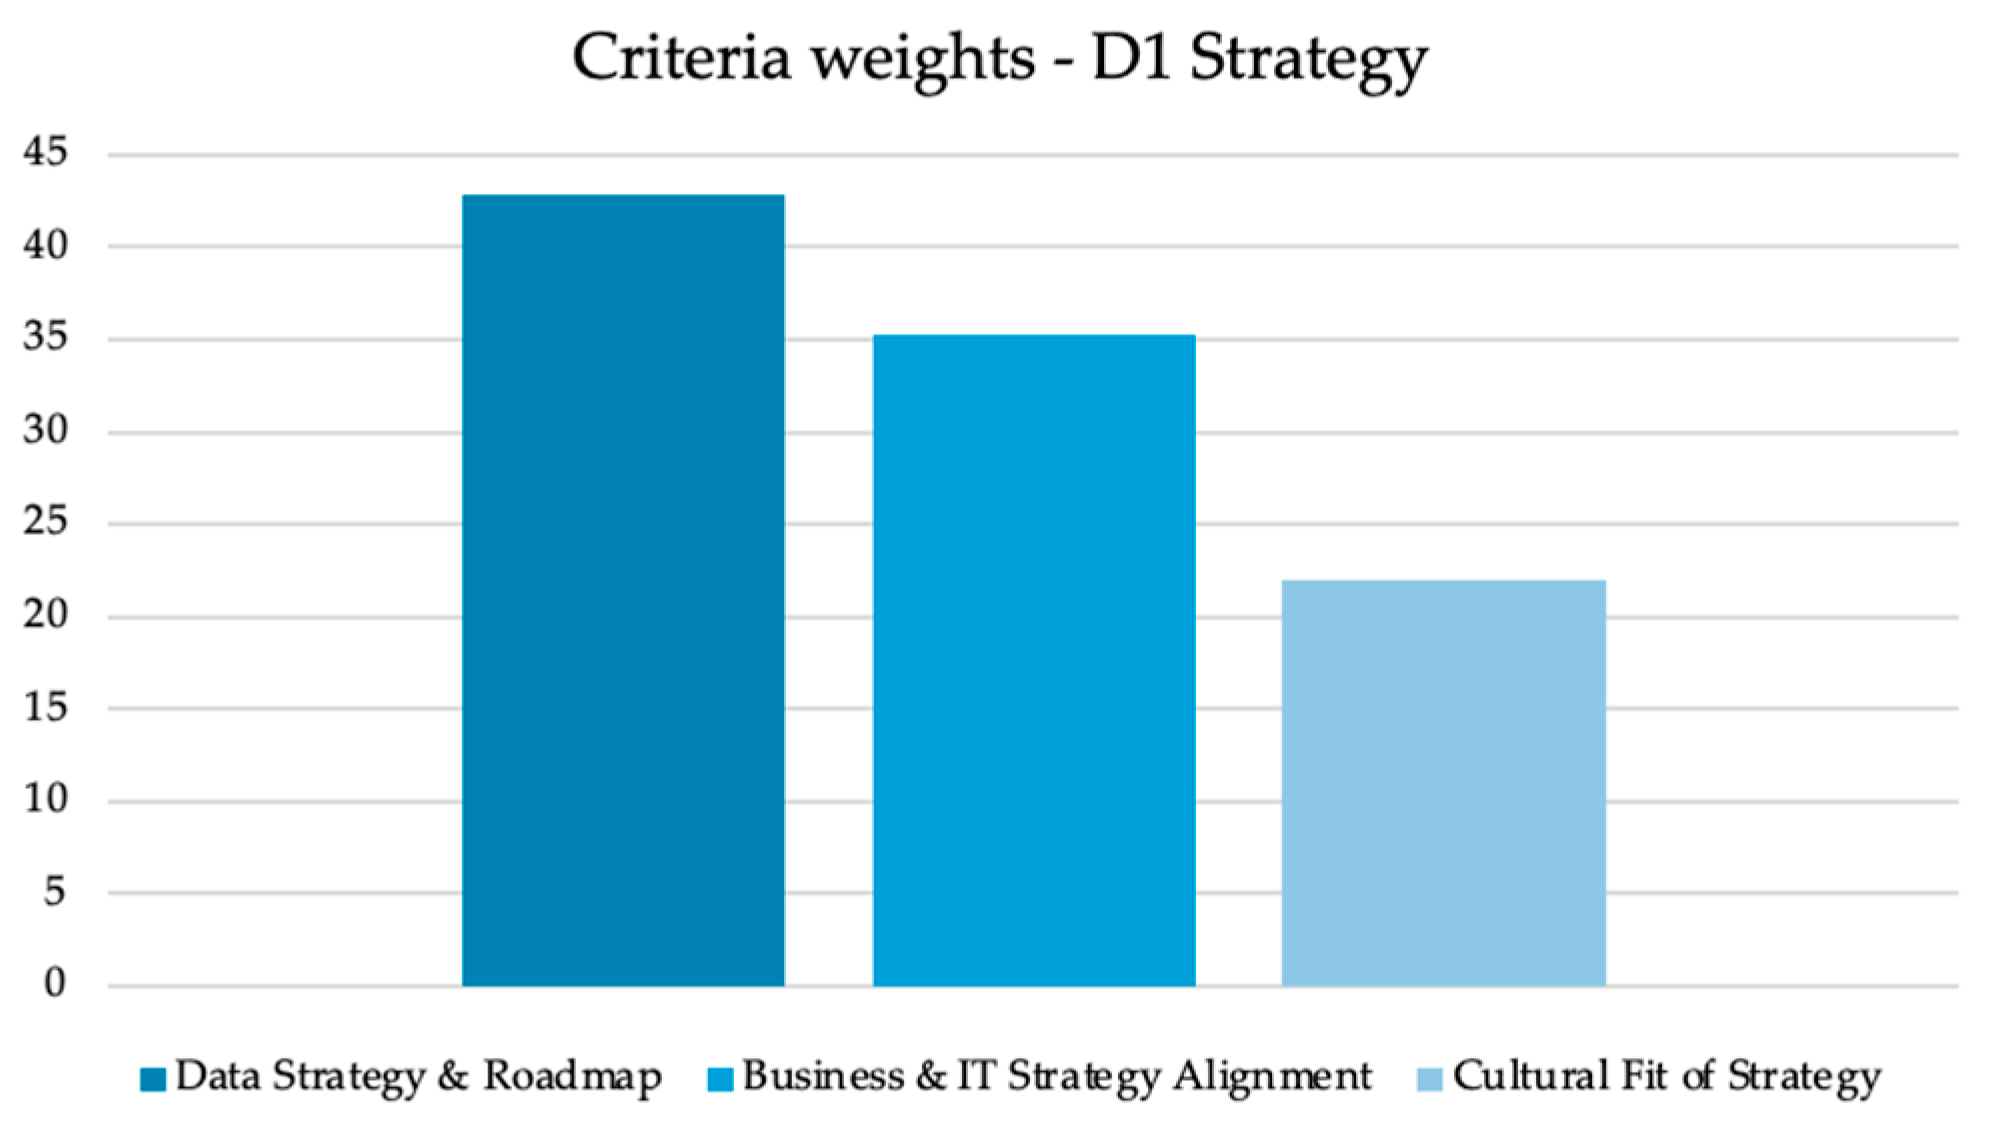
| D1—Strategy | Data Strategy and Roadmap | Business and IT Strategy Alignment | Cultural Fit of Strategy |
|---|---|---|---|
| Data Strategy and Roadmap | 1 | 0.5 | 2 |
| Business and IT Strategy Alignment | 2 | 1 | 2 |
| Cultural Fit of Strategy | 0.5 | 0.5 | 1 |
| D1—Strategy | Data Strategy and Roadmap | Business and IT Strategy Alignment | Cultural Fit of Strategy |
|---|---|---|---|
| Data Strategy and Roadmap | 1 | 1.0699132 | 2.220906 |
| Business and IT Strategy Alignment | 0.9346553 | 1 | 1.414214 |
| Cultural Fit of Strategy | 0.4502667 | 0.7071068 | 1 |
| D1—Strategy | Data Strategy and Roadmap | Business and IT Strategy Alignment | Cultural Fit of Strategy |
|---|---|---|---|
| Data Strategy and Roadmap | 0.7182858 + 0i | 0.7182858 + 0.0000000i | 0.7182858 + 0.0000000i |
| Business and IT Strategy Alignment | 0.5907357 + 0i | −0.2953678 − 0.5115921i | −0.2953678 + 0.5115921i |
| Cultural Fit of Strategy | 0.3675553 + 0i | −0.1837776 + 0.3183122i | −0.1837776 − 0.3183122i |
| Nr. | Question | Possible Answers |
|---|---|---|
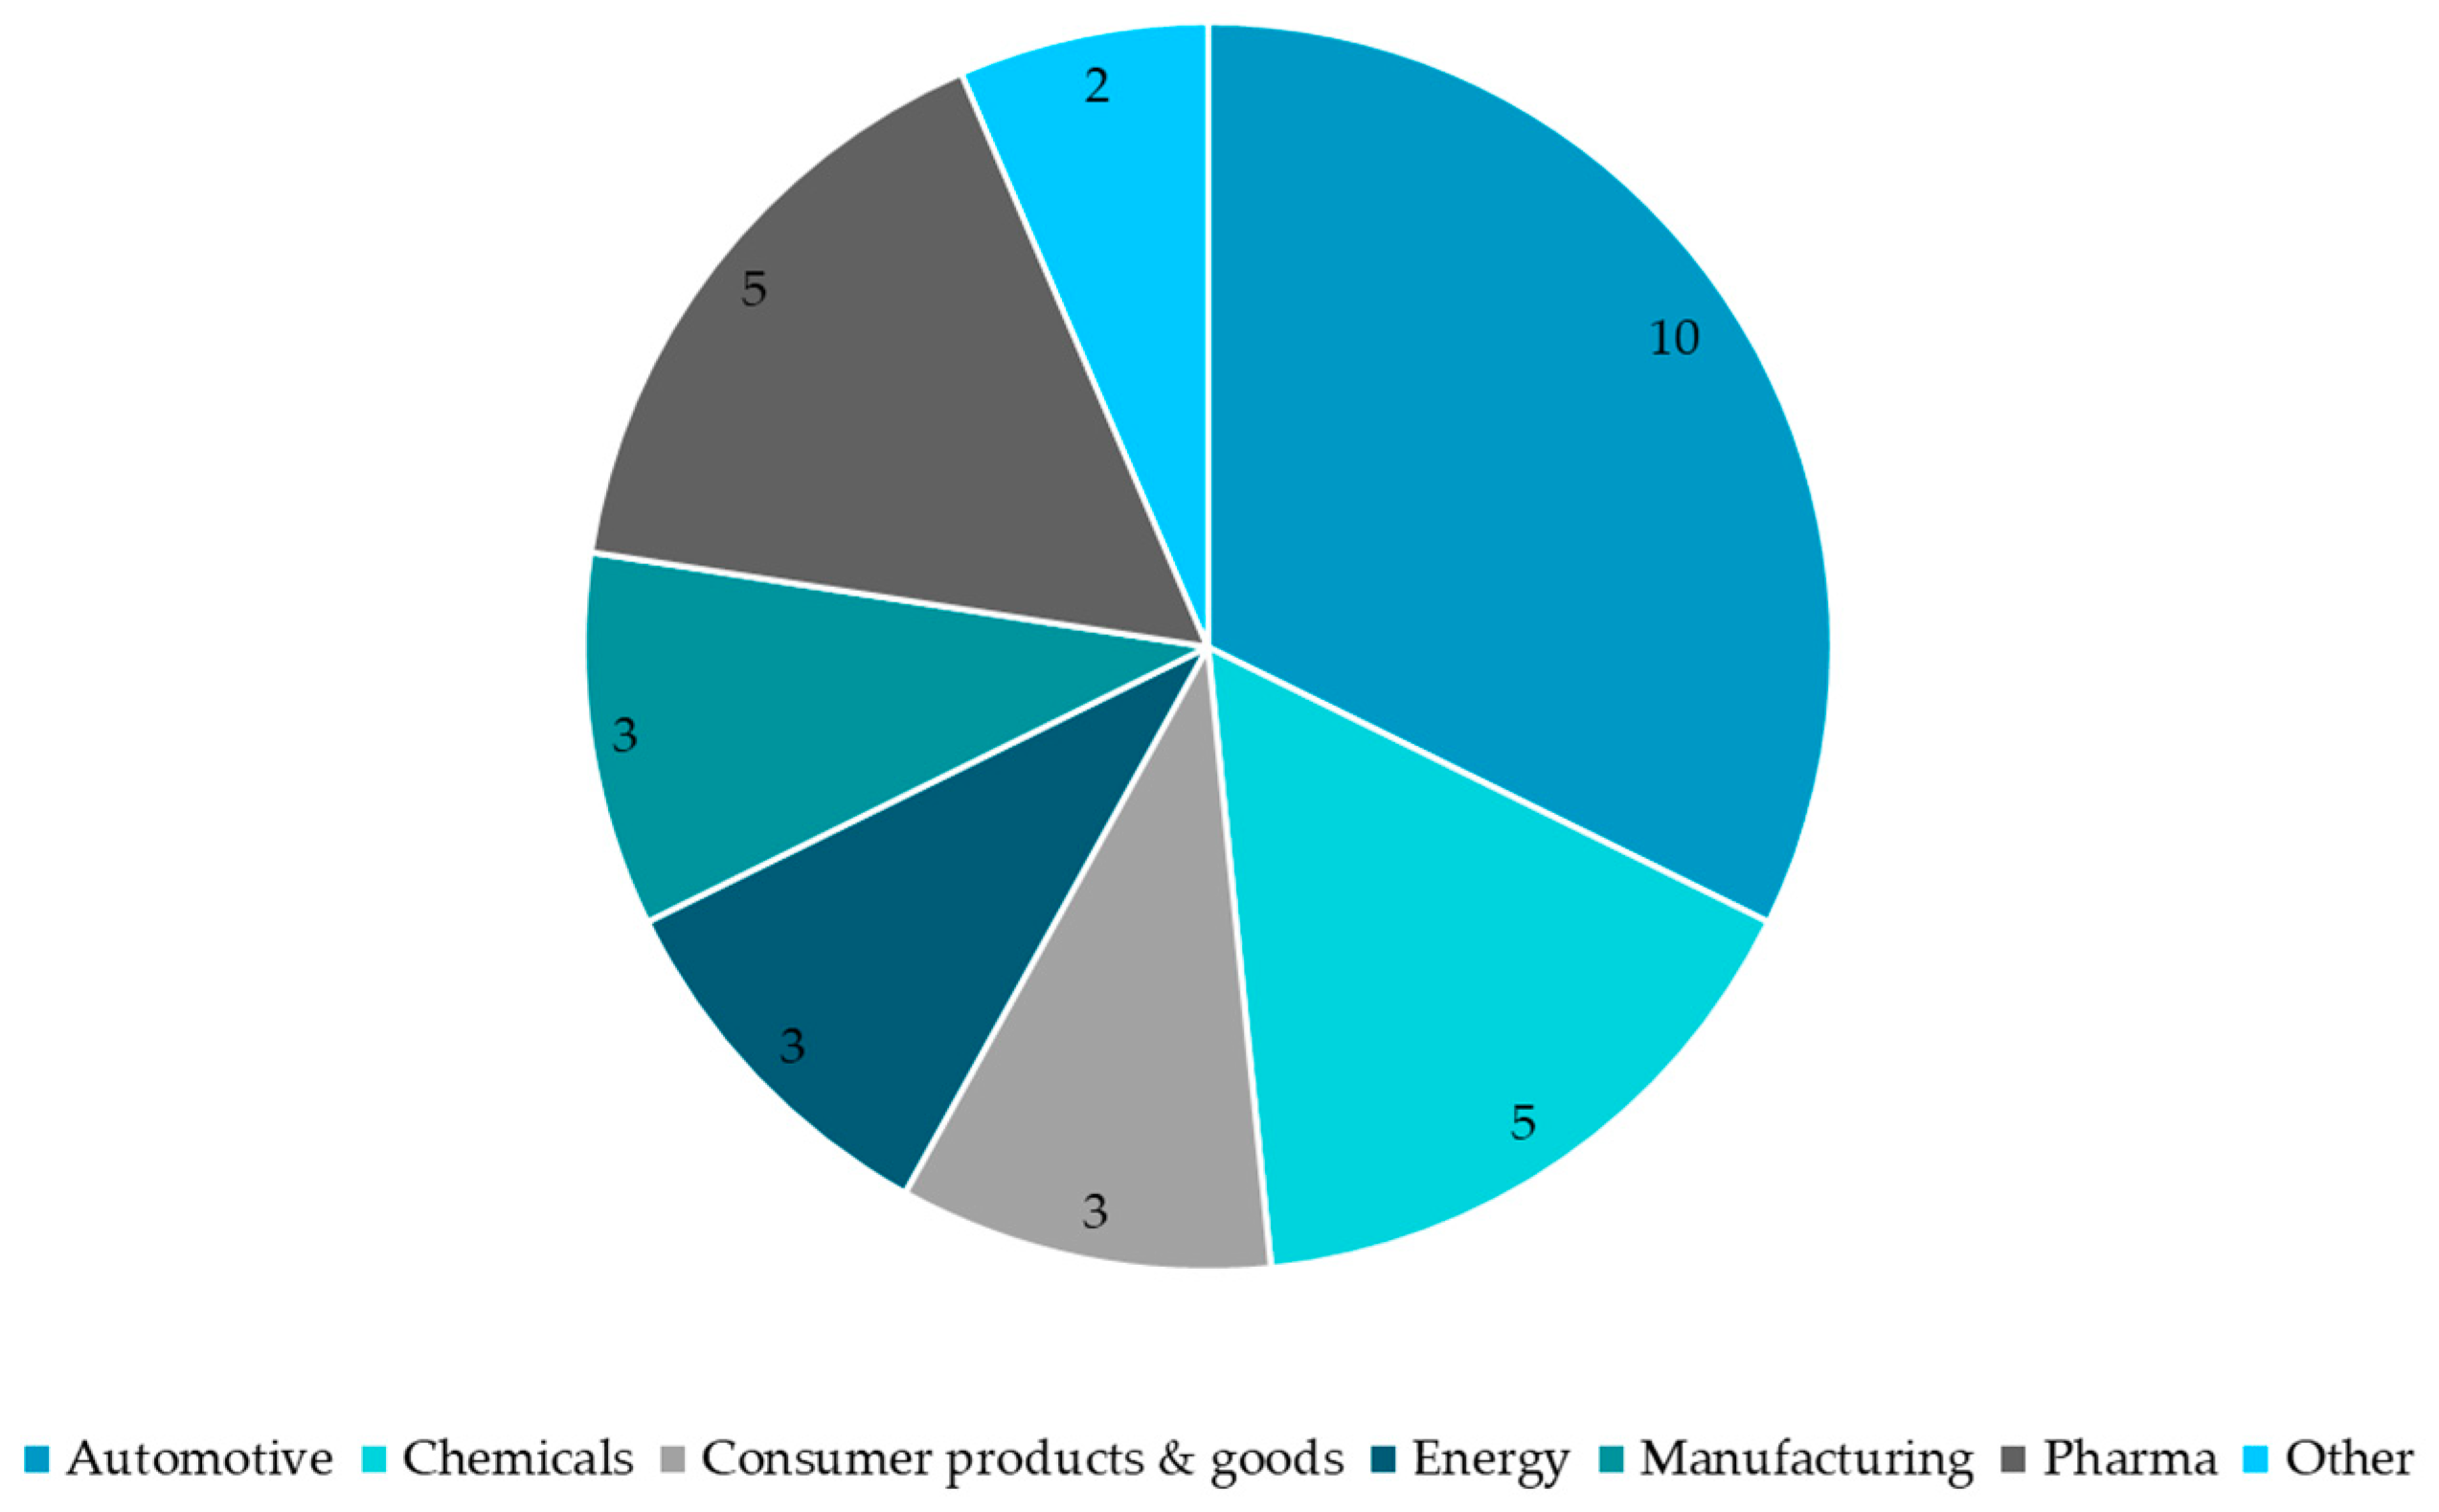
| 1 | Before we start your assessment, we want to know one detail: In which industry are you working? | Pharma |
| Manufacturing | ||
| Automotive | ||
| Consumer products and goods | ||
| Life sciences | ||
| Energy | ||
| Chemicals | ||
| Other | ||
| 2 | Do you want a benchmark with some recommendation for action? Please let us know your mail address below. | Open text answer |
| 3 | How would you describe your data strategy? | 1. Incomplete: no data strategy in place or planned |
| 2. Performed: initiative for establishing a data strategy is planned | ||
| 3. Managed: initiative for a data strategy roadmap started by assessing the current status quo | ||
| 4. Established: a holistic data strategy is defined and communicated—for example: a roadmap and defined working packages | ||
| 5. Predictable: the profound data strategy is integrated into the yearly overarching company strategy process | ||
| 6. Innovating: the data strategy is continuously updated regarding trends/innovations and has a lasting influence for the whole company in terms of value creation | ||
| 4 | How do you rate your organization’s data management processes (data lifecycle, data maintenance, etc.)? | 1. Incomplete: no established lifecycle or maintenance processes; no integration into an end-to-end approach |
| 2. Performed: processes exist, but are not documented/standardized | ||
| 3. Managed: processes exist, but only minimal end-to-end process integration | ||
| 4. Established: some established processes are partially integrated into the end-to-end approach | ||
| 5. Predictable: processes are very well established and almost fully integrated into the end-to-end approach | ||
| 6. Innovating: data processes are not only well defined but actively managed and refined as well as fully integrated into the end-to-end approach, resulting in efficient overall process execution | ||
| 5 | How mature is your data organization and data literacy skills? | 1. Incomplete: no data roles/committees or anything else; no willingness to invest in data resources |
| 2. Performed: a first step into a data organization is planned; some distributed knowledge exists within company | ||
| 3. Managed: future data organization (roles, committees, incl. enablement and training) is conceptualized | ||
| 4. Established: data organization is implemented and communicated; most important stakeholders are enabled | ||
| 5. Predictable: an overarching data organization is in place, the needed enablement is done; a data culture is established | ||
| 6. Innovating: the established data organization is reviewed and adapted continuously; data competencies are spread all over; a data culture is well established and lived within the company | ||
| 6 | How advanced is your data standardization, harmonization, and normalization? | 1. Incomplete: no approach |
| 2. Performed: data has been mapped across key systems | ||
| 3. Managed: initial successful attempts at harmonizing data across some systems | ||
| 4. Established: confirmed process to unify data has tackled main key data objects | ||
| 5. Predictable: advanced process has standardized and harmonized the majority of data across key systems | ||
| 6. Innovating: transparent cross-system data model including standards and guidelines at attribute level | ||
| 7 | Is there a standardized approach for continuous data quality management and data improvement introduced? | 1. Incomplete: no standardized approach |
| 2. Performed: some occasional initiatives were/are started to improve data and its quality, but no systematic approach | ||
| 3. Managed: standardized data quality management process and data improvement process are planned and conceptualized | ||
| 4. Established: settled approach with some ongoing data quality management and improvement | ||
| 5. Predictable: data quality management and continuous data improvement are actively managed and standardized enterprise-wide | ||
| 6. Innovating: data quality management and continuous data improvement is used to gain a huge competitive advantage | ||
| 8 | How managed is the integration among diverse systems (data context), and is there a structured interface in place? | 1. Incomplete: system integration/consolidation is infancy, with little coordination or comprehensive planning |
| 2. Performed: some initial efforts in system integration/consolidation | ||
| 3. Managed: system integration/consolidation is showing signs of thoughtful consideration but lacks full coordination | ||
| 4. Established: system integration/consolidation efforts are well thought out and coordinated, but there is room for improvement in terms of comprehensiveness | ||
| 5. Predictable: system integration/consolidation is well planned and coordinated and exhibits a comprehensive approach | ||
| 6. Innovating: system integration and interfaces are highly mature, with optimal planning, coordination, and a comprehensive approach to meet business goals | ||
| 9 | How does your organization enable the value generation through innovation, automation, and AI/data use case management? | 1. Incomplete: no initiative that guides through innovation or a data value generation process |
| 2. Performed: innovation and automation or some AI use cases are in discussion anywhere in the organization, but only few people are informed | ||
| 3. Managed: somewhere within the company, processes for ideating and developing innovative data solutions exist but are not standardized | ||
| 4. Established: based on market research and/or (customer) needs, innovative data methods/solutions (e.g., AI, automation, etc.) are used within the whole company | ||
| 5. Predictable: a structured approach to identify value generating data methods/solutions (incl. use case management) is established organization-wide | ||
| 6. Innovating: highly structured process actively enables value generation through innovation, automation, and the ideation and development of data and AI use cases | ||
| 10 | Which data topics would you rank the most important (and needed) within your company? Rank between 0 and 10 possible | Data-driven decision making |
| Data analytics and AI | ||
| Master data management | ||
| Data governance and organization | ||
| Data strategy and roadmap | ||
| Data quality | ||
| Meta data management | ||
| Data literacy and coaching | ||
| Automation and workflows | ||
| Reference data management | ||
| 11 | What are the three biggest challenges in the context of data you are dealing with? Please name and rank them. | Open text answer (rank nr. 1) |
| Open text answer (rank nr. 2) | ||
| Open text answer (rank nr. 3) |
References
- Provost, F.; Fawcett, T. Data Science and its Relationship to Big Data and Data-Driven Decision Making. Big Data 2013, 1, 51–59. [Google Scholar] [CrossRef] [PubMed]
- Kim, M. Software Engineering for Data Analytics. IEEE Softw. 2020, 37, 36–42. [Google Scholar] [CrossRef]
- Big Data, Analytics and the Path from Insights to—ProQuest. Available online: https://www.proquest.com/docview/845235605?pq-origsite=gscholar&sourcetype=Scholarly%20Journals (accessed on 18 February 2025).
- Hupperz, M.; Gür, I.; Möller, F.; Otto, B. What is a Data-Driven Organization? In Proceedings of the Twenty-Seventh Americas Conference on Information Systems, Online, 9–13 August 2021. [Google Scholar]
- Sarshar, M.; Finnemore, M.; Haigh, R.; Goulding, J. Spice: Is a Capability Maturity Model Applicable in the Construction Industry? Institute for Research in Construction: Ottawa ON, Canada, 1999; p. 9. [Google Scholar]
- Baolong, Y.; Hong, W.; Haodong, Z. Research and application of data management based on Data Management Maturity Model (DMM). In Proceedings of the 2018 10th International Conference on Machine Learning and Computing, Macau, China, 26–28 February 2018; ACM: Macau, China, 2018; pp. 157–160. [Google Scholar] [CrossRef]
- ISO/IEC 15504-5:2012; Information Technology—Process Assessment. IOP: Bristol, UK, 2012. Available online: https://www.iso.org/cms/render/live/en/sites/isoorg/contents/data/standard/06/05/60555.html (accessed on 8 August 2024).
- Gökalp, M.O.; Kayabay, K.; Gökalp, E.; Koçyiğit, A.; Eren, P.E. Assessment of process capabilities in transition to a data-driven organisation: A multidisciplinary approach. IET Softw. 2021, 15, 376–390. [Google Scholar] [CrossRef]
- Pörtner, L.; Möske, R.; Riel, A. Data Management Strategy Assessment for Leveraging the Digital Transformation: A Comparison Between Two Models: DX-CMM and Camelot DMM. In Systems, Software and Services Process Improvement; Yilmaz, M., Clarke, P., Messnarz, R., Wöran, B., Eds.; Springer International Publishing: Cham, Switzerland, 2022; pp. 553–567. [Google Scholar]
- Luber, S. Was ist Data Management/Datenmanagement? Available online: https://www.storage-insider.de/was-ist-data-managementdatenmanagement-a-850258/ (accessed on 1 September 2024).
- Was ist Datenmanagement?|Definition, Bedeutung, Prozesse|SAP Insights. SAP. Available online: https://www.sap.com/germany/products/technology-platform/what-is-data-management.html (accessed on 18 February 2024).
- Otto, B.; KHüner, M.; Österle, D.H. Funktionsarchitektur für Unternehmensweites Stammdatenmanagement; Institut für Wirtschaftsinformatik, Universität St. Gallen: St. Gallen, Switzerland, 2009; p. 69. [Google Scholar]
- Scheuch, R.; Gansor, T.; Ziller, C. Master Data Management: Strategie, Organisation, Architektur; dpunkt.verlag: Heidelberg, Germany, 2012; ISBN 978-3-86491-165-1. [Google Scholar]
- de Bruin, T.; Freeze, R.; Kulkarni, U.; Rosemann, M. Understanding the Main Phases of Developing a Maturity Assessment Model. In Proceedings of the ACIS 2005, Jeju Island, Republic of Korea, 14–16 July 2005. [Google Scholar]
- Packowski, J. (Ed.) Strategic Master Data Management: Prerequisite for Agile and Efficinet Business Processes; Study Findings; Camelot Management Consultants AG: Mannheim, Germany, 2012. [Google Scholar]
- Azizan, S.; Ismail, R.; Baharum, A.; Hidayah Mat Zain, N. Exploring the Factors That Influence the Success of Digitalization in an Organization’s IT Department. In Proceedings of the 2021 6th IEEE International Conference on Recent Advances and Innovations in Engineering (ICRAIE), Kedah, Malaysia, 1–3 December 2021; Volume 6, pp. 1–6. [Google Scholar] [CrossRef]
- International Assessor Certification Scheme e.V. (Intacs). Data Management SPICE; International Assessor Certification Scheme e.V. (Intacs): Köln, Germany, 2022. [Google Scholar]
- DMMM: Data Management Maturity Model|IEEE Conference Publication|IEEE Xplore. Available online: https://ieeexplore.ieee.org/document/9635003 (accessed on 8 August 2024).
- Ko, C.; Adywiratama, A.D.; Hidayanto, A.N. Master Data Management Maturity Model (MD3M) Assessment: A Case Study in Secretariat of Presidential Advisory Council. In Proceedings of the 2021 9th International Conference on Information and Communication Technology (ICoICT), Yogyakarta, Indonesia, 3–5 August 2021; pp. 359–363. [Google Scholar] [CrossRef]
- Kurniawan, D.H.; Ruldeviyani, Y.; Adrian, M.R.; Handayani, S.; Pohan, M.R.; Khairunnisa, T.R. Data Governance Maturity Assessment: A Case Study in IT Bureau of Audit Board. In Proceedings of the 2019 International Conference on Information Management and Technology (ICIMTech), Bali, Indonesia, 19–20 August 2019; Volume 1, pp. 629–634. [Google Scholar] [CrossRef]
- Iqbal, R.; Yuda, P.; Aditya, W.; Hidayanto, A.N.; Wuri Handayani, P.; Harahap, N.C. Master Data Management Maturity Assessment: Case Study of XYZ Company. In Proceedings of the 2019 2nd International Conference on Applied Information Technology and Innovation (ICAITI), Bali, Indonesia, 21–22 September 2019; pp. 133–139. [Google Scholar] [CrossRef]
- Pinto, M.R.; Salume, P.K.; Barbosa, M.W.; de Sousa, P.R. The path to digital maturity: A cluster analysis of the retail industry in an emerging economy. Technol. Soc. 2023, 72, 102191. [Google Scholar] [CrossRef]
- Nyonawan, M.; Suharjito; Utama, D.N. Evaluation of Information Technology Governance in STMIK Mikroskil Using COBIT 5 Framework. In Proceedings of the 2018 International Conference on Information Management and Technology (ICIMTech), Jakarta, Indonesia, 3–5 September 2018; pp. 137–142. [Google Scholar] [CrossRef]
- Berndtsson, M.; Forsberg, D.; Stein, D.; Svahn, T. Becoming a data-driven organisation. In Proceedings of the 26th European Conference on Information Systems: Beyond Digitization—Facets of Socio-Technical Change, Portsmouth, UK, 23–28 June 2018; Association for Information Systems: Atlanta, GA, USA, 2018. [Google Scholar]
- ISO/IEC 33002:2015; Information Technology—Process Assessment—Requirements for Performing Process Assessment. VDE VERLAG: Berlin, Germany, 2015. Available online: https://www.vde-verlag.de/iec-normen/221509/iso-iec-33002-2015.html (accessed on 18 February 2025).
- Mühlbacher, A.C.; Kaczynski, A. Der Analytic Hierarchy Process (AHP): Eine Methode zur Entscheidungsunterstützung im Gesundheitswesen. PharmacoEcon. Ger. Res. Artic. 2013, 11, 119–132. [Google Scholar] [CrossRef]
- Peters, M.L.; Zelewski, S. Analytical Hierarchy Process (AHP)—Dargestellt am Beispiel der Auswahl von Projektmanagement-Software zum Multiprojektmanagement; Arbeitsbericht Nr. 14; University of Duisburg-Essen: Essen, Germany, 2022. [Google Scholar]
- Golden, B.L.; Wang, Q. An Alternate Measure of Consistency. In The Analytic Hierarchy Process: Applications and Studies; Golden, B.L., Wasil, E.A., Harker, P.T., Eds.; Springer: Berlin/Heidelberg, Germany, 1989; pp. 68–81. ISBN 978-3-642-50244-6. [Google Scholar]
- Belghith, O.; Skhiri, S.; Zitoun, S.; Ferjaoui, S. A Survey of Maturity Models in Data Management. In Proceedings of the 2021 IEEE 12th International Conference on Mechanical and Intelligent Manufacturing Technologies (ICMIMT), Cape Town, South Africa, 13–15 May 2021; pp. 298–309. [Google Scholar]
- Smith, A. Enterprise Information Management Maturity: Data Governance’s Role—Enterprise Information Management Institute; EIM Institute: Valletta, Malta, 2009; Available online: http://www.eiminstitute.org/library/eimi-archives/volume-3-issue-1-january-2009-edition/EIM-Maturity/ (accessed on 1 July 2024).
- Data Strategy Professionals. Available online: https://www.datastrategypros.com/resources/data-management-maturity-assessment-dmma (accessed on 1 July 2024).
- Data Management—DCAM—EDM Council. Available online: https://edmcouncil.org/frameworks/dcam/ (accessed on 2 July 2024).
- Spruit, M.; Pietzka, K. MD3M: The master data management maturity model. Comput. Hum. Behav. 2015, 51, 1068–1076. [Google Scholar] [CrossRef]


| Key Elements | ||
|---|---|---|
| Data-Driven Organization | Digital Transformation (K1) | Strategy (C11) Data-driven culture (C12) Business ecosystem (C13) |
| Data Science (K2) | IT Professionals (C21) Add value (C22) Competitive advantage (C23) | |
| Data-Driven Business Model (K3) | Demand (C31) BM development (C32) Value creation (C33) | |
| Data-Driven Innovation (K4) | Big data (C41) R&D (C42) Business insights (C43) | |
| Data Analytics (K5) | Descriptive (C51) Predictive (C52) Prescriptive (C53) | |
| Maturity Measurement | Use of Capabilities | The Concept for the Analysis of As-Is and To-Be Status | Development of a Roadmap for Recommendations for Action | Use of an Assessment Tool | Maturity Assessment Based on a Questionnaire | Calculation of the Maturity Level |
|---|---|---|---|---|---|---|
| [16,18,19,20,21,22,23,24] | [16,18,19,20,21,22,23,24] | [18,23] | [8,19,22] | [18,20] | [18,19,20,21,22,23] | [16,18,23] |
| Data Management Maturity Model (CMMI) | Proposed Model | Differences/Additional Complements of Proposed Model |
|---|---|---|
| Data Management Strategy Data Management Strategy Communications Data Management Function Business Case Funding | Strategy Data strategy and roadmap Business and IT strategy alignment Cultural fit of strategy | Communications and Funding are included in the organization dimension. |
| Data Governance Governance Management Business Glossary Metadata Management | Organization Sponsoring and communication Governance processes Roles and responsibilities Organizational target picture Data committees Enablement and coaching | The organization dimension not only tackles the topic of data governance with its processes but also the organizational target picture, structures, and skillset of people (enablement and coaching). |
| Data Quality Data Quality Strategy Data Profiling Data Quality Assessment Data Cleansing | Data Data standardization/harmonization/normalization Data visualization Data accessibility Data-driven decision-making Data catalog/data dictionary Data architecture Data quality | The data dimension not only deals with data quality per se but also covers topics ranging from data access, modelling, visualization, and storage to data-driven decision-making skills. |
| Data Operations Data Requirements Definition Data Lifecycle Management Provider Management | Processes Maintenance processes and E2E approach Status and lifecycle management Continuous improvement process Automatization and digitalization Data cleansing and migration | The processes dimension deals precisely with maintenance processes and the life cycle management with its improvement process. In addition, data cleansing and migration are prescribed in this dimension. Automation and digitalization topics are also covered here. |
| Platform and Architecture Architectural Approach Architectural Standards Data Management Platform Data Integration Historical Data, Archiving, and Retention | Architecture System architecture System integration/consolidation Workflow tool DQM and reporting tools Automation and innovative technologies Architecture development | The architecture dimension covers additionally innovative topics such as automation and innovative technologies. |
| Supporting Processes Measurement and Analyses Process Management Process Quality Assurance Risk Management Configuration Management | Operations, Support, and Innovation Support Innovation strategy and roadmap Innovation applications and methods Innovation process Data and AI use cases | The operations, support, and innovation dimension has a strong focus on innovative topics and data and AI use cases. It does not specifically cover risk, process, or configuration management. |
| # | Question | Level | Answer Option Depending on the Level |
|---|---|---|---|
| 1 | How would you describe your data strategy? | 1 | Incomplete: The organization lacks a defined or planned data strategy for the foreseeable future. |
| 2 | Performed: An initiative is underway to establish a data strategy, albeit without a clearly defined roadmap. | ||
| 3 | Managed: Efforts are underway to develop a comprehensive data strategy roadmap by conducting an assessment of the current data landscape. | ||
| 4 | Established: A robust data strategy has been formulated, encompassing a detailed roadmap and specific action items to lay the groundwork for future initiatives. | ||
| 5 | Predictable: The data strategy undergoes yearly review and refinement as part of an ongoing process of continuous improvement. | ||
| 6 | Innovating: The data strategy is implemented continuously and has a profound, long-lasting impact on the entire organization’s value-creation efforts. | ||
| 2 | To what extent are the business, data, and strategy aligned? | 1 | Incomplete: The absence of a communicated data strategy leaves stakeholders uninformed. |
| 2 | Performed: Plans are in place to align data, business, and IT strategies, though communication remains pending. | ||
| 3 | Managed: Alignment between data and business strategies has commenced, accompanied by targeted communication efforts. | ||
| 4 | Established: The current data strategy aligns with the overarching business strategy, with effective communication channels established. | ||
| 5 | Predictable: Data considerations are seamlessly integrated into the annual company-wide strategy review and adjustment processes. | ||
| 6 | Innovating: The overarching data strategy actively facilitates and enhances alignment with the company’s business strategy through continuous communication and management. | ||
| 3 | To what degree do the data (and business) strategy fit the company culture? | 1 | Incomplete: The prevailing company culture does not accommodate a data strategy. |
| 2 | Performed: Plans are underway to align the future data strategy with the organization’s cultural ethos. | ||
| 3 | Managed: Initial efforts to integrate company culture within the data strategy framework are in progress. | ||
| 4 | Established: The data strategy is harmonized with the existing cultural fabric of the organization. | ||
| 5 | Predictable: Cultural alignment forms an integral part of the annual strategy review, ensuring cohesion between data strategy and organizational culture. | ||
| 6 | Innovating: Ongoing strategy reviews actively foster a supportive data culture within the company, driving innovation and alignment. |
| N = 20 Spearman-Rho * | Innovative Power (Q29) | Data Processes (Q12) | Future Competitiveness (Q28) | Data- Literate Organization (Q23) | New Business Models (Q24) | Automated Processes (Q14) | Invest Data Architecture | Employee Trained (Q20) | Gut Feelings (Q19) | |
| Invest in Digitalization (Q32) | 0.316 | 0.431 | 0.432 | 0.029 | 0.523 | 0.279 | 0.423 | 0.326 | −0.595 |
| Strategy (Q9) | Processes (Q12) | Organization (Q11) | Data (Q26) | Architecture (Q15) | Operations, Support, and Innovation (Q29) | |
|---|---|---|---|---|---|---|
| Strategy (Q9) | 0.61 p-value 0.004 | 0.648 p-value 0.001 | 0.299 p-value 0.201 | 0.739 p-value 0.0002 | 0.274 p-value 0.243 | |
| Processes (Q12) | 0.61 | 0.719 p-value 0.0004 | 0.265 p-value 0.259 | 0.746 p-value 0.0002 | 0.016 p-value 0.946 | |
| Organization (Q11) | 0.648 | 0.719 | 0.44 p-value 0.052 | 0.759 p-value 0.0001 | 0.235 p-value 0.318 | |
| Data (Q26) | 0.299 | 0.265 | 0.44 | 0.450 p-value 0.046 | 0.651 p-value 0.002 | |
| Architecture (Q15) | 0.739 | 0.746 | 0.759 | 0.450 | 0.335 p-value 0.149 | |
| Operations, Support, and Innovation (Q29) | 0.274 | 0.016 | 0.235 | 0.651 | 0.335 |
| # | Process Dimension | CI |
|---|---|---|
| D1 | Strategy | 1.07 |
| D2 | Processes | 0.75 |
| D3 | Organization | 0.48 |
| D4 | Data | 0.62 |
| D5 | IT Architecture | 0.27 |
| D6 | Operations, Support, and Innovation | 0.23 |
| Dimensions | Challenges | Capabilities |
|---|---|---|
| D1 Strategy | Aligned strategy becoming a data-driven organization Missing end-to-end strategy The value of data is not recognized widely Overcome thinking in silos | Data strategy and roadmap |
| Aligned strategy becoming a data-driven organization | Business and IT strategy alignment | |
| Data culture not established Aligned strategy becoming a data-driven organization | Cultural fit of strategy | |
| D2 Processes | End-to-end cross-platform business processes | Maintenance processes and E2E approach |
| Status and life cycle management | ||
| Continuous improvement process | ||
| No automation | Automation and digitalization | |
| Data cleansing | Data cleansing and migration | |
| D3 Organization | Data culture not established The value of data is not recognized widely Business empowerment | Sponsoring and communication |
| Governance structures Overcome thinking in silos | Governance processes | |
| Data ownership Governance structures Absence of data literacy on an organizational level | Roles and responsibilities | |
| Governance structures Overcome thinking in silos | Organizational target picture | |
| Governance structures | Data committees | |
| Data culture not established Absence of data literacy on organizational level Business empowerment Quality Overcome thinking in silos | Enablement and coaching | |
| D4 Data | Data harmonization | Data harmonization |
| Data visualization | ||
| Data distribution across units Data access | Data accessibility | |
| Data-driven decision making and reporting | ||
| Data dictionary | ||
| Data distribution across units Overcome thinking in silos | Data architecture | |
| Quality | Data quality | |
| D5 Architecture | Integration Interfaces Heterogenous application landscape Overcome thinking in silos | System architecture |
| Integration | System integration/consolidation | |
| Workflow tool | ||
| Data quality management and reporting tools | ||
| Automation and innovative technologies | ||
| Architecture development | ||
| D6 Operations, Support, and Innovation | Support | |
| Innovation strategy and roadmap | ||
| Innovation applications and methods | ||
| Innovation process | ||
| Data and AI use cases |
Disclaimer/Publisher’s Note: The statements, opinions and data contained in all publications are solely those of the individual author(s) and contributor(s) and not of MDPI and/or the editor(s). MDPI and/or the editor(s) disclaim responsibility for any injury to people or property resulting from any ideas, methods, instructions or products referred to in the content. |
© 2025 by the authors. Published by MDPI on behalf of the International Institute of Knowledge Innovation and Invention. Licensee MDPI, Basel, Switzerland. This article is an open access article distributed under the terms and conditions of the Creative Commons Attribution (CC BY) license (https://creativecommons.org/licenses/by/4.0/).
Share and Cite
Pörtner, L.; Riel, A.; Schmidt, B.; Leclaire, M.; Möske, R. Data Management Maturity Model—Process Dimensions and Capabilities to Leverage Data-Driven Organizations Towards Industry 5.0. Appl. Syst. Innov. 2025, 8, 41. https://doi.org/10.3390/asi8020041
Pörtner L, Riel A, Schmidt B, Leclaire M, Möske R. Data Management Maturity Model—Process Dimensions and Capabilities to Leverage Data-Driven Organizations Towards Industry 5.0. Applied System Innovation. 2025; 8(2):41. https://doi.org/10.3390/asi8020041
Chicago/Turabian StylePörtner, Lara, Andreas Riel, Benedikt Schmidt, Marcel Leclaire, and Robert Möske. 2025. "Data Management Maturity Model—Process Dimensions and Capabilities to Leverage Data-Driven Organizations Towards Industry 5.0" Applied System Innovation 8, no. 2: 41. https://doi.org/10.3390/asi8020041
APA StylePörtner, L., Riel, A., Schmidt, B., Leclaire, M., & Möske, R. (2025). Data Management Maturity Model—Process Dimensions and Capabilities to Leverage Data-Driven Organizations Towards Industry 5.0. Applied System Innovation, 8(2), 41. https://doi.org/10.3390/asi8020041