Article

Future Circular Lepton Collider Vibrational Crosstalk

by
Purinut Lersnimitthum
1,
Audrey Piccini
2,
Federico Carra
2,
Tirawat Boonyatee
3,
Niphon Wansophark
1 and
Nopdanai Ajavakom
1,*
1
Department of Mechanical Engineering, Chulalongkorn University, Bangkok 10330, Thailand
2
European Organization for Nuclear Research, European Organization for Nuclear Research (CERN), 1217 Meyrin, Switzerland
3
Department of Civil Engineering, Chulalongkorn University, Bangkok 10330, Thailand
*
Author to whom correspondence should be addressed.
Vibration 2024, 7(4), 912-927; https://doi.org/10.3390/vibration7040048
Submission received: 25 June 2024 / Revised: 22 August 2024 / Accepted: 27 August 2024 / Published: 4 October 2024

Abstract

:
CERN, the European Organisation for Nuclear Research is studying the feasibility of the Future Circular Collider, considering both financial and technical aspects. One of the challenges is that the performance of particle accelerators relies on the dynamic stability of structures, affected by multiple sources of vibrations, including crosstalk vibration between two particle accelerators, the Booster and Collider, in the Future Circular Lepton Collider. This research aims to find a methodology for determining transfer functions, specifically crosstalk transfer functions, between the Collider and Booster within an underground tunnel. Also, it aims to determine how significant crosstalk is compared to the vibration from other sources, such as ground vibrations. The transfer functions of the tunnel were independently determined from internal structures using the Finite Element Method, employing 2D plane strain and the standard absorbing boundary to model the underground tunnel. It was found that the overall gain of crosstalk was less than 10% of that of ground-to-magnetic axis of either the Collider or Booster. This method may be used to optimize the tunnel layout from a vibration point of view. It appears that vibrations from crosstalk are far lower compared to vibrations from ground vibrations.

1. Introduction

The Future Circular Collider (FCC) has been under study in financial and technical aspects since 2013. It aims to receive feasibility approval in 2025/26. The FCC project is divided into two stages. The first stage of the FCC is to build an electron–positron collider. This machine is called the Future Circular Lepton Collider (FCC-ee). In the second stage, called the Future Circular Hadron Collider (FCC-hh), the lepton collider will be replaced with the hadron collider (see FCC Feasibility Study Status by Benedikt in FCC week 2023 [1]). The FCC-ee adopts the double-ring design, which requires two particle accelerators—Booster and Collider [2]—with a total circumference of around 91 km. Of this, approximately 77 km consists of 3000 repetitive elements known as “arc half-cells” (Figure 1a). In the Short Straight Section (SSS), where the mass of the arc half-cells concentrates the most, the Collider’s Quadrupole and Sextupoles mount on the Collider’s girders and Jack supports. Above the Collider, the Booster’s Quadrupole and Sextupole sit on the I-beam structure (Booster’s support). These structures are fixed to an underground tunnel.
Due to the sharing of the Booster and Collider in the same tunnel (Figure 1b), it is essential to optimize their configuration (i.e., the placement of pipe, wire, supporting systems, Collider, Booster, and other equipment in the tunnel). The optimization of the configuration involves many factors, such as radiation, integration, vibration, etc. Vibrations have a significant effect on the particle accelerator’s performance, as they can lead to the missed beam interaction point (IP) [3] and beam loss [4]. Additionally, vibrations contribute to emittance growth, which results in a reduction in luminosity [3]. The dynamic stability of a structure, the ability to maintain stillness when subjected to vibrations, is a critical concern. Attaining dynamic stability clearly requires the identification and mitigation of each vibration source individually. These vibrations come from many different sources. For instance, natural sources (e.g., ocean and valley) typically have frequencies below 1 Hz, while cultural noises (e.g., human activities, pumps, ventilation, water pipes, other machines, structural resonances, and vehicles) usually have frequencies above 1 Hz. Moreover, the vibration generated from the Booster can diminish the dynamic stability of the collider, and vice versa. This phenomenon is called “vibrational crosstalk”.
Figure 1. (a) FCC-ee arc half-cell, i.e., the most repeated parts in the tunnel, in which the Short Straight Section (SSS) of the Collider and Booster are located. (b) The cross-section of the tunnel used in this analysis where the arc is fixed inside. Unit is in mm. (Adapted from [5,6]).
Vibration 07 00048 g001
In the design procedures, many designs of the support and the tunnel layout are currently being studied. The Finite Element Analysis (FEA) has been used to evaluate the designs. Carra, Baudin, et al. (2022) [7] proposed configurations of the FCC-ee arc half-cell involving many aspects of optimization including dynamic stability and vibrations. The vibration and dynamic stability evaluation process, including vibrational crosstalk, was also described. The dynamic stability analysis was presented at the FCC Week 2023 conference by Piccini, Carra, et al. [1]. The details are about the Finite Element (FE) model of the Collider which is used to assess the response of the particle accelerator due to ground motion. It is the vibration from natural sources and cultural noise but not from components that will be installed in the tunnel such as waterpipes, ventilations, and crosstalk vibration. Carra, Baudin, et al. (2024) [8] explained the preliminary design concepts consisting of many aspects of arc configuration optimization, the various designs of the supporting system which relate to vibration minimization, and guidelines to assess the dynamic stability. From these articles many FEAs of the supporting systems were implemented to assess the dynamic stability due to the ground vibration; however, the vibrational crosstalk has yet to be studied.
The vibrational crosstalk involves vibration transmission to the tunnel. Thus, the FEA of the underground tunnel has to be implemented. There are many studies on FE model implementation. Hatzigeorgiou and Beskos (2010) [9] studied soil–structure interaction subjected to seismic load. Guo, Xu, et al. (2022) [10] studied the dynamic response of the tunnel and soil layer under the tunnel induced by the metro train. Wang and Shao (2022) [11] conducted the numerical analysis to determine long-term structural damage from train loads. Khan, Sadique, et al., 2022 [12] performed a dynamic analysis of the tunnel located in dry and saturated soil under seismic loading. Although the FEAs of the underground tunnel have been studied for many purposes, they generally concentrated on the reaction of a tunnel or surrounding soil/rock but not the reaction of components inside a tunnel.
This research aims to implement Finite Element (FE) models to consider crosstalk, which is the vibration transmission between the Booster and the Collider of FCC-ee. This research also seeks to find the significance of vibrational crosstalk compared to the vibration due to the ground motion. This work focuses on the method to determine the transfer function of the tunnel built by a tunnel-boring machine (TBM) between the positions where the supporting systems are fixed. FE models were prepared for frequencies ranging from 0 to 200 Hz.

2. Research Methodology

2.1. Transfer Functions

The Collider and the Booster are subjected to multiple sources of random vibration. To assess the total responses of the Collider and Booster, determining the transfer function ( H j ω ) of the system and the Power Spectral Density (PSD) excitation of the sources ( Φ e e ω ) is crucial, as illustrated in the following equations:
Φ e e ω = Φ e 1 e 1 ω Φ e 1 e m ω Φ e m e 1 ω Φ e m e m ω ,
where m is the number of the sources.
Φ r r ( ω ) = H ¯ j ω Φ e e ω H T ( j ω ) ,
where Φ e p e q is a Cross-PSD corresponding to sources p and q, where p, q = 1, 2, …, m; Φ r r ( ω ) is a response PSD; and H ¯ j ω and H T ( j ω ) are the complex conjugate and the transpose of the H ( j ω ) , respectively.
The PSD of the response Φ r r , i ω (where subscript i denotes the response direction: vertical, y; and lateral, x) is essential for determining the root mean square (RMS) of the response, σ r , i , which is used in comparing the specification. The RMS of the response can be written as follows:
σ r , i ω = ω Φ r r , i ω d ω
Figure 2 provides denominations of the points and the definitions of the transfer functions. The block diagram (Figure 2b) shows that the transfer function from Collider to Booster H c r o s s t a l k , C B can be written as follows:
H c r o s s t a l k , C B = ( H b 1 , C B H t 1 , C B + H b 2 , C B H t 2 , C B ) H c , C B .
And the transfer function from the Booster to the Collider (Figure 2c) H c r o s s t a l k , B C can be written as follows:
H c r o s s t a l k , B C = H c , B C ( H t 1 , B C H b 1 , B C + H t 2 , B C H b 2 , B C )
Although the tunnel and surrounding rock system are coupled with the internal structure, their transfer functions were considered independently, and transfer functions were plugged in together, as illustrated in the block diagram. To understand this process of calculation and its limitations, a simple 2 degrees of freedom (DOF) mass-spring-damper system is demonstrated. Figure 3a shows the 2-DOF system with 2 masses representing the effective mass of the tunnel with the surrounding rock and the mass of the supporting system: M and m with springs with stiffness k1 and k2 and dashpots with damping coefficients c1 and c2. Suppose that F is a harmonic force, F = F e j ω t . Then, the coordinates x 1 and x 2 can be assumed as x 1 = X 1 e j ω t and x 2 = X 2 e j ω t , where ω is forced angular frequency, F ; X 1 , and X 2 are the amplitude of oscillation; t is time; and j denotes the imaginary unit number.
Looking first at a direct method to determine H T , it began with the free-body diagrams directly from Figure 3a to derive the equation of motion (EOM) of M and m. Then, substituting x 1 = X 1 e j ω t , x 2 = X 2 e j ω t , and F = F e j ω t , the total transfer function, H T j ω = X 2 / F , can be derived as follows:
H T j ω = 1 M j 2 r 2 ζ 2 + 1 1 r 2 2 + j r 2 ζ 2 1 r 1 2 + j r 1 ζ 1 m M r 1 2 j 2 r 2 ζ 2 + 1 w h e r e   r 1 = ω k 1 / M , r 2 = ω k 2 / m , ζ 1 = c 1 2 k 1 M , a n d   ζ 2 = c 2 2 k 2 m
Assuming the masses are independent, as depicted in Figure 3b,c, the transfer function of each mass can be determined separately. Then, transfer functions of mass M and mass m ( H 1 and H 2 , respectively) were defined and derived as Equations (7) and (8). Total transfer function, H T , was obtained by multiplying H 1 and H 2 , as shown in Equation (9).
H 1 ( j ω ) = X 1 F = 1 M ω 2 + j ω c 1 + k 1
H 2 ( j ω ) = X 2 X 1 = j ω c 2 + k 2 m ω 2 + j ω c 2 + k 2
H T j ω = H 1 j ω H 2 j ω = X 1 F X 2 X 1 = j 2 r 2 ζ 2 + 1 M 1 r 2 2 + j r 2 ζ 2 1 r 1 2 + j r 1 ζ 1
As can be seen from   H T j ω in Equation (9), it differs from Equation (6) due to the presence of the term   m M r 1 2 j 2 r 2 ζ 2 + 1 . However, if m M is assumed, m M r 1 2 j 2 r 2 ζ 2 + 1 0 . It is important to note that the results deviate more with larger mass of the supporting systems. Furthermore, at a resonance, the term 1 r 2 2 + j r 2 ζ 2 1 r 1 2 + j r 1 ζ 1 becomes less, and the term m M r 1 2 j 2 r 2 ζ 2 + 1 becomes more significant to the response. Thus, at a resonance, the results deviate when this assumption is set. However, the response RMS relates to the integration of response PSD (area under the response PSD curve; see Equation (3)) rather than the level of vibration at a peak.
The tunnel and surrounding effective mass were assumed to be far higher than the supporting system mass. Hence, H t 1 , C B , H t 1 , B C , H t 2 , C B , and H t 2 , B C can be determined without considering supporting system inside. This assumption helps to avoid the excessively computationally intensive and difficult reduction of the supporting system into 2D. Apart from that, there are many designs of the supporting systems under study, including Collider’s supporting system, 6.5 m long wider steel girder 4 HL-LHC jacks, and Booster’s supporting system, centered with Collider support, the results of which are presented in Section 3.2. These designs can be easily compared by substituting the transfer functions of the supporting systems into Equations (4) and (5), without the need to remodel the entire tunnel simulation. This approach will facilitate comparing and optimizing those designs conveniently.

2.2. Finite Element Modeling

This section describes the methodology to determine the transfer functions of the tunnel ( H t 1 , C B , H t 2 , C B ,   H t 1 , B C ,   a n d   H t 2 , B C ) by FEM.

2.2.1. Domain Dimension

Considering the advantages of calculating time and disk space, the 2D-plane strain was selected over 2.5D or 3D, although the 2D-plane strain fails to describe out-of-plane propagating waves and limits a type of load to line excitations, leading to less accurate geometrical damping, which involves the energy leaving the system. The 2D-plane strain is widely used in vibration analyses of an underground tunnel, such as [12,13]. One research study worth mentioning is by Yang, Liang, et al. (2017) [14], who compared the results from a 2.5D- and a 2D-plane strain FE Model of the tunnel subjected to train load, taking into account the roughness of the rail and train speed. They stated that the 2D had limitations in modeling load sources and failed to describe wave transmission along the tunnel, leading to less accurate results; yet, it was a conservative and efficient tool.

2.2.2. Boundary Conditions

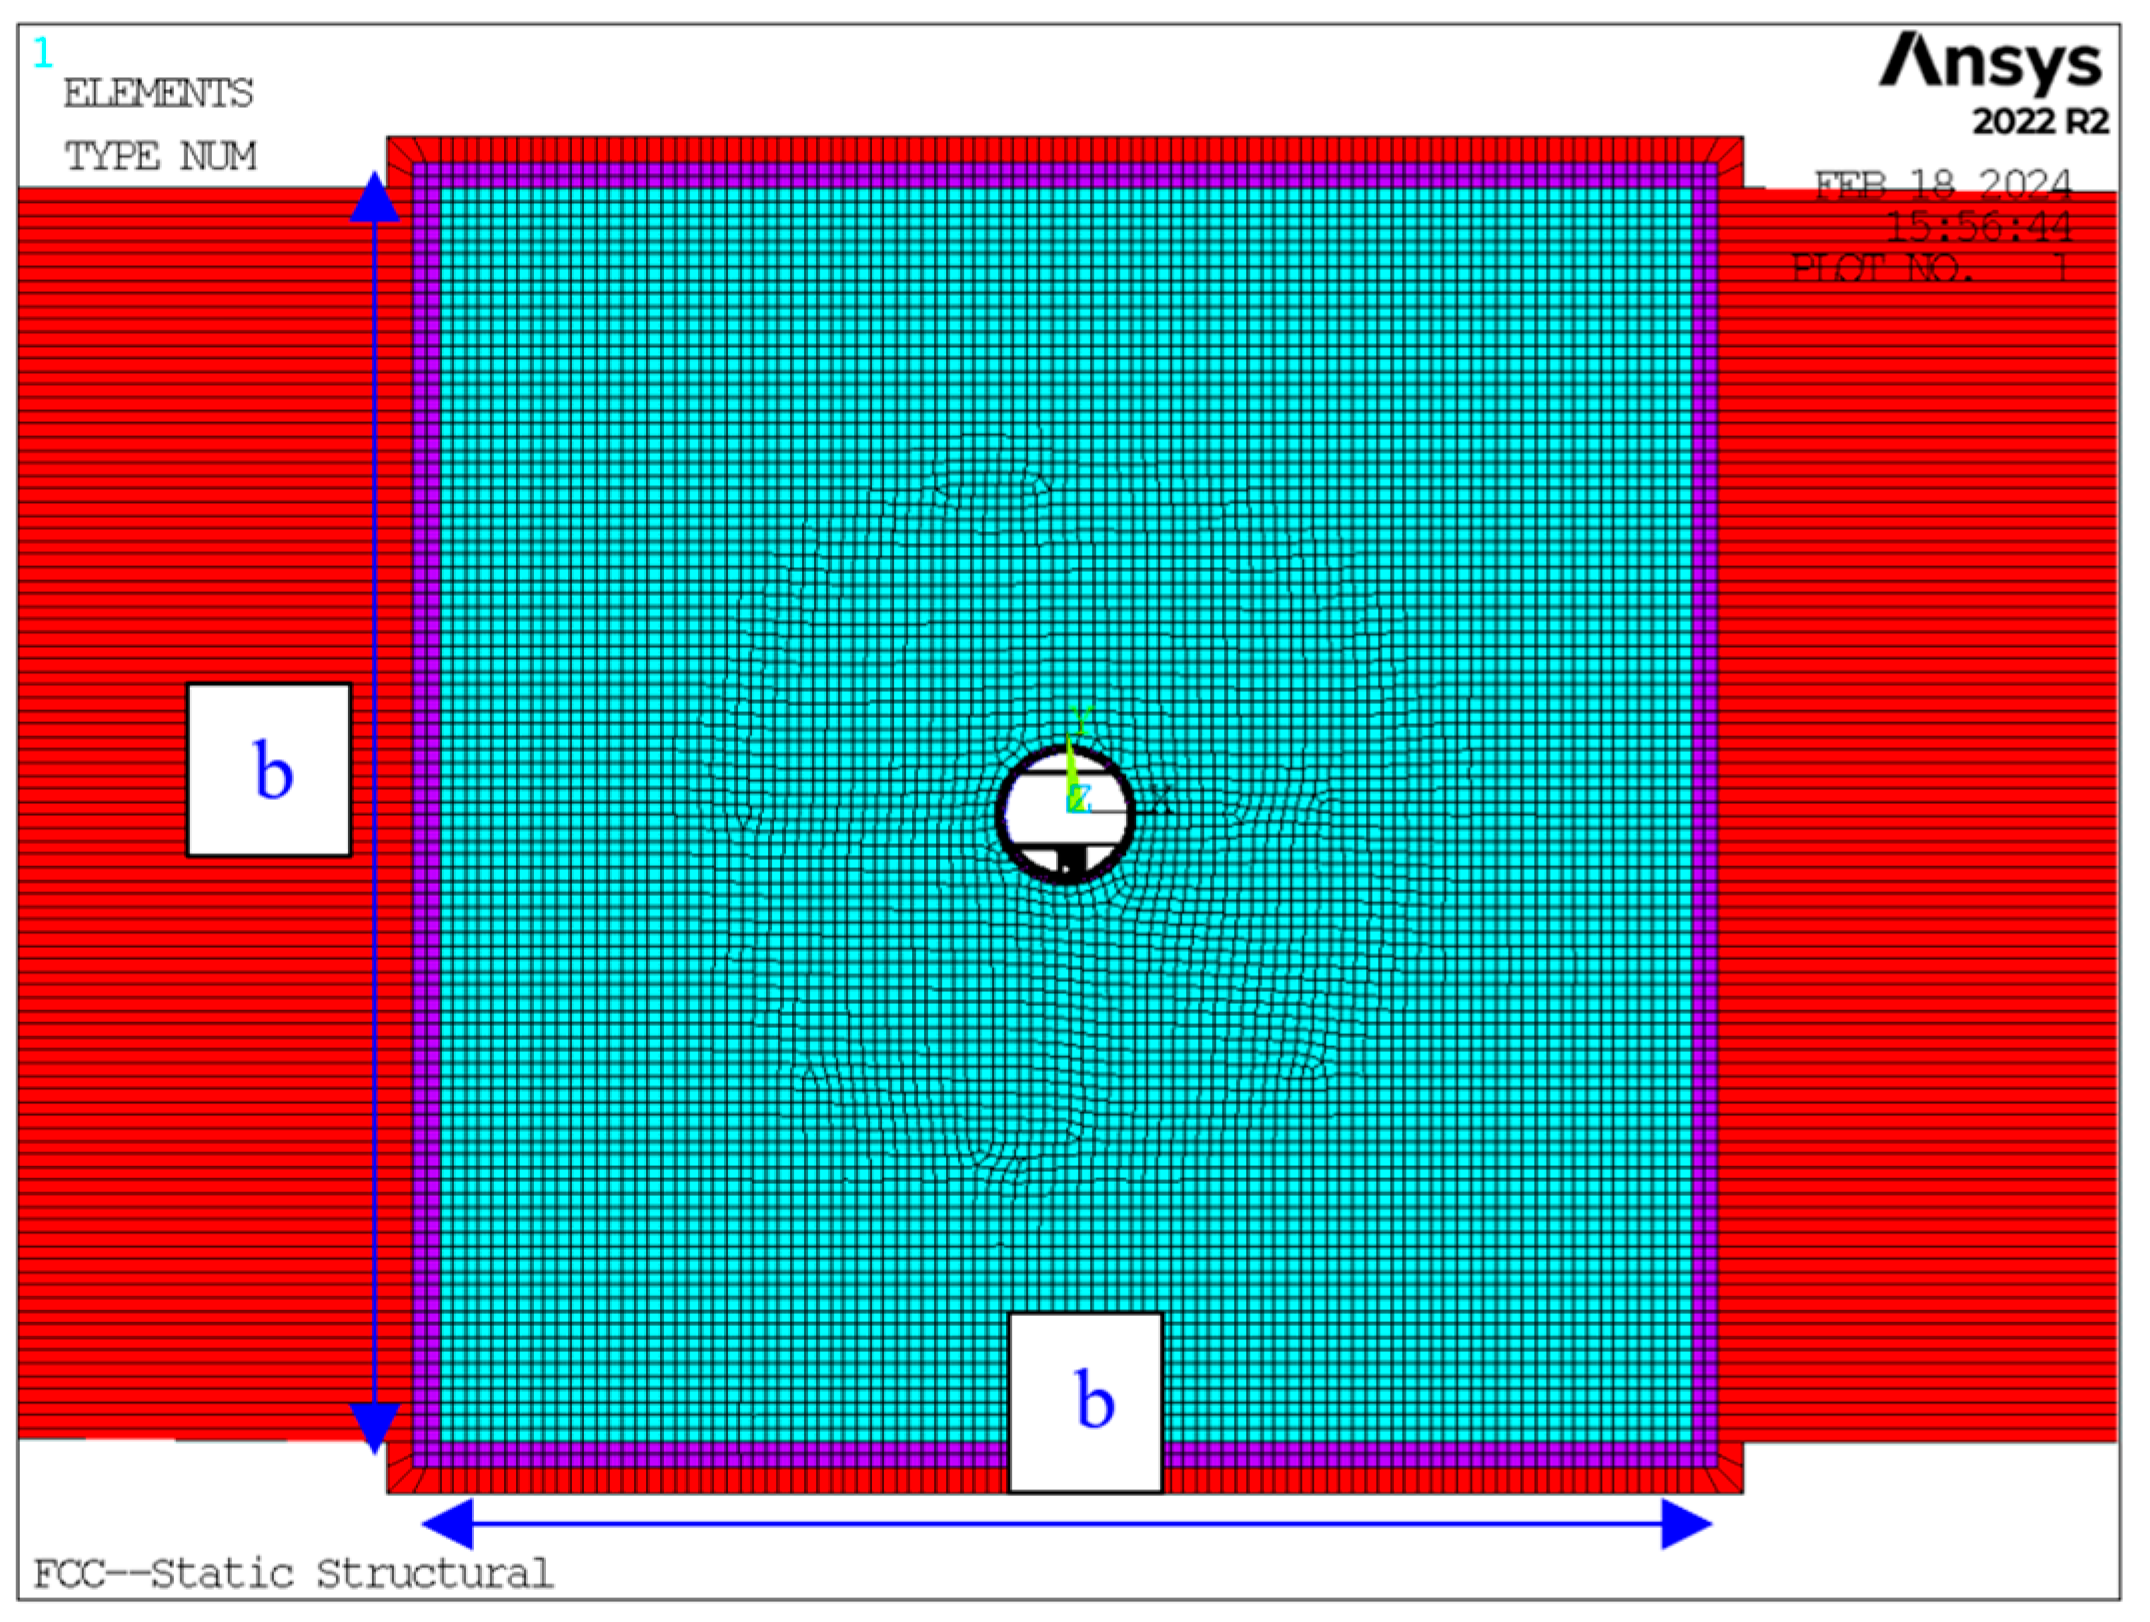
Choosing the wrong boundary for dynamic analysis of the infinite domain model causes stress waves to reflect from the boundary back. This reflecting wave leads to an inaccuracy of the solution. To implement the model in ANSYS software (2022 R2), element INFIN257 (The red color elements in Figure 4) is available. The element regards Lysmer and Kuhlemeyer in 1969 [15,16]. As it is accessible through the software and is simple, this type of boundary condition was selected.

2.2.3. Material Mechanical Properties

Mechanical properties, including density, elastic modulus, Poisson ratio, and material damping ratio, relate vibration characteristics. Moreover, these properties were also important in determining the mesh size sufficient to accurately describe wave propagation in mediums (details are provided in Section 2.2.4). Hence, they were required to input for Finite Element Analysis (FEA), and it was essential to investigate in detail.
FCC-ee: “The Lepton Collider: Future Circular Collider Conceptual Design Report Volume 2” [17] studied the location to place FCC-ee and to find the layout that provides the most beneficial conditions for tunneling. It was found that a good position to place about 90% of the tunnel is in the sedimentary rock, called molasses, which comprises multiple layers of sandstone and layers of marl [18]. Because of the composition of molasses which is varied depending on the locations, the properties of sandstone and marl were studied separately, and the simulations were divided into 2 extreme cases:
  • The tunnel surrounded by 100% sandstone.
  • The tunnel surrounded by 100% marl.
The mechanical properties of the materials, density, elastic modulus, and Poisson ratio were gathered from various sources [19,20,21]. The damping ratio of a concrete structure is typically 3–5% [22,23]. According to research about marls in the Algiers region, Bedr, Mezouar, et al. (2019) [24] and Nishi, Ishiguro, et al. (1989), who studied the dynamic properties of weathered soft rocks in Ishikawa, Tochigi, and Chiba [25], sandstone and marl damping ratios at small strains (<10−6) are both around 1–2%.
Another point that should be considered is fractures in the molasses, which lead to a reduction in the elastic modulus. The elastic modulus of the molasses is then reduced from the intact elastic modulus to the rock mass elastic modulus, which was estimated by Hoek and Diederichs’s equation [26]:
E r m = E i n t a c t 0.02 + 1 D / 2 1 + exp 60 + 15 D G S I 11 ,
where GSI is a Geological Strength Index, and D is a disturbance factor. The measurement information [18] suggests that the GSI for marl is around 30–40, and for sandstone, it is typically around 100 (intact). In addition, the tunnel-boring machine is not likely to disturb the sedimentary rock [26]. Therefore, D was assumed to be 0. The material mechanical properties considering fractures are summarized in Table 1.

2.2.4. Mesh

The models were meshed by SOLID183 element [16], which is 2D, 8 nodes (quadrilateral elements) or 6 nodes (triangle-shape elements). As described in Kaeablis and Beskos (1997) [27], the element size for dynamic analysis is limited by the elastic wavelength. Moreover, 6–12 elements per wavelength are required. In this research, 6 elements per wavelength were assumed. The element size of sandstone was 0.60 m, whereas, for the marl, the rock mass elastic modulus of marl is low, resulting in a very short wavelength in marl and a limit maximum element size. The element size of marl was only 0.09 m.
Apart from the element size limited by the wavelength, the complex shape of the concrete tunnel influences the accuracy of the system solution. Thus, mesh independence was performed by varying element sizes of the concrete tunnel surrounded by sandstone. The mesh of the concrete tunnel was refined by increasing the number of nodes from 35,413 to 49,392, and we found that the results between the two meshes were minimally different, under 0.6% of maximum gain. As a result, due to efficiency, the mesh with 35,413 nodes was utilized to conduct this research.

2.2.5. Domain Size

Hatzigeorgiou and Beskos (2010) [9] described that if the lateral length of the rock domain is not adequate, it leads to “erroneous results”. Based on the literature review (Table 2), the lateral length of a domain varies from around 5 to 17.5 times the tunnel diameter. Since the literature review used the various types of boundary conditions which relate to domain size, the domain size was further investigated.
Domain size (denoted with b × b; see Figure 4) was varied to 35 × 35 (ratio = 5.38), 60 × 60 (ratio = 9.23), and 100 × 100 m2 (ratio = 15.38), and one load case was conducted to compare the results from different sizes. However, if the domain size is too large, the model will be computationally intensive. Comparing between the sizes, it was found that, for the simulation of the tunnel surrounded by sandstone, the domain size of 35 × 35 m2 was different from 100 × 100 m2 by a substantial margin of 36.0%. In contrast, the domain size of 60 × 60 m2 deviates from 100 × 100 m2 below 9.5% of the maximum gain. The material properties and mesh size of marl are different from sandstone. As a result, two simulations with domain sizes of 35 × 35 and 60 × 60 m2 were carried out for marl surrounding rock. The results revealed consistency between the two domain sizes, difference of gain under 13.6% and lower than 1.68% of the maximum gain in the frequency range of 6–200 Hz. Thus, the calculation adopted the 60 × 60 m2 domain size for all simulations.

2.2.6. Load Cases

There were 4 transfer functions to determine: the transfer functions from the Collider fixed point (CFP) to the Booster fixed point 1 (BFP1) and 2 (BFP2) and the other 2 in the opposite directions. The transfer functions from BFPs to the CFP were obtained using harmonic analysis module in ANSYS. This allowed for the implementation of the harmonic force excitation (HFE) at a source and the inspection of the displacement response (DR) at the points of interest. A transfer function consists of 4 components (showed in Equation (11)), corresponding to the 2 directions of the response and the 2 directions of the excitation. The rotational response and its excitation were not considered. The definition to determine each transfer function component is provided in Equations (12) and (13).
R = H t i , B C E ,   where   H t i , B C   is   either   H t 1 , B C   or   H t 2 , B C R y R x = H y y H y x H x y H x x E y E x
H t 1 , B C [ m / ( N / m ) ] = D R   a t   C F P H F E   a c t i n g   a t   B F P 1
H t 2 , B C [ m / ( N / m ) ] = D R   a t   C F P H F E   a c t i n g   a t   B F P 2
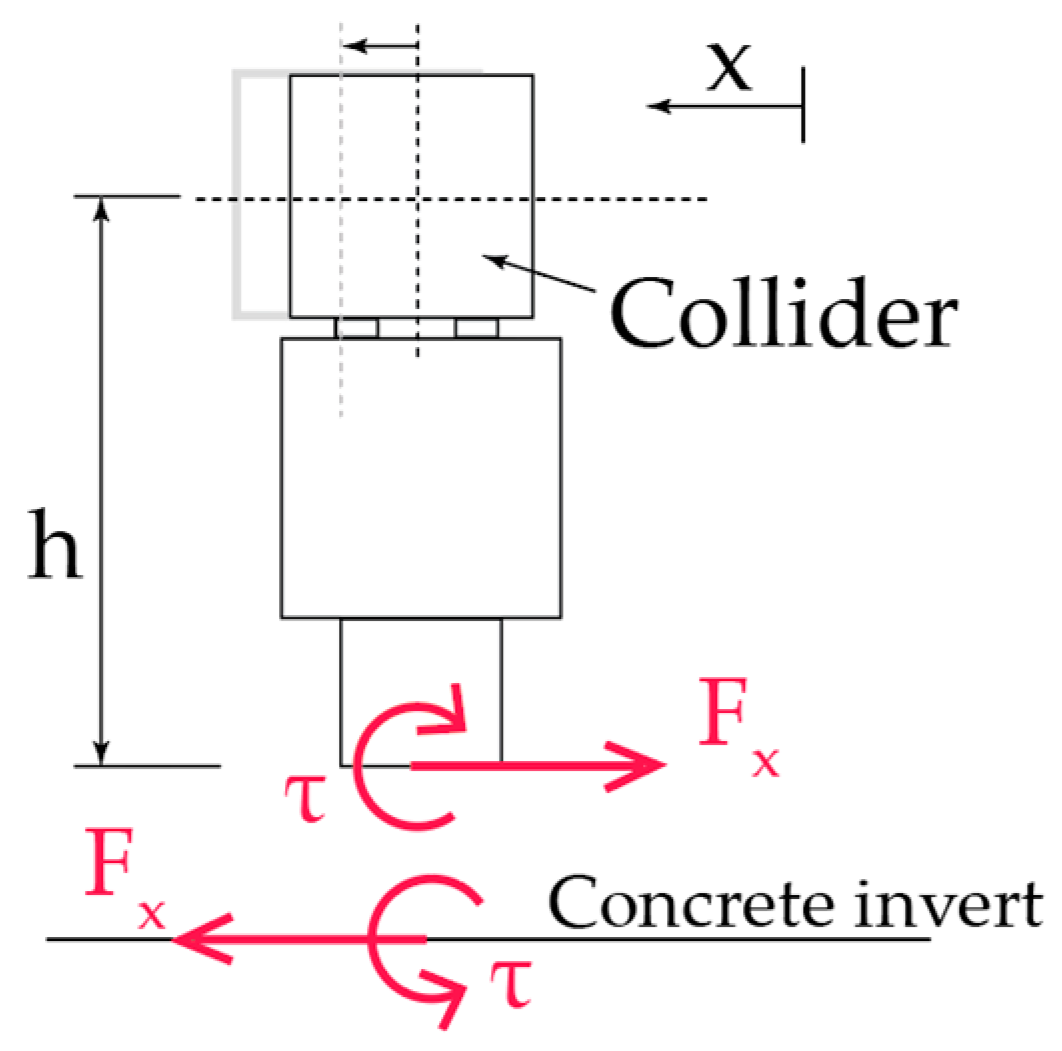
Unlike the transfer functions from the Booster fixed points to the Collider fixed point, the transfer functions from the Collider fixed point to the Booster fixed points, H t i , C B , also have the moment excitation due to the lateral movement of the Collider (Figure 5). However, since the rotational response was not considered and the torque, τ , depended on F x ( τ = h F x , where h is the height of the Collider), the H t , C B , as a 3 × 3 matrix, was simplified to a 2 × 2 matrix, as demonstrated in Equation (14). The definitions of the transfer functions are written in Equations (15) and (16).
H t i , C B E = H y y H y x H y r H x y H x x H x r H r y H r x H r r F y F x M     H t , C B E = H y y H y x + h H y r H x y H x x + h H x r F y F x
H t 1 , C B [ m / ( N / m ) ] = D R   a t   B F P 1 H F E   a c t i n g   a t   C F P
H t 2 , C B [ m / ( N / m ) ] = D R   a t   B F P 2 H F E   a c t i n g   a t   C F P
Hence, six separate simulations were conducted. Simulation 1: The vertical HFE was introduced at BPF1, and the vertical and lateral DR at CFP were inspected. Simulation 2: The lateral HFE was introduced at BPF1, and vertical and lateral DR at CFP were inspected. The results of simulations 1 and 2, H t 1 , B C , were calculated. For simulations 3 and 4, the process was repeated with vertical and lateral HFEs introduced at BPF2 instead of BPF1, yielding H t 2 , B C . Simulation 5: The vertical HFE was introduced at CFP, and the vertical and lateral DR at both BFP1 and BFP2 were inspected. Simulation 6: The lateral HFE and the moment harmonic excitation were introduced at CFP, and the vertical and lateral DR at both BFP1 and BFP2 were inspected. Simulations 5 and 6 resulted in H t 1 , C B and H t 2 , B C .

3. Results and Discussion

3.1. The Transfer Functions of the Tunnel

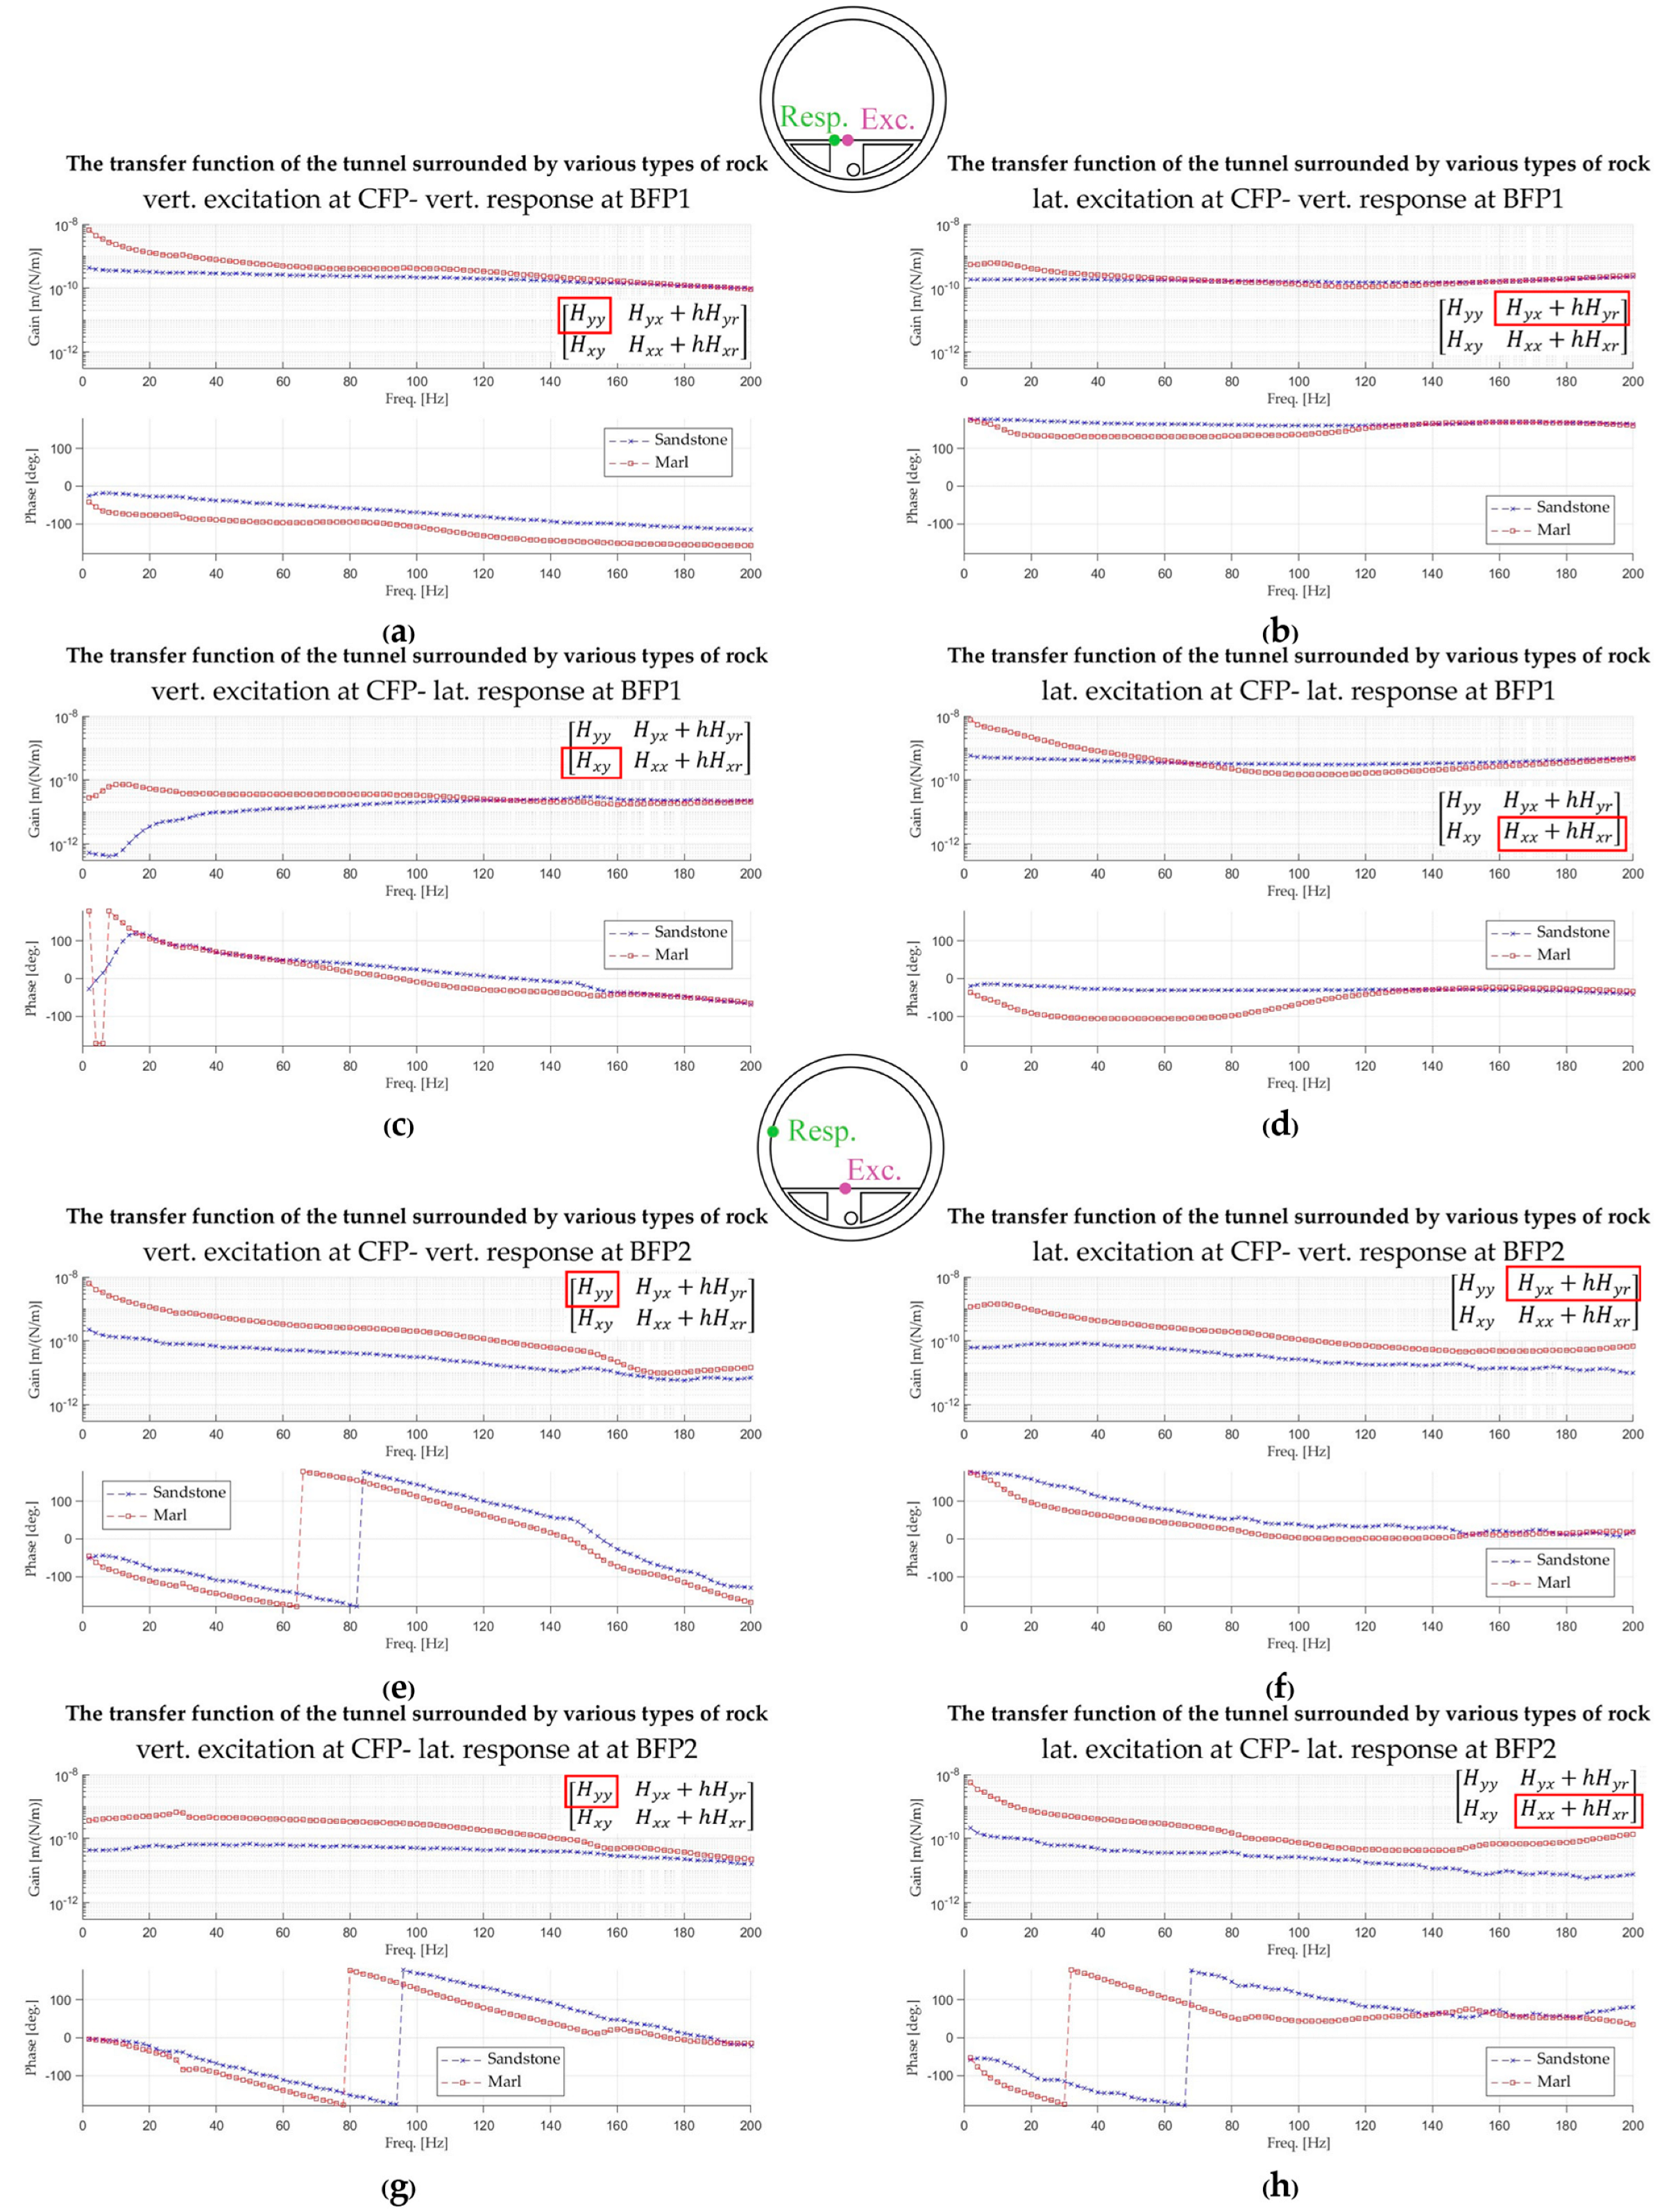
Figure 6 and Figure 7 depict H t 1 , C B , H t 2 , C B , H t 1 , B C , and H t 2 , B C . Each transfer function contains four components corresponding to the two load cases (load causing by movement of magnets moving in vertical direction and horizontal direction) and two directions of response. The graphs described gain, | H ( j ω ) | , and phase, a n g l e ( H j ω ) , as a function of frequency and the parameter of the graphs as the types of surrounding rock (100% sandstone and 100% marl). The trends indicate that the vibration level of the tunnel surrounded by marl, with a significantly lower rock mass elastic modulus compared to sandstone, far surpassed those surrounded by sandstone almost throughout the frequency range of consideration. This implies that, in the tunnel section located in an area that has a high content of weathered marl, the crosstalk affects more than in an area that has stiff and intact rock. Additionally, the vibration gain generally dropped over frequency, except for H t 1 , C B , x x , H t 1 , C B , y x , H t 1 , B C , x x , and H t 1 , B C , x y , where the gains decreased until 120 Hz and then increased again after that. This was caused by the load that induced mode 3 of the concrete invert shown in Figure 8. Mode 1 and mode 2 of the concrete invert did not appear to contribute to the transfer functions. Furthermore, the gains for diagonal components were higher than those for the off-diagonal components.

3.2. The Vibrational Crosstalk Transfer Functions

This section elaborates on the results of the transfer functions of the tunnel incorporate the transfer function of example designs of Collider’s supporting system, 6.5 m long wider steel girder 4 HL-LHC jacks, and Booster’s supporting system, centered with Collider support, to find H c r o s s t a l k ,   C B and H c r o s s t a l k ,   B C , as defined in Equations (4) and (5).
The diagonal components, H y y and H x x , of the transfer function are explained in detail. (All components of the crosstalk transfer functions are plotted in Appendix A). The transfer functions used in this calculation were the transfer functions of the tunnel, the transfer function of the Collider with the 6.5 m long wider steel girder 4 HL-LHC jacks, and the transfer function of the Booster with the Centered with Collider support. The crosstalk transfer functions were compared to the amplification of ground motion, which is represented by the transfer function from the ground, where a supporting system is fixed to a magnetic axis.
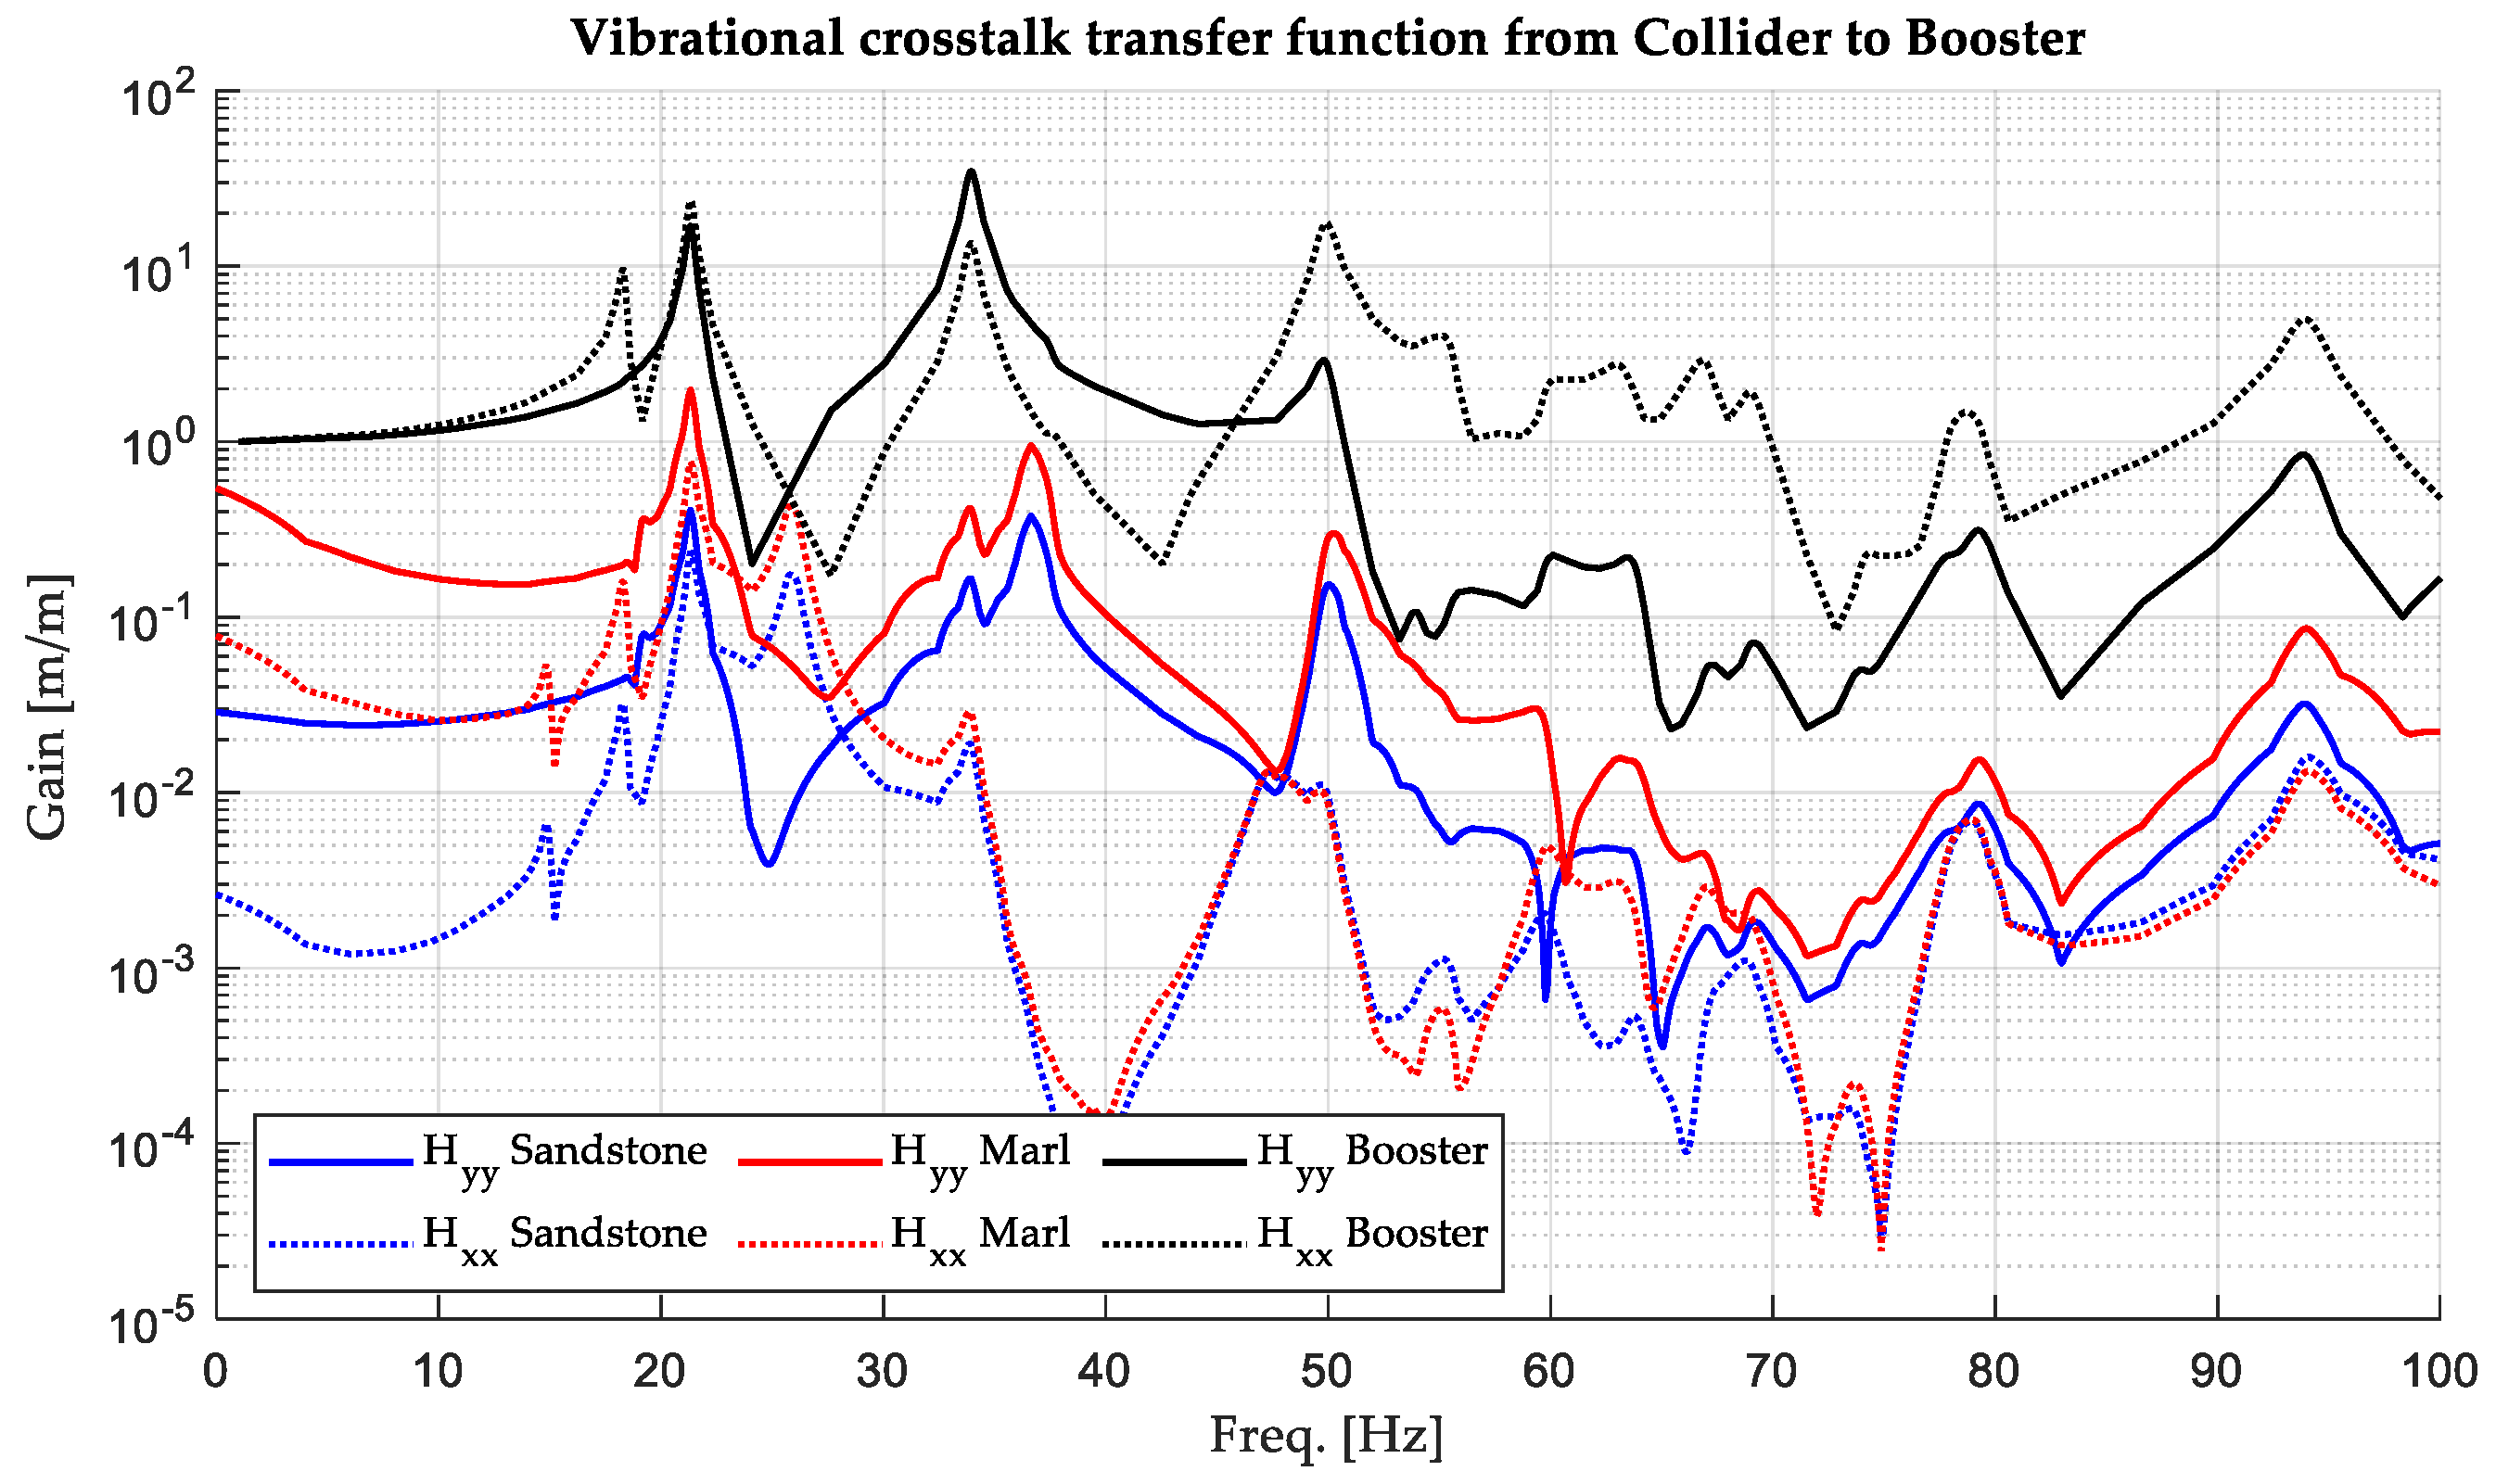
Figure 9 illustrates the gain of the Booster and vibrational crosstalk from the Collider to the Booster occurring in the tunnel surrounded by sandstone and marl. The Booster, which was subjected to displacement excitation at both fixed points, exhibited high vibration levels at 21.4, 33.9, 49.8, 77.9, and 93.9 Hz. The trends remained in vibrational crosstalk, but the gains were far lower. For instance, at frequency 21.4 Hz, the gains of the two components of the Booster were at approximately 20 m/m, while crosstalk occurring in the tunnel surrounded by marl only around 2 m/m (10% of the Booster H y y gain) for the component H y y , and around 0.7 m/m (3.5% of the Booster H y y gain) for the component H x x . Even lower levels of vibration could be seen from the crosstalk occurring in the tunnel surrounded by sandstone, where the gains of H y y and H x x were around 0.2~0.5 m/m (1~2.5% of the Booster H y y gain).
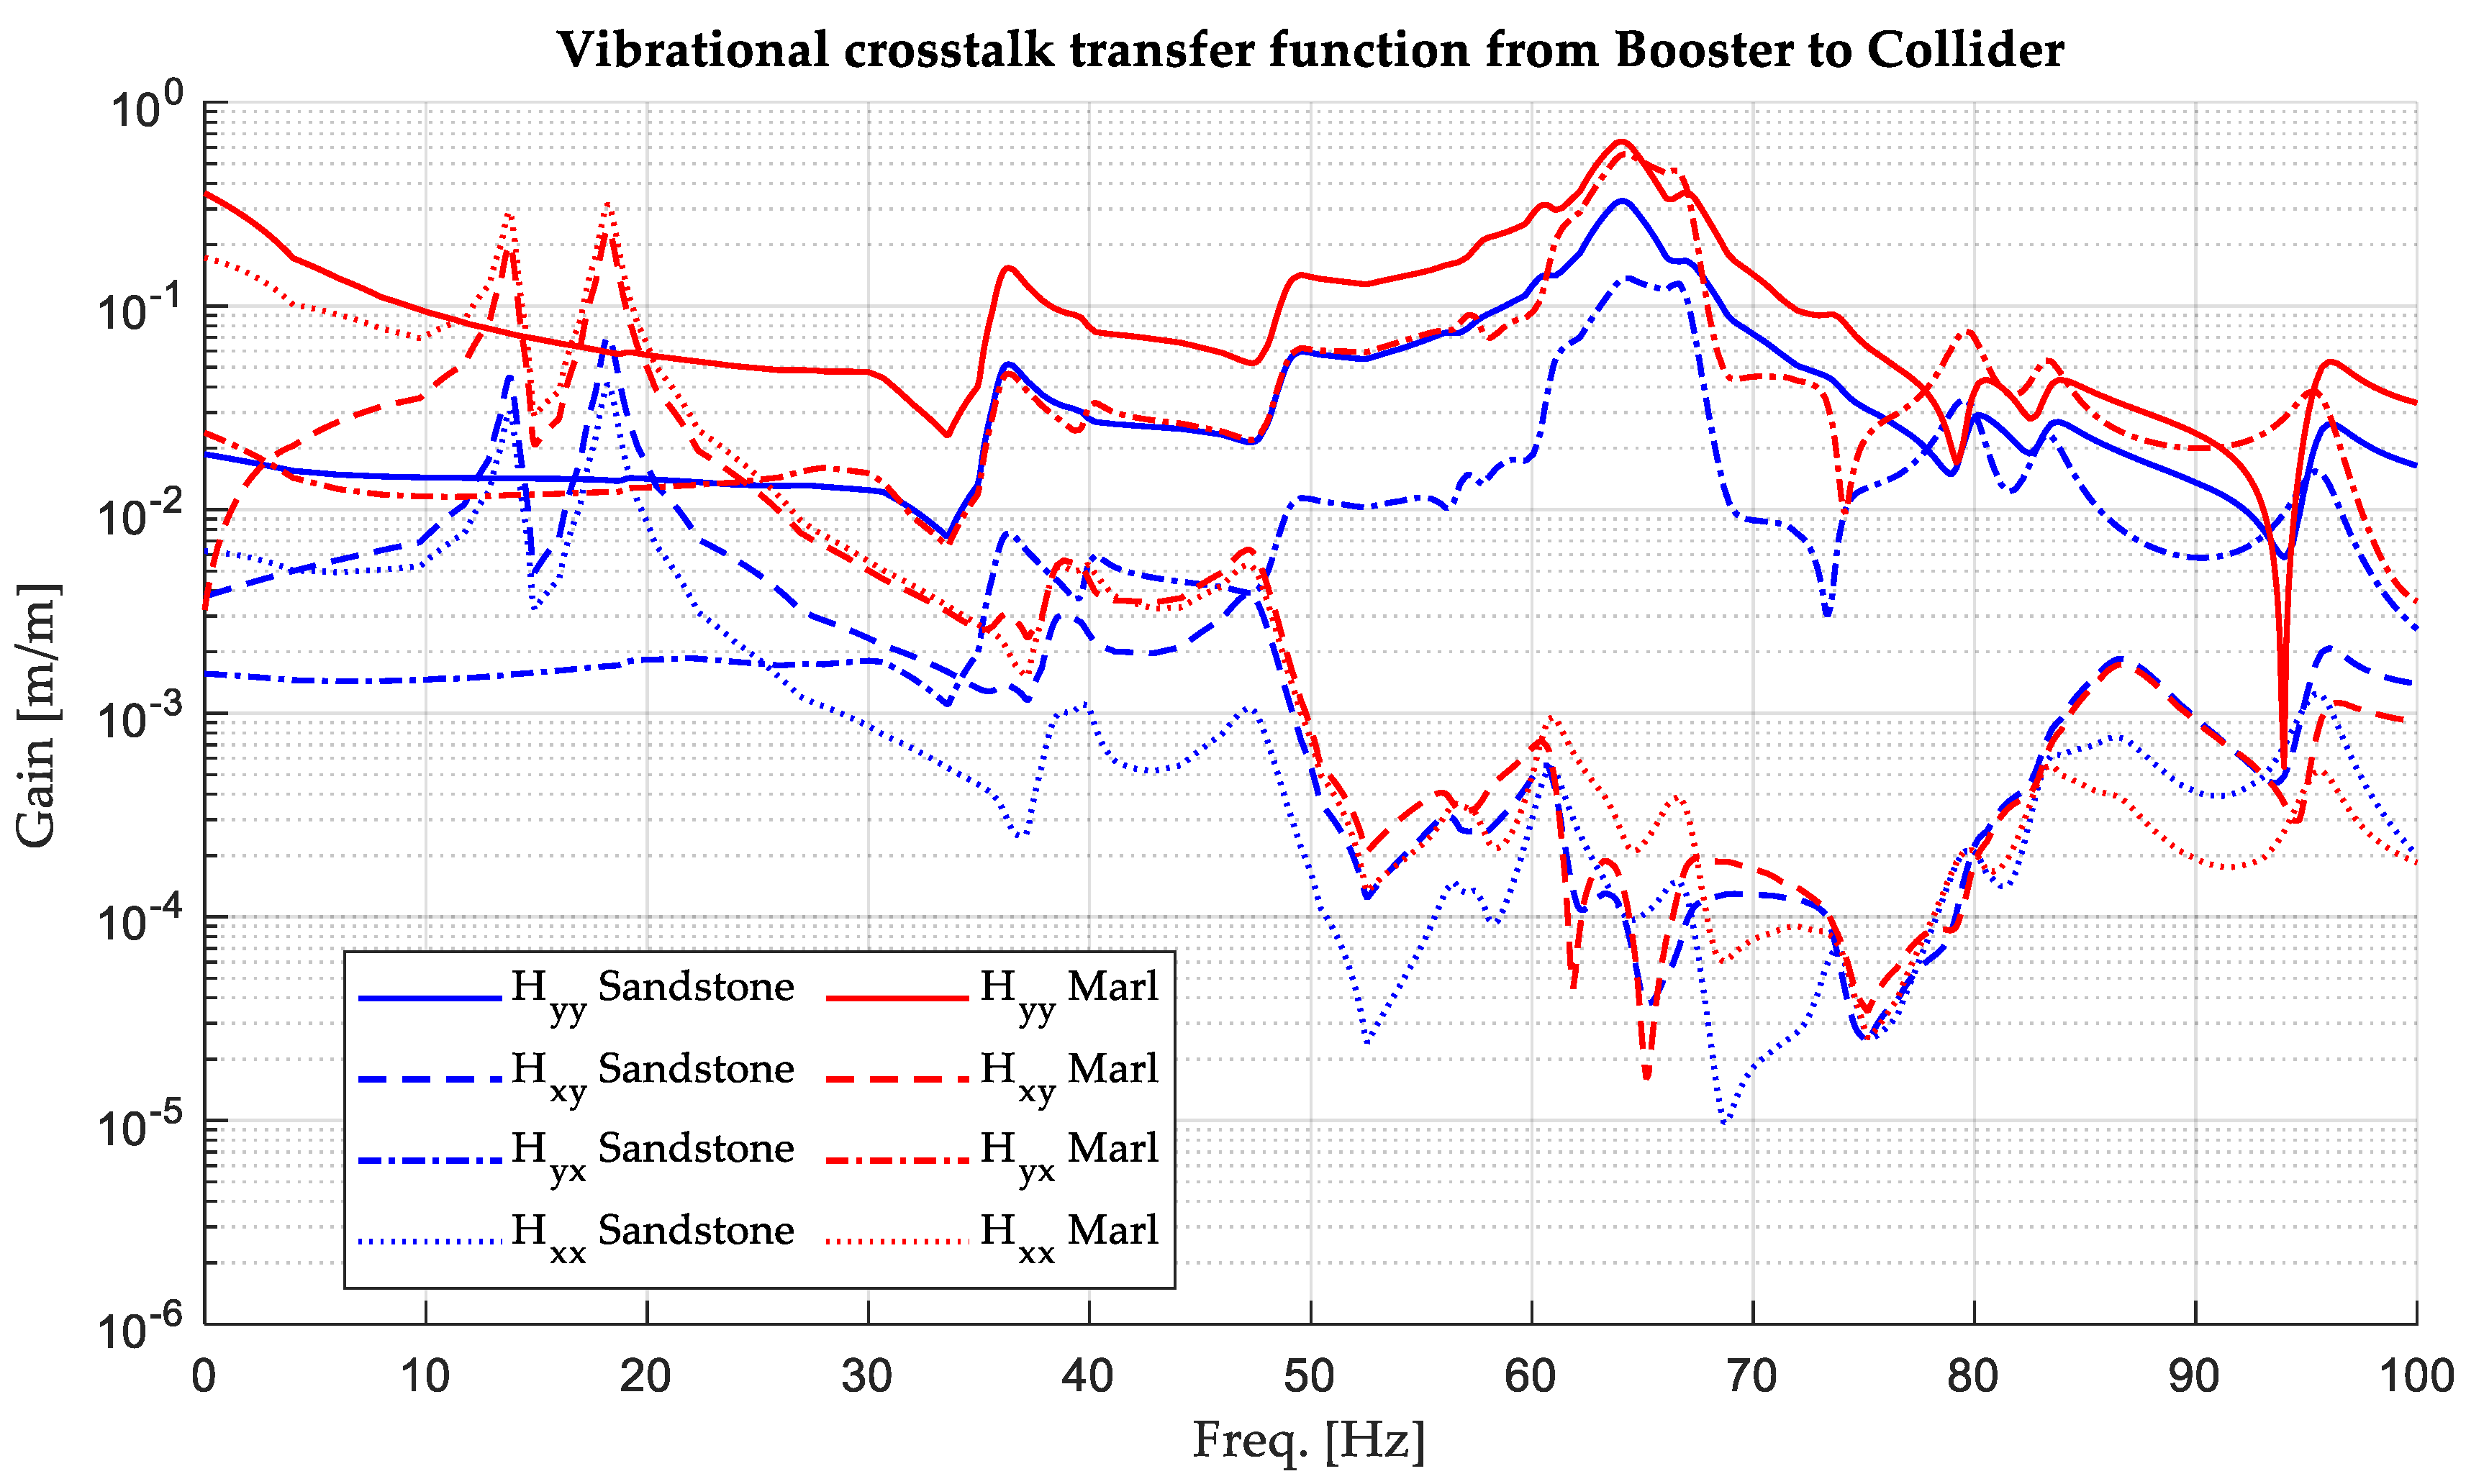
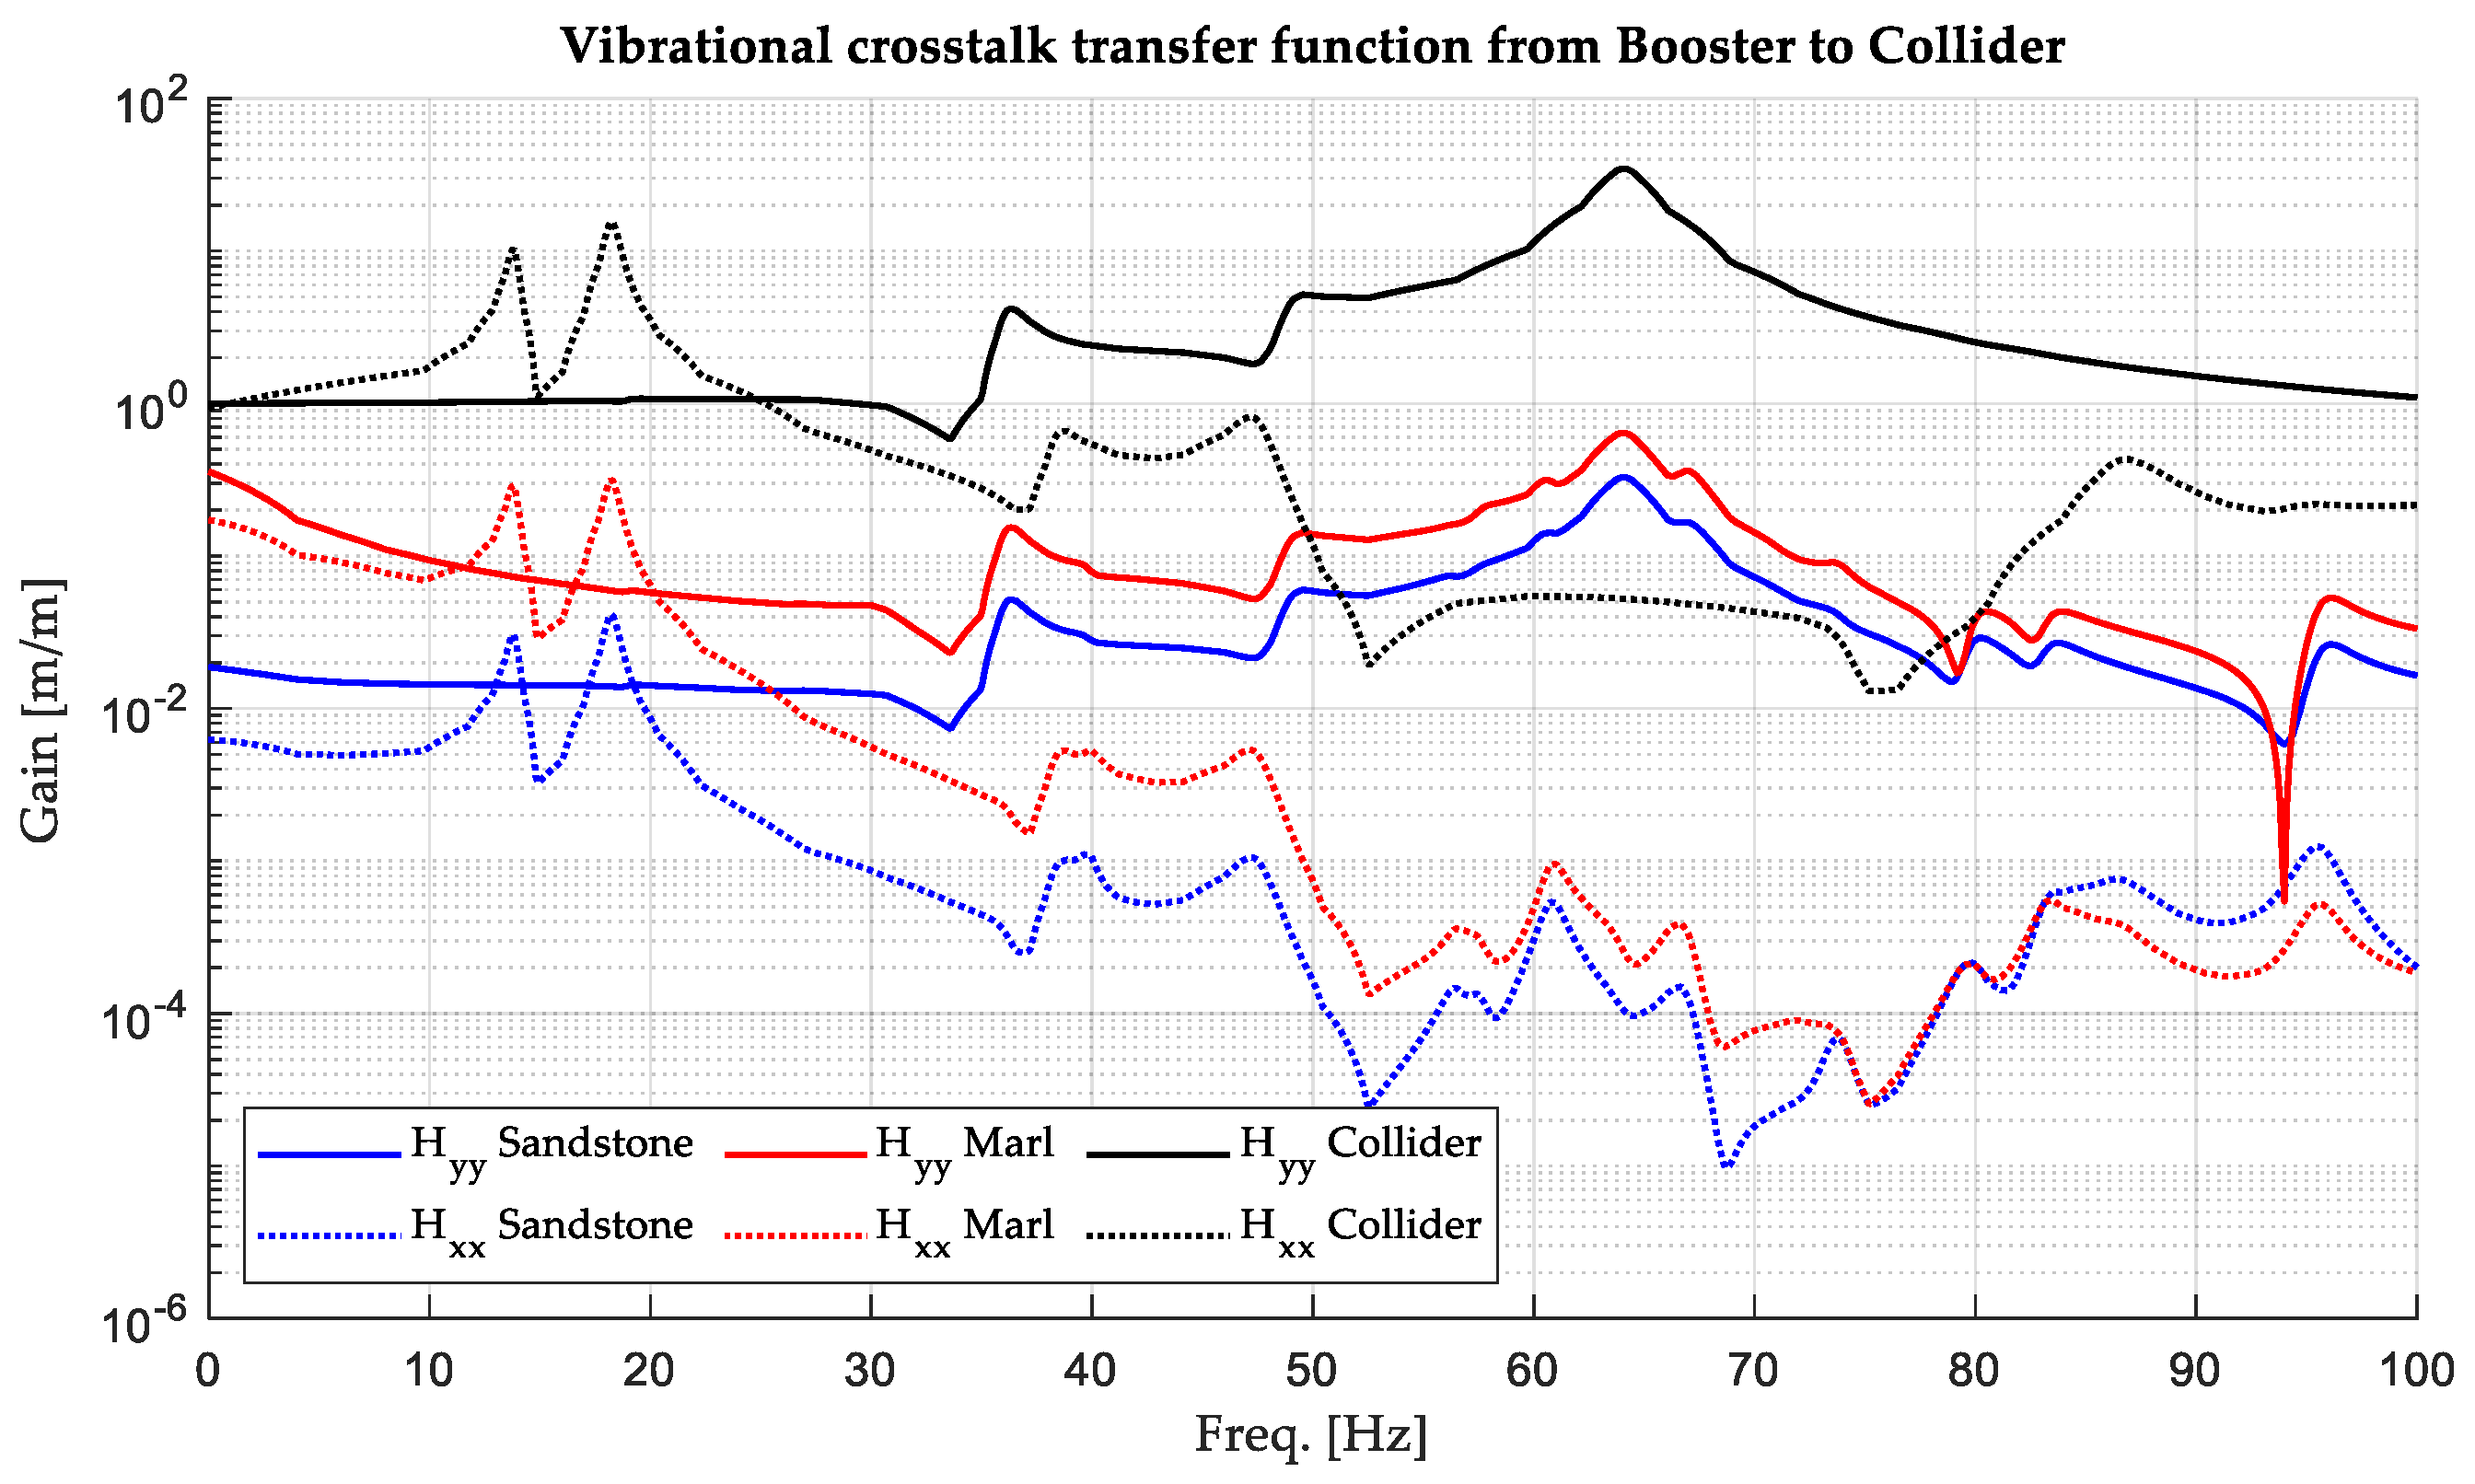
Figure 10 displays the gains of the Collider and the vibrational crosstalk from the Booster to the Collider, occurring in the tunnel surrounded by sandstone and marl. When examining the Collider magnet’s response to displacement excitation at the fixed point, two distinct peaks in the H x x gain at 13.8 and 18.2 Hz were observed. The values of the gain at these peaks were at 10 and 15.6 m/m, respectively. The H y y gain peaks notably at 64.1 Hz, with a value of 34.6 m/m. The crosstalk from Booster to Collider maintained a shape similar to the Collider gain. The gain of H x x of the crosstalk occurring in the tunnel with marl was approximately 0.2~0.3 (2~3% of the Collider H x x gain) at the 13.8 and 18.2 Hz peaks. Those occurring in the tunnel with sandstone were lower, at 0.03~0.07 (0.03~0.07% of the Collider H x x gain). The gains of H x x of the crosstalk were negligibly low, from 50 to 100 Hz, fluctuating around 10 × 10−4 m/m. In contrast, the gain of H y y of the crosstalk reached a peak at 64.1 Hz. Those occurring in the tunnel with marl at the frequency were at around 0.64 m/m (1.8% of the Collider H y y gain). Those occurring in the tunnel with sandstone at the frequency were at 0.32 m/m (0.9% of the Collider H y y gain).
In short, the gains crosstalk both from the Booster to Collider and from the Collider to Booster with this specific design of supporting system were relatively low, each being under 10% compared to the gain from ground to the magnet level of the Collider and the Booster. Nonetheless, the PSD of the Collider and Booster ( Φ e e ω in Equation (1)) should be measured in order to determine the accumulated response PSD ( Φ r r ( ω ) in Equation (2)), which can indicate how much the crosstalk contributes to the overall vibration.

4. Conclusions

The objective of this analysis was to predict vibrational crosstalk transfer functions between the Collider and the Booster by simulations for use in comparative designs. Also, the transfer functions of these components were determined through three separate simulations, namely the Collider, the Booster, and the underground tunnel, and were integrated using block diagram. This research focused on modeling the FE model of the underground tunnel, which adopted a 2D-plain stain with the standard viscous boundary. Upon reviewing the literature, it was found that the natural geological material under the CERN site was molasses–sandstone mixed with marl. Therefore, two extreme cases were conducted: the transfer functions of the tunnel surrounded by 100% intact sandstone and surrounded by 100% weathered marl. The results revealed that the vibration level of the tunnel surrounded by marl was higher than that with sandstone across almost the entire frequency range of interest. Moreover, the transfer functions of the supporting systems and the tunnel were incorporated into crosstalk transfer functions from Collider’s magnet to Booster’s magnet and from Booster’s magnet to Collider’s magnet. It is observed that the gains of the crosstalk transfer functions were below 10% of the transfer functions from ground to Booster magnet or Collider magnet (ground motion amplification). Furthermore, as the vibration of the particle accelerators can also be caused by other sources, such as water pipes and ventilations, despite focusing on crosstalk, this research could potentially be adapted to include the vibration induced by other components inside the tunnel, which is also essential to find the optimal layout of the tunnel and achieve high-performance particle accelerators.
The research could be extended further by measuring the vibration produced by operating both the Booster and Collider to understand the response of a particle accelerator induced by the other.

Remarks

  • The accuracy of the methodology for determining crosstalk was promising yet limited, as it assumed the mass of the Collider and Booster to be negligible compared to the effective mass of the tunnel. This discrepancy might affect the accuracy of the results.
  • Due to geological uncertainty, the sensitivity of material properties may need further investigation.
  • Further investigation into the rotational excitations of the Collider may be necessary, as they could potentially increase crosstalk vibration from the Booster to the Collider.
  • The simulation could also be refined using 2.5D or 3D simulations of the tunnel to consider geometric damping more accurately.

Author Contributions

Conceptualization, P.L., A.P., F.C. and T.B.; methodology, P.L.; software, P.L.; formal analysis, P.L.; investigation, P.L. and A.P.; resources, F.C., A.P. and T.B.; data curation, P.L. and A.P.; writing—original draft preparation, P.L.; writing—review and editing, A.P. and N.A.; visualization, P.L.; supervision, F.C., T.B. and N.W. All authors have read and agreed to the published version of the manuscript.

Funding

This research received no external funding.

Data Availability Statement

Data are contained within the article.

Acknowledgments

This project was initiated by the Mechanical and Material (MME) Engineering group at CERN, the European Organization for Nuclear Research, and was carried out at the department of mechanical engineering, Chulalongkorn University.

Conflicts of Interest

The authors declare no conflicts of interest.

Appendix A

This section provides information about all components of the crosstalk transfer functions. Figure A1 and Figure A2 displays the four components of H c r o s s t a l k , C B and H c r o s s t a l k , B C , respectively, with the types of surrounding rock as a parameter.
Figure A1. Total transfer function from the Collider magnetic axis to the Booster magnetic axis.
Vibration 07 00048 g0a1
Figure A2. Total transfer function from the Booster magnetic axis to the Collider magnetic axis.
Vibration 07 00048 g0a2

References

  1. Zimmermann, F.; Wilkinson, G.; Benedikt, M. FCC Week 2023. In Proceedings of the Future Circular Collider Conference, London, UK, 5–9 June 2023; Available online: https://indico.cern.ch/event/1202105/timetable/ (accessed on 26 August 2024).
  2. Aiba, M.; Goddard, B.; Oide, K.; Papaphilippou, Y.; Hernández, Á.S.; Shwartz, D.; White, S.; Zimmermann, F. Top-up injection schemes for future circular lepton collider. Nucl. Instrum. Methods Phys. Res. Sect. A Accel. Spectrometers Detect. Assoc. Equip. 2018, 880, 98–106. [Google Scholar] [CrossRef]
  3. Seryi, A. Ground Motion and Vibration Issues for Accelerators. In Proceedings of the 2001 Particle Accelerator Conference, Chicago, IL, USA, 18–22 June 2001; Available online: https://ieeexplore.ieee.org/document/987516/ (accessed on 26 August 2024).
  4. Schaumann, M.; Gamba, D.; Morales, H.G.; Corsini, R.; Guinchard, M.; Scislo, L.; Wenninger, J.; Schaumann, M. The effect of ground motion on the LHC and HL-LHC beam orbit. Nucl. Instrum. Methods Phys. Res. Sect. A Accel. Spectrometers Detect. Assoc. Equip. 2023, 1055, 168495. [Google Scholar] [CrossRef]
  5. Carra, F.; Baudin, L.; Artoos, K.; Atieh, S.; Bauche, J.; Bertarelli, A.; Bertinelli, F.; Brunner, O.; Capatina, O.; Chance, A.; et al. Deliverable 5.3: Arc Integration Concept and Arc-Cell Mock-Up. Available online: https://indico.cern.ch/event/1278881/contributions/5372483/attachments/2637434/4564315/FCC_Mid_term_report_5_3_Arc_integration.pdf (accessed on 26 August 2024).
  6. Valchkova-Georgieva, F. “INTEGRATION NEWS,” 2024. Available online: https://indico.cern.ch/event/1429624/contributions/6014070/attachments/2913347/5112102/FCC%2021.08.2024%20Integration_FV.pdf (accessed on 26 August 2024).
  7. Carra, F.; Baudin, L.; Bauche, J.; Artoos, K.; Atieh, S.; Bertarelli, A.; Brunner, O.; Capatina, O.; Chance, A.; Chemliet, S. FCC-ee Arc Half-Cell: Preliminary design & integration studies, with ideas for a mock-up. J. Phys. Conf. Ser. 2024, 2687, 022005. [Google Scholar]
  8. Carra, F.; Baudin, L.; Bauche, J.; Artoos, K.; Atieh, S.; Bertarelli, A.; Brunner, O.; Capatina, O.; Chance, A.; Chemli, S. First considerations on the supporting structures of FCC-ee booster and collider in the arc regions. J. Instrum. 2024, 19, T02008. [Google Scholar] [CrossRef]
  9. Hatzigeorgiou, G.D.; Beskos, D.E. Soil–structure interaction effects on seismic inelastic analysis of 3–D tunnels. Soil Dyn. Earthq. Eng. 2010, 30, 851–861. [Google Scholar] [CrossRef]
  10. Guo, J.; Xu, L.; Xu, C.; Chen, R.; Lin, J. Dynamic response analysis on stress and displacement of the shield tunnel structure and soil layer under train-induced vibration in Xiamen Metro Line 6. Sustainability 2022, 14, 11962. [Google Scholar] [CrossRef]
  11. Wang, F.; Shao, J.; Li, W.; Wang, L.; Wang, Y.; Liu, H. Numerical simulation study on lining damage of shield tunnel under train load. Sustainability 2022, 14, 14018. [Google Scholar] [CrossRef]
  12. Khan, M.A.; Sadique, M.R.; Harahap, I.H.; Zaid, M.; Alam, M.M. Static and dynamic analysis of the shielded tunnel in alluvium soil with 2D FEM model. Transp. Infrastruct. Geotechnol. 2022, 9, 73–100. [Google Scholar] [CrossRef]
  13. Sedarat, H.; Kozak, A.; Hashash, Y.M.; Shamsabadi, A.; Krimotat, A. Contact interface in seismic analysis of circular tunnels. Tunn. Undergr. Space Technol. 2009, 24, 482–490. [Google Scholar] [CrossRef]
  14. Yang, Y.; Liang, X.; Hung, H.-H.; Wu, Y. Comparative study of 2D and 2.5D responses of long underground tunnels to moving train loads. Soil Dyn. Earthq. Eng. 2017, 97, 86–100. [Google Scholar] [CrossRef]
  15. Lysmer, J.; Kuhlemeyer, R.L. Finite dynamic model for infinite media. J. Eng. Mech. Div. 1969, 95, 859–877. [Google Scholar] [CrossRef]
  16. ANSYS Inc. Mechanical APDL 2024 R2 Theory Reference. Available online: https://ansyshelp.ansys.com/public/account/secured?returnurl=/Views/Secured/corp/v242/en/ans_thry/ans_thry.html (accessed on 26 August 2024).
  17. Abada, A.; Abbrescia, M.; AbdusSalam, S.S.; Abdyukhanov, I.; Fernandez, J.A.; Abramov, A.; Aburaia, M.; Acar, A.O.; Adzic, P.R.; Agrawal, P.; et al. FCC-ee: The lepton collider: Future circular collider conceptual design report volume 2. Eur. Phys. J. Spec. Top. 2019, 228, 261–623. [Google Scholar] [CrossRef]
  18. Fern, E.J.; Di Murro, V.; Soga, K.; Li, Z.; Scibile, L.; Osborne, J.A. Geotechnical characterisation of a weak sedimentary rock mass at CERN, Geneva. Tunn. Undergr. Space Technol. 2018, 77, 249–260. [Google Scholar] [CrossRef]
  19. Eurocode 2. Design of Concrete Structures—Part 1-1: General Rules and Rules for Buildings; CEN National Members: Brusselss, Belgium, 2004.
  20. Gercek, H. Poisson′s ratio values for rocks. Int. J. Rock Mech. Min. Sci. 2007, 44, 1–13. [Google Scholar] [CrossRef]
  21. Haas, M.; Mongeard, L.; Ulrici, L.; D’Aloïa, L.; Cherrey, A.; Galler, R.; Benedikt, M. Applicability of excavated rock material: A European technical review implying opportunities for future tunnelling projects. J. Clean. Prod. 2021, 315, 128049. [Google Scholar] [CrossRef]
  22. Dassault Systems. Viscous Damping Ratios for Different Systems and Materials. Available online: https://help.solidworks.com/2022/english/SolidWorks/cworks/r_viscous_damping_ratios.htm (accessed on 26 August 2024).
  23. Strømmen, E.N. Structural Dynamics; Springer: Berlin/Heidelberg, Germany, 2014. [Google Scholar]
  24. Bedr, S.; Mezouar, N.; Verrucci, L.; Lanzo, G. Investigation on shear modulus and damping ratio of Algiers marls under cyclic and dynamic loading conditions. Bull. Eng. Geol. Environ. 2019, 78, 2473–2493. [Google Scholar] [CrossRef]
  25. Nishi, K.; Ishiguro, T.; Kudo, K. Dynamic properties of weathered sedimentary soft rocks. Soils Found. 1989, 29, 67–82. [Google Scholar] [CrossRef] [PubMed]
  26. Hoek, E.; Diederichs, M.S. Empirical estimation of rock mass modulus. Int. J. Rock Mech. Min. Sci. 2006, 43, 203–215. [Google Scholar] [CrossRef]
  27. Beskos, D.E.; Anagnostopoulos, S.A. Computer Analysis and Design of Earthquake Resistant Structures: A Handbook; WIT Press: Southampton, UK, 1997. [Google Scholar]
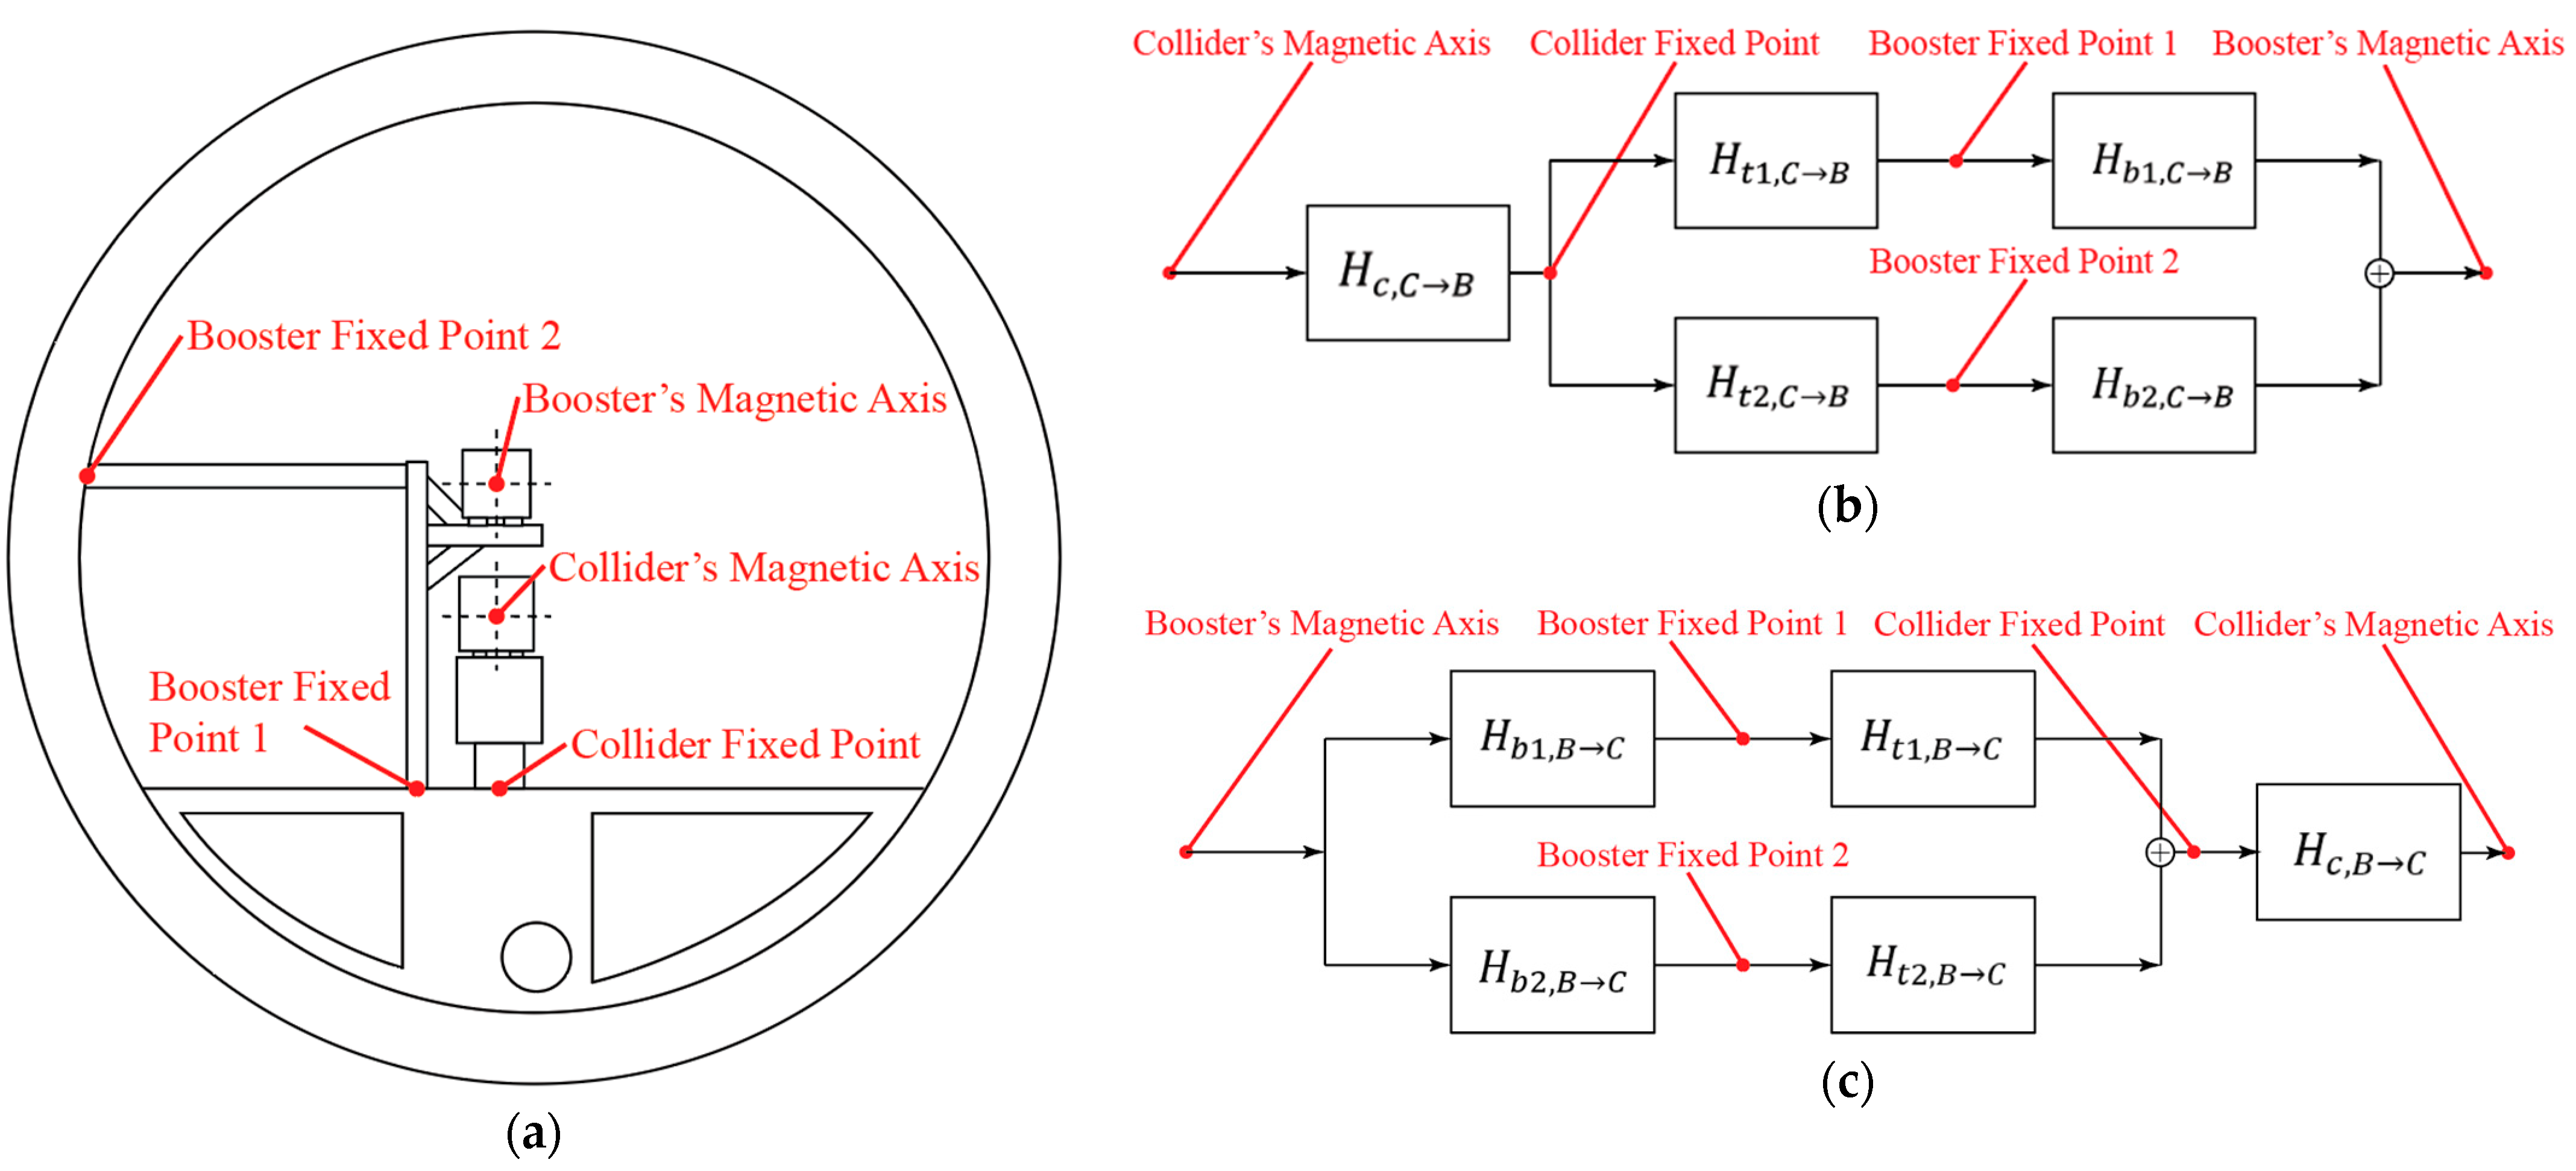
Figure 2. Block diagram of vibrational crosstalk. (a) Diagram of the supporting systems inside the underground circular tunnel and the denominations of the points. (b) The block diagram of transfer function from the Collider’s Magnetic Axis to the Booster’s Magnetic Axis. (c) The block diagram of transfer function from the Booster’s Magnetic Axis to the Collider’s Magnetic Axis.
Vibration 07 00048 g002
Figure 3. (a) The 2 degrees of freedom (DOF) mass-spring-damper system, (b) M detached from the 2-DOF system, and (c) m detached from the 2-DOF system.
Vibration 07 00048 g003
Figure 4. FE Model of FCC-ee tunnel surrounded by a square shape of molasse rock and absorbing boundary element. The colors displayed designate a type of element: the elements with color red are INFIN 257, while those with other color are SOLID183.
Vibration 07 00048 g004
Figure 5. The load case corresponds to the lateral movement of the Collider.
Vibration 07 00048 g005
Figure 6. Transfer functions from Collider fixed point to Booster fixed points (Booster fixed point 1 (ad); Booster fixed point 2 (eh)) (force excitation with displacement response) of the tunnel in various types of rock—sandstone and marl. BPF stands for Booster fixed point, and CPF stands for Collider fixed point (see also Figure 2). The matrix displayed in each graph indicates a component of the transfer function (see Section 2.2.6).
Vibration 07 00048 g006
Figure 7. Transfer functions from Booster fixed points to Collider fixed point (Booster fixed point 1 (ad); Booster fixed point 2 (eh)) (force excitation with displacement response) of the tunnel in various types of rock—sandstone and marl. BPF stands for Booster fixed point, and CPF stands for Collider fixed point (see also Figure 2). The matrix displayed in each graph indicates a component of the transfer function (see Section 2.2.6).
Vibration 07 00048 g007
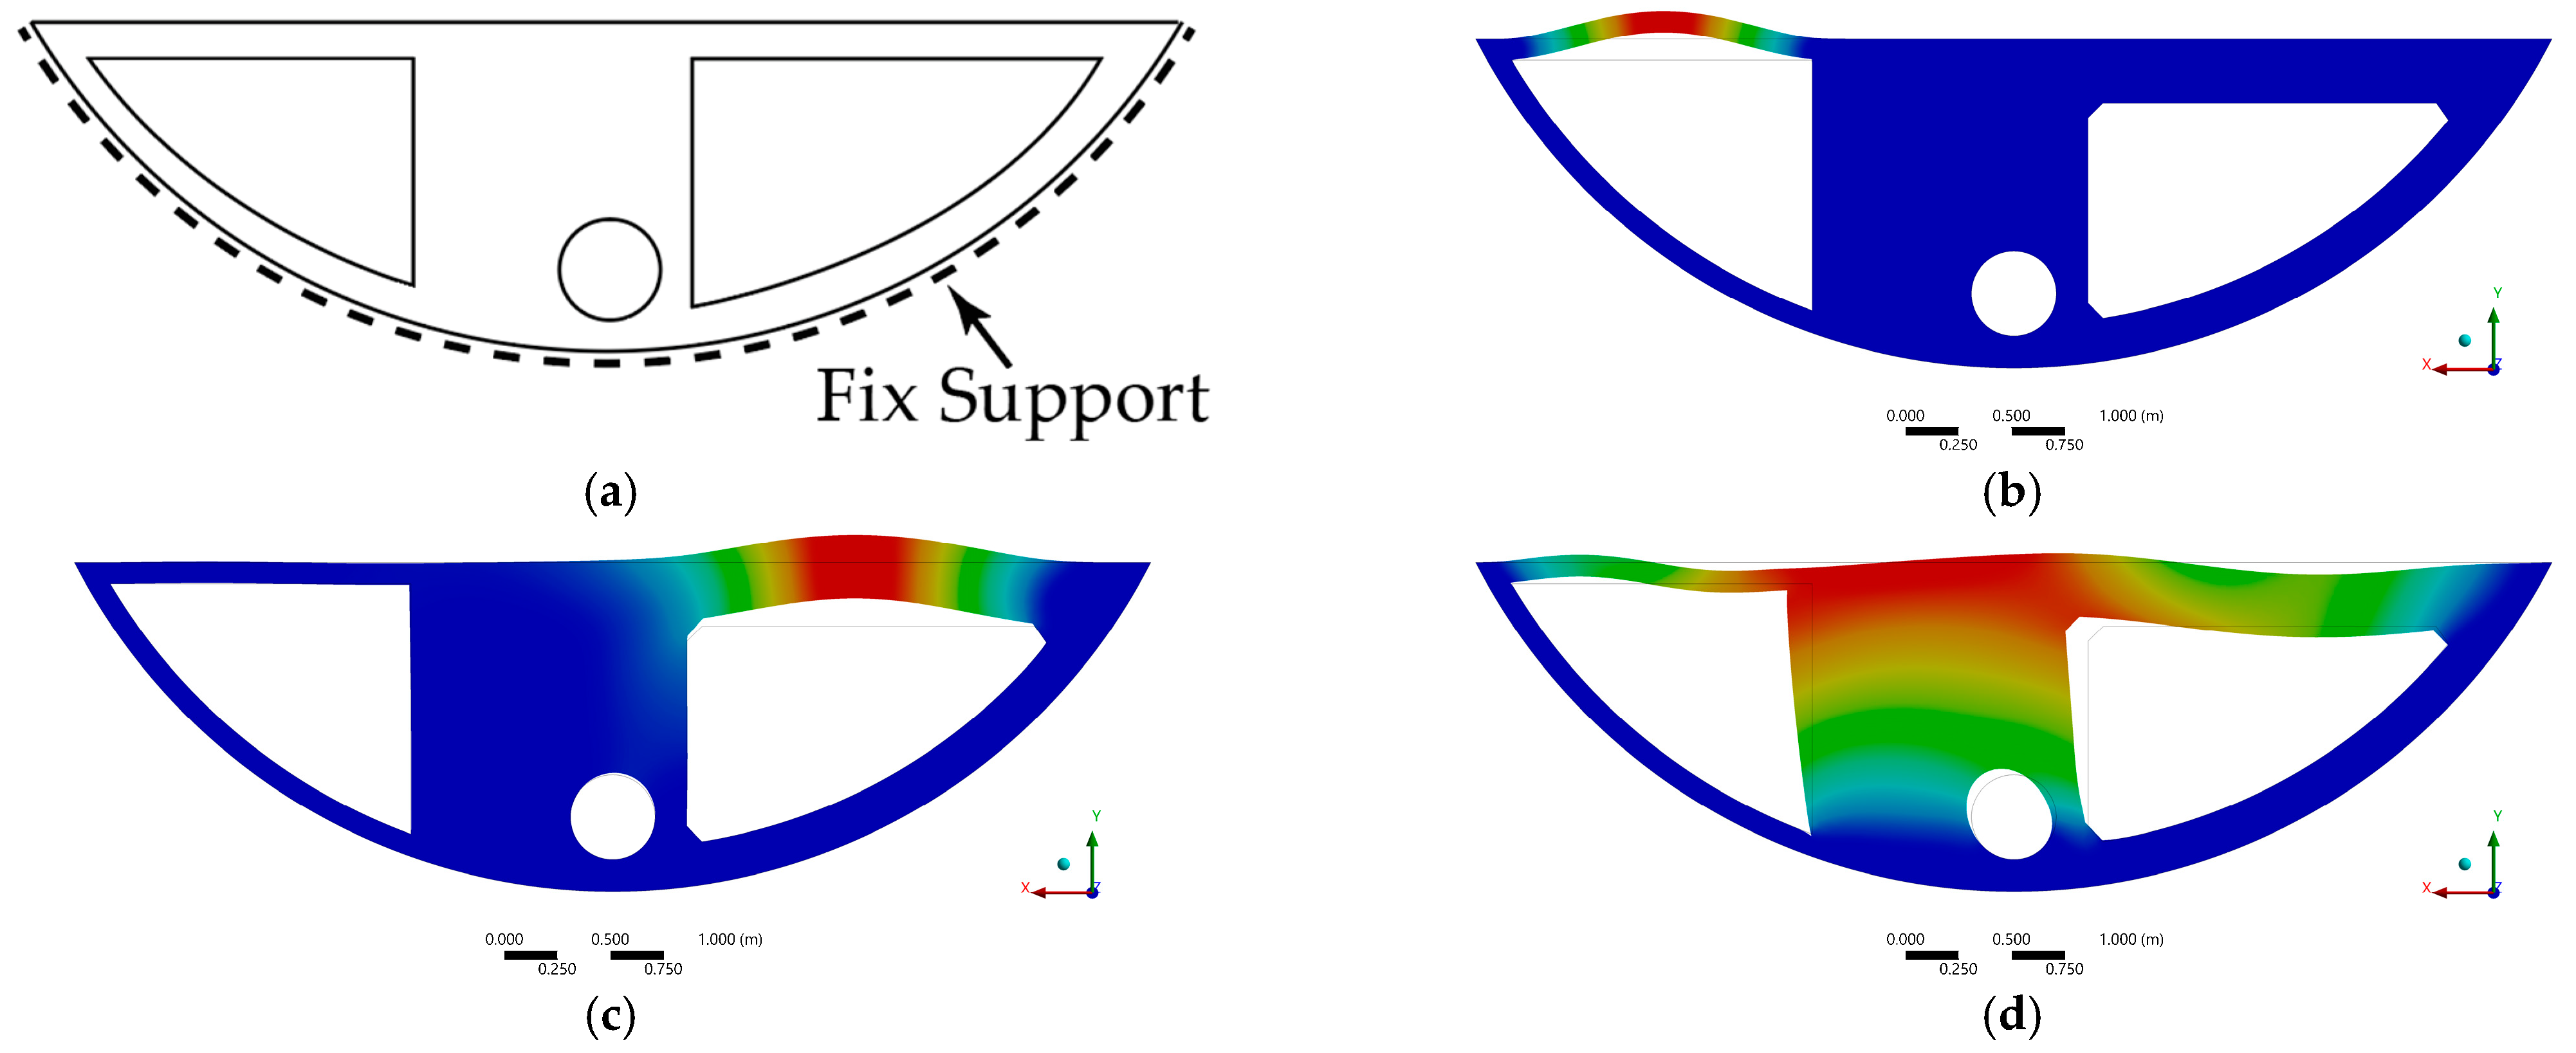
Figure 8. Modal analysis of the fixed concrete invert. (a) Boundary condition of the concreate invert modal analysis. (b) Mode 1: 155 Hz. (c) Mode 2: 249 Hz. (d) Mode 3: 317 Hz.
Vibration 07 00048 g008
Figure 9. Total transfer function from the Collider magnetic axis to the Booster magnetic axis and the transfer functions from ground to the Booster magnetic axis (ground motion amplification).
Vibration 07 00048 g009
Figure 10. Total transfer function from the Booster magnetic axis to the Collider magnetic axis the transfer functions from ground to the Collider magnetic axis (ground motion amplification).
Vibration 07 00048 g010
Table 1. Material properties of marl, intact sandstone, and C20 concrete.
Mechanical PropertiesMarlSandstoneC20 Concrete
Density (kg/m3)250025602475
Poisson’s ratio0.2300.2250.200
Elastic Modulus (MPa)80 (rock mass)3400 (intact)30,000
Material Damping Ratio1%1%3%
Table 2. Literature reviews: boundary condition and the ratio of the domain size and the tunnel.
ResearchBoundary ConditionThe Ratio *
Hatzigeorgiou and Beskos (2010) [9] studied soil–structure interaction.Unified viscous
boundaries
5.8 and 17.5
Guo, Xu, et al. (2022) [10] studied the dynamic response of the tunnel and soil layer under the tunnel induced by the metro train.Free Field boundary
condition
8.1
Wang and Shao (2022) [11] conducted the numerical analysis to determine long-term structural damage from train load.Viscous-spring boundary
condition
8.3
Khan, Sadique, et al. (2022) [12] performed a dynamic analysis of the tunnel located in dry and saturated soil under seismic loading.Standard absorbing
boundary
15
* The ratio = the lateral length of a domain/the diameter of a tunnel.
Disclaimer/Publisher’s Note: The statements, opinions and data contained in all publications are solely those of the individual author(s) and contributor(s) and not of MDPI and/or the editor(s). MDPI and/or the editor(s) disclaim responsibility for any injury to people or property resulting from any ideas, methods, instructions or products referred to in the content.