Article

Railway Track Irregularity Estimation Using Car Body Vibration: A Data-Driven Approach for Regional Railway

by
Hitoshi Tsunashima
1,*,†,‡ and
Nozomu Yagura
2,†
1
Centre for Railway Research, Nihon University, Tokyo 102-0074, Japan
2
MinebeaMitsumi Inc., 210-5 Nihongi, Yonago 689-3541, Japan
*
Author to whom correspondence should be addressed.
These authors contributed equally to this work.
Current address: 1-2-1 Izumi-cho, Narashino-shi, Chiba 275-8575, Japan.
Vibration 2024, 7(4), 928-948; https://doi.org/10.3390/vibration7040049
Submission received: 12 September 2024 / Revised: 29 September 2024 / Accepted: 8 October 2024 / Published: 14 October 2024

Abstract

:
Track and preventive maintenance are necessary for the safe and comfortable operation of railways. Track displacement measured by track inspection vehicles or trolleys has been primarily used for track management. Thus, vibration data measured in in-service vehicles have not been extensively used for track management. In this study, we propose a new technique for estimating track irregularities from measured car body vibration for track management. The correlation between track irregularity and car body vibration was analysed using a multibody dynamics simulation of travelling rail vehicles. Gaussian process regression (GPR) was applied to the track irregularity and car body vibration data obtained from the simulation, and a method was proposed to estimate the track irregularities from the constructed regression model. The longitudinal-level, alignment, and cross-level irregularities were estimated from the measured car body vibrations and travelling speeds on a regional railway, and the results were compared with the actual track irregularity data. The results showed that the proposed method is applicable for track irregularity management in regional railways.

1. Introduction

Because the wheels of rail vehicles are guided by the track, proper track condition management is necessary to maintain safety during daily operations. Track conditions deteriorate owing to the daily running of trains and the effects of natural phenomena such as weather. The resulting remaining displacement of the sleepers and rails is called track irregularity or track fault. In particular, track irregularities are closely related to the ride quality and safety of rail vehicles and include longitudinal-level irregularities in the vertical direction, alignment irregularities in the lateral direction, and cross-level irregularities. The irregularity is a common issue in the moving load-structure system in railway engineering [1,2].
Many railway operators use special track inspection vehicles to measure track irregularities. In recent years, major railway operators have developed and introduced track monitoring equipment that can be installed under the floors of operating vehicles to diagnose track conditions. However, because of the high cost of these methods, local railway operators with limited manpower and financial resources cannot perform sufficient inspections.
To address this problem, a system has been developed to diagnose track conditions from measured car body vibrations by installing sensing devices comprising global navigation satellite system (GNSS), accelerometers, gyros, and other sensors on the car body of in-service vehicles [3]. Track condition diagnostic systems have shown that track faults can be detected from measured car body vibrations [4,5]. However, these methods directly use car body vibrations to assess track conditions; therefore, implementing this system for railway operators who manage track irregularities based on displacement measurements may be challenging.
Track irregularities such as longitudinal-level, alignment, cross-level, gauge, and twist (depicted in Figure 1) should be managed properly for safety reasons. Track maintenance and management are based on the measured track displacement data. Figure 2 shows the target value of track irregularity correction for riding comfort and safety on conventional lines currently used by the Japan Railways Group. However, track-displacement measurements require expensive equipment, such as track inspection vehicles and measuring devices. Therefore, a more economical management method is required, particularly for regional railways. Other track management methods also exist, such as train vibration based inspections using in-service vehicle vibration measurements [6].
There are three major types of sensor arrangements for track condition monitoring using in-service trains. The first is to mount the sensor on the axle-box. This method has the advantage of direct measurements of the track condition, but it also creates new maintenance issues because the axle-box-mounted sensors are exposed to severe vibration. The relationship between axle-box accelerations and railway track defects or irregularities has been analysed and used to identify track faults [7,8,9,10,11].
The second method is to mount the sensor on the bogie. This method is easier to maintain than mounting on the axle-box but requires careful consideration of the position of the sensor to be mounted on the bogie. A track irregularity monitoring method using bogie-mounted sensors has been proposed in references [12,13,14].
The method with the best maintainability is to install sensors inside the car. In this method, vibrations generated by track geometry are transmitted to the car body via the primary and secondary suspensions. Therefore, it is necessary to examine the effect of track conditions on the car body vibration. Tsunashima et al. developed a system to identify track faults using accelerometers and a GNSS placed on the car bodies of in-service vehicles [15,16]. Bai et al. used low cost accelerometers placed on or attached to the floors of operating trains to analyse track conditions [17]. Track condition monitoring based on bogie and car body acceleration measurements was presented and verified [18]. Balouchi presented a cab-based track-monitoring system [19]. Chellaswamy et al. proposed a method for monitoring railway track irregularities by updating the status of tracks in the cloud [20].
Recently, a method was proposed for diagnosing track conditions by substituting dedicated sensing devices with general purpose smartphones. Rodríguez et al. proposed the use of mobile applications to assess the quality and comfort of railway tracks [21]. Cong et al. proposed the use of a smartphone as a sensing platform to obtain real-time data on vehicle acceleration, velocity, and location [22]. Paixão et al. proposed the use of smartphones to perform constant acceleration measurements inside in-service trains, which can complement the assessment of the structural performance and geometrical degradation of the tracks [23]. A smartphone based track condition monitoring system was developed for regional railways in Japan [24].
Model-based estimation techniques have been proposed to solve the inverse problem of estimating track geometry from vehicle vibrations. Kalman filter-based methods have been proposed to estimate track geometry from car body motions [25,26]. However, these methods present significant challenges for railway operators if used on a daily basis. Paglia et al. proposed a method to predict track longitudinal-level irregularity using the bogie vertical acceleration from in-service vehicles [27]. A linear regression model was used to estimate track irregularity. Tsunashima proposed a method for estimating longitudinal-level track irregularity using Gaussian process regression (GPR) based on data obtained from a vehicle travelling simulation [28]. However, in these methods, the alignment and cross-level irregularities were not considered.
In this study, a regression model is constructed from data obtained from simulations of running railway vehicles, comprising track irregularities and car body vibrations, and a method for estimating track irregularities. GPR, a statistical approach that is effective for nonlinear regression problems, is used as the regression analysis method. The measured car body vibration data are input into the regression model constructed using this method to estimate track irregularities. As the target of this research is regional railways, the speed at which this method can be applied is assumed to be 80 km/h or less.
The remainder of this paper is organised as follows: Section 2 describes the proposed procedure for track irregularity estimation. In Section 3, track irregularity and car body vibration data under various conditions are collected using a vehicle travel simulation, and the relationship between car body vibration and track irregularities is analysed. A regression analysis of the car body vibration and track irregularity is presented in Section 4. The proposed method is then applied to the measured car body vibrations recorded on a regional railway line in Section 5, and the results are presented. Finally, Section 6 summarises and discusses future research.

2. Measurement System and Procedure for Estimating Track Irregularities

2.1. Onboard Sensing Device and Track Condition Monitoring System

An onboard sensing device [16] consisting of a three-axes accelerometer, a rate gyro, and a GNSS receiver for identifying the vehicle’s position was installed in the upper part of the front of the vehicle body to measure the vehicle vibration (Figure 3). The sampling frequency of the measured data is 82 Hz. This device is powered by the vehicle and continuously records the vehicle vibration and position during operation.
The data used in this study were obtained by using the track condition monitoring system [16]. Figure 4 shows the track condition monitoring system used for data collection. The collected car body vibration data were transmitted to the server via a mobile phone network. A diagnosis based on the car body vibration data transmitted to the server was undertaken. Continuous monitoring of the track condition using this system enabled the detection of track faults.
The line for which the data was measured is a regional railway in the Tohoku region of Japan, and the main data is as follows: line length: 30.5 km, rail gauge: 1067 mm, number of stations: 17, track type: non-electrified single track, maximum operation speed: 85 km/h.

2.2. Procedure for Estimating Track Irregularities

The track irregularity estimation procedure is shown in Figure 5 and Figure 6:
1.
A railway vehicle model is prepared with multibody dynamics.
2.
From the track irregularity power spectrum density (PSD), we generate track geometries for the profile, alignment, and cross-level.
3.
The longitudinal-level and alignment irregularities are calculated using the 10 m-chord versine method.
4.
The vehicle model is travelled on a track with the generated track geometries, and the vertical acceleration, lateral acceleration, and roll rate are calculated.
5.
A dataset is created with the calculated maximum value of the car body vibration as input x and track irregularity as output y.
6.
GPR is applied to the dataset to create a regression model.
7.
The measured car body vibration of the actual vehicle is input into the constructed regression model to statistically estimate the track irregularity.
One reason for using Gaussian process regression as the estimation method is that it can output the confidence level at the same time as the estimated value. On the other hand, in addition to Gaussian process regression, the use of neural networks and other regression methods is also possible. A comparison of the effectiveness of these methods is a topic for the future study.

3. Generation of Track Irregularity and Car Body Vibration

3.1. Overview of the Simulation

The aim of this study is to construct a regression model from car body vibration and track irregularity data to estimate track irregularities. However, as mentioned in the Introduction, regional railway operators with limited financial and human resources can only conduct track inspections approximately once a year; thus, obtaining sufficient data to ensure reliability is difficult. In this study, track irregularity and car body vibration data under various conditions are collected using a vehicle-travel simulation, and the relation between the car body vibration and track irregularities is analysed.

3.2. Vehicle Model

The simulation model must output the vertical acceleration, lateral acceleration, and roll rate of the car body with the track geometry, that is, profile, alignment, and cross-level, as track displacement. Therefore, a railway vehicle model with multibody dynamics is prepared, and a vehicle-travel simulation is conducted. Travelling simulations are performed using SIMPACK, which is a software package extensively used in the railway field.
Figure 7 shows the constructed vehicle model. The vehicle model comprises seven rigid bodies (one car body, two bogies, and four wheelsets), each of which has six degrees of freedom, resulting in a total of 42 degrees of freedom. The car body, bogie, and wheelset are connected and supported by spring and damper elements. By inputting the track geometry to the vehicle model and running the vehicle, the vertical acceleration, lateral acceleration, and roll rate of the vehicle, which are the vehicle motions just above the centre of the front bogie, are calculated.
The vehicle parameters used for the simulation are listed in Table 1, and they were set to match the car body vibration measured on a regional railway. The running distance was set to a straight section of 1000 m, and the sampling frequency was set to 100 Hz.

3.3. Track Model

The track PSD spectrum is widely used for dynamic simulations of railway vehicles [29,30,31]. The track PSD spectrum, characterised by a single-sided spectrum, is expressed as follows:
  • Profile
    S p ( Ω ) = A p Ω c 2 Ω 2 + Ω r 2 Ω 2 + Ω c 2
  • Alignment
    S a ( Ω ) = A a Ω c 2 Ω 2 + Ω r 2 Ω 2 + Ω c 2
  • Cross-level
    S c ( Ω ) = A c Ω c 2 / a 2 Ω 2 Ω 2 + Ω r 2 Ω 2 + Ω c 2 Ω 2 + Ω s 2
    where the following is true:
    • S p ( Ω ) , S a ( Ω ) , S c ( Ω ) : PSD of track geometry [ mm 2 / ( rad / m ) ] ;
    • Ω : spatial angular frequency [rad/m];
    • Ω c , Ω r , Ω s : critical spatial angular frequency [rad/m];
    • a: half of the nominal rolling circle distance of the wheel;
    • A p , A a , A c : roughness coefficients for track geometry.
Parameters of track PSD model are depicted in Table 2.
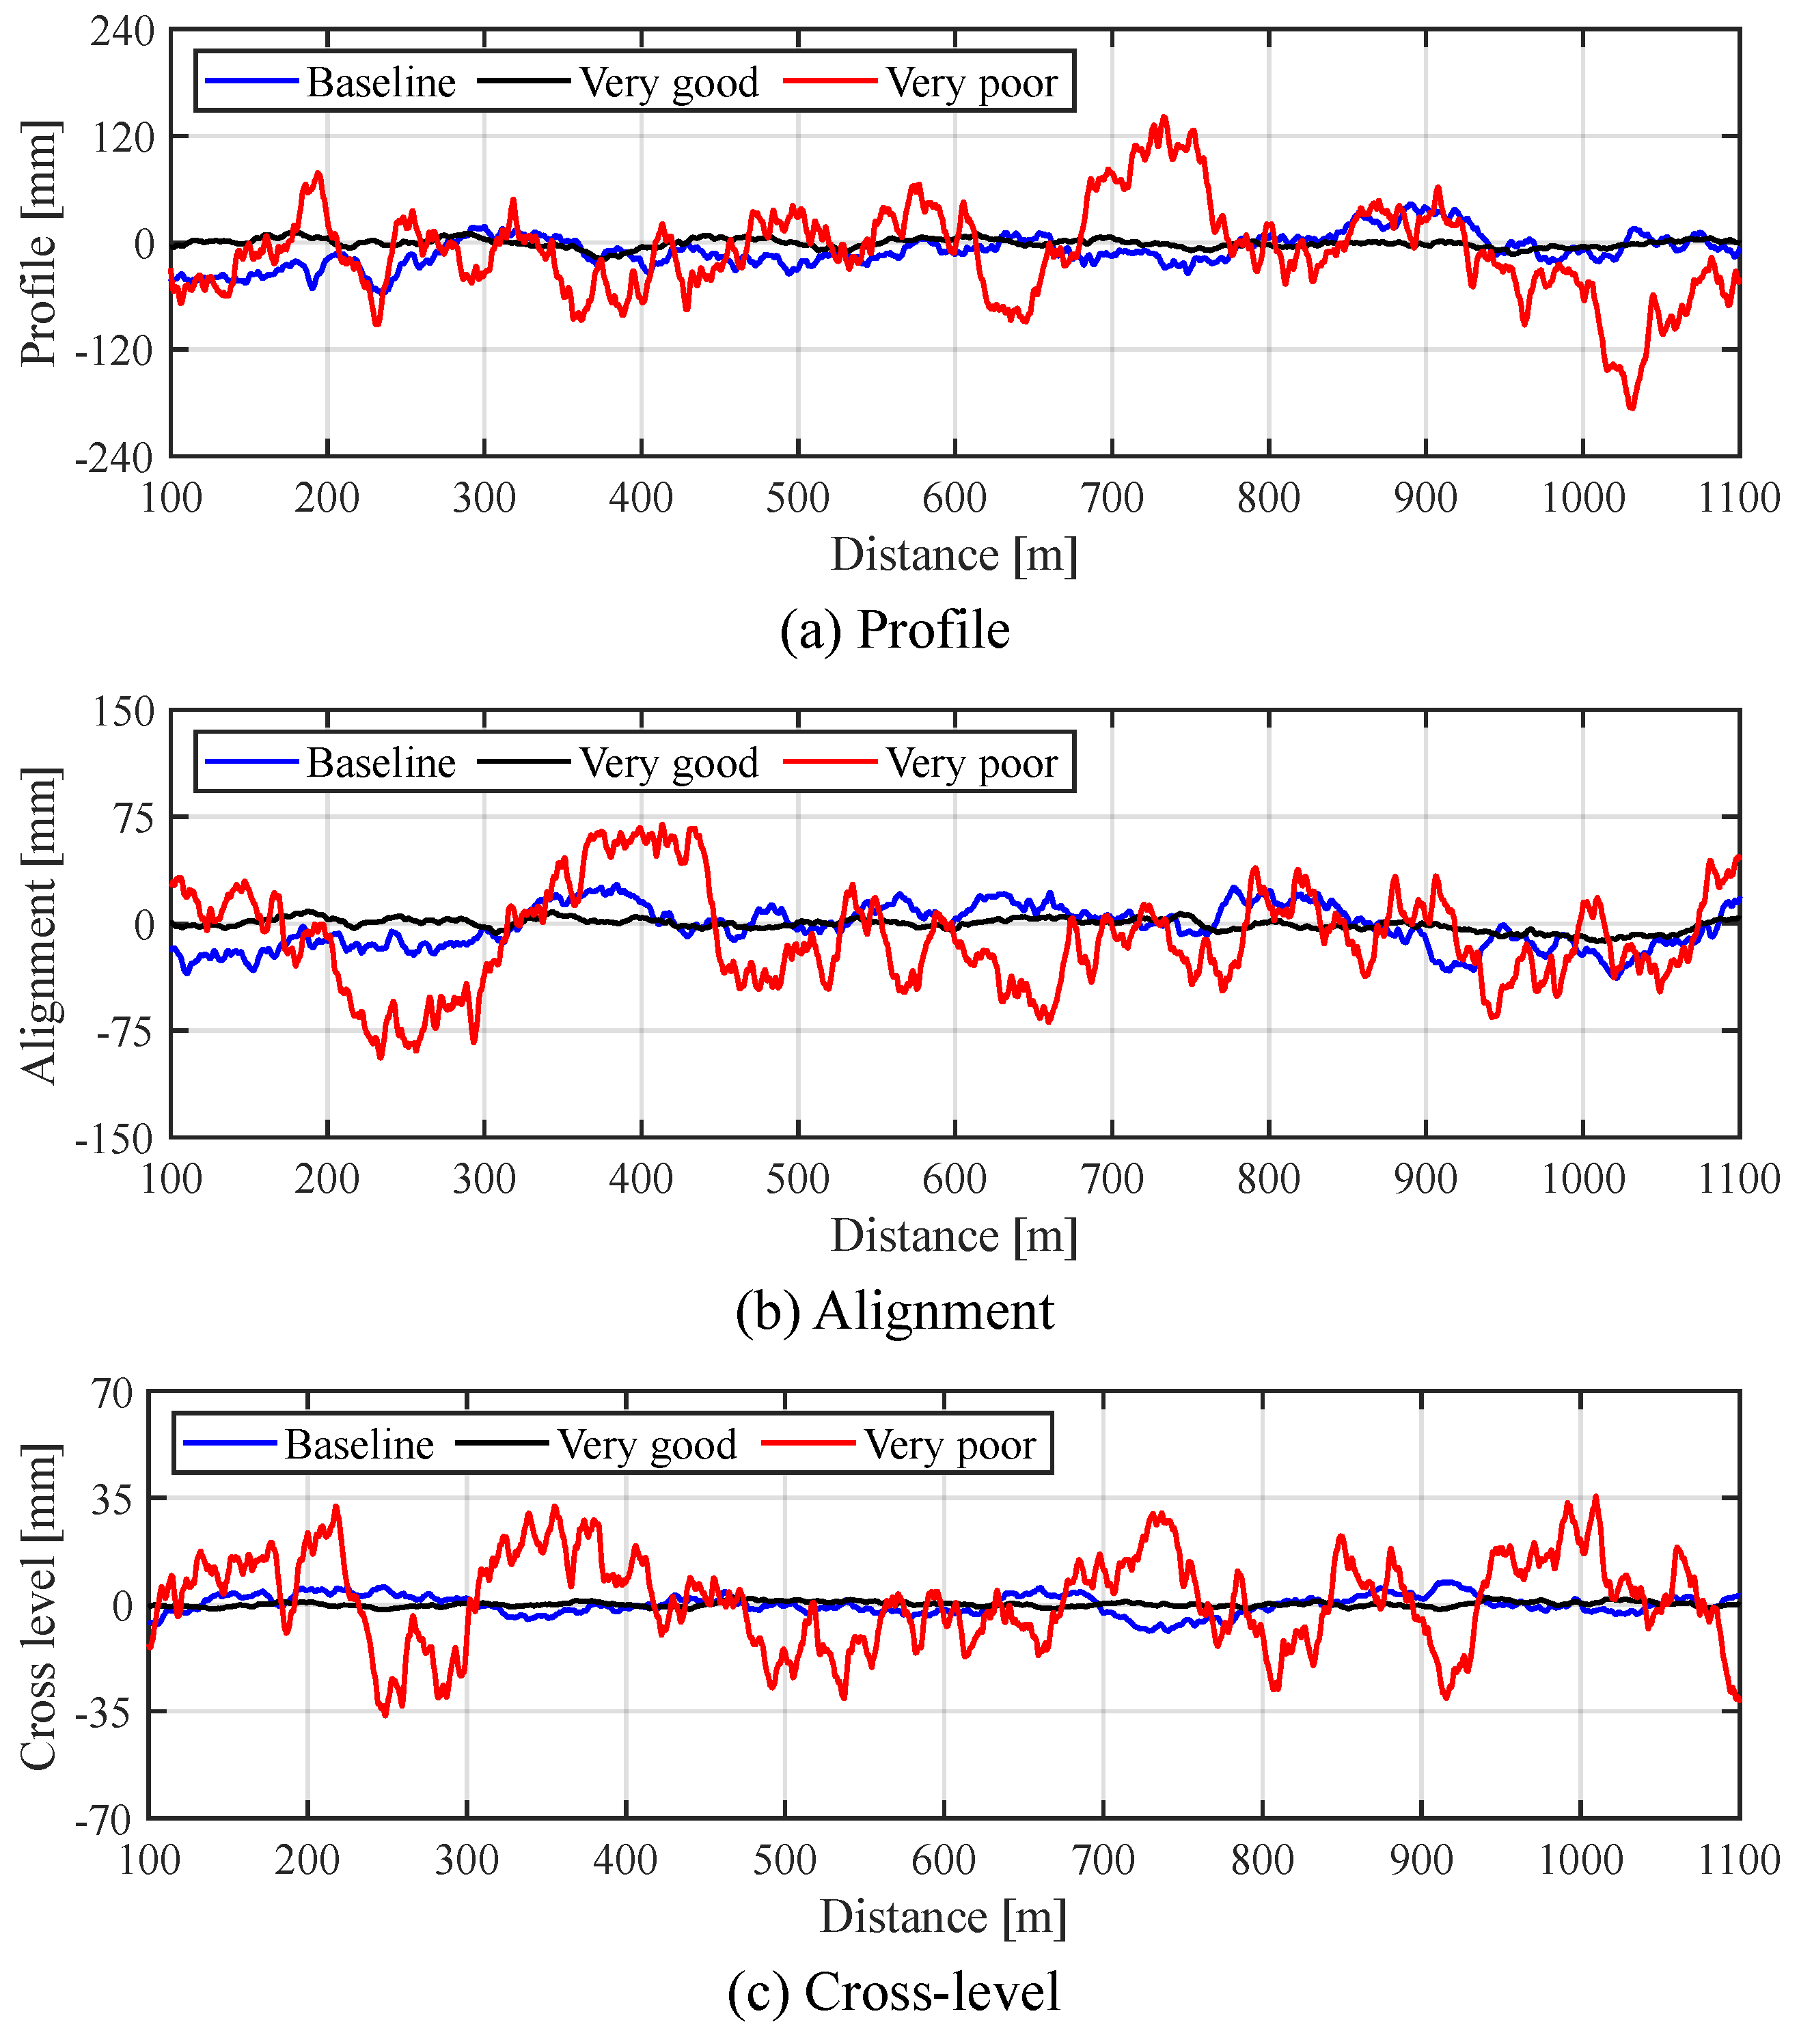
In this study, the roughness coefficients of the PSD functions for each track irregularity, A p , A a , and A c , are varied to generate 12 tracks from good to degraded conditions. The roughness coefficients for longitudinal-level and cross-level, A p and A c , are usually the same, but in this study, they are listed separately to allow for independent deterioration of track irregularity. As a representative example, the PSDs for the best, nominal, and worst conditions of the profile, alignment, and cross-level of the track geometry are shown in Figure 8, and the track geometry generated by the PSDs is shown in Figure 9.
Generally, longitudinal-level and alignment irregularities on Japanese conventional railways are measured and controlled by the 10 m-chord versine method, in which a 10 m string is stretched over the rail and the distance between the string and the actual geometry at the centre position of the string is measured. The equation for the 10 m chord versine method is as follows:
a ( x ) = b ( x ) b ( x 5 ) + b ( x + 5 ) 2 ,
where a ( x ) is the 10 m-chord versine, and b ( x ) is the actual track geometry, x is the distance in metres.
The track geometry shown in Figure 9 was converted to track irregularities using the 10 m-chord versine method using Equation (4) and regression analysis was performed.

3.4. Evaluation of Simulation Model

To evaluate the validity of the vehicle and track model, a comparison was made between the simulation results and the car body vibration measured on an actual regional railway. The track geometry used in the simulation was the 100–500 m section of the baseline track shown in Figure 9. On the other hand, the track geometry of the actual track has not been measured. Therefore, it is not possible to conduct travelling simulations using the track geometry of the actual track as input and compare the time series data. Thus, a comparison of power spectral densities (PSD) was performed.
The data from the actual vehicle used for the comparison was a 400 m straight section with a travelling speed of 60 km/h. The data was measured on 2 April 2022. The simulated car body vibration was obtained by travelling at a speed of 60 km/h on the 100–500 m section of the baseline track shown in Figure 9. The sampling frequency of the measured data is 82 Hz, and the sampling frequency of the simulation is 100 Hz.
In the simulation, we compared the car body vibration just above the front bogie with the car body vibration at the actual measurement point (upper side of the cab). The relationship between the amplitude ratio (the value at the measurement point on the actual vehicle divided by the value just above the bogie) and the speed is shown in Figure 10. In this study, the conversion is carried out using the average of these values. In addition, similar results were obtained for the values actually measured at speeds of 60 km/h to 70 km/h.
Simulations and measurements using an actual vehicle showed that the vertical acceleration was about 1.20 times larger and the lateral acceleration was about 1.41 times larger at this location than at the location just above the bogie. Therefore, the vertical acceleration of the actual car body was divided by 1.20, and the lateral acceleration was divided by 1.41 for comparison. Figure 11 shows the comparison results.
Figure 11 shows that the PSDs of the vertical and lateral accelerations in the simulations generally agree with the measured data in the frequency range of 0.5–10 Hz. Differences occur because the measured data include the effects of track faults other than track irregularities. In the PSD of the roll rate in Figure 11c, differences between the simulation and measurement data are observed in the low-frequency region below 1 Hz. This is probably due to the difference between the track geometry used in the simulation and the actual track geometry, but the cause of the difference needs to be investigated in the future.
It can be seen that there are differences between the data obtained from the running simulation and the measurement results for a given line. In particular, the PSD of the roll rate shows a large difference in the frequency range below 1 Hz. This difference may be due to the difference in statistical properties between the assumed standard gauge and the actual measured data.
The purpose of this study is to provide a general method for estimating track irregularities by regression analysis based on the relationship between car body vibration and track irregularities. To evaluate the accuracy of the proposed method for a particular track, it is necessary to fully consider the car body vibration and track irregularity data obtained for the regression analysis. Since track irregularity data have not been sufficiently accumulated for the track evaluated in this study, the evaluation was conducted using only the data obtained from running simulations.

3.5. Relation between Car Body Vibration and Track Irregularity

3.5.1. Feature Space Consisting of Car Body Vibration

Car body vibration (vertical acceleration, lateral acceleration, and roll rate) is calculated by running the vehicle for 1000 m in the speed range of 40–80 km/h, varying the speed at intervals of 10 km/h:
  • Case 1: Tracks in which only the longitudinal-level irregularity is statistically varied,
  • Case 2: Tracks in which only the alignment irregularity is statistically varied,
  • Case 3: Tracks in which only the cross-level irregularity is statistically varied.
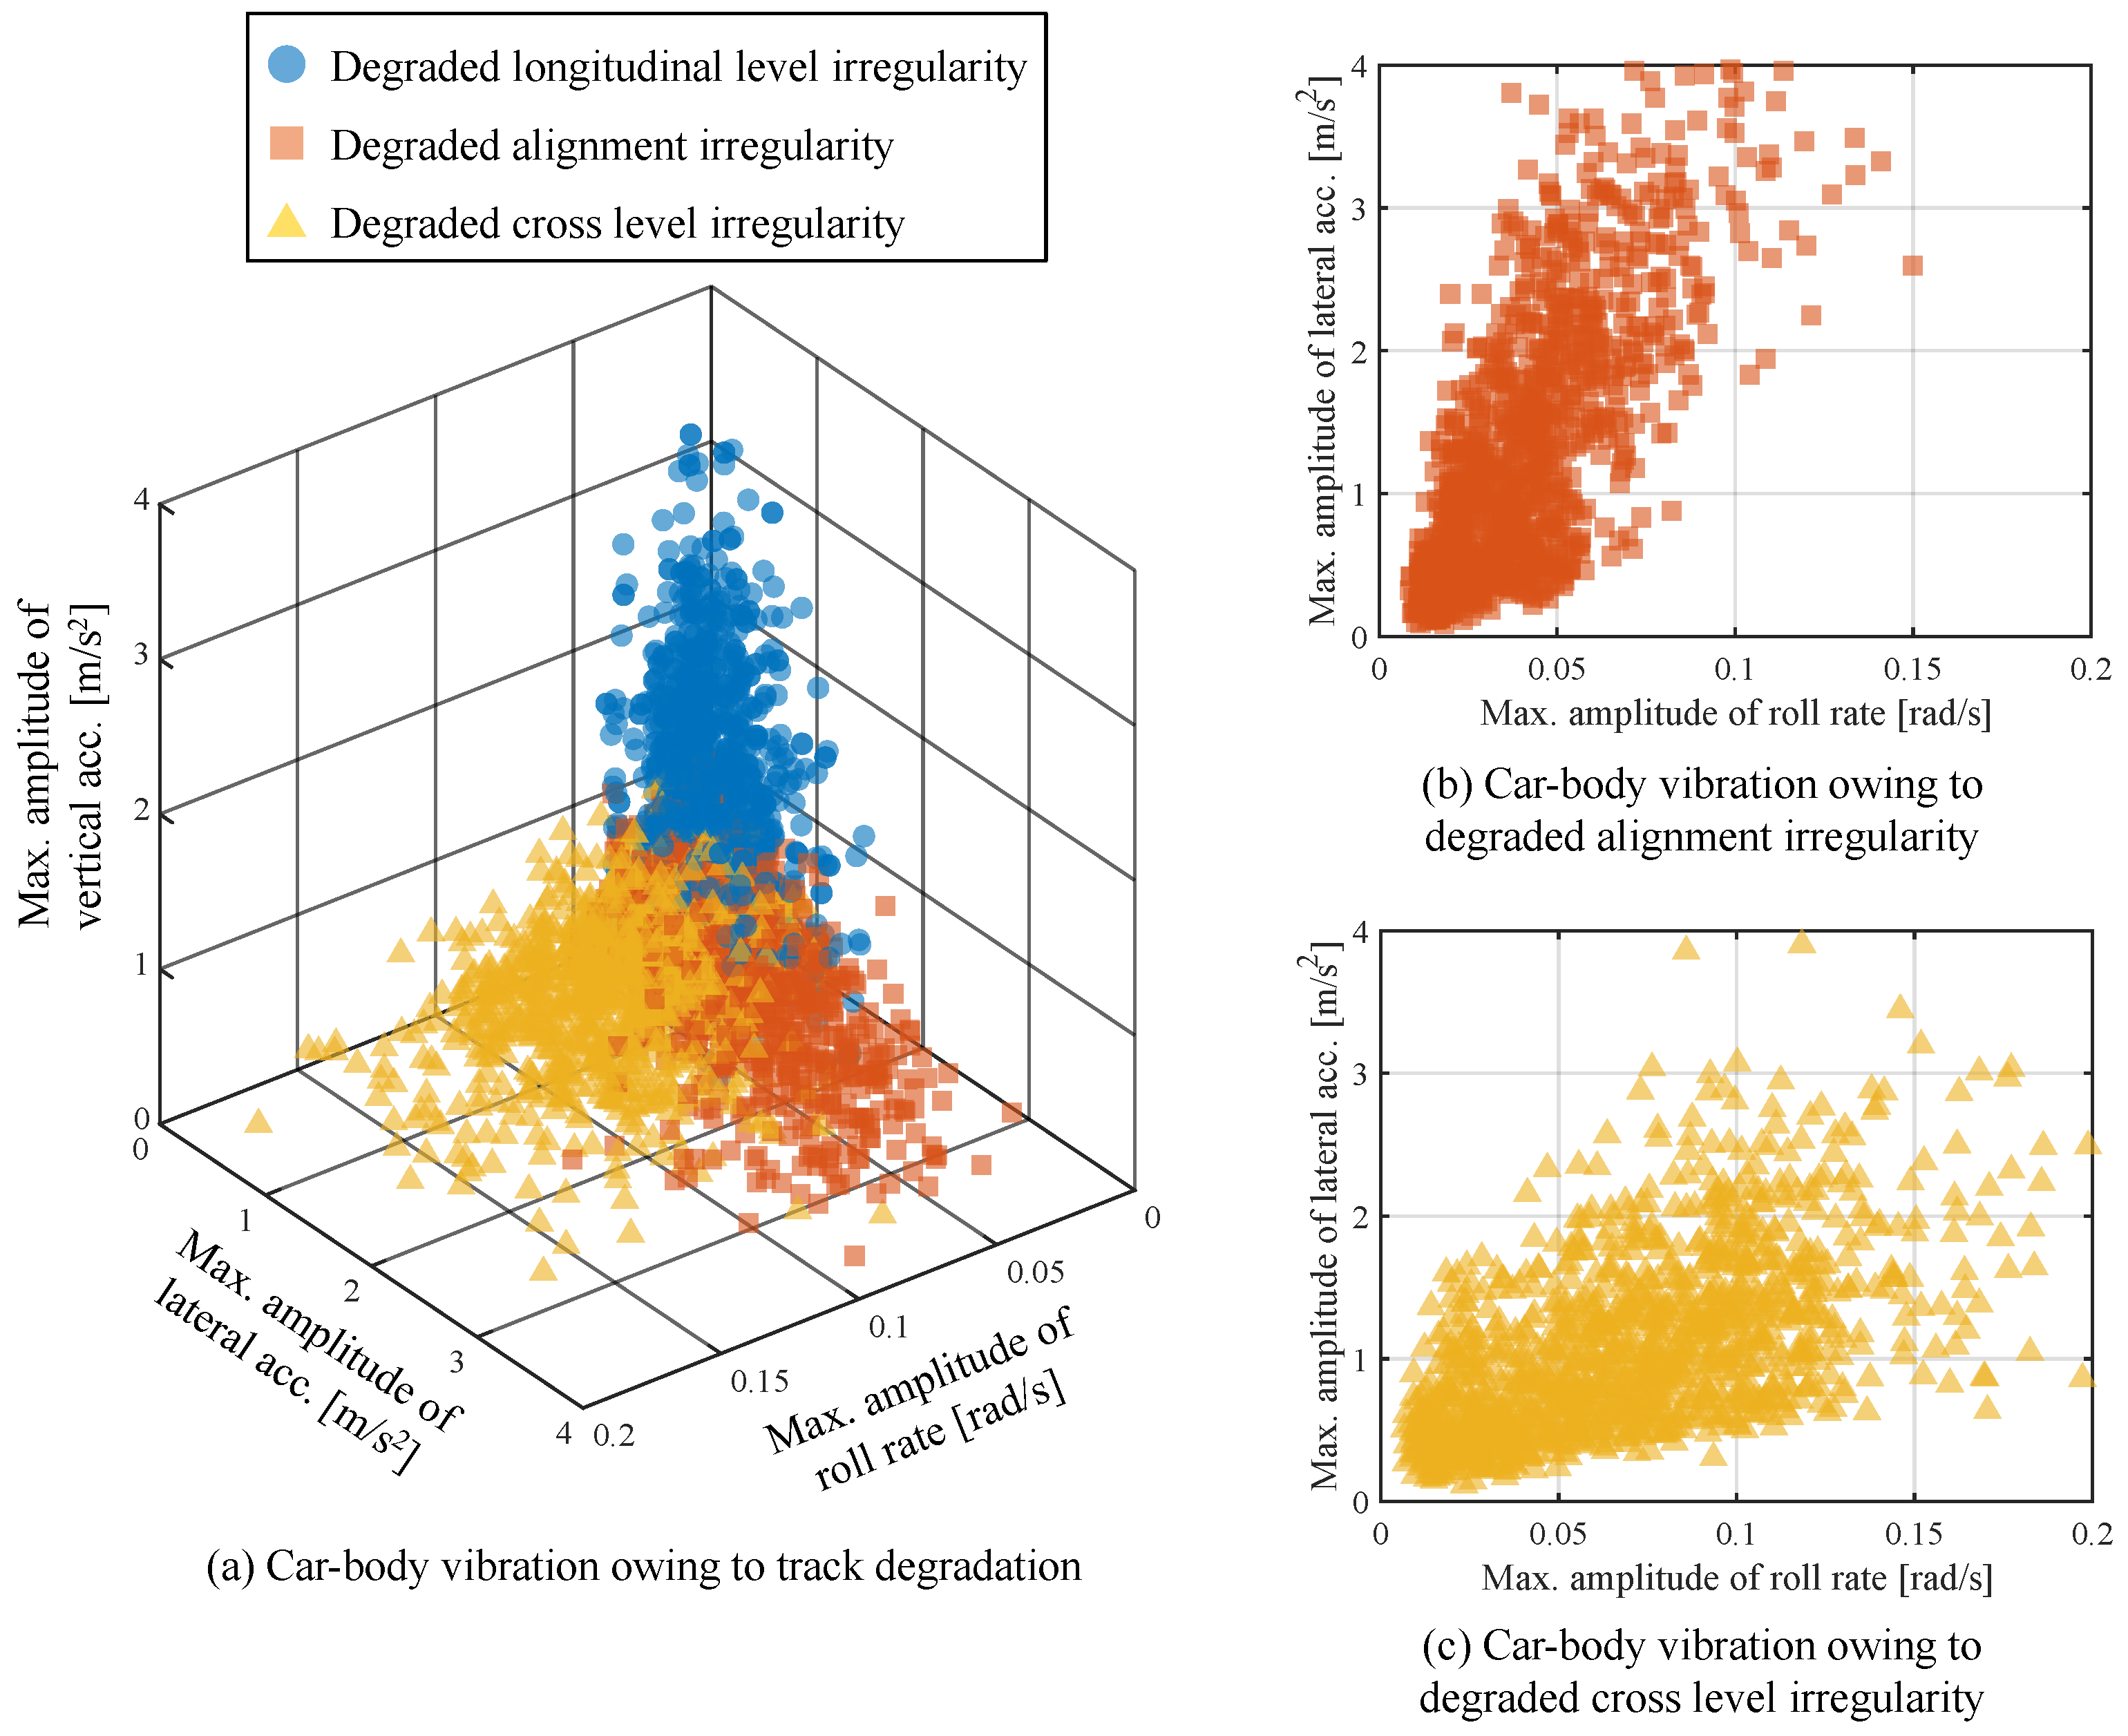
Figure 12 shows the feature space consisting of the maximum amplitude values for each 10 m long section of the car body vibration obtained by travelling the track in cases 1, 2, and 3 at a speed of 60 km/h.
Figure 12 shows that the deterioration of the longitudinal-level irregularity is strongly correlated with the vertical acceleration. The deterioration of the alignment and cross-level irregularities is correlated with both the lateral acceleration and roll rate. Specifically, the former has a greater effect on the lateral acceleration, whereas the latter has a greater effect on the roll rate.

3.5.2. Construction of a Dataset Comprising Car Body Vibration and Track Irregularities

A dataset comprising the maximum values of the car body vibration and track irregularity for each 10 m long section obtained from the simulation is constructed. Based on the correlation analysis of track irregularity and car body vibration shown in Figure 12, the dataset pairs the vertical acceleration with longitudinal-level irregularity, lateral acceleration with alignment irregularity, and roll rate with cross-level irregularity. Although the alignment and cross-level irregularities are correlated with both lateral acceleration and roll rate, the vibration that is more strongly correlated with the corresponding track irregularity is used in this study.
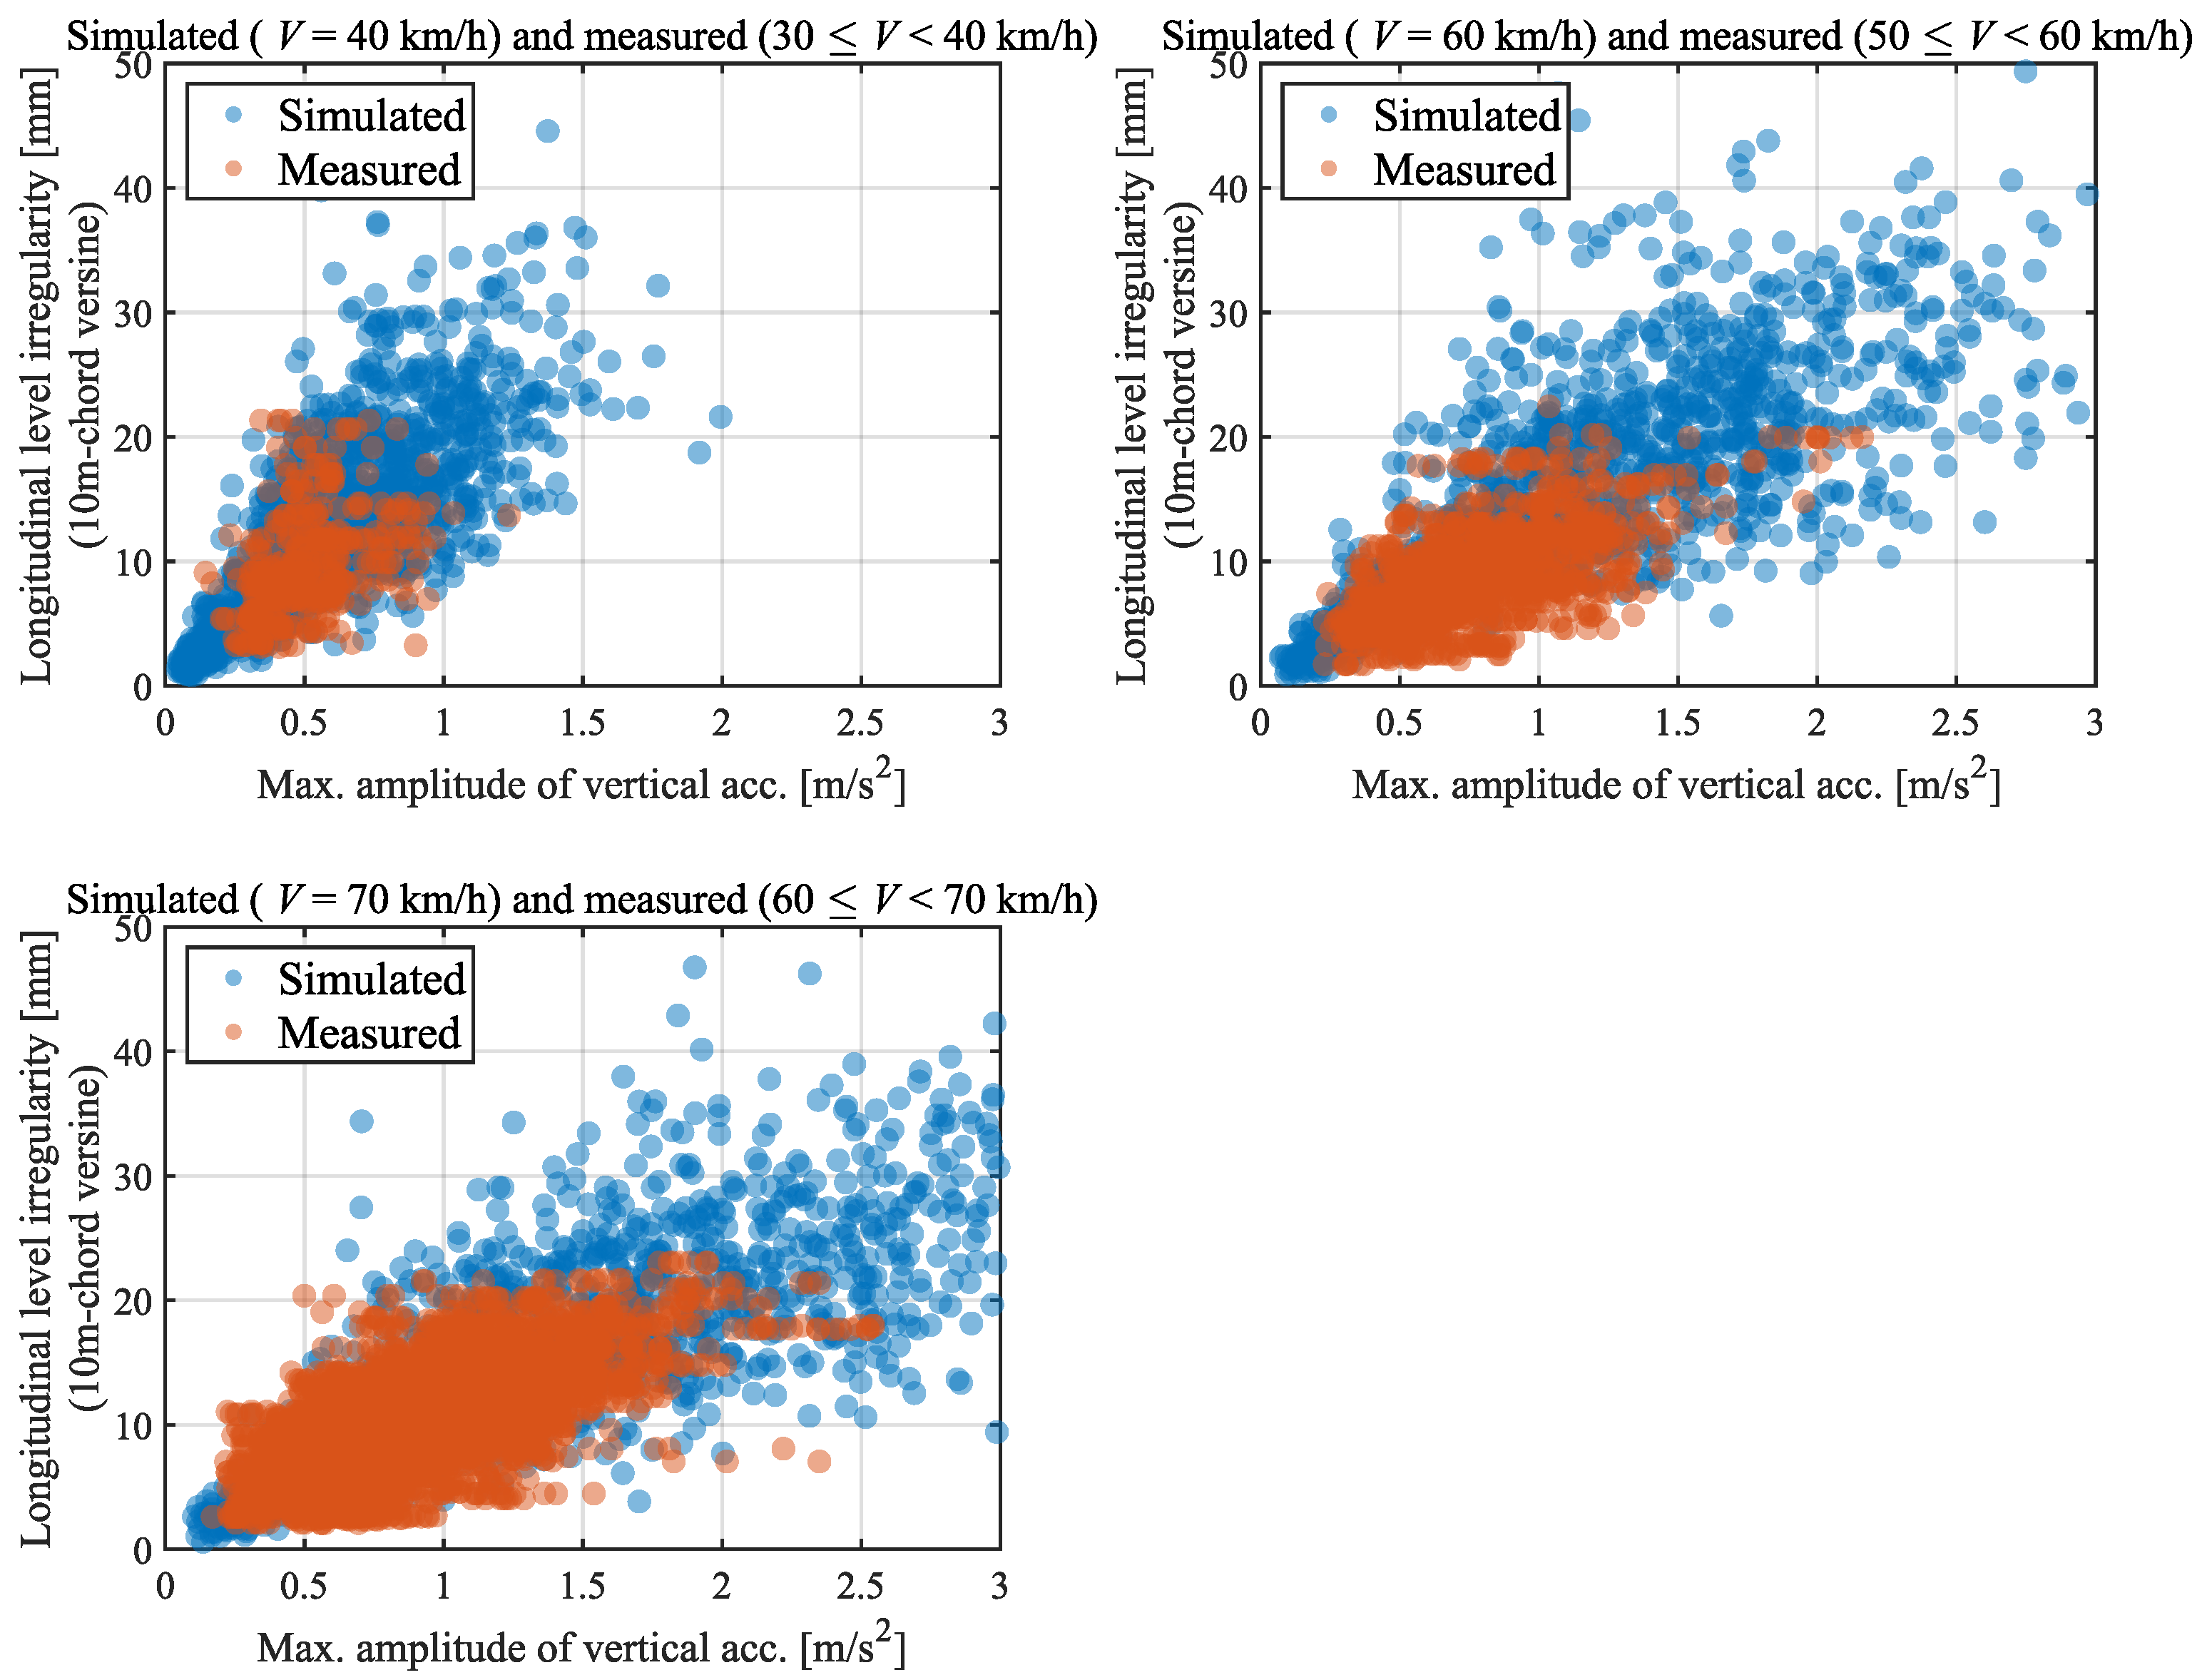
Figure 13 shows the data for the vertical acceleration and longitudinal-level irregularity at running speeds of 40, 60, and 70 km/h. We obtain data on the vertical acceleration of the car body at speeds of 30–40, 50–60, and 60–70 km/h measured on a regional railway as well as the longitudinal-level irregularity measured by a track inspection vehicle. The simulated and measured data corresponding to the travelling speeds are compared in Figure 13.
The vertical acceleration of the car body is measured in the cab of the vehicle, and the simulation results reveal that the vertical acceleration is approximately 1.20 times greater than that measured above the bogie. Therefore, for the comparison with the simulation results, the measured vertical acceleration is divided by 1.20 and converted to a value above the bogie. Figure 13 shows that the simulated and measured data are in good agreement, confirming the usefulness of the simulated data.

4. Regression Analysis of Car Body Vibration and Track Irregularity

4.1. Gaussian Process Regression (GPR)

We examine the relationship between the car body vibration and track irregularity using GPR, which is a nonlinear regression method [32]. GPR is a nonparametric Bayesian approach to nonlinear regression problems that can provide uncertainty in predictions.
GPR defines two elements: training data comprising pairs of input x and output y and a kernel function k x , x providing the covariance of the Gaussian distribution, which is the similarity between inputs x and x .
Given the training data D = x 1 , y 1 , , x N , y N , the output of the test data for a new input is expressed as follows:
p y x , D = N k T K 1 y , k k T K 1 k ,
where
K = k x 1 , x 1 , k x 1 , x 2 k x 1 , x N k x 2 , x 1 , k x 2 , x 2 k x 2 , x N k x N , x 1 , k x N , x 2 k x N , x N , k = k x , x 1 , k x , x 2 , , k x , x N T , k = k x , x , y = y 1 , y 2 , , y N T .
We use the radial basis function (RBF) kernel and white kernel described as follows:
k x , x = θ 1 exp x x 2 θ 2 + θ 3 δ ( x , x ) ,
where θ 1 , θ 2 , and θ 3 are hyper-parameters and δ is the Kronecker’s delta, which is 1 when x = x and 0 when x x .
The white kernel (second term in Equation (6)) is a kernel function on the magnitude of noise in the objective variable and is useful when the dataset contains noise. In Equation (6), the hyper-parameters ( θ 1 , θ 2 , θ 3 ) control to what extent the data are similar. Optimising the hyper-parameters therefore improves the fitting performance to the measured data. The hyper-parameters are optimised by the maximum-likelihood estimation.
The predicted mean and the variance are calculated as follows:
E y x , D = k T K 1 y ,
V y x , D = k k T K 1 k .

4.2. Track Irregularity Estimation Using Gaussian Process Regression

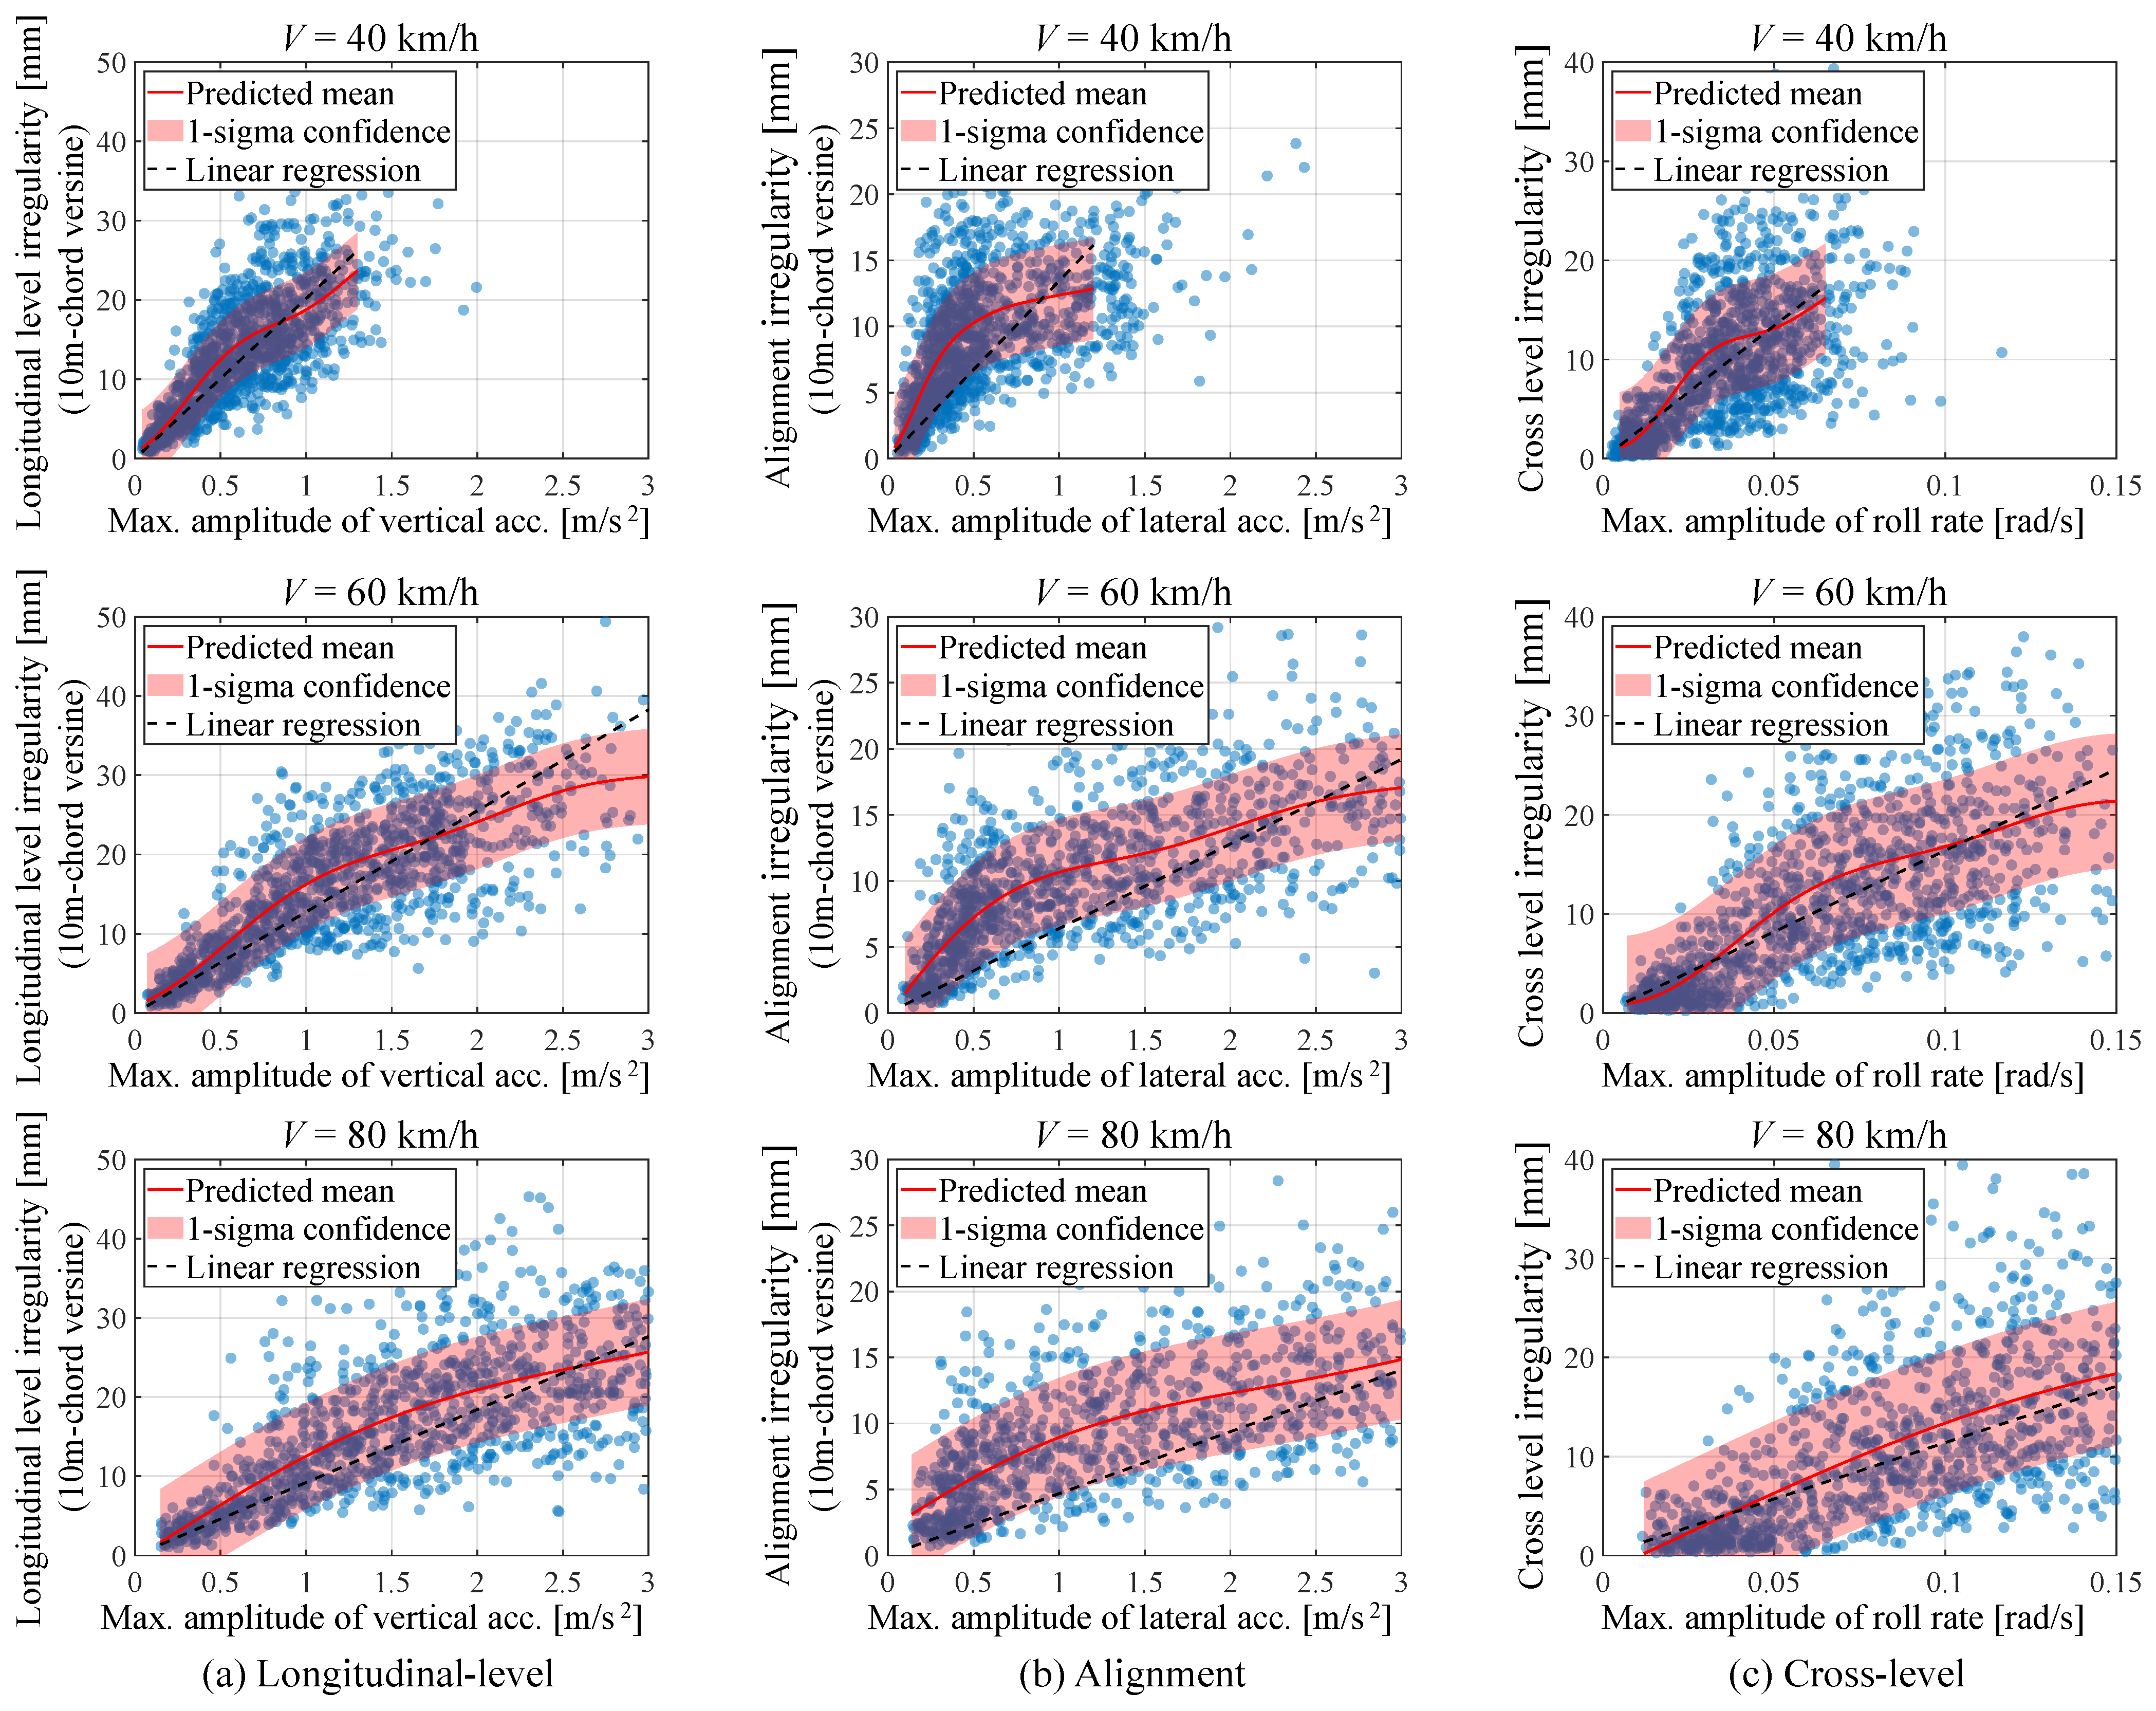
Figure 14 shows the GPR results for the vertical acceleration and longitudinal-level irregularity, lateral acceleration and alignment irregularity, and roll rate and cross-level irregularity. The results of the linear regression without an intercept are also shown for comparison.
Figure 14 shows that the characteristics are different between regions with a small acceleration and roll rate (good track condition) and those with a large acceleration and roll rate (poor track condition). The variance in the data for the longitudinal-level, alignment, and cross-level irregularities is large for the poor track condition. Nonlinearity appears in the GPR regression curve in these regions, and the difference from the regression line suggests that GPR is a more effective regression method.
To adapt to the actual line, it is necessary to make estimates using the measurement data. Therefore, it is necessary to generate a new data set by adding the measurement data to the data set generated by the simulation and then make the estimates.

5. Application to Track-Condition Monitoring in a Regional Railway

5.1. Track Irregularity Estimation Procedure and Results

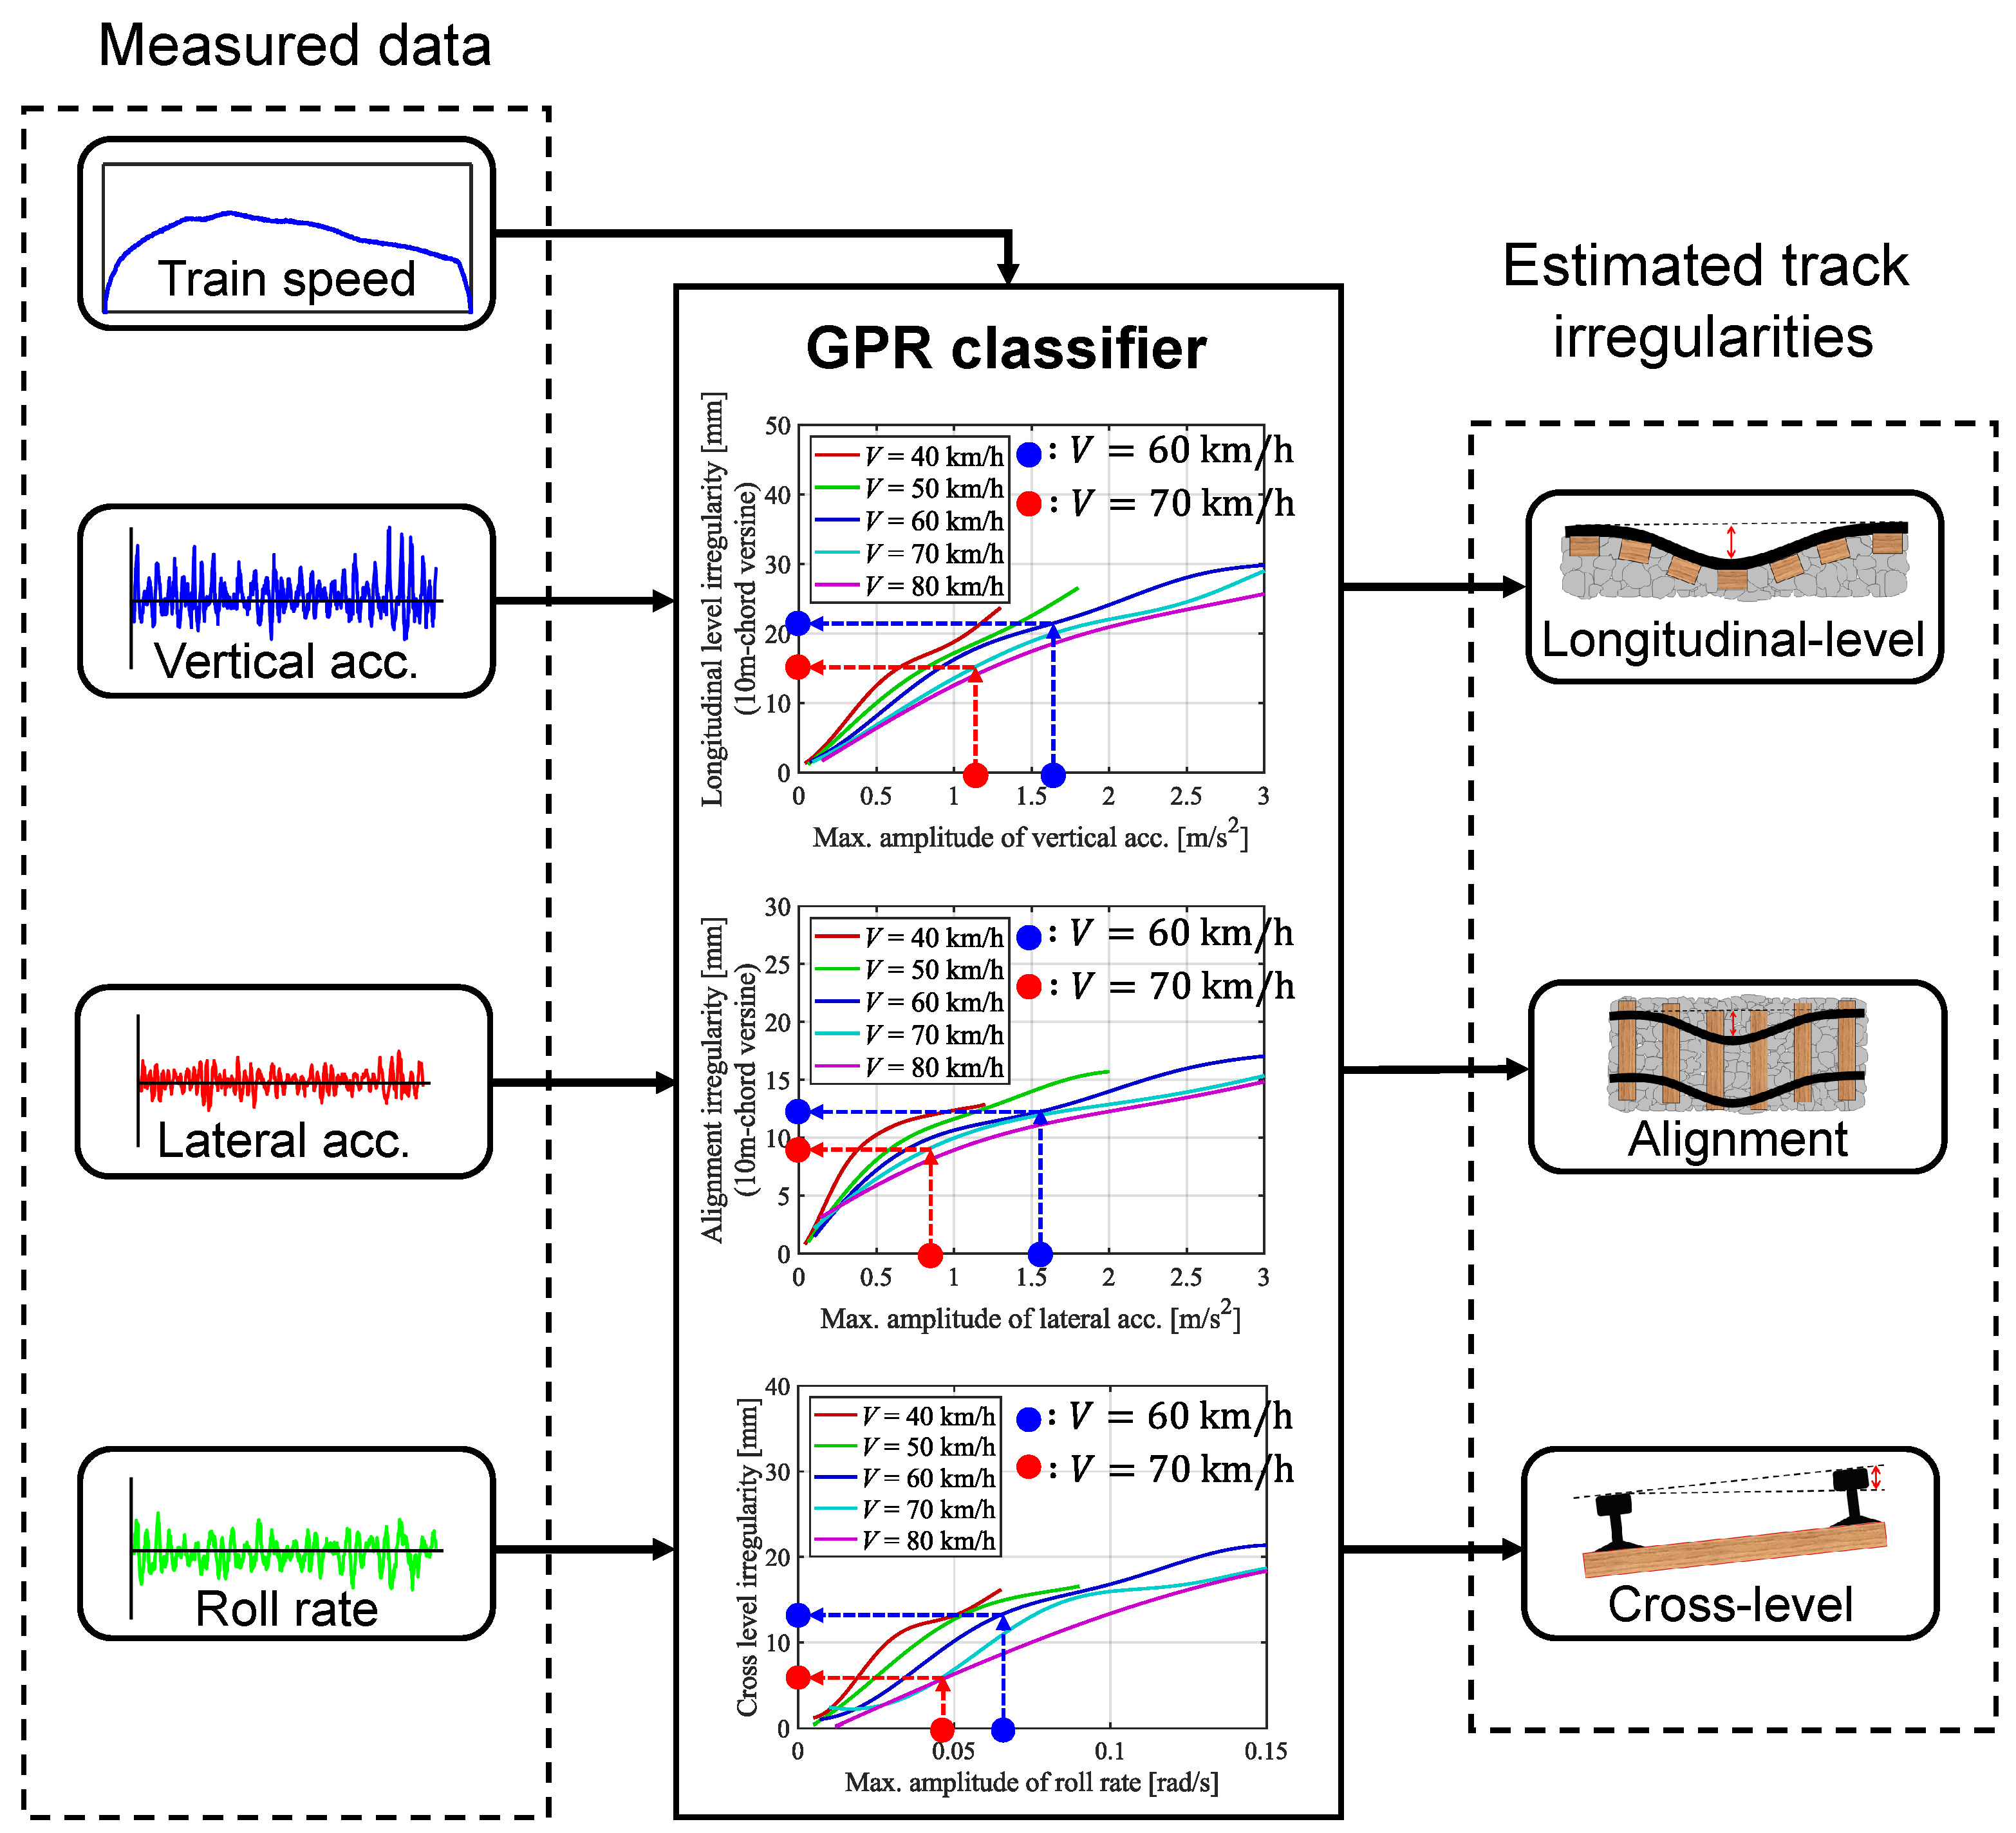
Figure 15 shows the method for estimating track irregularities using GPR. First, the correlation between the car body vibration and track irregularities corresponding to the travelling speed is calculated in advance using GPR. Next, the maximum amplitude values of the vertical acceleration, lateral acceleration, and roll rate measured by the track-condition monitoring system for each 10 m long section and the average travelling speed are calculated and used as inputs to the estimator. The estimator outputs longitudinal-level, alignment, and cross-level irregularities corresponding to the travelling speed along with a 1 σ confidence region.
Figure 16 indicates that most of the longitudinal-level, alignment, and cross-level irregularities estimated using the proposed method are within the 1 σ confidence region, confirming the effectiveness of the proposed method. However, in some sections, the errors between the estimated results and measured data are large. This may be owing to factors other than the track irregularities.
For example, if a joint depression in the track causes impulsive vibrations in the vertical direction, the effect of the joint depression will be superimposed on the car body’s vertical acceleration, and the estimation error of the longitudinal irregularity at that point will be large.
Comparing the estimation results from GPR with those from linear regression, no significant differences are observed for longitudinal-level irregularity and cross-level irregularity. On the other hand, large differences can be observed in alignment irregularities. This can be understood from the fact that there are large differences between linear regression and GPR for alignment irregularities. GPR also has the advantage that, unlike linear regression, it can present confidence regions at the same time.
In Figure 16, there are points where the estimated and measured values differ significantly, but such points may be affected by factors other than track irregularities. Therefore, it is considered that further useful information for maintenance could be obtained by investigating the sites at such locations.

5.2. Estimation of Changes in Track Irregularities

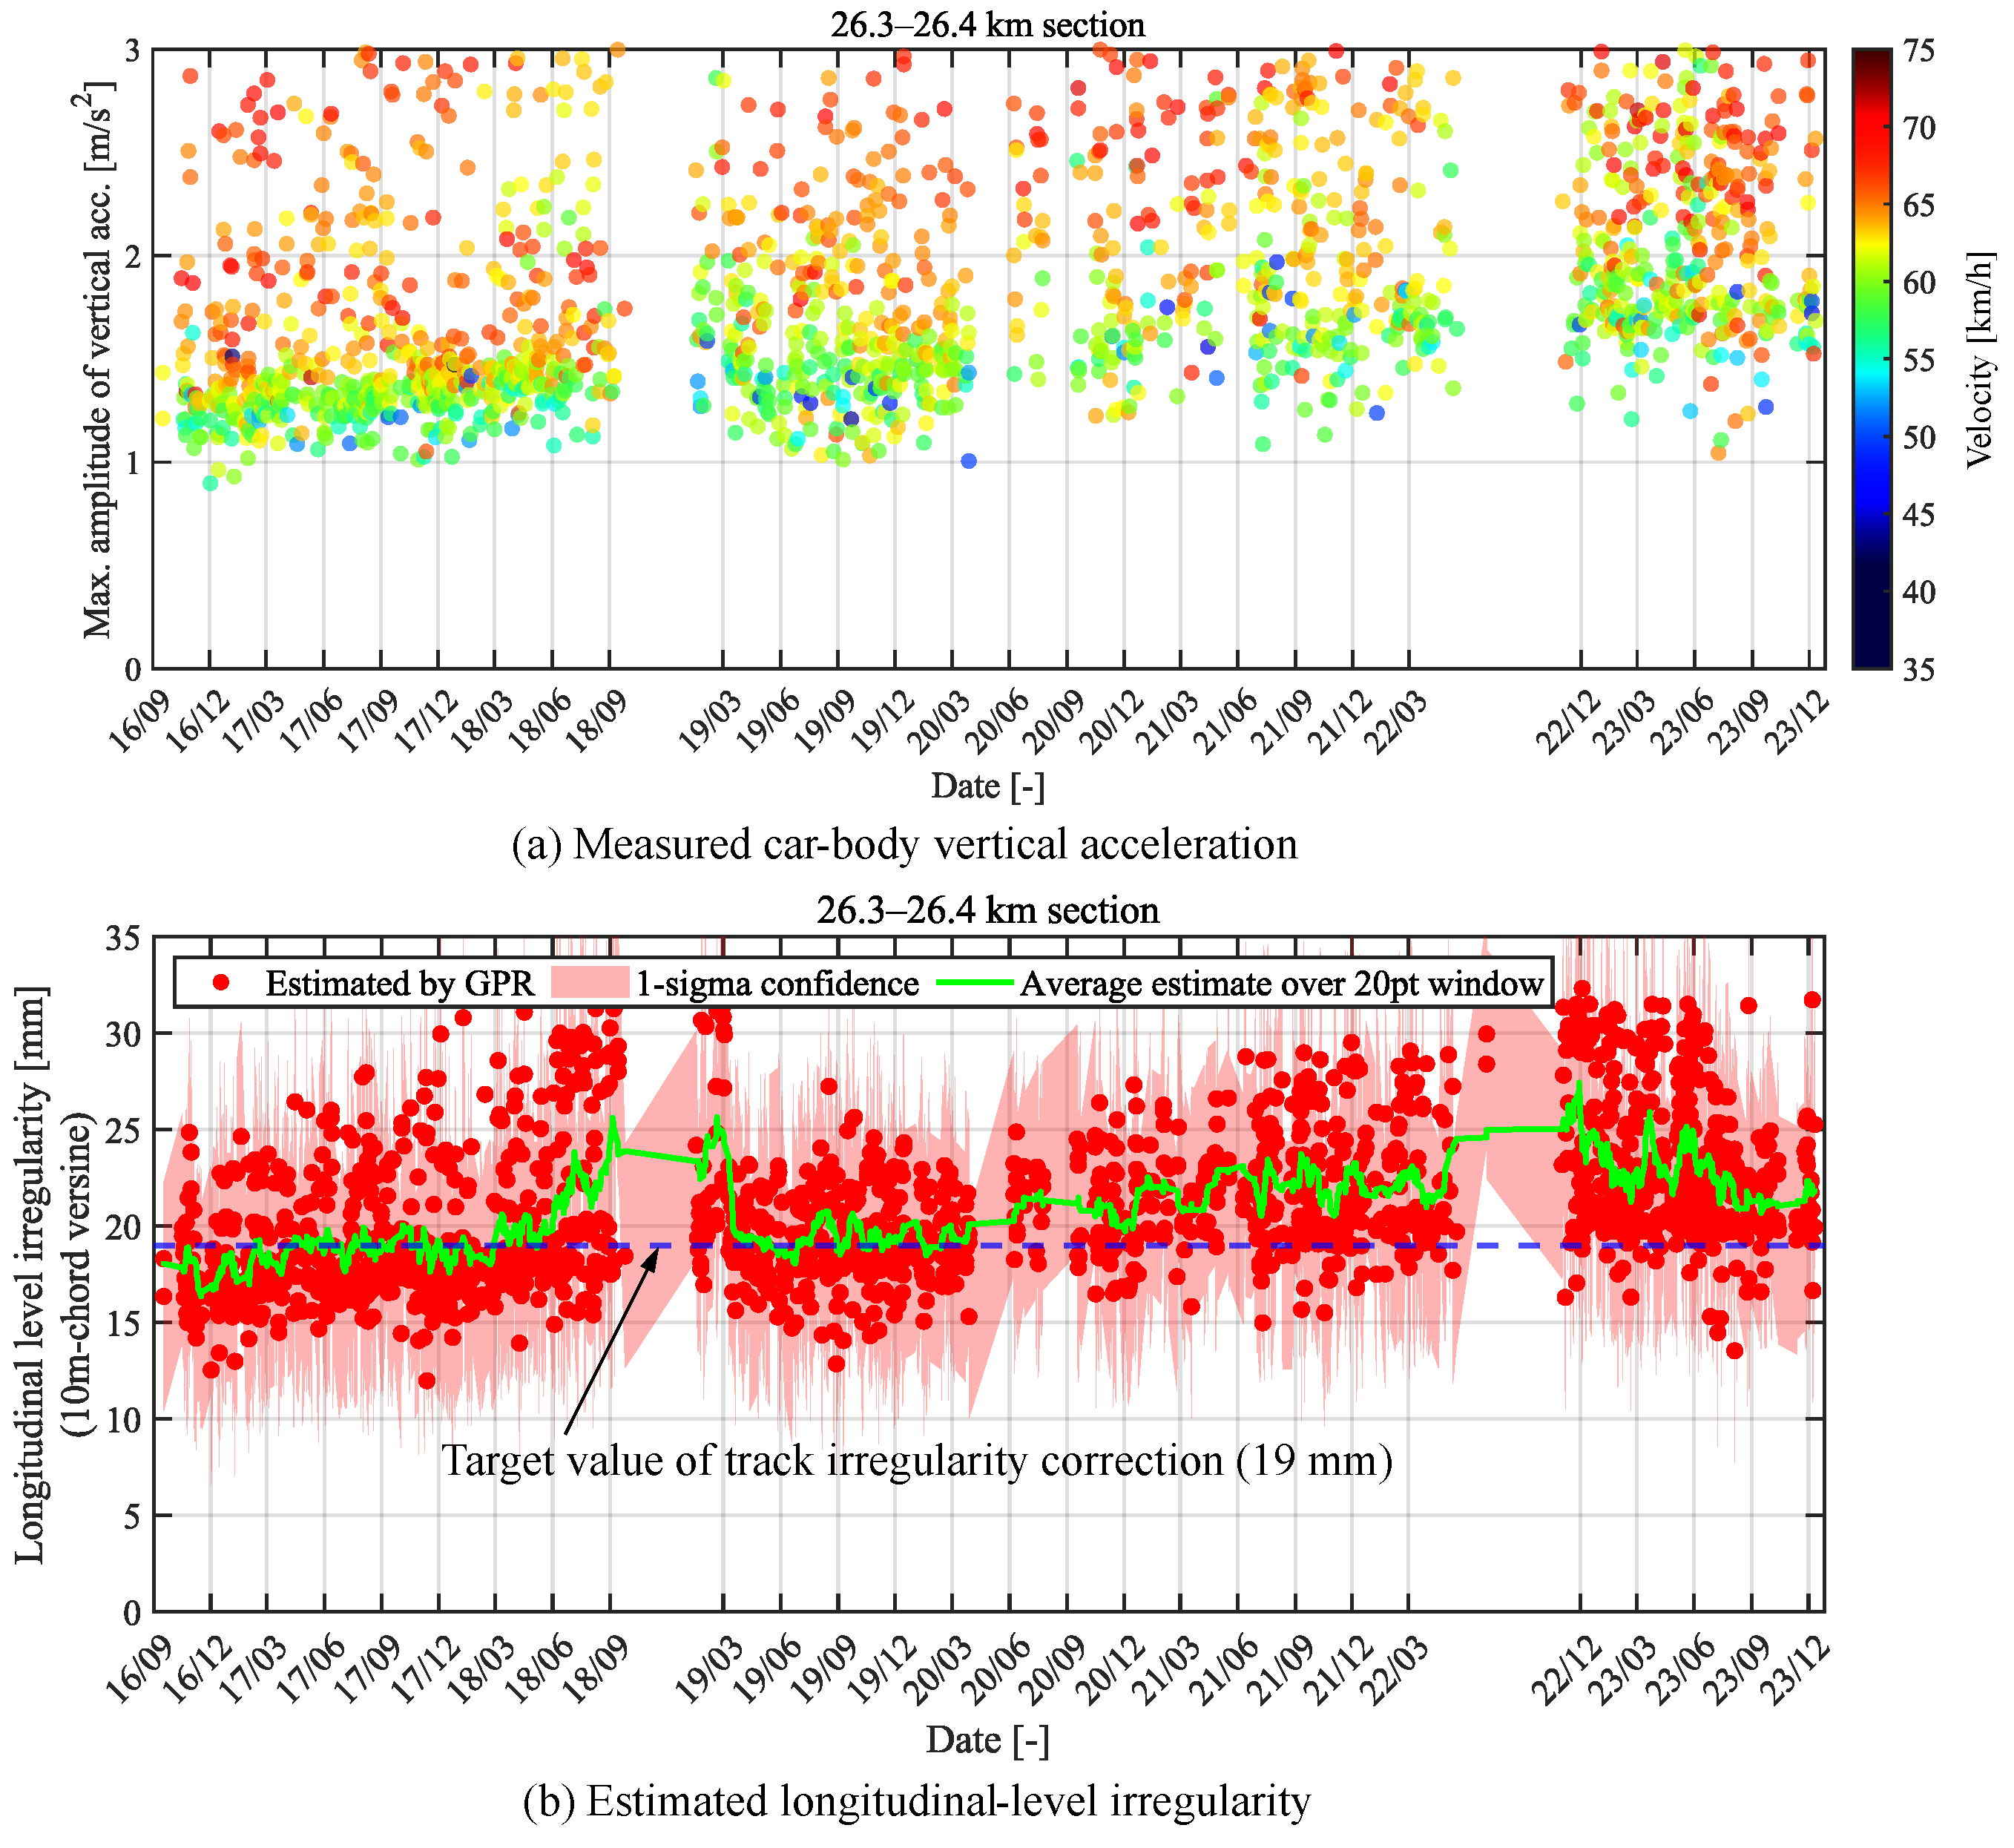
In this section, track irregularities are estimated from long-term car body vibration data measured by the track condition monitoring system, and track deterioration trends are analysed. The data were measured over a period of approximately seven years, from September 2016 to December 2023. Because of a measurement system failure, measurement data from September 2016 to early December 2016 are missing. Car body vibration is more sensitive in the high speed range and less sensitive in the low speed range. It is therefore not suitable to use data at low speeds. Here, a regression analysis was carried out excluding data at travelling speeds below 35 km/h, where the number of data is small.
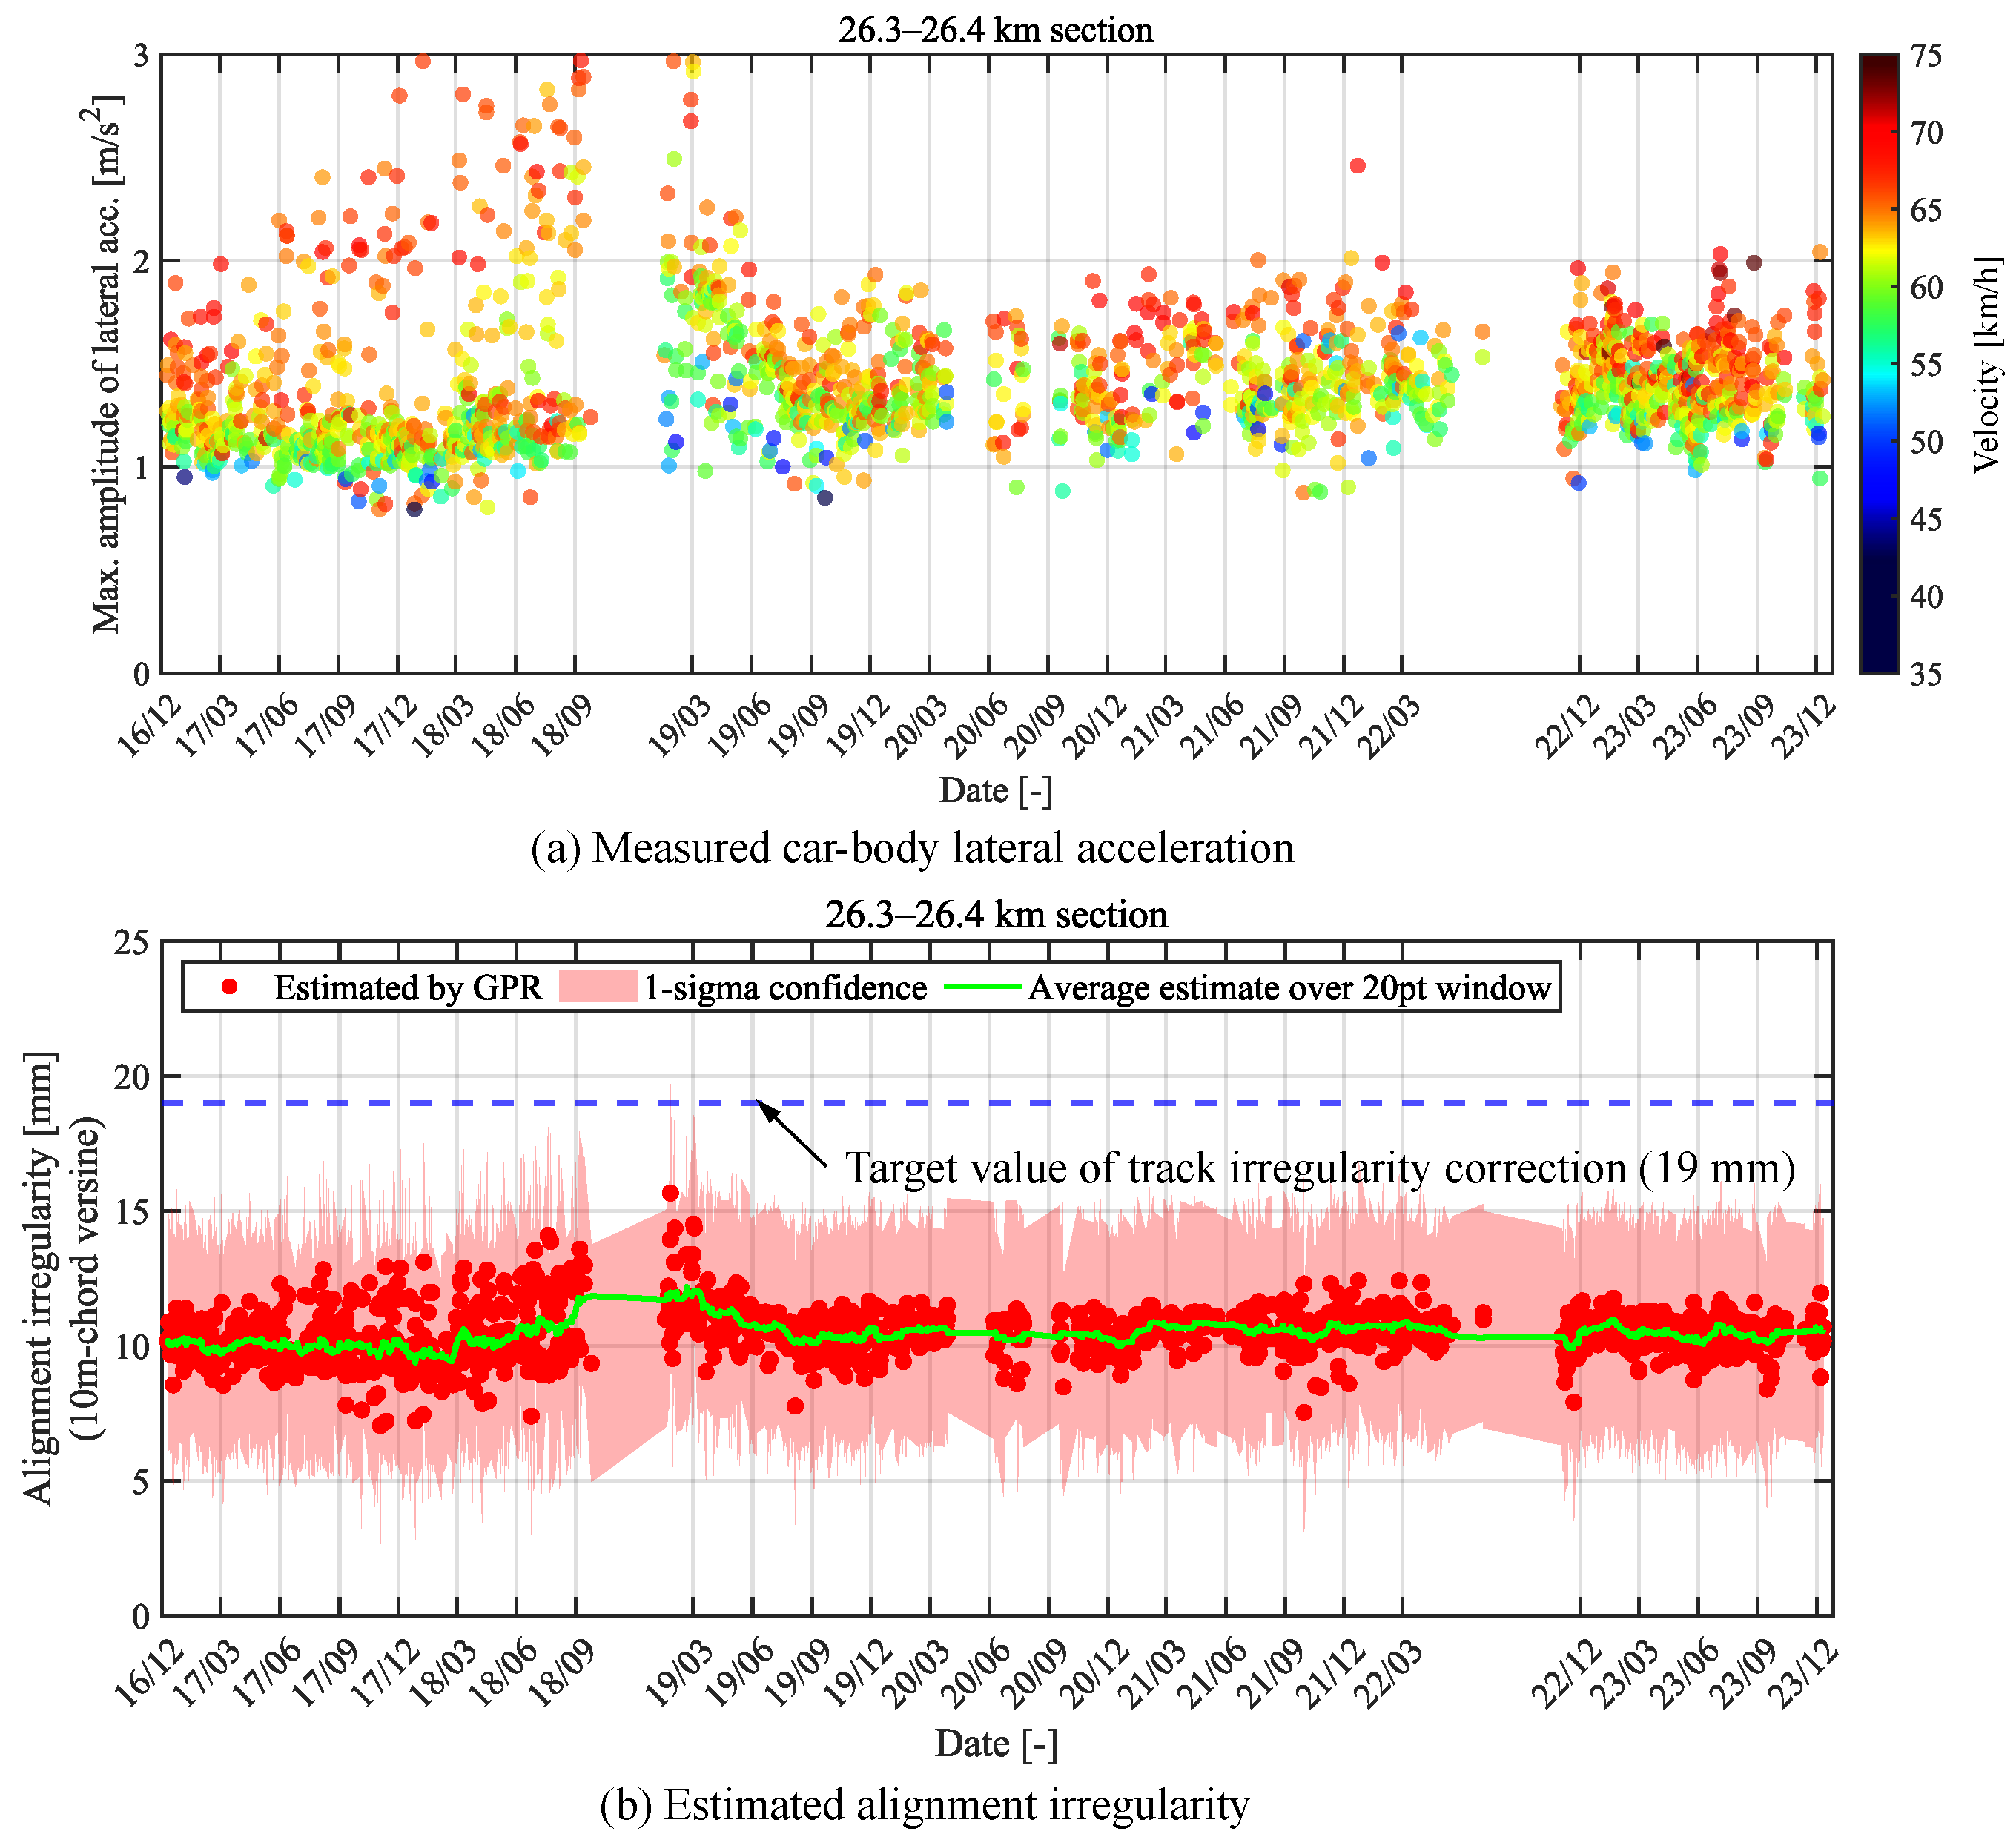
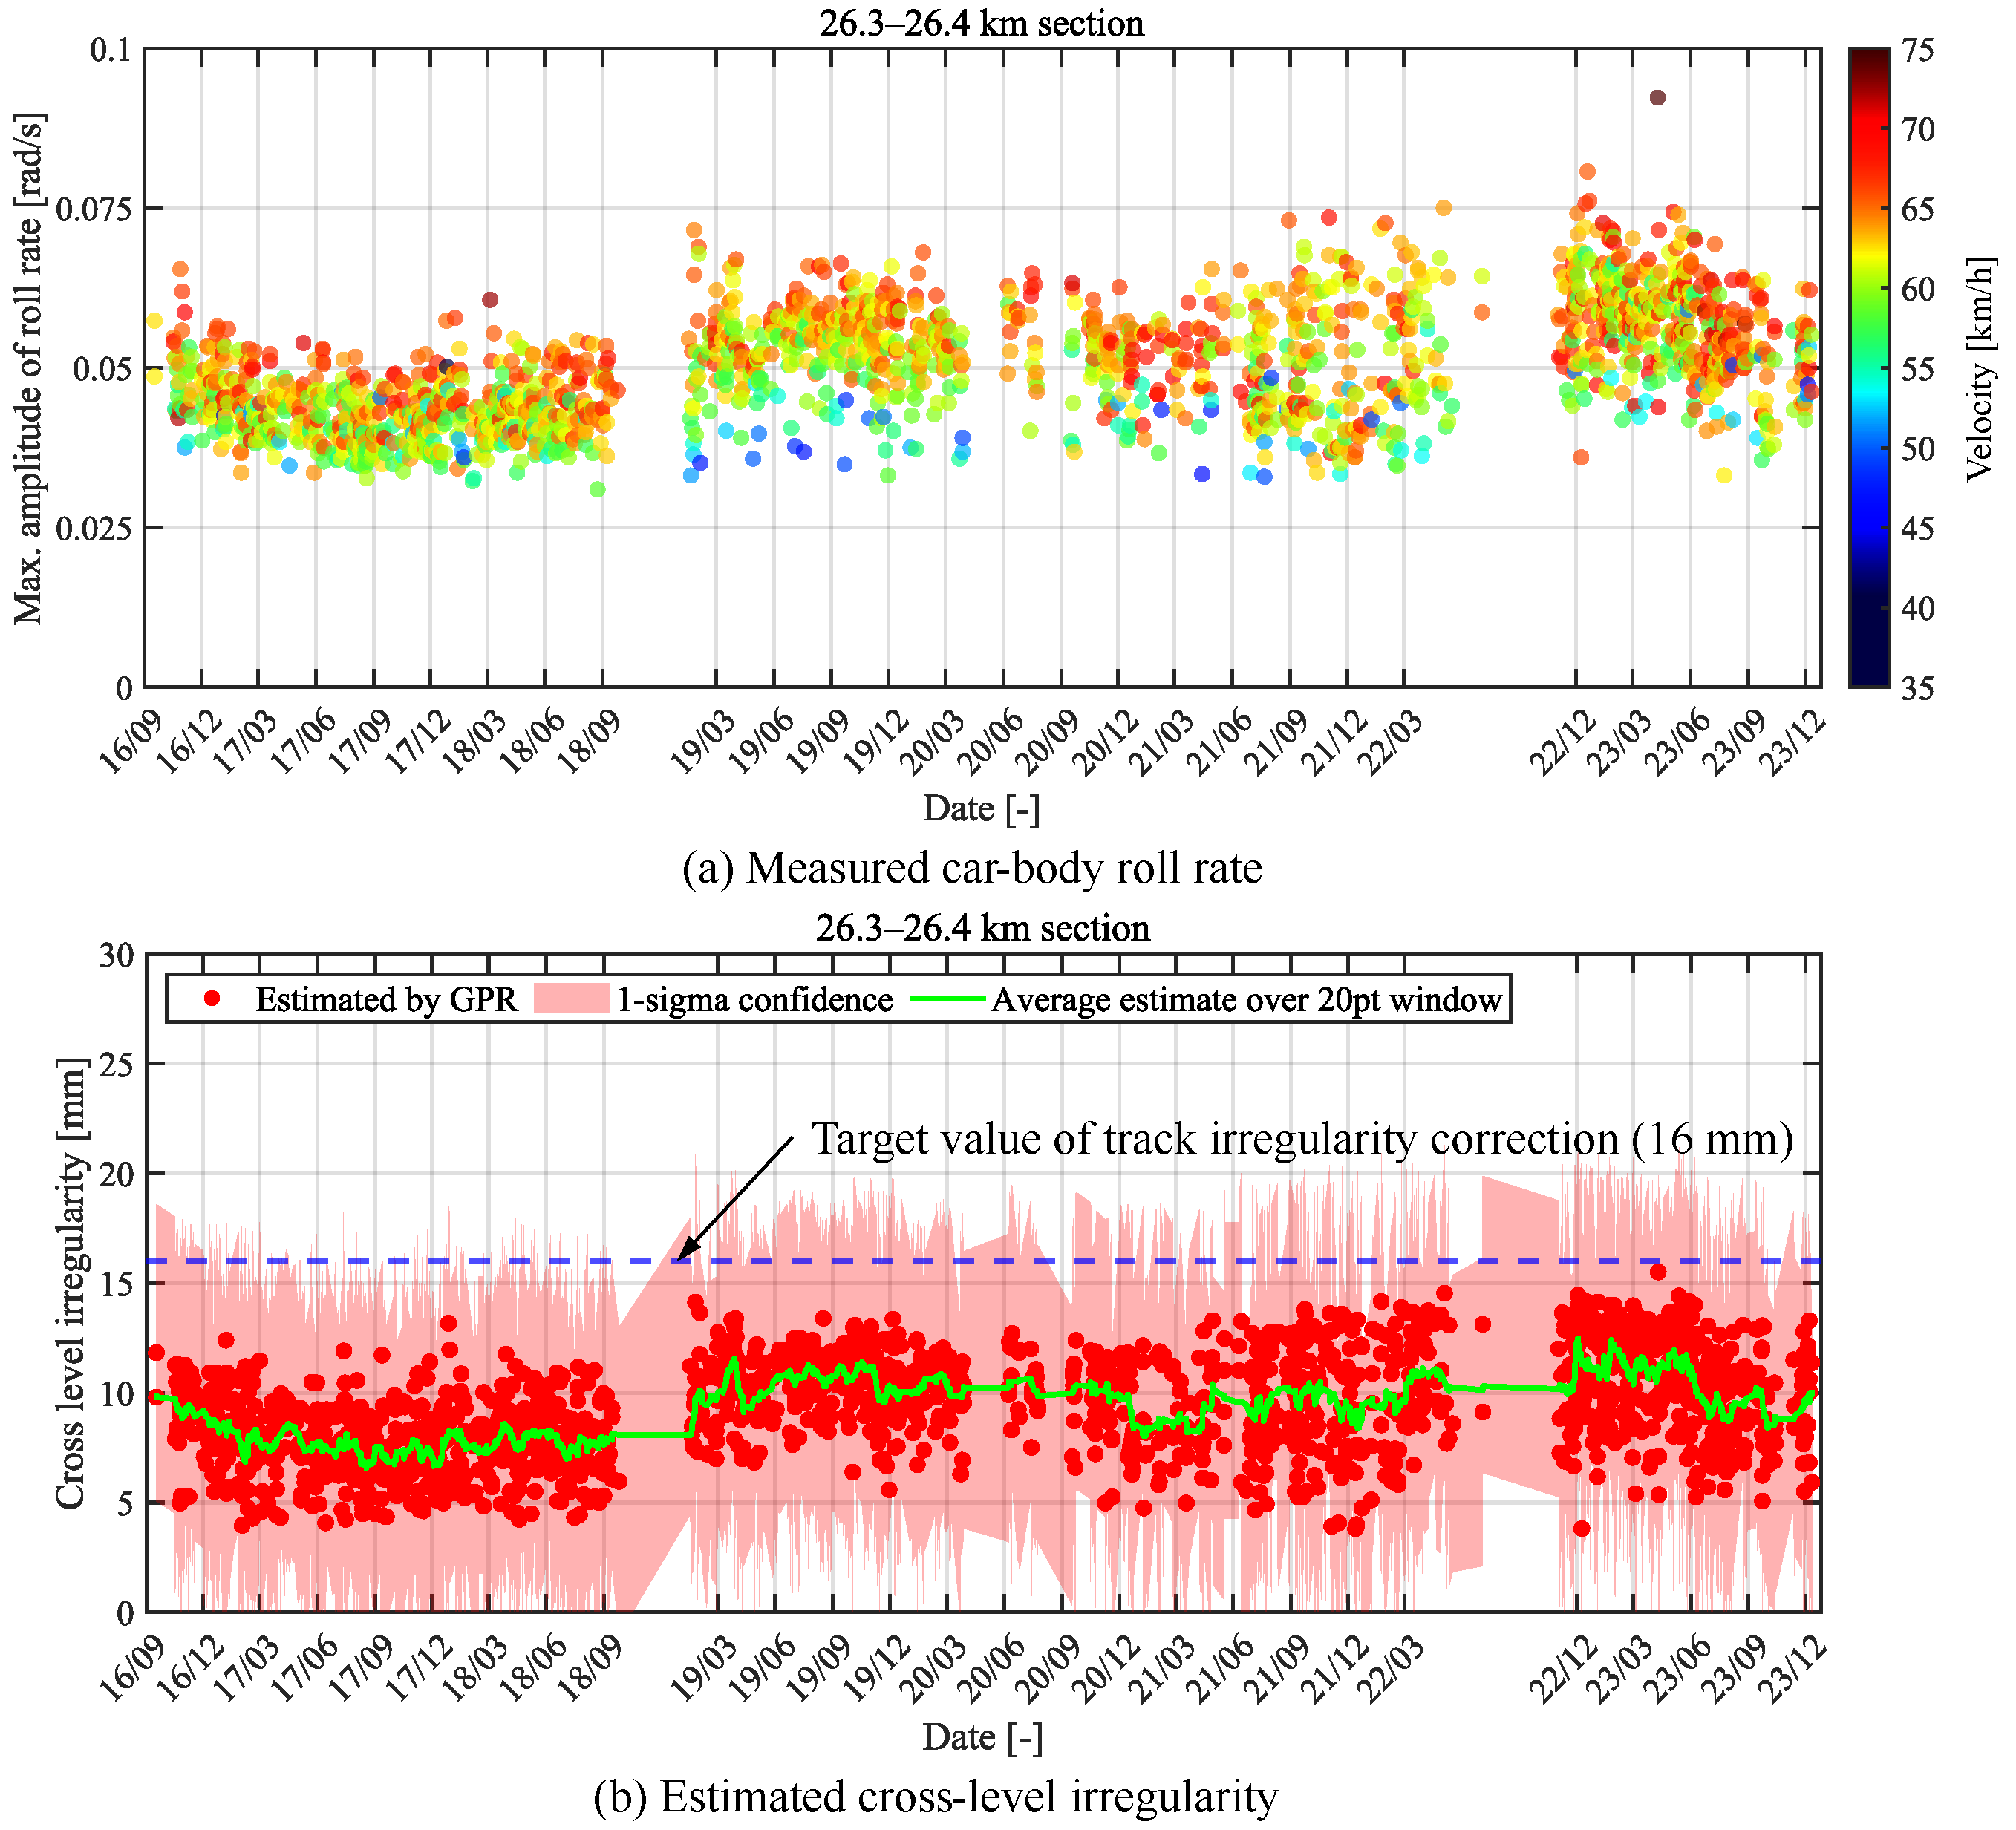
The measured vertical acceleration and estimated longitudinal -level irregularity are shown in Figure 17, the measured lateral acceleration and estimated alignment irregularity are shown in Figure 18, and the measured roll rate and estimated cross-level irregularity are shown in Figure 19. The vehicle travelling speed is displayed in colour for each of the vehicle vibration data. To enable an easier understanding of the long-term trend, a moving average of the estimated values with a window size of 20 points is also displayed. In addition, the blue dotted lines indicate the track maintenance targets for conventional railways (Figure 2).
Figure 17a, Figure 18a, and Figure 19a, respectively, show that the car body vibration increases with time, indicating that the track condition deteriorated. However, the travelling speed shows that, in general, the running speed tends to be high for large vibrations and low for small vibrations. Therefore, the effect of speed must be considered in the evaluation.
Figure 17b, Figure 18b, and Figure 19b, respectively, depict the results of the estimation using a GPR model that considers the effect of the travelling speed. Figure 17b and Figure 18b, respectively, show that the track longitudinal-level and alignment irregularities decreased between March 2019 and June 2019, suggesting that track maintenance was performed within this period. However, the longitudinal-level irregularities still exceeded the target value for track maintenance; thus, the track maintenance was likely insufficient. Thereafter, the longitudinal-level irregularity indicates that the track condition deteriorated again over time, whereas the alignment irregularity does not exhibit much variation.
Figure 19b shows that the cross-level irregularities increased more rapidly after March 2019 than before September 2018. This is not because of ageing but rather the effects of track maintenance during the period estimated above, as the subsequent changes in cross-level irregularity are not considerably large.
Analysis of long-term data confirms that car body vibration returns to normal levels with track maintenance. It is therefore considered that the main cause of the increase in car body vibration is the deterioration of track conditions. On the other hand, the effect of changes in vehicle parameters on the estimation performance is a study theme for future work. The measured accelerations also include factors other than track irregularities, such as joint depression. Time-frequency analysis of the measured acceleration is useful in identifying these factors [5].

6. Conclusions

In this study, the correlation between track irregularity and car body vibration was analysed using a multibody dynamics simulation of travelling rail vehicles. GPR was applied to the track irregularity and car body vibration data obtained from the simulation, and a method was proposed to estimate the track irregularities from the constructed regression model. Using the obtained regression model, the longitudinal-level, alignment, and cross-level irregularities were estimated from the measured car body vibrations and travelling speeds on a regional railway. The results were compared with the actual track irregularity data. The estimation results were generally within the 1 σ confidence region, indicating the usefulness of this method. However, some locations exhibited a large estimation error, which is a subject for future research.
Next, changes in the longitudinal-level, alignment, and cross-level irregularities were estimated from long-term car body vibration data. The analysis was performed using the proposed method, considering the effect of vehicle speed. The analysis results showed that this track irregularity estimation method could clarify track degradation trends and evaluate the effectiveness of track maintenance. The car body vibration may be affected by deteriorating wheel condition. Future studies are needed to determine the influence of the contact condition between wheel and rail on the accuracy of the estimation.
Only simulation data were used for the regression analysis described in this paper. This is due to the very small amount of datasets measured on track inspection vehicles and in-service vehicles. Therefore, once real data has been accumulated, this can be added to the training dataset to enable more accurate regression analysis. The proposed estimation method is not proposed as an alternative to track inspection techniques based on track inspection vehicles, for which the technology is well established. There are requests to convert car body vibration into track irregularities, even if the accuracy is inferior to that of track inspection vehicles.
The data-driven approach proposed in this study is a simpler estimation method than analytical or numerical models, and so it has the potential to be applied to many regional railways. On the other hand, the estimation accuracy depends on the amount of data collected and the regression method used, so further investigation of the estimation accuracy is needed. This study is a basic investigation of the applicability of the data-driven approach, and in the future, it will be necessary to investigate the amount of data collected and the regression method used from the perspective of estimation accuracy.

Author Contributions

Conceptualization, H.T.; methodology, H.T.; software, N.Y.; analysis, H.T., and N.Y.; data curation, H.T. and N.Y.; writing—original draft preparation, H.T.; writing—review and editing, H.T. and N.Y.; visualization, H.T. and N.Y.; supervision, H.T.; project administration, H.T.; funding acquisition, H.T. All authors have read and agreed to the published version of the manuscript.

Funding

Part of this research was funded by the Nihon University Research Grant for Social Implementation (19-006) (2019).

Data Availability Statement

Data are contained within the article.

Acknowledgments

This paper is based on collaborative research “Development of track monitoring system for regional railways” between Nihon University, Kyosan Electric Co. Ltd., and the National Traffic Safety and Environmental Laboratory (NTSEL). We express our sincere gratitude to A. Matsumoto (Nihon University), H. Takata (Kyosan), and H. Ono (NTSEL) for their fruitful discussions. We wish to thank N. Shinoda (NTSEL) for providing the measurement data from the regional railway.

Conflicts of Interest

The authors declare no conflicts of interest.

Abbreviations

GNSSglobal navigation satellite system
PSDpower spectral density
GPRGaussian process regression

References

  1. Naseri, R.; Mohammadzadeh, S.; Rizos, D.C. Rail surface spot irregularity effects in vehicle-track interaction simulations of train-track-bridge interaction. J. Vib. Control. 2024. [Google Scholar] [CrossRef]
  2. Song, Y.; Liu, Z.; Gao, S. Current Collection Quality of High-speed Rail Pantograph-catenary Considering Geometry Deviation at 400 km/h and Above. IEEE Trans. Veh. Technol. 2024. [Google Scholar] [CrossRef]
  3. Tsunashima, H.; Mori, H.; Ogino, M.; Asano, A. Development of Track Condition Monitoring System Using Onboard Sensing Device. In Railway Research; Zboinski, K., Ed.; InTech: London, UK, 2015. [Google Scholar]
  4. Tsunashima, H. Condition Monitoring of Railway Tracks from Car-Body Vibration Using a Machine Learning Technique. Appl. Sci. 2019, 9, 2734. [Google Scholar] [CrossRef]
  5. Tsunashima, H.; Hirose, R. Condition monitoring of railway track from car-body vibration using time-frequency analysis. Veh. Syst. Dyn. 2020, 60, 1170–1187. [Google Scholar] [CrossRef]
  6. Weston, P.; Roberts, C.; Yeo, G.; Stewar, E. Perspectives on railway track geometry condition monitoring from in-service railway vehicles. Veh. Syst. Dyn. 2015, 53, 1063–1091. [Google Scholar] [CrossRef]
  7. Chen, X.; Chai, X.; Cao, X. The time-frequency analysis of the train axle box acceleration signals using empirical mode decomposition. Comput. Model New Technol. 2014, 18, 356–360. [Google Scholar]
  8. Karis, T.; Berg, M.; Stichel, S. Correlation of track irregularities and vehicle responses based on measured data. Veh. Syst. Dyn. 2018, 56, 967–981. [Google Scholar] [CrossRef]
  9. Tsai, H.C.; Wang, C.Y.; Huang, N.E. Railway track inspection based on the vibration response to a scheduled train and the Hilbert–Huang transform. Proc. Inst. Mech. Eng. F. J. Rail Rapid Transit. 2014, 229, 815–829. [Google Scholar] [CrossRef]
  10. Sun, X.; Fei, Y.; Shi, J.; Zaitian, K.; Yunlai, Z. On-Board Detection of Longitudinal Track Irregularity. IEEE Access 2021, 9, 14025–14037. [Google Scholar] [CrossRef]
  11. Chudzikiewicz, A.; Bogacz, R.; Kostrzewski, M.; Konowrocki, R. Condition monitoring of railway track systems by using acceleration signals on wheelset axle-boxes. Transport 2019, 33, 555–566. [Google Scholar] [CrossRef]
  12. Westeon, P.F.; Ling, C.S.; Roberts, C.; Goodman, C.J.; Li, P.; Goodall, R.M. Monitoring vertical track irregularity from in-service railway vehicles. Proc. Inst. Mech. Eng. F J. Rail Rapid Transit. 2007, 221, 75–88. [Google Scholar] [CrossRef]
  13. Weston, P.F.; Ling, C.S.; Goodman, C.J.; Roberts, C.; Li, P.; Goodall, R.M. Monitoring lateral track irregularity from in-service railway vehicles. Proc. Inst. Mech. Eng. F J. Rail Rapid Transit. 2007, 221, 89–100. [Google Scholar] [CrossRef]
  14. Malekjafarian, A.; Obrien, E.; Quirke, P.; Bowe, C. Railway Track Monitoring Using Train Measurements: An Experimental Case Study. Appl. Sci. 2019, 9, 4859. [Google Scholar] [CrossRef]
  15. Tsunashima, H.; Ono, H.; Takata, T.; Ogata, S. Development and Operation of Track Condition Monitoring System Using In-Service Train. Appl. Sci. 2023, 13, 3835. [Google Scholar] [CrossRef]
  16. Ono, H.; Tsunashima, H.; Takata, T.; Ogata, S. Development and operation of a system for diagnosing the condition of regional railways tracks. Mech. Eng. J. 2023, 10, 22-00239. [Google Scholar] [CrossRef]
  17. Bai, L.; Liu, R.; Li, Q. Data-driven bias correction and defect diagnosis model for in-service vehicle acceleration measurements. Sensors 2020, 20, 872. [Google Scholar] [CrossRef] [PubMed]
  18. Wei, X.; Liu, F.; Jia, L. Urban rail track condition monitoring based on in-service vehicle acceleration measurements. Measurement 2016, 80, 21–228. [Google Scholar] [CrossRef]
  19. Balouchi, F.; Bevan, A.; Formston, R. Development of railway track condition monitoring from multi-train in-service vehicles. Veh. Syst. Dyn. 2021, 59, 1397–1417. [Google Scholar] [CrossRef]
  20. Chellaswamy, C.; Geetha, T.S.; Vanathi, A.; Venkatachalam, K. An IoT based rail track condition monitoring and derailment prevention system. Int. J. Technol. 2020, 11, 81–107. [Google Scholar] [CrossRef]
  21. Rodríguez, A.; Sanudo, S.; Miranda, M.; Gomez, A.; Benavente, J. Smartphones and tablets applications in railways, ride comfort and track quality. Transition zones analysis. Measurement 2021, 182, 109644. [Google Scholar] [CrossRef]
  22. Cong, J.; Gao, M.; Miranda, M.; Wang, Y.; Chen, R.; Wang, P. Subway rail transit monitoring by built-in sensor platform of smartphone. Front. Inf. Technol. Electron. Eng. 2020, 21, 1226–1238. [Google Scholar] [CrossRef]
  23. Paixão, A.; Fortunato, E.; Calçada, R. Smartphone’s Sensing Capabilities for On-Board Railway Track Monitoring: Structural Performance and Geometrical Degradation Assessment. Adv. Civ. Eng. 2019, 2019, 1729153. [Google Scholar] [CrossRef]
  24. Tsunashima, H.; Honda, R.; Matsumoto, A. Track Condition Monitoring Based on In-Service Train Vibration Data Using Smartphones. In Civil Engineering; Hessami, G., Muttram, R., Eds.; InTech: London, UK, 2024. [Google Scholar]
  25. Odashima, M.; Azami, S.; Naganuma, Y.; Mori, H.; Tsunahsima, H. Track geometry estimation of a conventional railway from car-body acceleration measurement. Mech. Eng. J. 2017, 4, 16-00498. [Google Scholar] [CrossRef]
  26. Xiao, X.; Zhe Sun, Z.; Shen, W. A Kalman filter algorithm for identifying track irregularities of railway bridges using vehicle dynamic responses. Mech. Syst. Signal Process. 2020, 138, 106582. [Google Scholar] [CrossRef]
  27. Paglia, L.; Reyes, A.; Gialleonar, D.; Facchinetti, A.; Carnevale, M. A speed-dependent condition monitoring system for track geometry estimation using inertial measurements. In Proceedings of the 28th IAVSD International Symposium on Dynamics of Vehicles on Roads and Tracks, Ottawa, ON, Canada, 21–25 August 2023. [Google Scholar]
  28. Tsunashima, H. Data-driven track irregularity estimation technique using car-body vibration. In Proceedings of the 28th IAVSD International Symposium on Dynamics of Vehicles on Roads and Tracks, Ottawa, ON, Canada, 21–25 August 2023. [Google Scholar]
  29. Claus, H.; Schiehlen, W. Modeling and simulation of railway bogie structural vibrations. Veh. Syst. Dyn. 1998, 29 (Suppl. 1), 538–552. [Google Scholar] [CrossRef]
  30. Wang, D.H.; Liao, W.H. Semi-active suspension systems for railway vehicles using magnetorheological dampers. Part I: System integration and modelling. Veh. Syst. Dyn. 2009, 47, 1305–1325. [Google Scholar] [CrossRef]
  31. Berawi, A. Improving Railway Track Maintenance Using Power Spectral Density (PSD). Doctoral Dissertation, University of The University of Porto, Porto, Portugal, August 2013. Available online: https://api.semanticscholar.org/CorpusID:111822997 (accessed on 1 July 2024).
  32. Wang, J. An Intuitive Tutorial to Gaussian Processes Regression. arXiv 2009, arXiv:2009.10862. [Google Scholar]
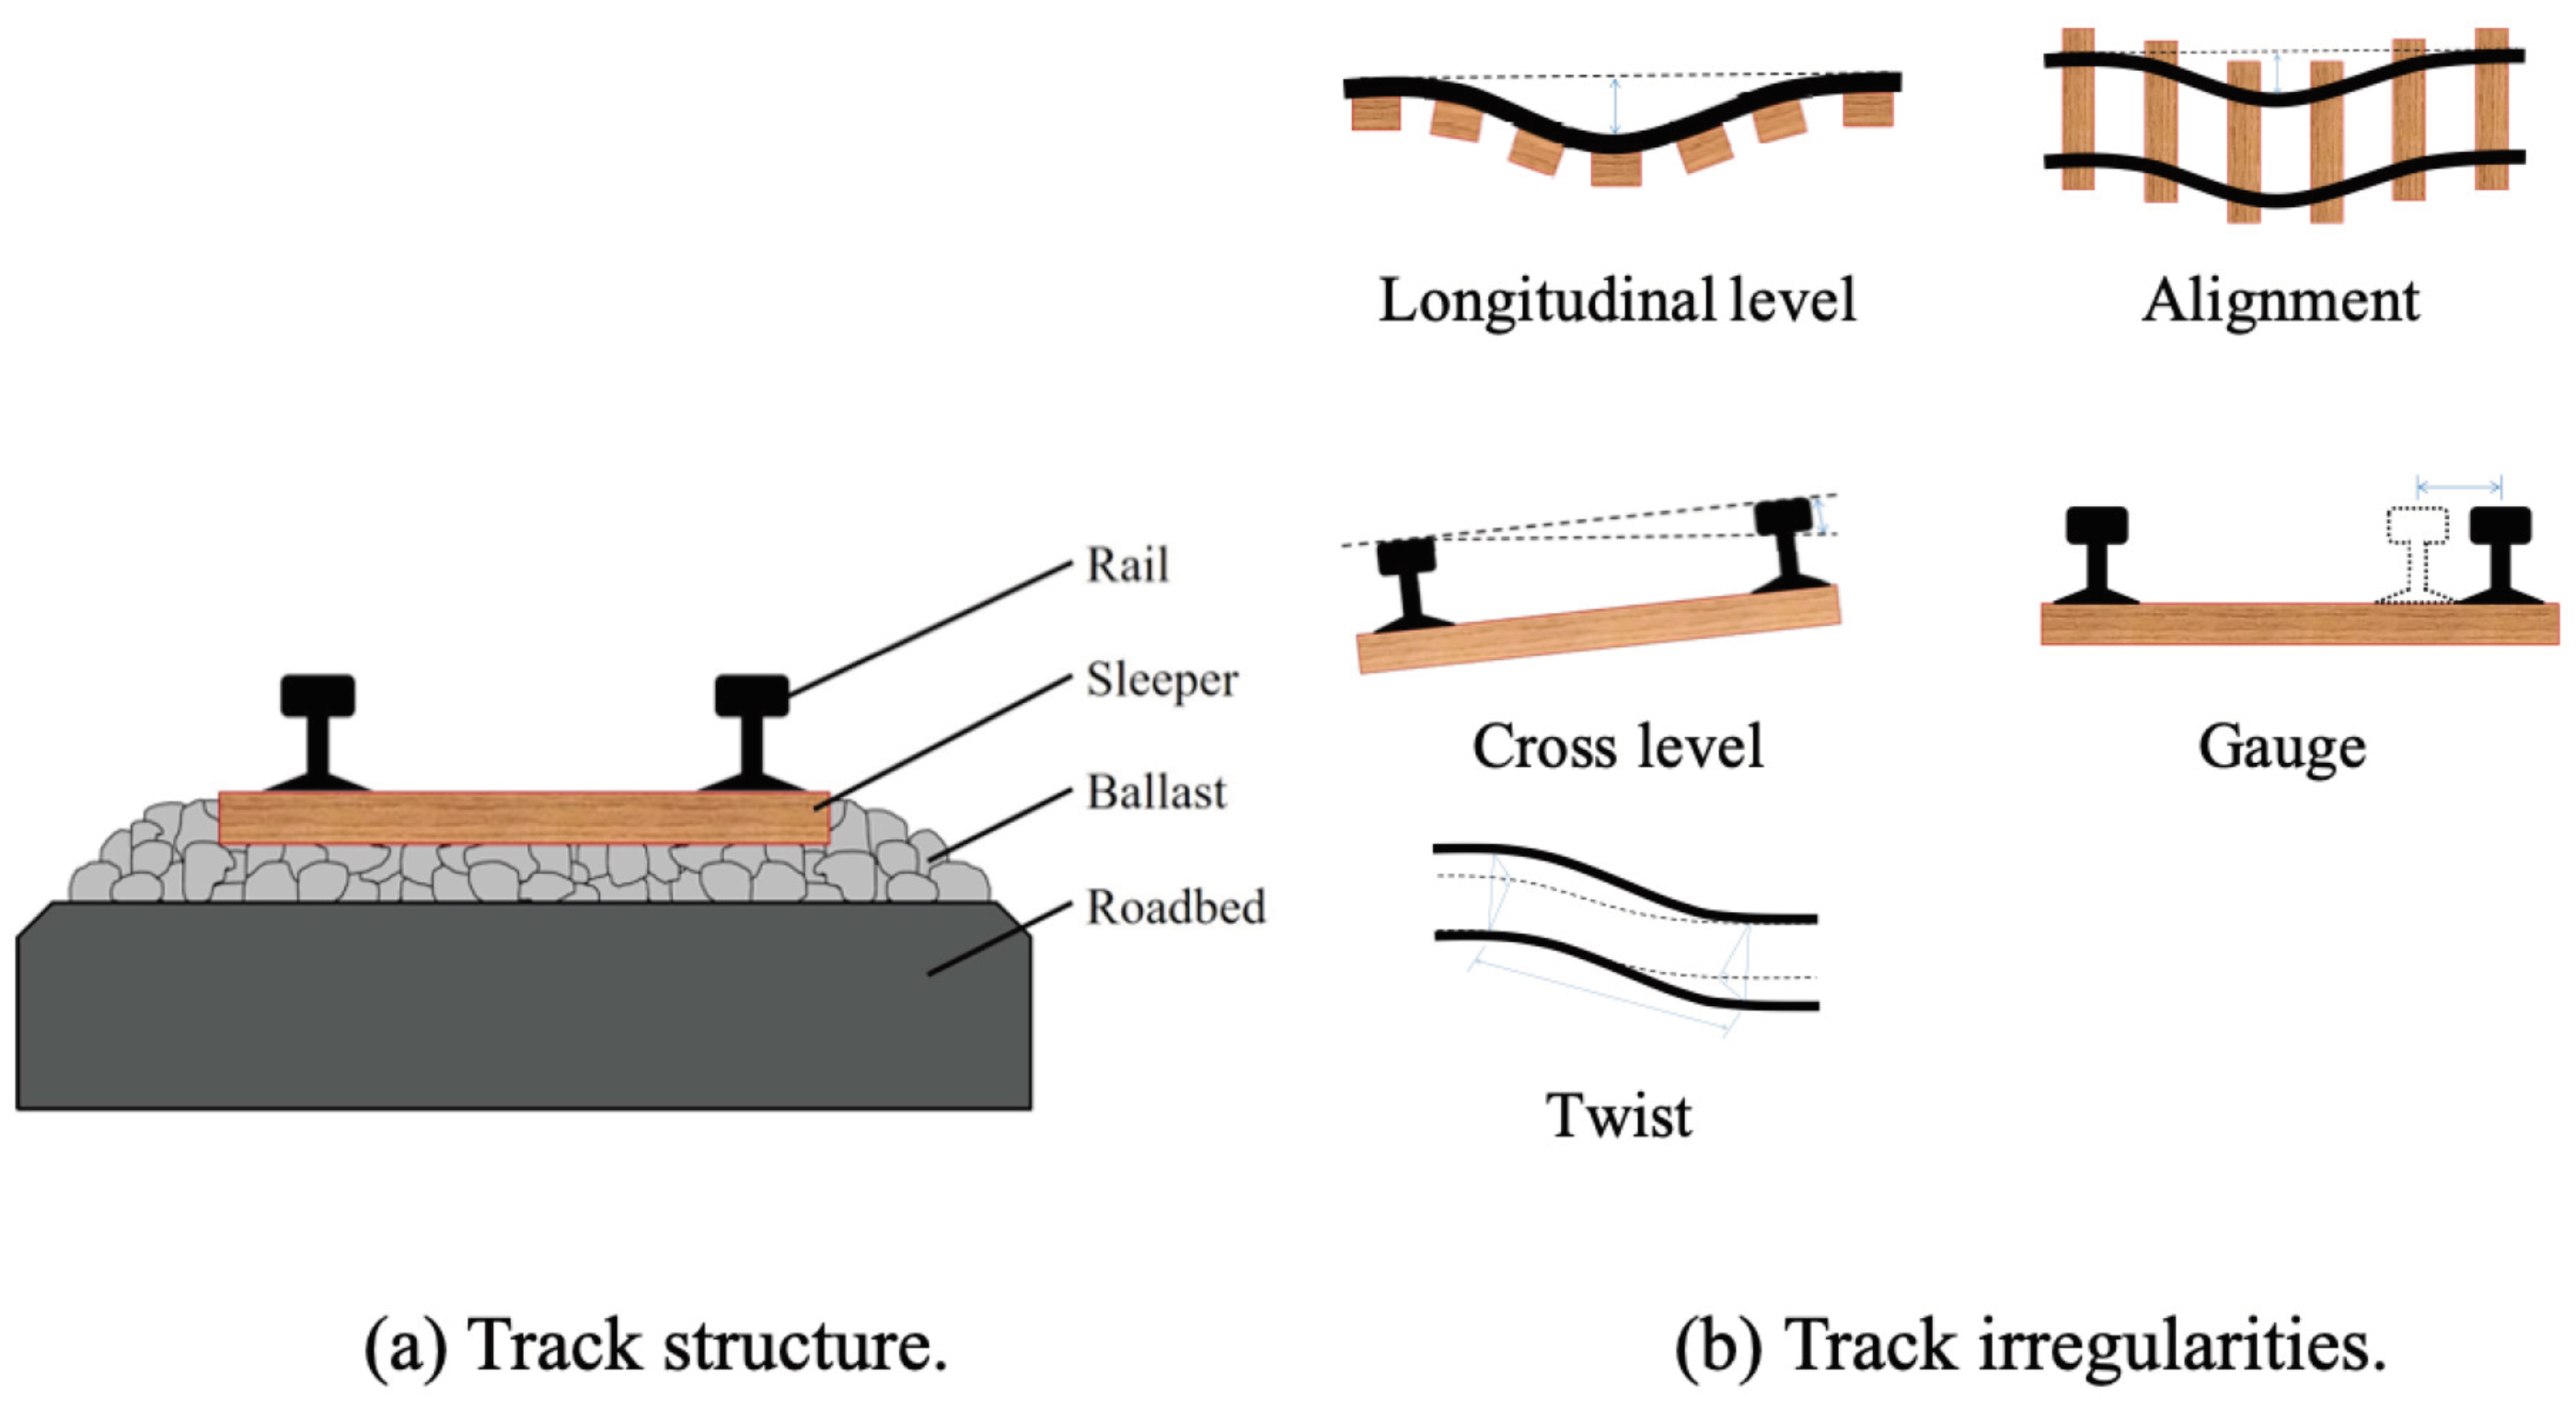
Figure 1. Track structure and irregularities.
Vibration 07 00049 g001
Figure 2. Target value of track irregularity correction for riding comfort and safety on conventional lines. Dynamic value measured by track inspection vehicles in [mm]. Values in parentheses are static values obtained by manual inspection.
Vibration 07 00049 g002
Figure 3. Onboard sensing device.
Vibration 07 00049 g003
Figure 4. Track condition monitoring system.
Vibration 07 00049 g004
Figure 5. Track irregularity estimation procedure. Black line: very good track condition, Red line: very poor track condition, Blue line: baseline track condition.
Vibration 07 00049 g005
Figure 6. Dataset generation used for regression analysis.
Vibration 07 00049 g006
Figure 7. 42-DOF vehicle model.
Vibration 07 00049 g007
Figure 8. PSDs of the track geometry.
Vibration 07 00049 g008
Figure 9. Generated track geometry.
Vibration 07 00049 g009
Figure 10. Effect of measurement point on car body vibration. A is the measurement point of the onboard sensing device, and B is the measurement point of simulated data.
Vibration 07 00049 g010
Figure 11. PSDs of simulated and measured car body vibration ( V = 60 km/h).
Vibration 07 00049 g011
Figure 12. Feature space consisting of car body vibration ( V = 60 km/h).
Vibration 07 00049 g012
Figure 13. Relation between car body vertical acceleration and longitudinal-level track irregularity.
Vibration 07 00049 g013
Figure 14. Results of GPR.
Vibration 07 00049 g014
Figure 15. Track irregularity estimation procedure using GPR classifier.
Vibration 07 00049 g015
Figure 16. Estimated track irregularities in a section between 1.2 km and 2.2 km.
Vibration 07 00049 g016
Figure 17. Changes in measured vertical acceleration and estimated longitudinal-level irregularity in a section between 26.3 km and 26.4 km. Data obtained form September 2016 to December 2023 are shown.
Vibration 07 00049 g017
Figure 18. Changes in measured lateral acceleration and estimated alignment irregularity in a section between 26.3 km and 26.4 km. Data obtained form September 2016 to December 2023 are shown.
Vibration 07 00049 g018
Figure 19. Changes in measured roll rate and estimated cross-level irregularity in a section between 26.3 km and 26.4 km. Data obtained form September 2016 to December 2023 are shown.
Vibration 07 00049 g019
Table 1. Vehicle parameters.
DescriptionUnitValue
Car body masskg25,000
Bogie masskg3100
Wheelset masskg1500
Car body inertia about x axis kgm 2 49,000
Car body inertia about y axis kgm 2 900,000
Car body inertia about z axis kgm 2 841,000
Bogie inertia about x axis kgm 2 2511
Bogie inertia about y axis kgm 2 1743.75
Bogie inertia about z axis kgm 2 1743.75
Wheelset inertia about x axis kgm 2 735
Wheelset inertia about y axis kgm 2 93.75
Wheelset inertia about z axis kgm 2 735
Car body basem14
Wheel basem2.1
Gaugem1.067
Wheel radiusm0.43
Primary suspension vertical stiffnesskN/m12,000
Secondary suspension vertical stiffnesskN/m400
Primary suspension lateral stiffnesskN/m6000
Secondary suspension lateral stiffnesskN/m150
Primary suspension longitudinal stiffnesskN/m8000
Secondary suspension longitudinal stiffnesskN/m1000
Primary suspension vertical dampingkNs/m40
Secondary suspension vertical dampingkNs/m14
Primary suspension lateral dampingkNs/m40
Secondary suspension lateral dampingkNs/m180
Primary suspension longitudinal dampingkNs/m40
Secondary suspension longitudinal dampingkNs/m14
Table 2. Track PSD model parameters.
ParametersVery GoodBaselineVery Poor
A p 1 × 10 5 10 × 10 5 80 × 10 5
A a 0.5 × 10 5 5 × 10 5 40 × 10 5
A c 0.1 × 10 6 1 × 10 6 35 × 10 6
Ω c [rad/m]0.80.80.8
Ω r [rad/m]0.020.020.02
Ω s [rad/m]0.010.010.01
Disclaimer/Publisher’s Note: The statements, opinions and data contained in all publications are solely those of the individual author(s) and contributor(s) and not of MDPI and/or the editor(s). MDPI and/or the editor(s) disclaim responsibility for any injury to people or property resulting from any ideas, methods, instructions or products referred to in the content.