Article

Crack Location in Wind Turbine Blades Using Vibration Signal and Support Vector Machine

by
Perla Y. Sevilla-Camacho
1,2,*,
José B. Robles-Ocampo
1,3,*,
Juvenal Rodríguez-Resendíz
4,
Sergio De la Cruz-Arreola
1,
Marco A. Zuñiga-Reyes
3,5 and
Edwin N. Hernández-Estrada
1
1
Cuerpo Académico de Energía y Sustentabilidad, Universidad Politécnica de Chiapas, Carretera Tuxtla Gutiérrez—Portillo Zaragoza Km 21+500, Col. Las Brisas, Suchiapa C.P. 29150, Mexico
2
Programa Académico de Ingeniería Mecatrónica, Universidad Politécnica de Chiapas, Carretera Tuxtla Gutiérrez—Portillo Zaragoza Km 21+500, Col. Las Brisas, Suchiapa C.P. 29150, Mexico
3
Departamento de Metal Mecánica, Tecnológico Nacional de México/IT de Tuxtla Gutiérrez, Carretera Panamericana Km 1080, Tuxtla Gutiérrez C.P. 29050, Mexico
4
Facultad de Ingeniería, Universidad Autónoma de Querétaro, Cerro de las Campanas, Las Campanas, Querétaro C.P. 76010, Mexico
5
Cuerpo Académico de Investigación de San Fernando, Colegio de Estudios Científicos y Tecnológicos del Estado de Chiapas, Av. Soyaló, Col. Burócratas, Tuxtla Gutiérrez C.P. 29010, Mexico
*
Authors to whom correspondence should be addressed.
Vibration 2025, 8(2), 20; https://doi.org/10.3390/vibration8020020
Submission received: 4 March 2025 / Revised: 16 April 2025 / Accepted: 19 April 2025 / Published: 21 April 2025
(This article belongs to the Special Issue Machine Learning Applications to Vibration Problems)

Abstract

:
This study introduces a new method to locate cracks in wind turbine blades using the support vector machine algorithm and the tangential vibration signal measured at the root blade in static conditions. The method was implemented in hardware and experimentally validated on 200 W wind turbine blades. The blade conditions were healthy, and transverse cracked at the root, midsection, and tip. The experimental procedure is easy, and only one low-cost piezoelectric accelerometer is needed, which is affordable and straightforward to install. The machine learning technique used requires a small dataset and low computing power. The results show exceptional performance, achieving an accuracy of 99.37% and a precision of 98.77%. This approach enhances the reliability of wind turbine blade monitoring. It provides a robust early detection and maintenance solution, improving operational efficiency and safety in wind energy production. K-nearest neighbors and decision trees are also used for comparison purposes.

1. Introduction

Significant growth, technological advancements, and increasing integration into energy systems mark the status of wind turbine energy [1]. Wind turbine blades (WTBs) are essential components of renewable energy systems, as they convert wind energy into electricity [2]. While WTBs are designed to operate efficiently under various environmental conditions, several factors can affect their performance and longevity. Cracks can develop in the blades, posing serious risks to both performance and safety. Understanding the causes, consequences, and potential mitigation strategies is crucial for ensuring effective maintenance and operational efficiency [3]. The primary causes of WTB cracks include material fatigue, manufacturing defects, environmental factors, and impact damage [4].
The presence of cracks in WTBs leads to several issues, including reduced efficiency, safety hazards, increased maintenance costs, downtime, and revenue loss. Therefore, monitoring the blades is essential for maximizing efficiency and ensuring reliable performance, lifespan, energy production, and safety in wind energy systems [5,6].
Various strategies have been proposed to mitigate WTB cracks. One approach includes using advanced composite materials that have improved fatigue resistance and impact tolerance, which can significantly lower the risk of cracking. Additionally, protective coatings can help counteract the effects of UV exposure and environmental degradation, extending the blades’ lifespan and minimizing crack formation. Ongoing research focuses on developing new materials to enhance blade durability [7]. Other crack mitigation strategies involve regular inspections, predictive maintenance, and advanced detection systems [3,8]. Table 1 summarizes research related to these strategies.
Crack identification using the inverse problem approach and vibration signals is reported in [9,10]. Vibration-based methods are increasingly used for detecting and locating cracks in WTBs. Several key approaches are presented in Table 2.
Table 1. WTB crack mitigation strategies are based on regular inspection, predictive maintenance, and monitoring systems.
TechniqueDescriptionAdvantagesLimitations
Ultrasonic Testing [11].High-frequency sound waves are introduced into the material. Reflections from cracks provide information about their size and location.Highly sensitive to internal flaws.Requires skilled operators and can be time-consuming.
Thermographic Inspection [12,13].Infrared cameras detect temperature variations on the surface, indicating structural changes.Non-destructive and covers large areas quickly.Requires a heat source.
Acoustic Emission Testing [14,15].Detects sound waves emitted from materials under stress, identifying crack formation in real-time.Effective for continuous monitoring.Requires specialized equipment.
X-ray Computed Tomography [16,17].Provides 3D images of the internal structure, allowing detailed visualization of cracks.High-resolution imaging of internal flaws.Expensive and requires specialized facilities.
Fiber Bragg Grating Sensors [18]. Optical sensors embedded in the blade material monitor strain and detect cracks.Real-time monitoring and high sensitivity.Initial installation can be complex.
Robotic and Drone Inspection [19]. Drones equipped with cameras can perform visual inspections and advanced imaging techniques.Access to hard-to-reach areas.Do not detect all internal defects.
Image Processing [20].Involves the use of various techniques to analyze visual data captured from cameras or sensorsNon-destructive and high sensitivity.Environmental sensitivity, data overload, and complexity of implementation
Vibration Monitoring [21].Piezoelectric sensors can be embedded in or attached to turbine blades to continuously monitor vibration signals, providing real-time data for crack detection.Direct measurement of stress and strain can lead to early detection of cracks.Sensor placement and calibration can be challenging.
Table 2. Vibration-based methods for crack detection and location in WTB.
ApproachDescriptionAdvantagesLimitations
Experimental Modal Analysis [22,23].This technique involves measuring the natural frequencies and mode shapes of the WTBs. Changes in these parameters can indicate the presence of cracks or structural alterations.Sensitive to small changes in structural integrity; can be performed in situ.Requires baseline data for comparison and can be influenced by environmental factors
Vibration Signal Processing [24].Advanced signal processing techniques, such as fast Fourier transform (FFT) and wavelet transform, analyze the frequency content of vibration signals to detect anomalies indicative of cracks.Effective in identifying specific frequency changes associated with crack formation.Requires sophisticated data analysis tools and expertise.
Operational Modal Analysis [25,26].OMA is a method that captures the dynamic response of the structure during operation, allowing for the identification of changes in modal parameters due to crack initiation.Non-invasive and suitable for structures under operational conditions.Can be less accurate than laboratory-based modal analysis.
Machine Learning Approaches [27,28,29]. Machine learning algorithms can analyze vibration data to identify patterns and predict the presence of cracks based on historical data.Capable of processing large datasets and improving detection accuracy.Requires substantial training data and may face challenges with generalization.
Time-Frequency Analysis [30].This technique combines time and frequency domain analyses to capture transient events associated with crack propagation, providing more detailed information on crack dynamics.Effective in detecting non-stationary signals related to crack growth.Computationally intensive and complex to interpret.
Machine learning (ML) techniques have emerged as powerful tools for crack detection and monitoring in WTBs, leveraging data-driven approaches to enhance monitoring and maintenance strategies. ML algorithms can be used not only for fault detection but also to detect fluid dynamics problems that may cause blades or turbo machinery failures, as reported for radial compressors [31] and vehicle turbochargers [32].
Vibration data and ML are crucial in detecting wind turbine blade cracks. Cracks in the blades often lead to distinct changes in the vibration patterns due to altered mechanical properties like stiffness, damping, and natural frequencies. A machine learning model can be applied in the following ways: (1) Cracks often lead to local changes in the blade’s stiffness, which can shift the frequencies at which the blade vibrates. An ML model can be trained to identify these shifts. (2) Cracks can affect the blade’s damping characteristics, increasing or decreasing vibration amplitude. The model can distinguish between normal and abnormal amplitude patterns by learning from historical vibration data. (3) As cracks propagate, they may cause impulsive or transient vibrations distinct from the regular operational vibrations. These transient vibrations often indicate crack initiation or growth, and ML models can detect these through time-domain analysis and spectral analysis. (4) As cracks grow, they cause increasingly significant shifts in the vibration signature. This gradual change can be tracked over time, allowing the ML model to identify cracks at their initial stage and as they evolve. Time-series models can be particularly effective as they learn to predict and identify trends over time.
ML algorithms can leverage all of the changes in vibration to detect and locate cracks in the blades. Some essential methods for crack monitoring include supervised learning algorithms [33,34], unsupervised learning approaches [35], deep learning techniques [19,36,37], reinforcement learning [38], hybrid models [39], and feature engineering [40].
One study uses machine learning to analyze wind turbine blade vibrations under various crack severities and wind speeds. The method includes feature extraction, ANOVA for feature selection, and classification with K-nearest neighbors (KNN). A dataset of 1200 vibration signals is required for each case [27]. In [28], fifteen tree-based machine learning models are presented for detecting and identifying cracks in wind turbine blades using vibration data from piezoelectric accelerometers. Various feature extraction methods, including statistical, histogram, and ARMA, are compared to determine the most effective approach. The data acquisition system and software used were NI USB 4432 and NI-LabVIEW. Another study presents a machine learning approach to detect various faults in wind turbine blades, including cracks at different locations, using vibration signal analysis. Feature selection methods like ReliefF, chi-square, and information gain were applied, and classifiers such as KNN, the support vector machine (SVM), and random forests were evaluated. The best performance was achieved using ReliefF with KNN, reaching a classification accuracy of 97%. The NI USB 4431 DAQ card and LabVIEW software were utilized in the study [29]. Other researchers [33] proposed a novel diagnosis framework combining multiscale sparse filtering and multi-kernel SVM for identifying crack severity in turbine blades. It uses advanced signal processing (EEMD-WPEE) to extract fault-related features from 3D blade tip clearance signals.
Wang et al. present a data-driven framework using unmanned aerial vehicle (UAV) images and Haar-like features to detect surface cracks on wind turbine blades. An extended cascading classifier combining LogitBoost, decision tree (DT), and SVM models improves accuracy in locating and identifying cracks in real and synthetic images [34]. Another study develops a data-driven approach combining feature extraction and unsupervised anomaly detection to identify damage in wind turbine blades using 12 accelerometers. Methods like isolation forest and one-class SVM detect anomalies [35]. Zhu et al. present the multivariate information you only look once deep learning model for detecting surface cracks on wind turbine blades, especially those with light colors, using UAV images. The model improves detection accuracy with multivariate information fusion, a C3TR module, and data enhancement methods [36]. Another deep learning-based blade inspection method uses UAVs, with VGG-11 chosen as the best model for the image recognition of defects. The model is compressed using the alternating direction method of the multiplier algorithm [37]. Each one of these approaches has its limitations. For example, many of these techniques require substantial computational resources and large datasets. They can also be complex to implement, demanding expertise in signal processing, feature selection, and expensive sensors. Other methods require specialized data acquisition systems and signal processing software. Additionally, other methods require high computational resources due to the fusion of algorithms. Despite these challenges, the benefits of ML techniques outweigh those of conventional fault detection methods.
Most reported methods only detect the presence of cracks or assess their severity level. It is well known that cracks usually occur at the root of the WTB; however, cracks can also happen in other sections of the WTB, including the middle and tip. Therefore, the reported methods that locate cracks demand specialized sensors, high computing power for data processing, and implementation complexities. For example, the vibration modes were used for crack locations in a cantilever beam [41]. The procedure requires the vibration amplitude of two beam positions and a non-linear solving algorithm. The experimental validation requires the vibration amplitude measurement at several positions of the beam and an analysis carried out by an expert. In order to overcome the aforementioned challenges, this work proposed an initial approach for identifying the presence of a crack and locating it along the WTB. The technique is based on a support vector machine (SVM) model, utilizing the tangential vibration signals measured at the root of the WTB under static conditions.
The SVM algorithm detects and locates different transverse cracks using a small dataset and low computational resources. This algorithm is highly accurate in classification and can handle complex relationships in the dataset. The method is easy to implement and requires one acceleration sensor. In order to validate the proposed method, it was implemented experimentally in a real WTB in a healthy state and real WTBs with three crack locations: tip, midsection, and root. Therefore, the proposed work offers a solution for these different cases. Other ML algorithms, such as KNN and DT, were implemented experimentally to demonstrate the performance of the SVM algorithm.
Section 2 of the present paper outlines the proposed method, while Section 3 describes the experimental validation of the proposed approach. Section 4 presents the results and discussions, and finally, Section 5 provides the conclusions and future work.

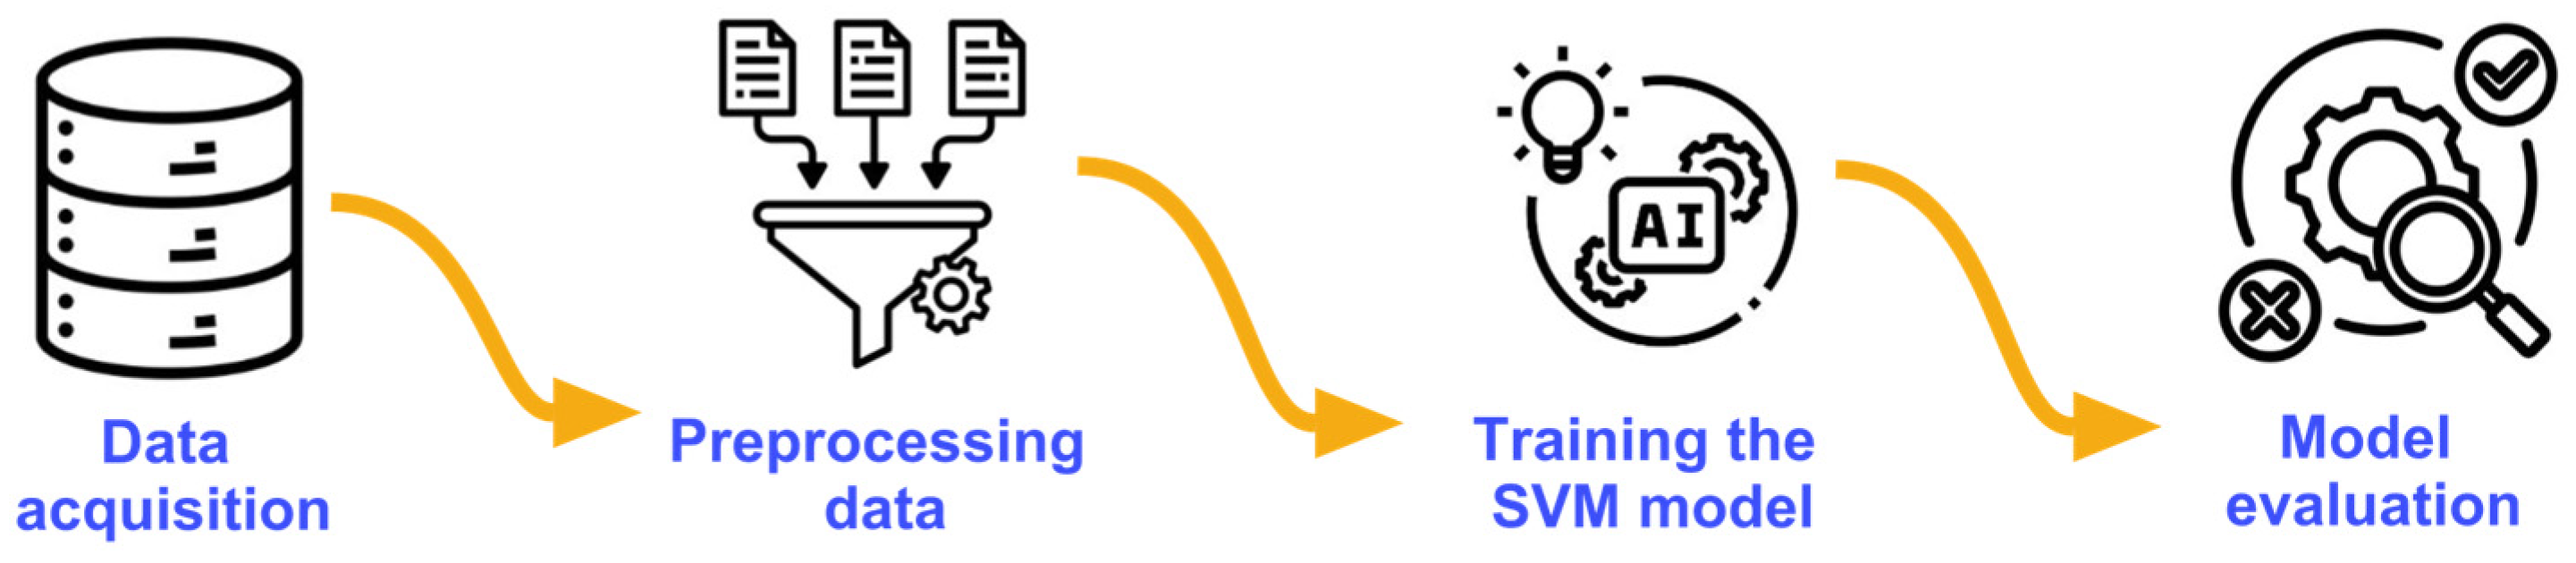
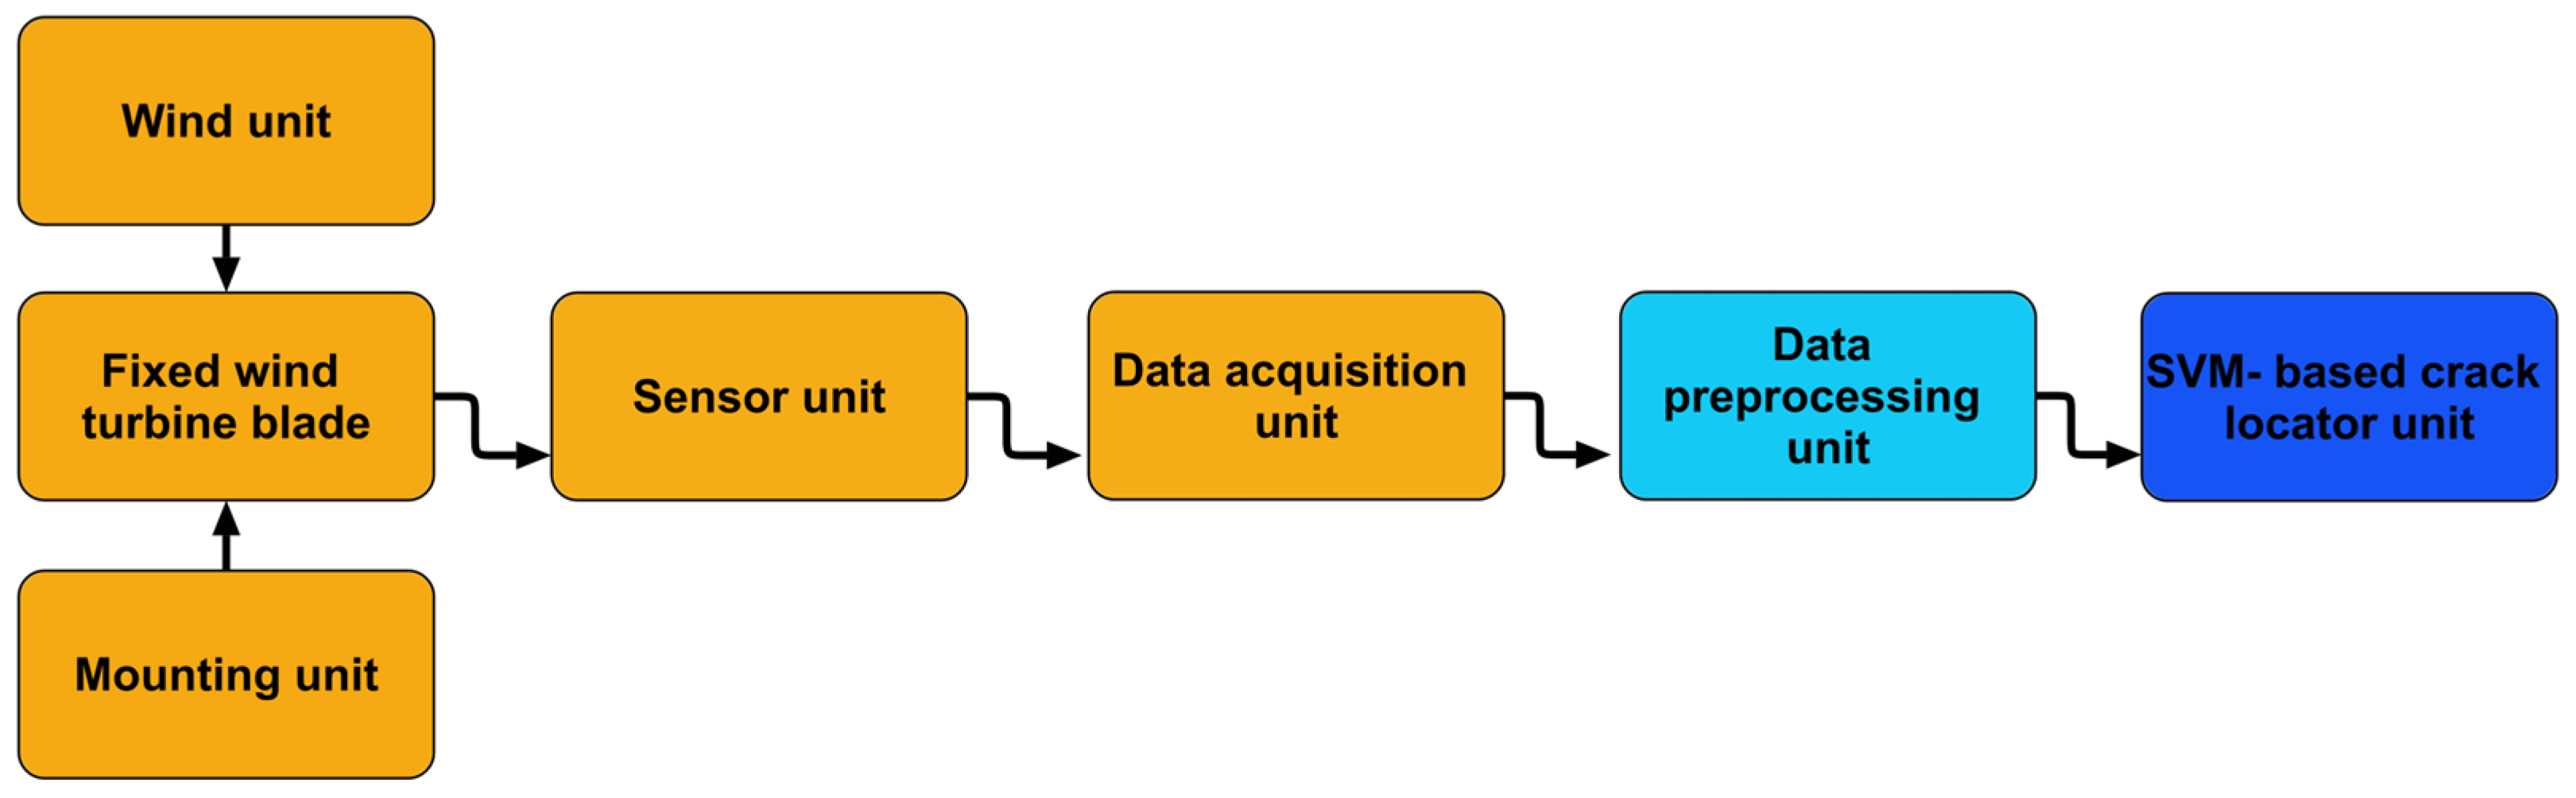
2. Crack Location Method

Several studies have reported that the changes in the natural frequency of the cantilever beam are a function of crack location [42]. The natural frequency of a cantilever beam can be calculated using several analytical methods [43]. Equation (1) gives the natural frequency value in rad/s, and Equation (2) gives the value in Hz. However, the calculus of the first natural frequency of a WTB is more complex due to its properties and design. For this reason, the analytical methods are more complex, and the experimental methods based on modal analysis require the vibration amplitude measurement at several positions of the beam and an analysis carried out by an expert [41].
ω n = α 2 E I A ρ L 4
where α is the constant of the end condition, E is Young’s modulus of elasticity, I is the moment of inertia, A is the beam’s cross-sectional area, ρ is the density of the material, and L is the length of the beam.
f n = ω n 2 π
In operating conditions, the vibrational response of the blade would be affected by angular speed. Many peculiar aspects can modify the dynamic response of the rotating machine in the presence of cracks: centrifugal force effects, gyroscopic effects, anisotropy in the supports, and the breathing of the cracks under the effect of weight, which also has an impact on the stability [44]. These factors make it challenging to design monitoring methods for rotary machines. As a result, most methods reported for monitoring and detecting failures in WTBs are not intended for use while the blades are operational.
In this work, the proposed crack location method is an initial approach based on the SVM model and the tangential vibration signal measured at the root of the WTB in static conditions. This method leverages SVM’s ability to create robust classification models, making it particularly suitable for complex patterns often found in WTBs with different crack locations. In addition, the SVM possesses valuable properties that are well-suited for this application, including its ability to manage nonlinear data and prevent overfitting, especially in scenarios with limited datasets. These advantages are particularly significant in industrial applications where the vibration signals may be restricted, noisy, or complex. The cross-validation technique was also used to prevent overfitting due to the small dataset.
Figure 1 illustrates the proposed method, which consists of four steps: data acquisition, data preprocessing, SVM model training, and SVM model evaluation. The following subsections describe each step.

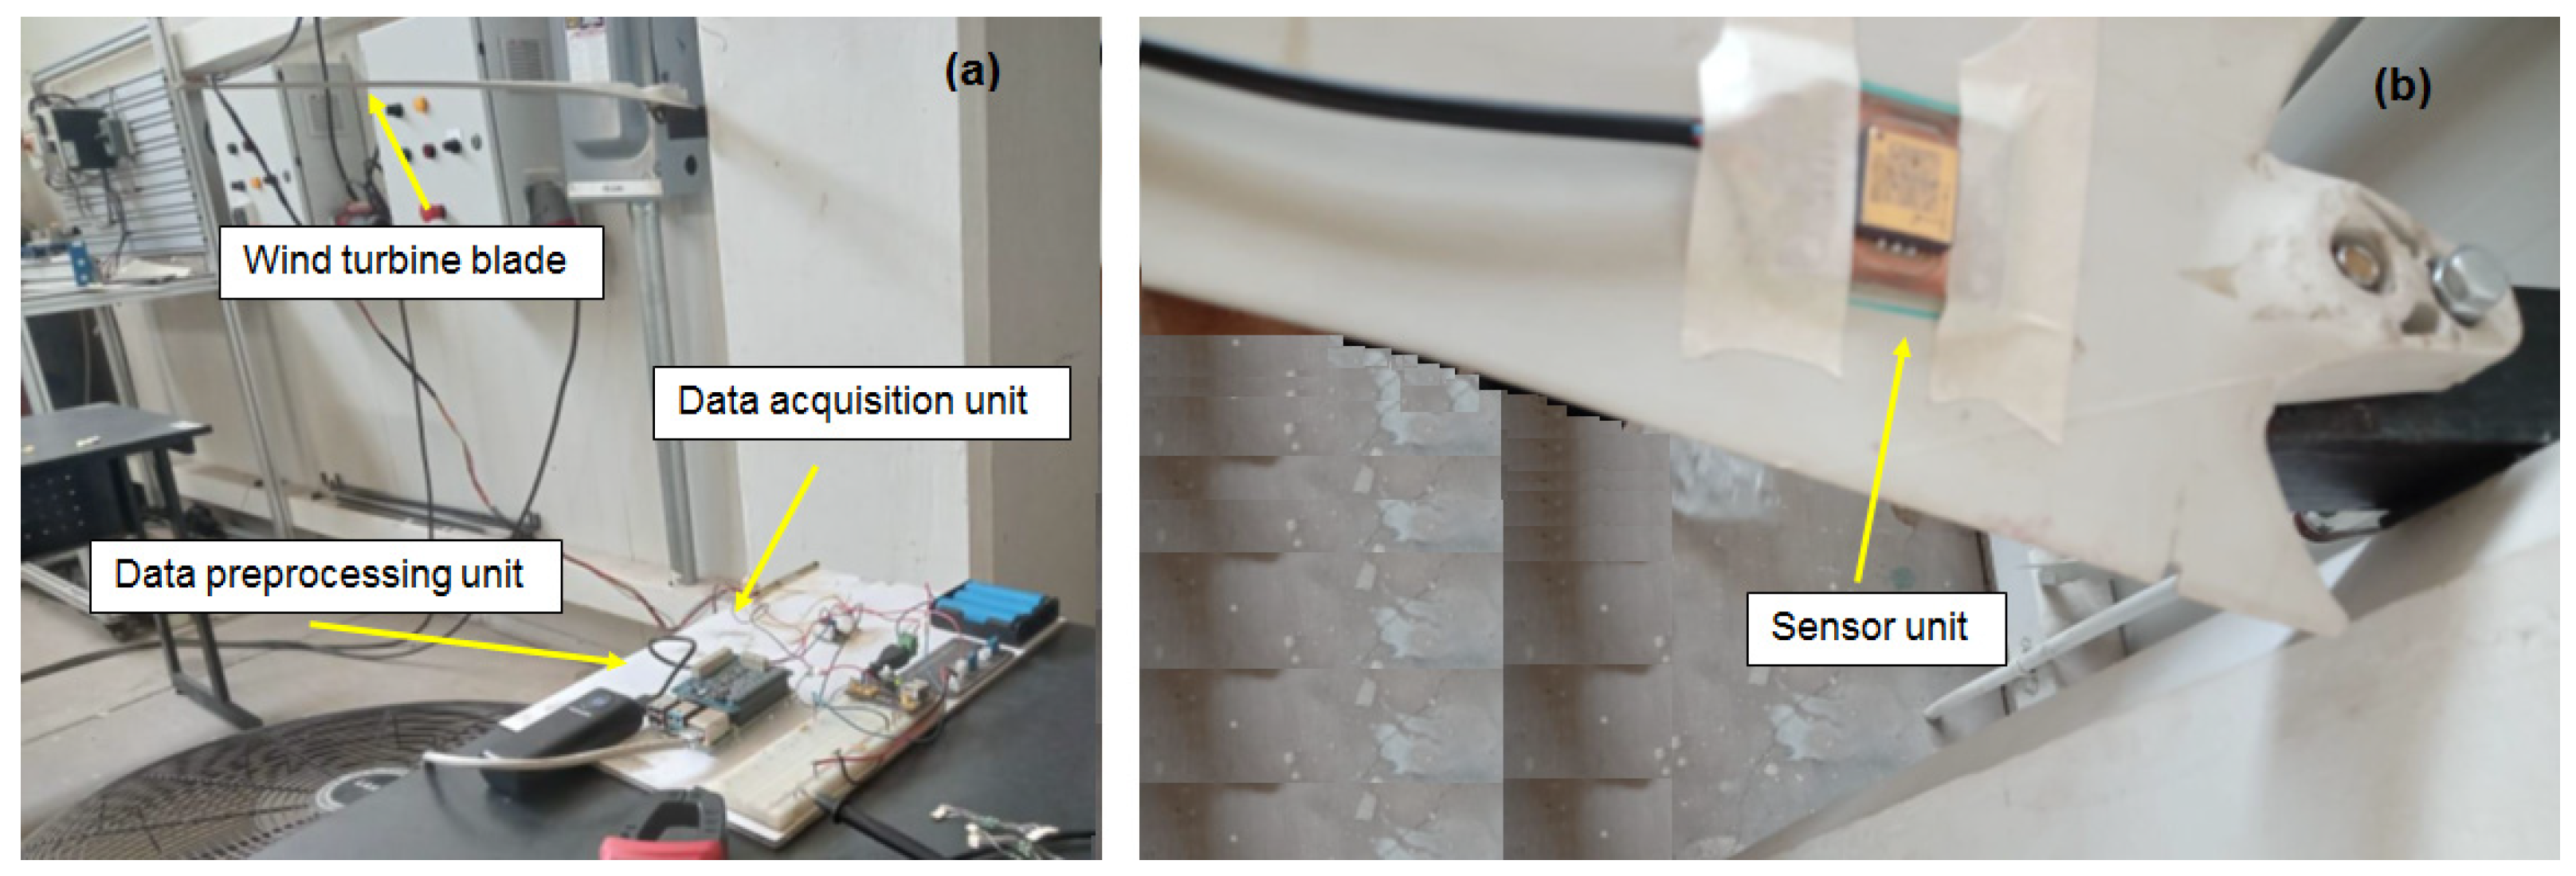
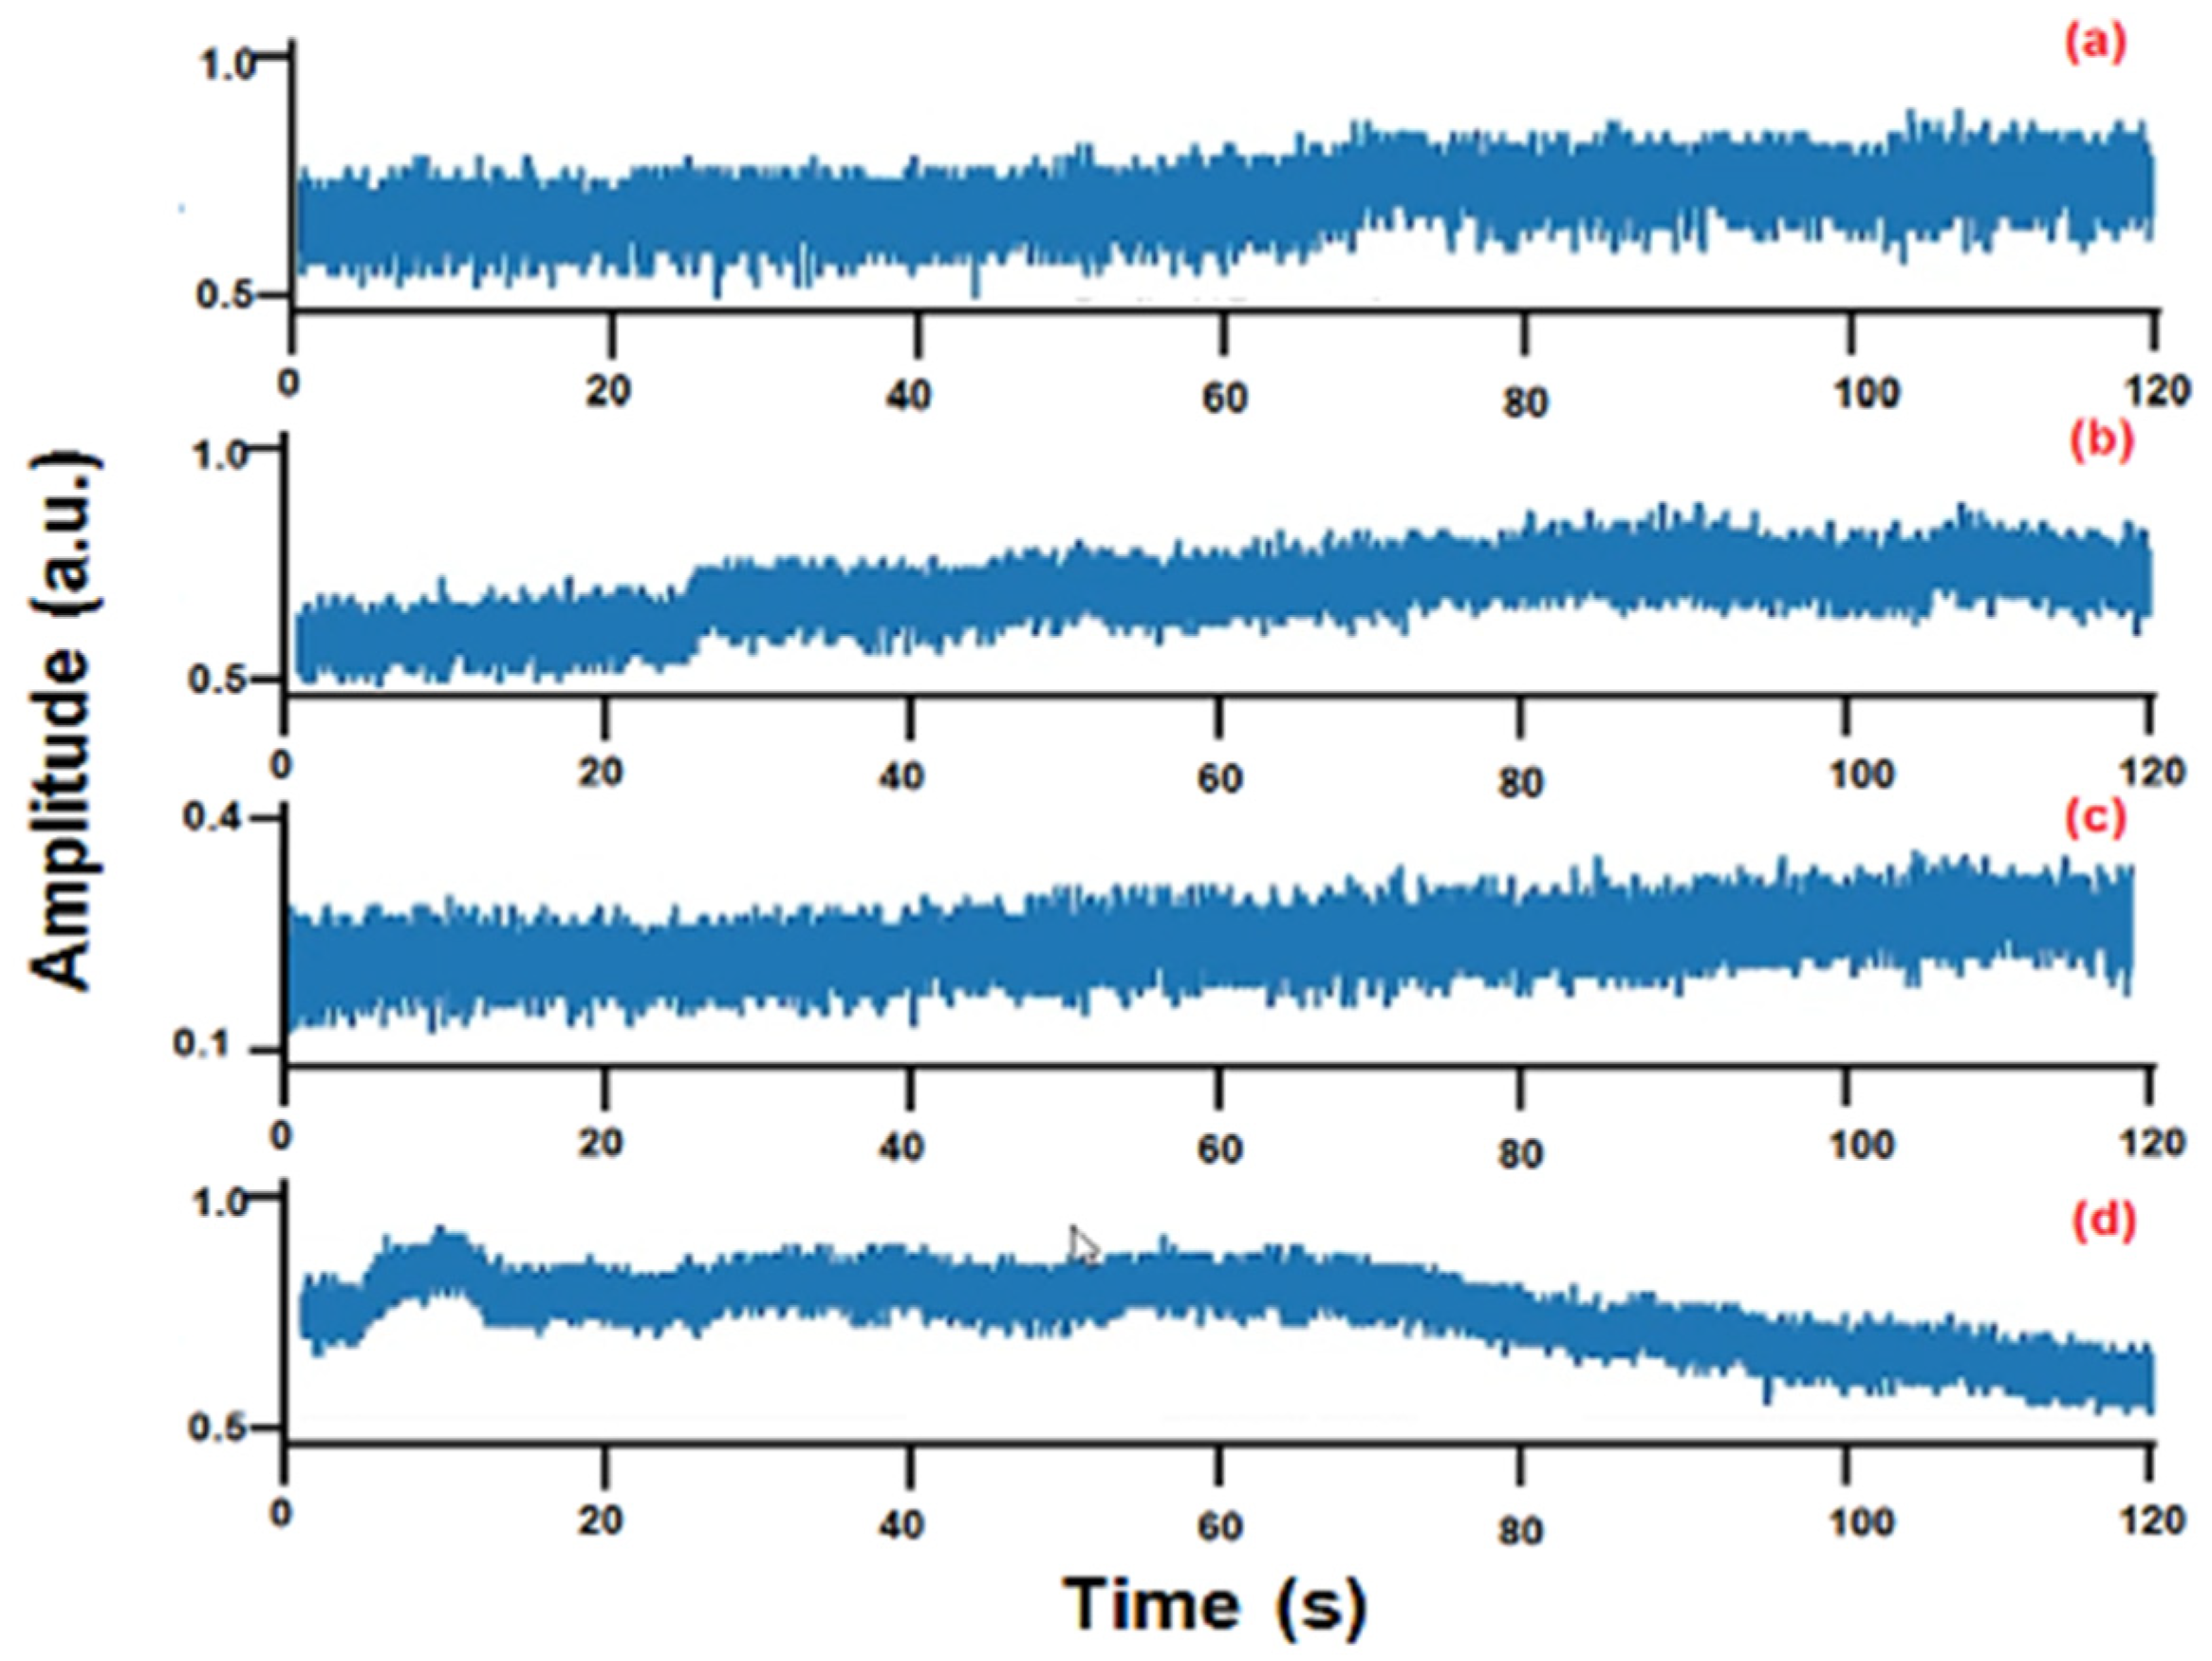
2.1. Data Acquisition

One parameter or attribute was acquired under healthy and crack conditions for WTBs. The parameter is the vibration produced on the root of a fixed blade when a wind stimulus is applied. One piezoelectric accelerometer attached at the root of each WTB is required. The tangential vibration signal measured in the root section of each WTB is analyzed because this area experiences significantly higher static and dynamic mechanical stress than the mid and tip sections. Furthermore, the root section is the closest part of the blade to its fixation point.
Cracks were located in different transverse sections of the WTB. The acquisition system must fulfill the Nyquist sampling theorem, as shown in Equation (3) [45].
f s 2 β
where f s is the sampling frequency, and β is the highest signal frequency.
On the other hand, the proposed approach is characterized by using a small data set. For this, the sample length and signal samplings are in the range of hundreds.

2.2. Data Preprocessing

Data preprocessing is crucial in building an effective artificial intelligence (AI) model. Proper data preprocessing helps improve the model’s performance and ensures that the data is in a suitable format for training. Normalization is a technique used to adjust the values of numerical features in the dataset to a standard scale without distorting differences in the range of values. Meanwhile, feature extraction involves selecting and retaining only the most relevant features for the AI model. Finally, data splitting, a crucial technique, divides the dataset into training, validation, and test subsets to effectively evaluate model performance.
The data preprocessing comprises normalization through min–max scaling, time-domain feature extraction, feature selection, and splitting into training and testing subsets in an 80/20 ratio.

2.3. Training the SVM Model

SVM is a supervised ML model used for data classification. The training process involves learning to separate hyperplanes between the feature vectors of the defined classes. The training comprises the set of the hyperparameters gamma, C, degree, and kernel function. These hyperparameters are tuned to improve classification accuracy. Various freely available ML libraries can be used for training.
The common types of kernel functions are linear, polynomial, radial basis function, and sigmoid. Understanding and selecting the appropriate kernel is crucial for leveraging the full potential of ML algorithms. Kernel functions are not just an ML component; they are pivotal elements, especially in algorithms like SVMs. They enable models to efficiently handle non-linear datasets by transforming them into higher-dimensional spaces without explicitly computing the coordinates of the data in that space. This transformation allows for more complex relationships to be modeled, enhancing the predictive capabilities of algorithms.
Based on the training subset distribution of the measured vibration signals, the linear kernel function is chosen for the training of the SVM model. The linear kernel function is most straightforward when the data are linearly separable. It calculates the standard dot product between two input vectors, see Equation (4).
K X i , X j = X i T X j

2.4. Evaluating the SVM Model

Model evaluation is a process that uses some metrics that allow the analysis of the model’s performance. One of these metrics is the multiclass confusion matrix, which is used to visualize classification performance and identify common misclassifications. For n classes, the confusion matrix has dimensions of n × n (Figure 2), where the rows represent the actual classes, and the columns represent the predicted classes. Each cell i , j in the matrix indicates the instances where the actual class is i and the predicted class is j .
In a confusion matrix, a true positive ( T P ) is the number of instances of the class i that are correctly predicted as positive by the model. A true negative ( T N ) is the number of instances of class i correctly predicted as negative by the model. A false positive ( F P ) is the number of instances of class i incorrectly predicted as positive by the model, also known as a Type I error. A false negative ( F N ) is the number of instances of class i incorrectly predicted as negative by the model. This last is also known as a Type II error. In Figure 2, T P s are marked with a blue color for better identification.
The interpretation of the matrix is as follows: the diagonal elements represent the correctly classified instances (TPs for each class). In contrast, the off-diagonal elements represent instances that have been misclassified. For example, if an instance of class A is predicted as class B, it contributes to an FN for class A and an FP for class B.
After obtaining the multiclass confusion matrix, several metrics can be derived to assess the performance of the classification model. The primary metrics are o v e r a l l   a c c u r a c y   O A c c (Equation (5)), A c c u r a c y i   A c c i (Equation (6)), P r e c i s i o n i   P r e c i   (Equation (7)), R e c a l l i   R e c i (Equation (8)), and F 1   S c o r e i   F 1 i (Equation (9)).
O A c c = T P T o t a l   i n s t a n c e s
A c c i = T P i + T N i T P i + T N i + F P i + F N i
P r e c i = T P i T P i + F P i
R e c i = T P i T P i + F N i
F 1 i = 2 × P r e c i s i o n i × R e c a l l i P r e c i s i o n i + R e c a l l i

3. Experimental Validation

Based on the SVM model and the tangential root vibration signal measured in static conditions, the crack location method was implemented in hardware and experimentally tested in real WTBs for 200 W. Also, the KNN and DT models were implemented and tested using the same experimental configuration. The metric results from the three implemented ML models were compared.
The wind experiment was conducted indoors and in a closed environment to minimize external variations, which allowed for maintaining constant and stable conditions throughout the experimental process. These considerations ensured that external variables, such as wind direction or speed changes, did not interfere with the study results. In this way, precise control over atmospheric conditions was achieved, ensuring the reliability and repeatability of the results obtained. The temperature range was 24 °C to 38 °C.
Figure 3 and Figure 4 depict the block diagram of the experimental configuration and the components needed to implement it, respectively. The experimental configuration diagram comprises three main sections. The first section contains a fixed WTB, a wind unit, a mounting unit, a sensor unit, and a data acquisition unit. The second section comprises a data preprocessing unit. Finally, the third section includes the SVM-based crack locator unit.
Commercial elements were used for the implementation of the proposed method. The WTBs used in the experimental tests were for a micro wind turbine rated at 200 W, handcrafted from nylon fiber. The WTB geometrical data are as follows: airfoil SD7080, blade length of 600 mm, chord at the root of 120 mm, chord at the tip of 35 mm, pitch at the root of 4°, pitch at the tip of 5°, blade twist of 5° to 10° from root to tip, and blade weight of 120 g.
The blade was mounted on a fixed concrete block (Figure 4b). The blade was subjected to a simulated wind speed of 5 m/s, representing typical operational conditions. The wind speed was simulated using an industrial fan and an ABB ACS355 AC drive. The wind speed was measured using an anemometer to validate their stability. Using a fan with a constant speed instead of an impulse load to stimulate the WTB has several advantages related to the stability, control, and nature of the vibrations that are generated in the system.
Transverse cracks were induced in different locations of the WTB, such as the root, midsection, and tip (see Figure 5). Table 3 shows the labels of each WTB condition. The cracks had a width of 0.5 mm and a depth of 10 mm. Currently, no standard or regulation sets out the criteria for dimensions or parameters to be met by manually induced WTB cracks. Therefore, in this work and the other reported works for monitoring blades’ cracks, the induced cracks’ size was selected to replicate real damage manually, making cross-cuts in the blade laminate.
The tangential vibration signals were measured using one piezoelectric accelerometer model 830M1, which has a bandwidth of 2 Hz to 10,000 Hz, a sensitivity of 2.5 mV/g, and can register up to ±500 g. The accelerometer was securely attached with epoxy resin at the root of the WTB, and the wire was protected with tape.
The data acquisition system for capturing the vibration signals includes a signal conditioner, a DAQ HAT model MCC 118, a Raspberry Pi 4B+ model, batteries, and a power bank.
The accelerometers were connected to signal conditioners model AD620. These instrumentation amplifiers remove the DC component that has the sensors and then amplify the signals.
The sample length was selected to ensure data consistency while considering several important factors. Feature measurements become more meaningful when the number of samples is sufficiently large; however, increasing the sample number also leads to longer computation times. A sample length of 140 was chosen to achieve an optimal balance between these considerations. Signal samplings of 300 were acquired for each WTB condition mentioned in Table 3. The data dimension is 140 × 300 × 4 (sample length × signal samplings × WTB condition).
The data acquisition unit was configured to a sampling frequency of 350 Hz. The programming language employed was Python 3.11.5. To validate the operation of the data acquisition unit before it was mounted on the test bench, a stable signal of 1 kHz was introduced.

3.1. SVM Model

The dataset preprocessing, training, validation, and evaluation of the SVM model were carried out using the Pandas, matplotlib, and Scikit-learn libraries. These processes involve the following steps:
  • Import the relevant modules from Scikit-learn for SVM and data handling.
  • Import and preprocess the dataset. The min–max scaling method was applied during the data normalization process. Relevant features were extracted from the previously mentioned dataset using the Pandas library. Pandas is a Python 3.11.5 package that calculates many time series characteristics or features. The selected characteristics included mean, standard deviation, maximum frequency, skewness, and kurtosis. The preprocessed data dimension is 300 × 5 × 4 (signal samplings × features × WTB).
  • Split the preprocessed dataset into training and test subsets. The test subset was randomly split into 20% of the extracted feature data, and the training subset was split randomly into 80%. The train–test split function was used to split the data.
  • Initialize the SVM model. The SVM used for classification was the SVC (support vector classifier), a linear kernel. Tune the hyperparameters using GridSearchCV. Apply the cross-validation technique.
  • Fit the SVM classifier model using the fit() method on the training dataset.
  • Predict using the predict() function on the test dataset.
  • Evaluate the SVM’s model performance using metrics. The A c c u r a c y , P r e c i s i o n , R e c a l l , and F 1   S c o r e were computed using sklean metrics. Meanwhile, the multiclass confusion matrix was plotted using sklearn metrics and the matplotlib.pyplot module. Matplotlib displays the results in a more intuitive visual format using colors and bold type.

3.2. KNN Model

The dataset preprocessing, training, validation, and evaluation of the KNN model involve the following steps:
  • Execute steps 1 to 3 outlined in Section 3.1.
  • Choose the value for K (the number of nearest neighbors). The initial value of K is set at 3.
  • Fit the KNN model to the training dataset. The libraries used were sklearn.neighbors.KNeighborsClassifier.
  • Predict using the predict() function on the test dataset.
  • Evaluate the KNN’s model performance using metrics. The A c c u r a c y , P r e c i s i o n , F 1   S c o r e , and Recall were computed using sklean metrics.
  • Test different values of K to determine the best value of K for the classifier. The best value of K was 5.

3.3. DT Model

The dataset preprocessing, training, validation and evaluation of the DT model involve the following steps:
  • Execute steps 1 to 3 outlined in Section 3.1.
  • Initialize the DT model using the DecisionTreeClassifier from sklearn.tree. The best combination of hyperparameter values was found using Scikit-Learn’s GridSearchCV.
  • Fit the DT classifier model using the fit() method on the training dataset.
  • Predict using the predict() function on the test dataset.
  • Evaluate the DT’s model performance using metrics. The A c c u r a c y , P r e c i s i o n , F 1   S c o r e , and Recall were computed using sklean metrics.

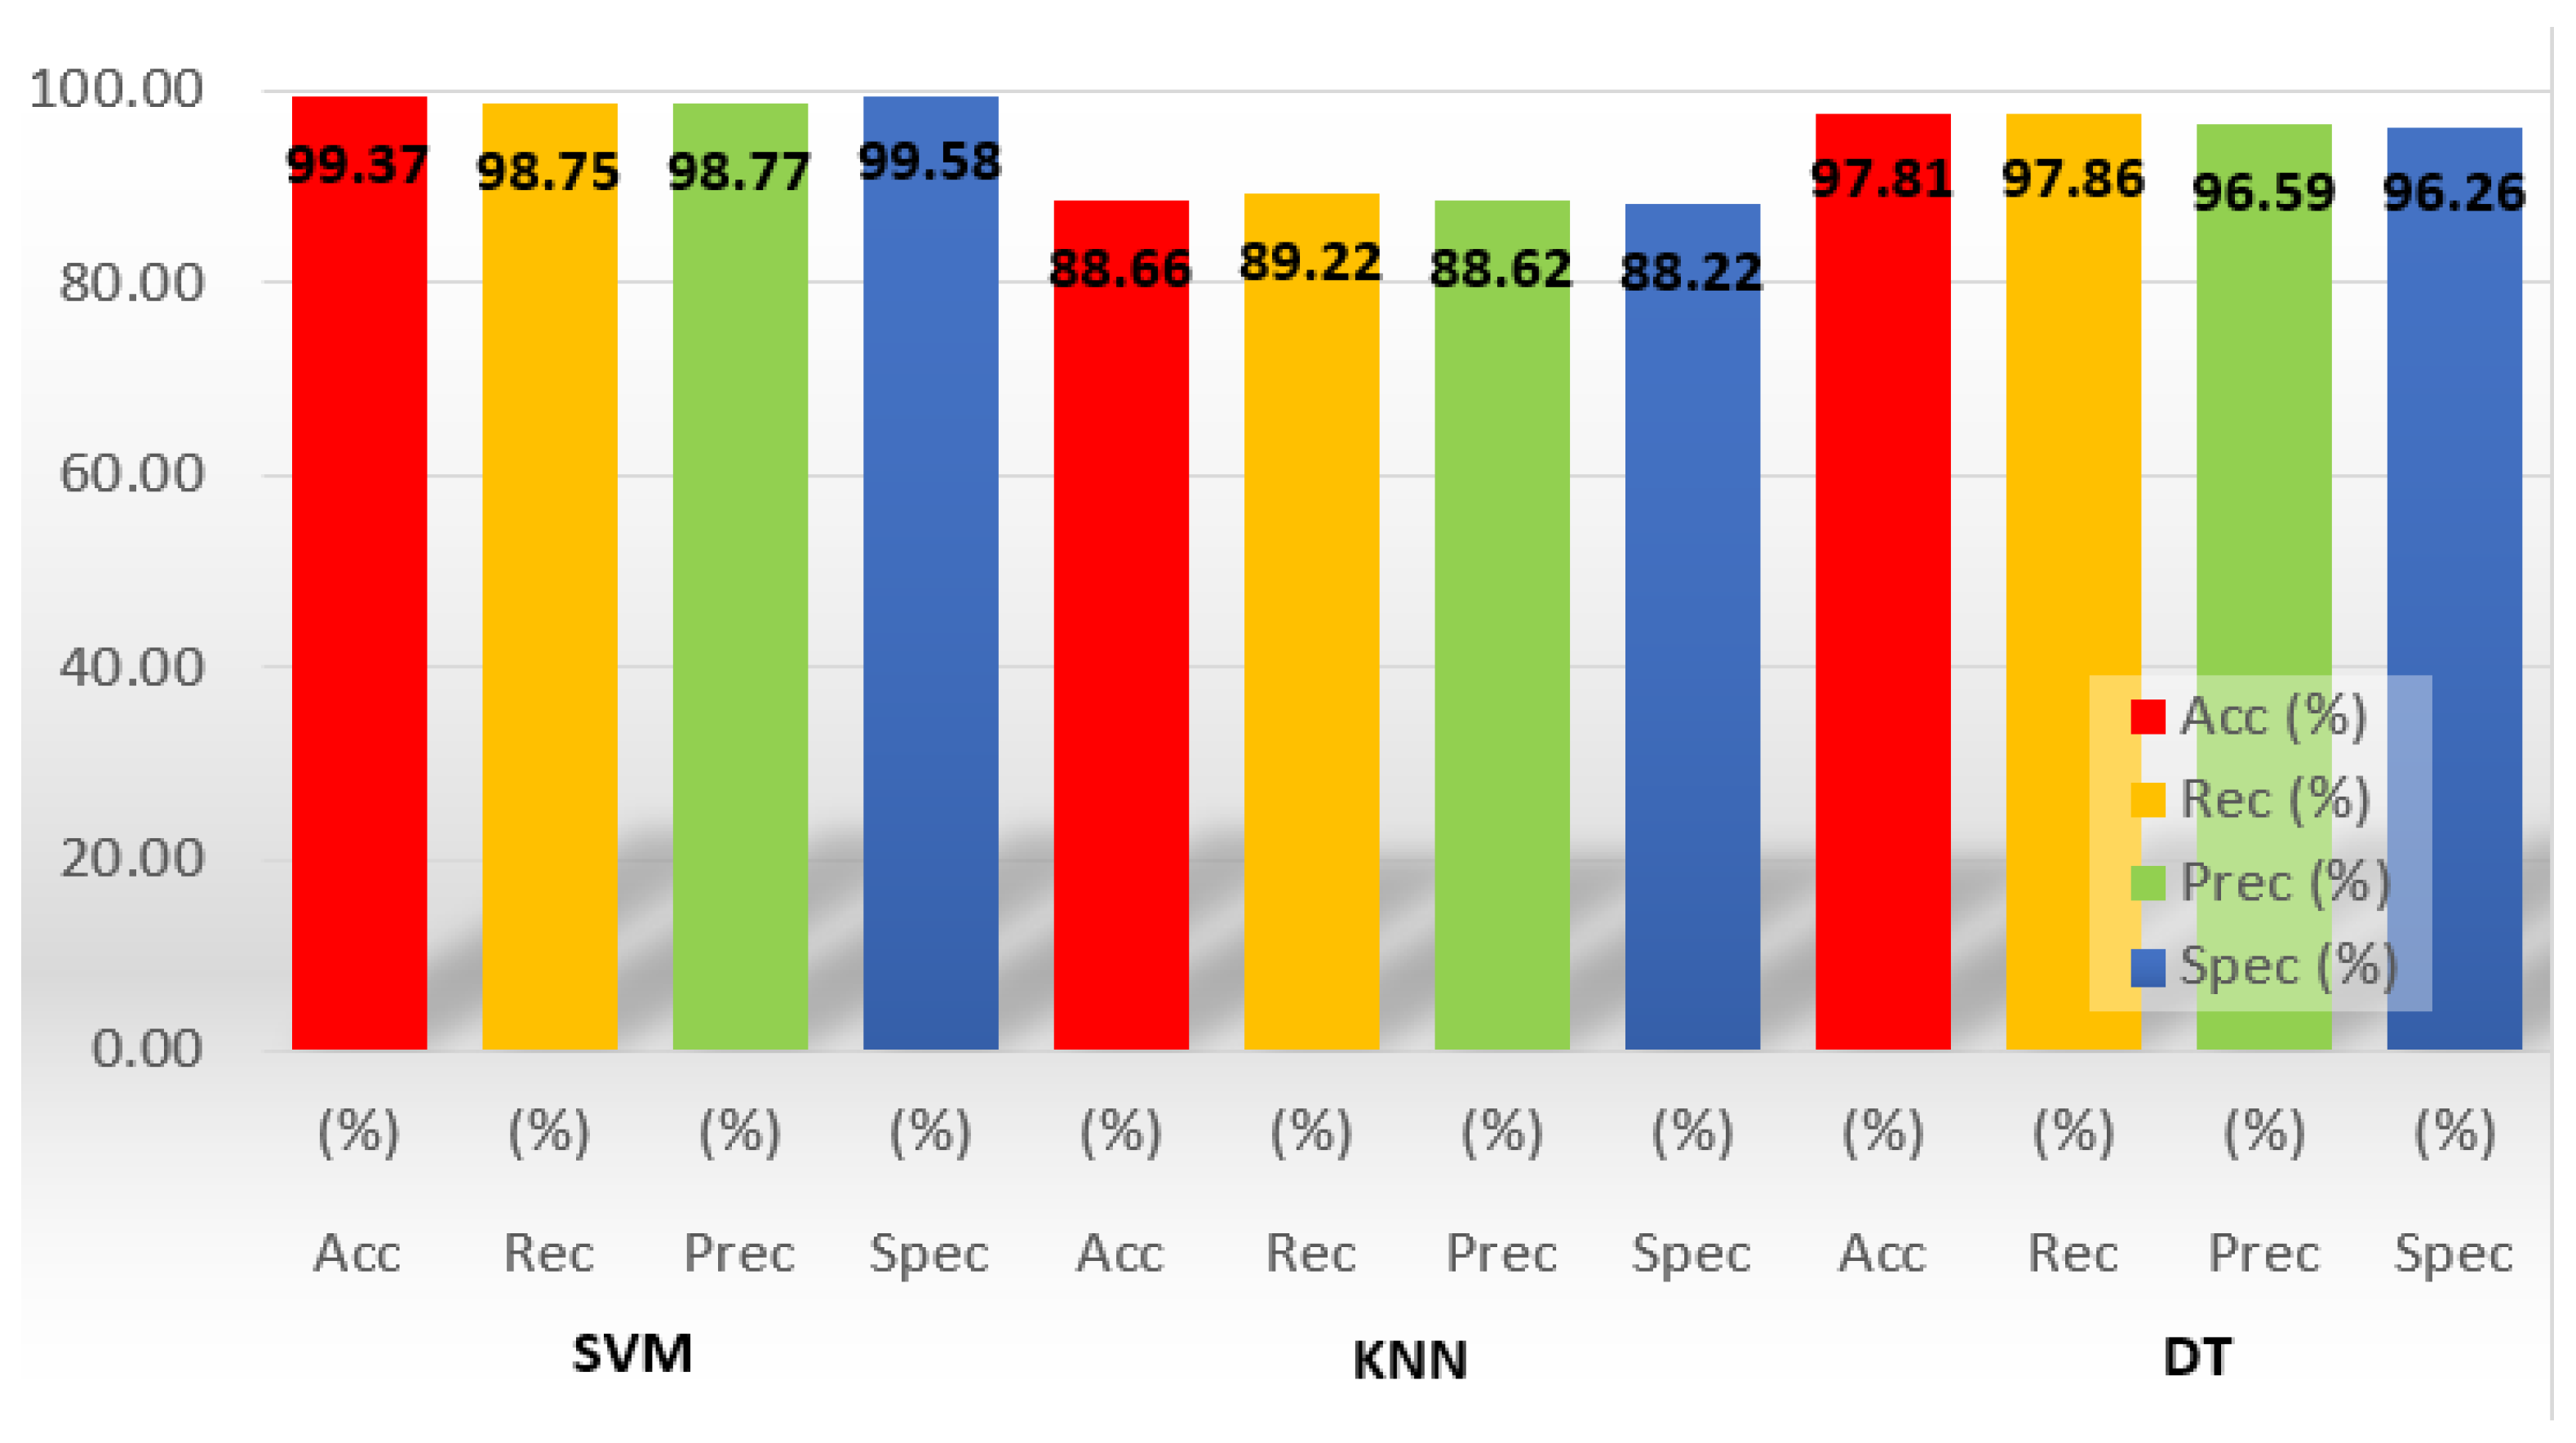
4. Results and Discussions

This section shows the results obtained from designing and implementing the crack location method based on ML algorithms and the tangential vibration signal measured at the root of a WTB in static conditions. The results are organized into three stages: data acquisition, data preprocessing, and the evaluation of the SVM, KNN, and DT models.
Figure 6 shows the tangential vibration signal measured at the root of a healthy WTB and WTBs with cracks in three distinct locations: the tip, the middle, and the root (Table 3). This figure shows that the noise was not critical. It is due to the characteristics of the sensor unit and data acquisition unit. In addition, Figure 6 provides evidence that the presence of cracks at various locations on the WTB alters the amplitudes and frequencies of the vibration signals. However, analyzing the time series of the vibration signals reveals challenges in establishing parameters for identifying and locating damage in the WTB. Consequently, more than a straightforward analysis of this kind is needed, primarily due to the irregular profile of the WTB.
Figure 7 shows the frequency spectrums of signals presented in Figure 6. These spectrums show that cracks in different locations of the WTB generate changes in frequency patterns, which can be used to classify the blade condition. However, when the spectral analysis was performed on all sampled signals, the spectra collected under identical WTB conditions did not exhibit consistent patterns. This inconsistency is because the signals vary over time, as shown in Figure 8. These results demonstrate that a classical time or frequency method is deemed insufficient for accurately locating cracks in the WTB.
The results of the SVM model evaluation are shown in Figure 9. This figure shows the multiclass confusion matrix, which summarizes prediction results by comparing the actual and predicted labels. This matrix shows the number of instances classified into different categories: CR (crack in the root), CM (crack in the midsection), CT (crack in the tip), and H (healthy). The numbers in the matrix represent the count of instances correctly classified and misclassified for each category. For example, there were sixty instances of CR correctly classified, zero misclassified as CM, zero misclassified as CT, and zero misclassified as H in the CR. There were fifty-eight instances of CM correctly classified, zero misclassified as CR, zero misclassified as CT, and two misclassified as H in the CM. The numbers of false positives and false negatives suggest that the method was very accurate in differentiating between the healthy condition and the location of the crack in the WTB.
Table 4 shows the results of the classification metrics (Equations (5)–(9)) using the SVM, KNN, and DT models. Meanwhile, Figure 10 shows the performance comparison of the average results of the different models. The SVM model demonstrates an excellent balance between sensitivity and specificity, as shown by the comparatively low numbers of false positives and false negatives. The SVM model achieves the best results, with an accuracy of 99.37% and a precision of 98.77%. This application of SVM for crack location in wind turbines has shown promising results. The model effectively and accurately classifies different conditions, facilitating the precise location of various transverse cracks using a limited dataset and minimal computational power. It excels in classification tasks and effectively manages complex patterns within the data. This approach enhances safety and operational reliability while also contributing to cost savings by reducing unplanned maintenance.

5. Conclusions and Future Work

In conclusion, the crack location method developed for WTBs, which utilizes the SVM model and the tangential vibration signal measured at the root of the WTB in static conditions, shows significant potential to enhance predictive maintenance and safety in wind energy systems. Integrating advanced data analytics with traditional inspection methods demonstrates excellent promise in implementation and computing resources. The successful implementation of this method in hardware and experimental testing on 200 W wind turbine blades featuring various transverse cracks at the root, midsection, and tip yielded impressive results. The SVM model achieved the highest accuracy and precision compared to the KNN and DT models. The SVM model shows an accuracy of 99.37% and a precision of 98.77%. These findings highlight the method’s effectiveness in accurately detecting and locating structural damage.
One low-cost, affordable, straightforward-to-install piezoelectric accelerometer is required for the method’s implementation. Additionally, the SVM technique does not require a big dataset, which reduces the computing power and response time.
The proposed method aims to enhance the reliability of operations and ensure the structural integrity of wind turbine systems, ultimately supporting the sustainability and efficiency of wind energy production through the early detection of cracks. This approach highlights the importance of applying machine learning in engineering and paves the way for more advanced and efficient wind energy systems. Although the method has only been applied to WTBs, this proposed method could be adapted and tested for use on other real-world structures, as the relationship between vibrations and cracks is a phenomenon that occurs in any cracked structure.
It is important to note that this proposed method is an initial approach and is not intended for use with WTBs under operational conditions due to the complexity of the instrumentation system for measuring vibrations at the root of blades in a rotating state, as well as the presence of mechanical aspects, which can modify the dynamic response of the rotating machine in the presence of cracks. However, the authors recognize the significance and benefits of monitoring techniques in dynamic environments. The authors are developing another method to address these considerations. This new method is based on the approach outlined in this work. It will analyze the vibration signals measured at the root of the WTBs to assess the condition of the WTBs during operation. Also, another future work will focus on refining the model with additional data sources, exploring its application across different wind turbine blade profiles, and enhancing its ability to indicate the severity of cracking in WTBs.

Author Contributions

Conceptualization, J.B.R.-O.; Data curation, M.A.Z.-R. and E.N.H.-E.; Formal analysis, P.Y.S.-C.; Funding acquisition, P.Y.S.-C.; Investigation, P.Y.S.-C.; Methodology, J.B.R.-O.; Project administration, M.A.Z.-R. and E.N.H.-E.; Resources, M.A.Z.-R. and E.N.H.-E.; Software, S.D.l.C.-A.; Supervision, J.B.R.-O.; Validation, J.R.-R.; Visualization, S.D.l.C.-A.; Writing—original draft, P.Y.S.-C.; Writing—review and editing, J.R.-R. All authors have read and agreed to the published version of the manuscript.

Funding

This research was funded by the Consejo Nacional de Humanidades, Ciencias y Tecnologías (CONAHCyT), Convocatoria de Ciencia de Frontera 2023; grant number CF-2023-I-2533.

Data Availability Statement

The data presented in this study are available on request from the corresponding author due to the confidentiality of the research in some aspects.

Acknowledgments

The authors would like to acknowledge the engineer Fernando Pavón for his support in developing some experimental tests.

Conflicts of Interest

The authors declare no conflicts of interest.

Abbreviations

The following abbreviations are used in this manuscript:
WTBWind turbine blade
FFTFast Fourier transform
MLMachine learning
KNNK-nearest neighbors
SVMSupport vector machine
UAVUnmanned aerial vehicles
DTDecision tree
AIArtificial intelligence
TPTrue positive
TNTrue negative
FPFalse positive
FNFalse negative
HHealthy
CRCrack in root
CMCrack in midsection
CTCrack in tip

References

  1. Li, J.; Wu, Z.; Tan, X.; Chen, B. Review of wind power generation and relative technology development. Electr. Power Constr. 2011, 32, 64–72. [Google Scholar]
  2. Jensen, F.M.; Braner, K. Introduction to Wind Turbine Blade Design. In Advances in Wind Turbine Blade Design and Materials, 2nd ed.; Woodhead Publishing Series in Energy; Woodhead Publishing: Cambridge, UK, 2023; pp. 3–53. ISBN 9780081030073. [Google Scholar] [CrossRef]
  3. Du, Y.; Zhou, S.; Jing, X.; Peng, Y.; Wu, H.; Kwok, N. Damage Detection Techniques for Wind Turbine Blades: A Review. Mech. Syst. Signal Process. 2020, 141, 106445. [Google Scholar] [CrossRef]
  4. Katsaprakakis, D.A.; Papadakis, N.; Ntintakis, I.A. Comprehensive Analysis of Wind Turbine Blade Damage. Energies 2021, 14, 5974. [Google Scholar] [CrossRef]
  5. Kaewniam, P.; Cao, M.; Alkayem, N.F. Recent Advances in Damage Detection of Wind Turbine Blades: A State-of-the-Art Review. Renew. Sustain. Energy Rev. 2023, 167, 112723. [Google Scholar] [CrossRef]
  6. Kong, K.; Dyer, K.; Payne, C.; Hamerton, I.; Weaver, P.M. Progress and Trends in Damage Detection Methods, Maintenance, and Data-Driven Monitoring of Wind Turbine Blades—A Review. Renew. Energy Focus 2023, 44, 390–412. [Google Scholar] [CrossRef]
  7. Reddy, S.S.P.; Suresh, R.; M.B., H.; Shivakumar, B.P. Use of Composite Materials and Hybrid Composites in Wind Turbine Blades. Mater. Today Proc. 2021, 46, 2827–2830. [Google Scholar] [CrossRef]
  8. Madhav, P.; Matavkar, D.; Mayekar, N.; Parsekar, M. A Review on Crack Detection in Wind Turbine Blade. Int. J. Res. Appl. Sci. Eng. Technol. 2024, 12, 3129–3140. [Google Scholar] [CrossRef]
  9. Benaissa, B.; Hocine, N.A.; Khatir, S.; Riahi, M.K.; Mirjalili, S. YUKI Algorithm and POD-RBF for Elastostatic and dynamic crack identification. J. Comput. Sci. 2021, 55, 101451. [Google Scholar] [CrossRef]
  10. Amoura, N.; Benaissa, B.; Al Ali, M.; Khatir, S. Deep Neural Network and YUKI Algorithm for Inner Damage Characterization Based on Elastic Boundary Displacement. In Proceedings of the International Conference of Steel and Composite for Engineering Structures. ICSCES 2022, Barcelona, Spain, 15–17 September 2022; Lecture Notes in Civil Engineering, 317. Springer: Cham, Switzerland, 2023. [Google Scholar] [CrossRef]
  11. Zhu, X.; Guo, Z.; Zhou, Q.; Zhu, C.; Liu, T.; Wang, B. Damage Identification of Wind Turbine Blades Based on Deep Learning and Ultrasonic Testing. Nondestruct. Test. Eval. 2024, 1, 1–26. [Google Scholar] [CrossRef]
  12. Hwang, S.; An, Y.-K.; Sohn, H. Continuous-Wave Line Laser Thermography for Monitoring of Rotating Wind Turbine Blades. Struct. Health Monit. 2019, 18, 1010–1021. [Google Scholar] [CrossRef]
  13. Jaeger, B.E.; Schmid, S.; Grosse, C.U.; Gögelein, A.; Elischberger, F. Infrared Thermal Imaging-Based Turbine Blade Crack Classification Using Deep Learning. J. Nondestruct. Eval. 2022, 41, 74. [Google Scholar] [CrossRef]
  14. Bo, Z.; Zhan, Y.; Changzheng, C. Acoustic Emission Detection of Fatigue Cracks in Wind Turbine Blades Based on Blind Deconvolution Separation. Fatigue Fract. Eng. Mater. Struct. 2017, 40, 959–970. [Google Scholar] [CrossRef]
  15. Ding, S.; Yang, C.; Zhang, S. Acoustic-Signal-Based Damage Detection of Wind Turbine Blades—A Review. Sensors 2023, 23, 4987. [Google Scholar] [CrossRef]
  16. Fantidis, J.G.; Potolias, C.; Bandekas, D.V. Wind Turbine Blade Nondestructive Testing with a Transportable Radiography System. Sci. Technol. Nucl. Install. 2011, 2011, 347320. [Google Scholar] [CrossRef]
  17. Lee, H.; Hwang, Y.M.; Lee, J.; Kim, N.; Ko, S.-K. A Drone-Driven X-Ray Image-Based Diagnosis of Wind Turbine Blades for Reliable Operation of Wind Turbine. IEEE Access 2024, 12, 56141–56158. [Google Scholar] [CrossRef]
  18. Yan, Q.; Che, X.; Li, S.; Wang, G.; Liu, X. π-FBG Fiber Optic Acoustic Emission Sensor for the Crack Detection of Wind Turbine Blades. Sensors 2023, 23, 7821. [Google Scholar] [CrossRef]
  19. Memari, M.; Shakya, P.; Shekaramiz, M.; Seibi, A.C.; Masoum, M.A.S. Review on the Advancements in Wind Turbine Blade Inspection: Integrating Drone and Deep Learning Technologies for Enhanced Defect Detection. IEEE Access 2024, 12, 33236–33282. [Google Scholar] [CrossRef]
  20. Hang, X.; Zhu, X.; Gao, X.; Wang, Y.; Liu, L. Study on Crack Monitoring Method of Wind Turbine Blade Based on AI Model: Integration of Classification, Detection, Segmentation and Fault Level Evaluation. Renew. Energy 2024, 224, 120152. [Google Scholar] [CrossRef]
  21. Movsessian, A.; García Cava, D.; Tcherniak, D. An Artificial Neural Network Methodology for Damage Detection: Demonstration on an Operating Wind Turbine Blade. Mech. Syst. Signal Process. 2021, 159, 107766. [Google Scholar] [CrossRef]
  22. Ganeriwala, S.; Jun, Y.; Richardson, M. Using Modal Analysis for Detecting Cracks in Wind Turbine Blades. Sound Vib. 2011, 45, 10–13. [Google Scholar]
  23. Ulriksen, M.D.; Skov, J.F.; Dickow, K.A.; Kirkegaard, P.H.; Damkilde, L. Modal Analysis for Crack Detection in Small Wind Turbine Blades. In Key Engineering Materials; Trans Tech Publications, Ltd.: Stafa-Zurich, Switzerland, 2013; Volumes 569–570, pp. 603–610. [Google Scholar] [CrossRef]
  24. Fitzgerald, B.; Arrigan, J.; Basu, B. Damage Detection in Wind Turbine Blades Using Time-Frequency Analysis of Vibration Signals. In Proceedings of the International Joint Conference on Neural Networks, Barcelona, Spain, 18–23 July 2010; pp. 1–5. [Google Scholar] [CrossRef]
  25. Lorenzo, E.D.; Petrone, G.; Manzato, S.; Peeters, B.; Desmet, W.; Marulo, F. Damage Detection in Wind Turbine Blades by Using Operational Modal Analysis. Struct. Health Monit. 2016, 15, 289–301. [Google Scholar] [CrossRef]
  26. Pacheco-Chérrez, J.; Cárdenas, D.; Delgado-Gutiérrez, A.; Probst, O. Operational Modal Analysis for Damage Detection in a Rotating Wind Turbine Blade in the Presence of Measurement Noise. Compos. Struct. 2023, 321, 117298. [Google Scholar] [CrossRef]
  27. Rangel-Rodriguez, A.H.; Granados-Lieberman, D.; Amezquita-Sanchez, J.P.; Bueno-Lopez, M.; Valtierra-Rodriguez, M. Analysis of Vibration Signals Based on Machine Learning for Crack Detection in a Low-Power Wind Turbine. Entropy 2023, 25, 1188. [Google Scholar] [CrossRef] [PubMed]
  28. Joshuva, A.; Sugumaran, V. Crack Detection and Localization on Wind Turbine Blade Using Machine Learning Algorithms: A Data Mining Approach. Struct. Durab. Health Monit. 2019, 13, 181–203. [Google Scholar] [CrossRef]
  29. Ogaili, A.A.F.; Jaber, A.A.; Hamzah, M.N. A Methodological Approach for Detecting Multiple Faults in Wind Turbine Blades Based on Vibration Signals and Machine Learning. Curved Layer. Struct. 2023, 10, 20220214. [Google Scholar] [CrossRef]
  30. Zabihi, A.; Aghdasi, F.; Ellouzi, C.; Singh, N.K.; Jha, R.; Shen, C. Non-Contact Wind Turbine Blade Crack Detection Using Laser Doppler Vibrometers. Energies 2024, 17, 2165. [Google Scholar] [CrossRef]
  31. Carrattieri, L.; Cravero, C.; Marsano, D.; Valenti, E.; Sishtla, V.; Halbe, C. The Development of Machine Learning Models for Radial Compressor Monitoring With Instability Detection. J. Turbomach. 2025, 147, 051004. [Google Scholar] [CrossRef]
  32. Saito, H.; Kanzaki, D.; Yonekura, K. Applications of machine learning in surge prediction for vehicle turbochargers. Mach. Learn. Appl. 2024, 16, 100560. [Google Scholar] [CrossRef]
  33. Huang, X.; Zhang, X.; Xiong, Y.; Dai, F.; Zhang, Y. Intelligent Fault Diagnosis of Turbine Blade Cracks via Multiscale Sparse Filtering and Multi-Kernel Support Vector Machine for Information Fusion. Adv. Eng. Inf. 2023, 56, 101979. [Google Scholar] [CrossRef]
  34. Wang, L.; Zhang, Z. Automatic Detection of Wind Turbine Blade Surface Cracks Based on UAV-Taken Images. IEEE Trans. Ind. Electron. 2017, 64, 7293–7303. [Google Scholar] [CrossRef]
  35. Ashkarkalaei, M.; Ghiasi, R.; Pakrashi, V.; Malekjafarian, A. An Unsupervised Damage Detection Method for an Operating Wind Turbine Blade. In Proceedings of the 11th European Workshop on Structural Health Monitoring (EWSHM 2024), Potsdam, Germany, 10–13 June 2024. [Google Scholar]
  36. Zhu, X.; Hang, X.; Gao, X.; Yang, X.; Xu, Z.; Wang, Y.; Liu, H. Research on Crack Detection Method of Wind Turbine Blade Based on a Deep Learning Method. Appl. Energy 2022, 328, 120241. [Google Scholar] [CrossRef]
  37. Xu, D.; Wen, C.; Liu, J. Wind Turbine Blade Surface Inspection Based on Deep Learning and UAV-Taken Images. J. Renew. Sustain. Energy 2019, 11, 053305. [Google Scholar] [CrossRef]
  38. Lee, N.; Woo, J.; Kim, S. A Deep Reinforcement Learning Ensemble for Maintenance Scheduling in Offshore Wind Farms. Appl. Energy 2025, 377, 124431. [Google Scholar] [CrossRef]
  39. Dervilis, N.; Choi, M.; Taylor, S.G.; Barthorpe, R.J.; Park, G.; Farrar, C.R.; Worden, K. On Damage Diagnosis for a Wind Turbine Blade Using Pattern Recognition. J. Sound Vib. 2014, 333, 1833–1850. [Google Scholar] [CrossRef]
  40. Calderano, P.; De Marins, D.B.; Ayala, H. A Comparison of Feature Extraction Methods for Crack and Ice Monitoring in Wind Turbine Blades: System Identification and Matrix Decomposition. In Proceedings of the 2022 30th Mediterranean Conference on Control and Automation (MED), Vouliagmeni, Greece, 28 June–1 July 2022; pp. 779–784. [Google Scholar] [CrossRef]
  41. Rizos, P.; Aspragathos, N.; Dimarogonas, A. Identification of crack location and magnitude in a cantilever beam from the vibration modes. J. Sound Vib. 1990, 138, 381–388. [Google Scholar] [CrossRef]
  42. Saurabh, U.S.; Santosh, J.C.; Nilaj, N.D. Effect of crack on natural frequency for beam type of structures. AIP Conf. Proc. 2017, 1859, 020056. [Google Scholar] [CrossRef]
  43. Pooja, D.M.; Aditya, A.Y.; Anamika, M.P.; Venkatesh, A.K. Comparative analysis of natural frequency for cantilever beam through analytical and software approach. Int. Res. J. Eng. Technol. 2018, 5, 656–671. [Google Scholar]
  44. De Felice, A.; Sorrentino, S. Effects of anisotropic supports on the stability of parametrically excited slender rotors. Nonlinear Dyn. 2022, 109, 793–813. [Google Scholar] [CrossRef]
  45. Nyquist, H. Certain Topics in Telegraph Transmission Theory. Trans. Am. Inst. Electr. Eng. 1928, 47, 617–644. [Google Scholar] [CrossRef]
Figure 1. Overview of the proposed vibration signal and SVM framework for crack location in WTBs.
Vibration 08 00020 g001
Figure 2. Structure of a multiclass confusion matrix.
Vibration 08 00020 g002
Figure 3. Block diagram of the experimental configuration.
Vibration 08 00020 g003
Figure 4. (a) Experimental configuration and (b) sensor unit.
Vibration 08 00020 g004
Figure 5. Conditions of the WTB: (a) healthy blade and (b) blades with cracks.
Vibration 08 00020 g005
Figure 6. Time series of 0.4 s of the measured vibration signals with a (a) healthy WTB, (b) crack on the tip, (c) crack in the midsection, and (d) crack in the root.
Vibration 08 00020 g006
Figure 7. Spectral response of 0.4 s of the measured vibration signal with a (a) healthy WTB, (b) crack on the tip, (c) crack in the midsection, and (d) crack in the root.
Vibration 08 00020 g007
Figure 8. Time series of 120 s of the measured vibration signals with a (a) healthy WTB, (b) crack on the tip, (c) crack in the midsection, and (d) crack in the root.
Vibration 08 00020 g008
Figure 9. Multiclass confusion matrix for the SVM model.
Vibration 08 00020 g009
Figure 10. Performance comparison of the average results of the different models.
Vibration 08 00020 g010
Table 3. Class label for each WTB condition.
WTB ConditionClass Label
HealthyH
Crack in tipCT
Crack in midsectionCM
Crack in rootCR
Table 4. Performance comparison of all models.
WTB
Condition
SVMKNNDT
Acc
(%)
Rec
(%)
F1
(%)
Prec
(%)
Spec
(%)
Acc
(%)
Rec
(%)
F1
(%)
Prec
(%)
Spec
(%)
Acc
(%)
Rec
(%)
F1
(%)
Prec
(%)
Spec
(%)
CR10010010010010088.7188.6587.4487.7688.9898.5798.6698.9197.3496.43
CM98.7596.6697.4798.3099.4487.6788.5486.6387.9086.3095.4296.6695.3796.7895.24
CT99.5898.3399.1510010088.7689.6689.5688.8089.0598.5397.2396.7795.4596.45
H99.1610098.3596.7798.8889.5090.0191.4590.0088.5698.7398.8896.5696.7996.90
Disclaimer/Publisher’s Note: The statements, opinions and data contained in all publications are solely those of the individual author(s) and contributor(s) and not of MDPI and/or the editor(s). MDPI and/or the editor(s) disclaim responsibility for any injury to people or property resulting from any ideas, methods, instructions or products referred to in the content.

