
On the Energy Budget of Quarks and Hadrons, Their Inconspicuous “Strong Charge”, and the Impact of Coulomb Repulsion on the Charged Ground States


Abstract
1. Introduction
- On the other hand, represents the fraction of the total energy that binds each individual valence quark in a particle (see Section 2.2 for details). In particles representing excitations and resonances, these energies are not sufficient to maintain the binding; thus, such particles undergo decays on very short timescales [1,2,3,5].
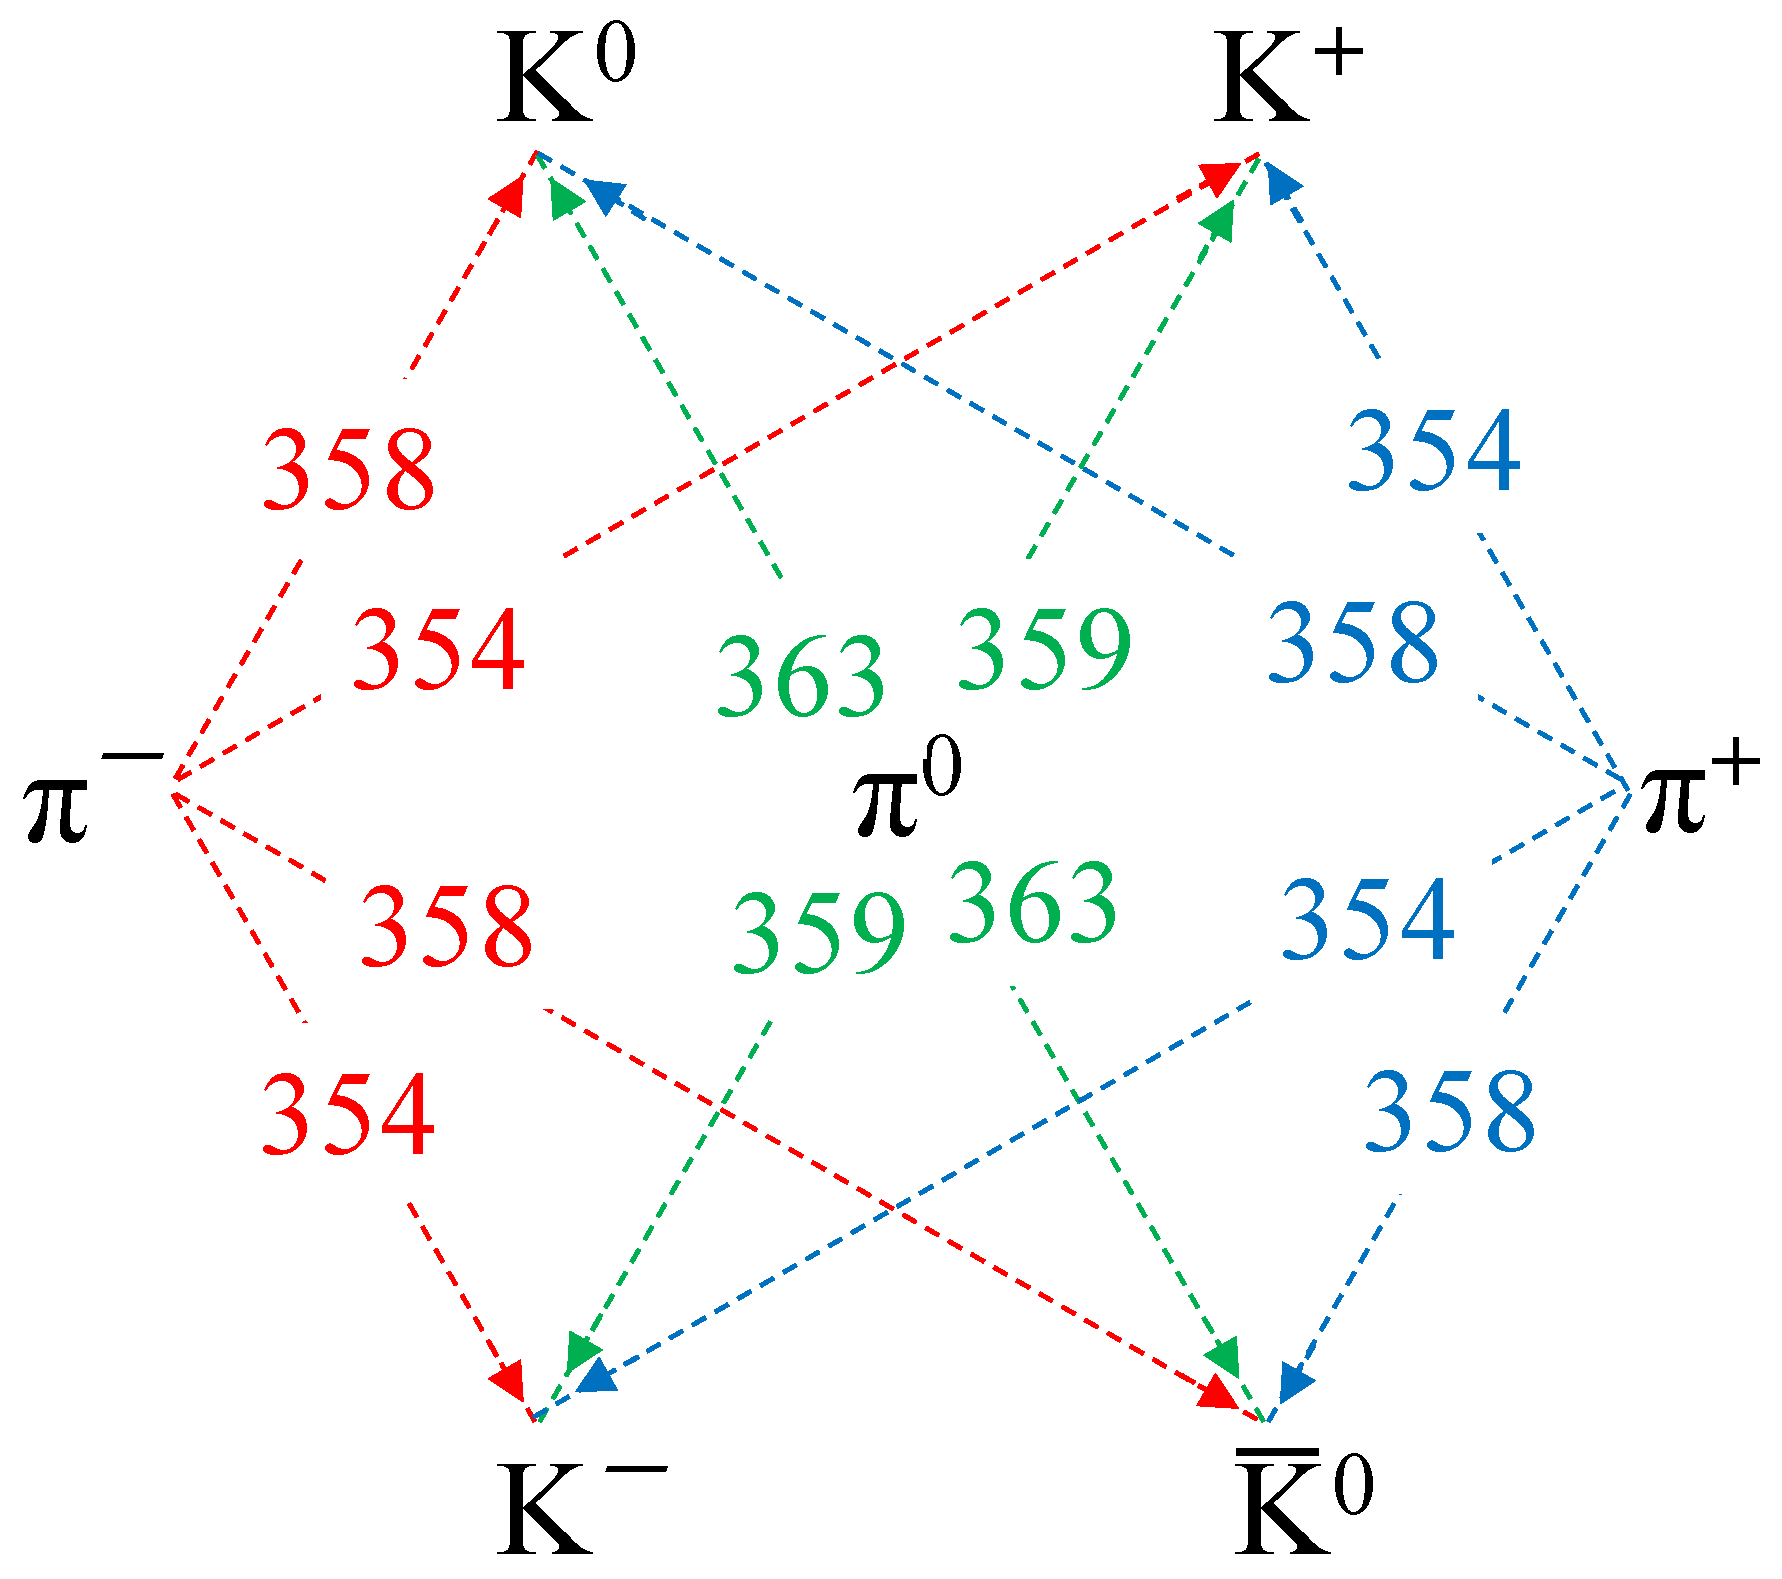
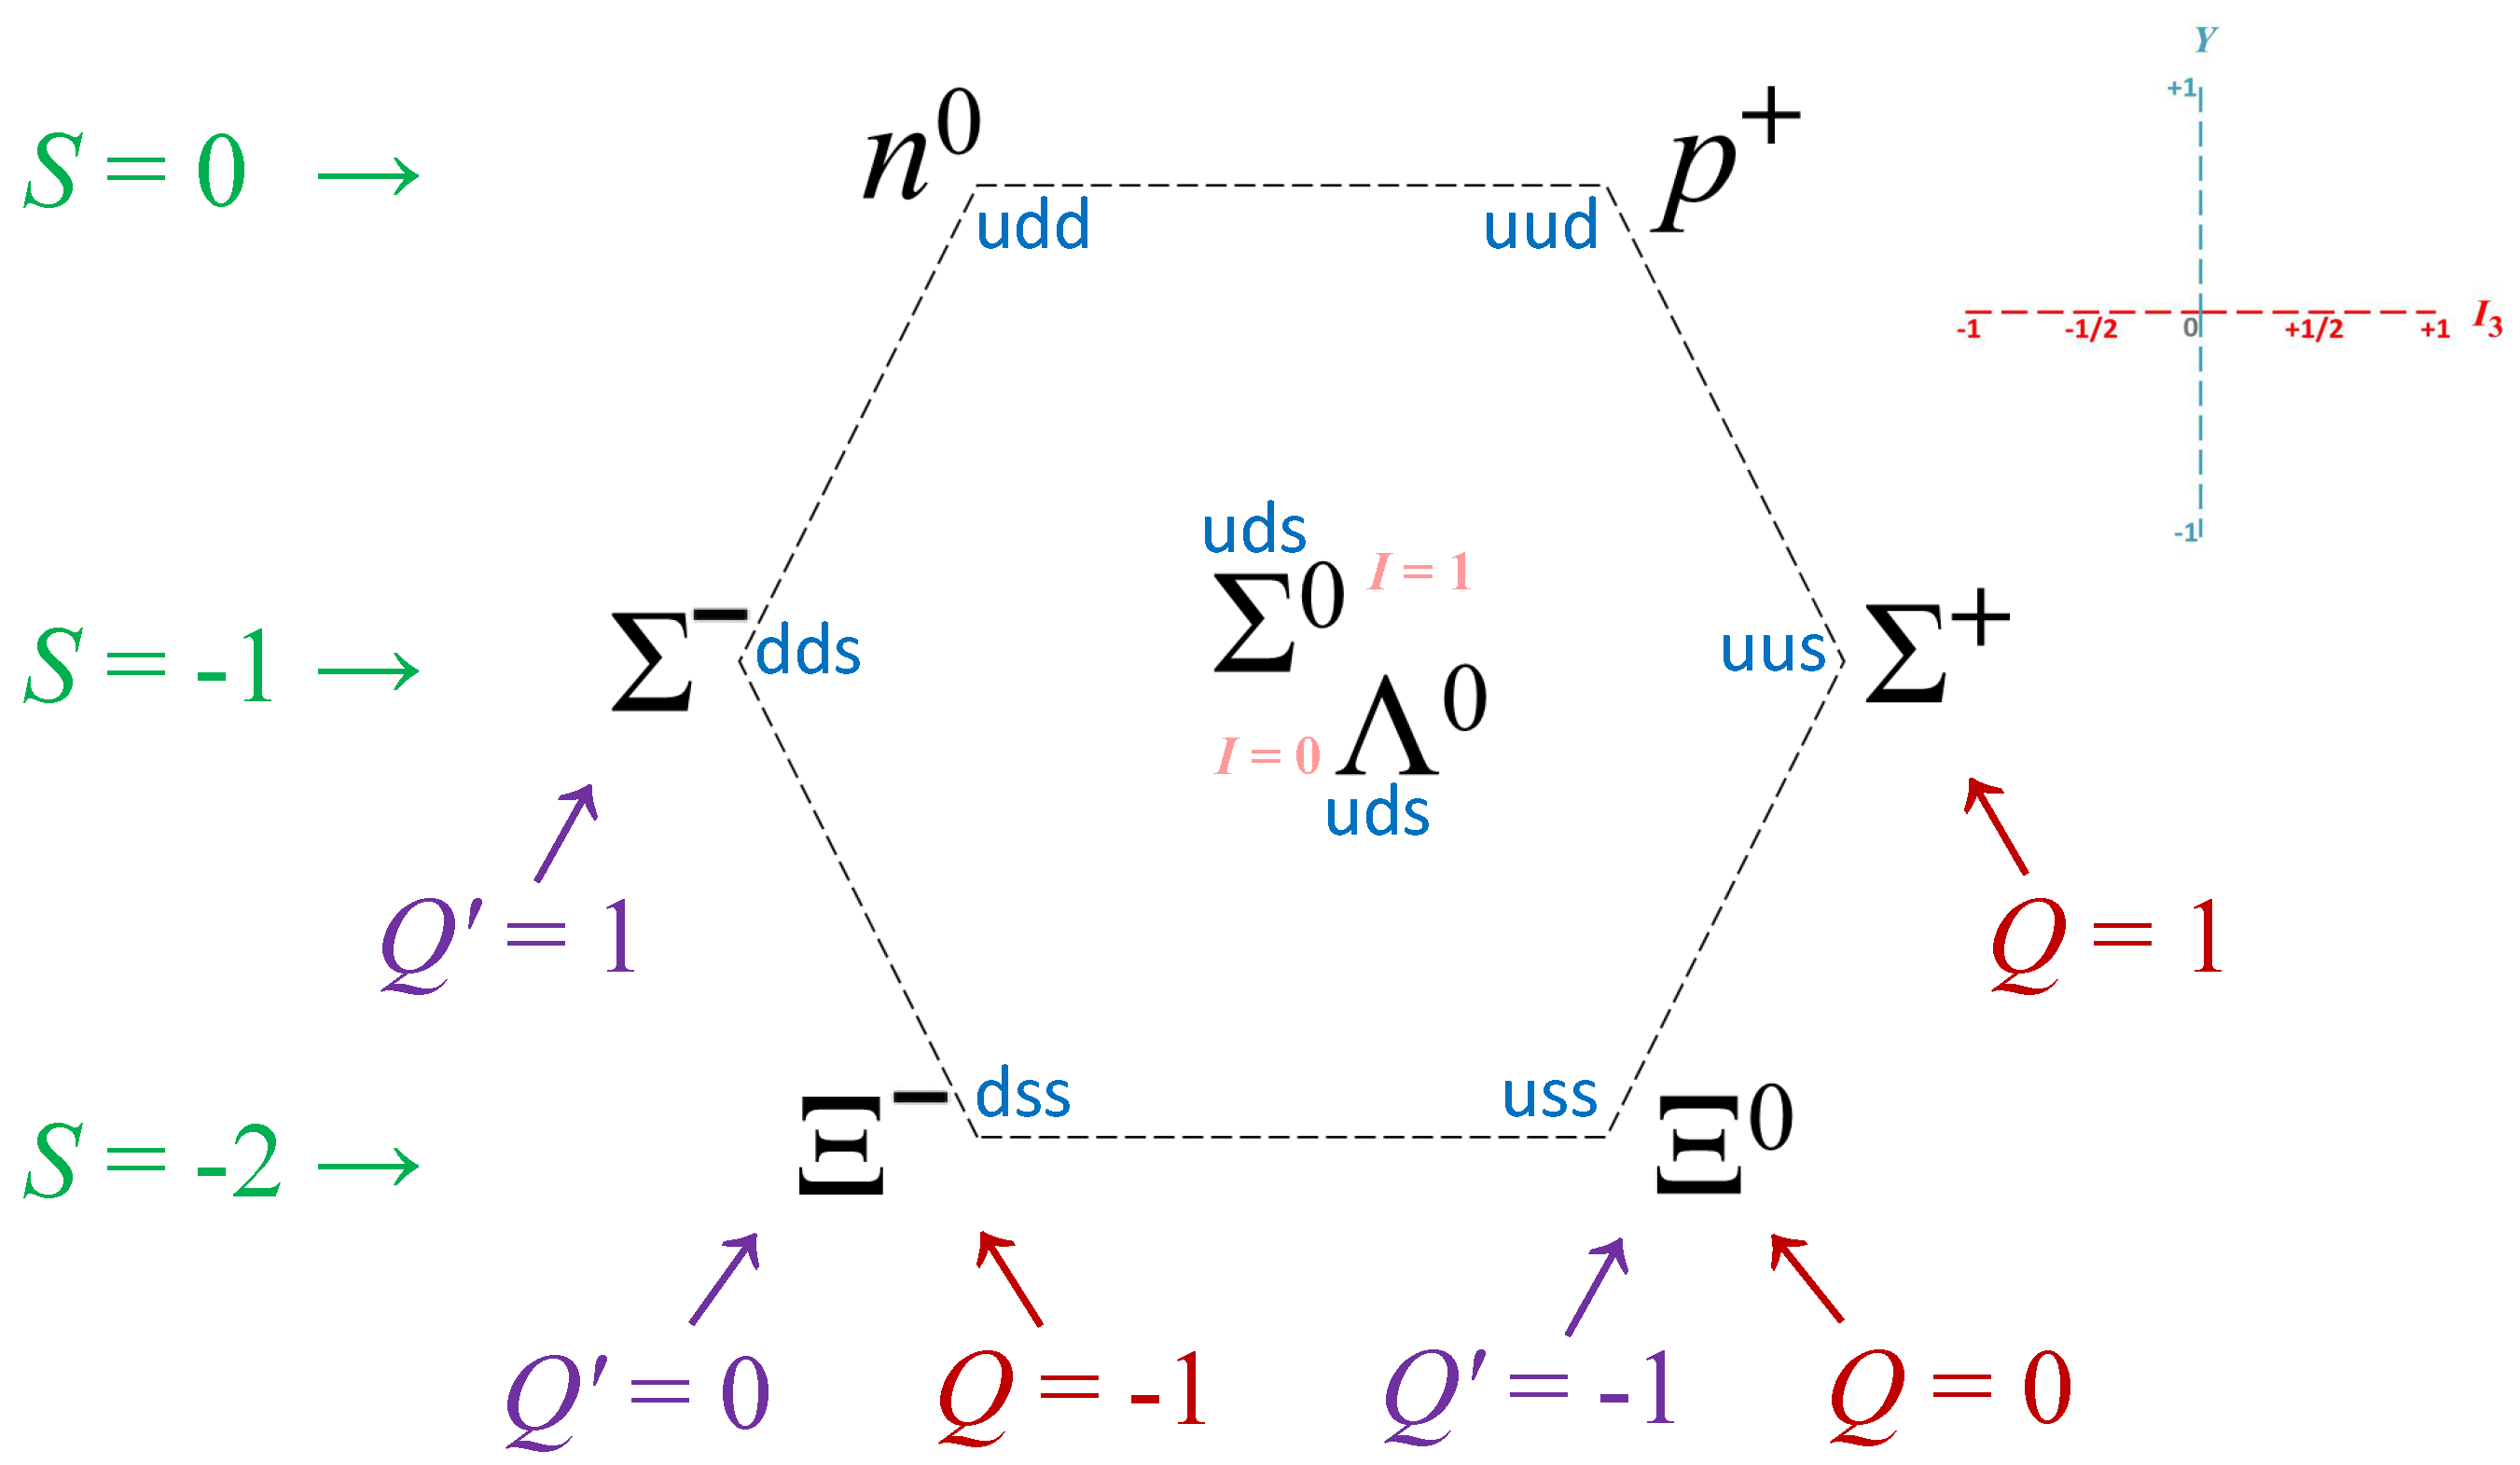
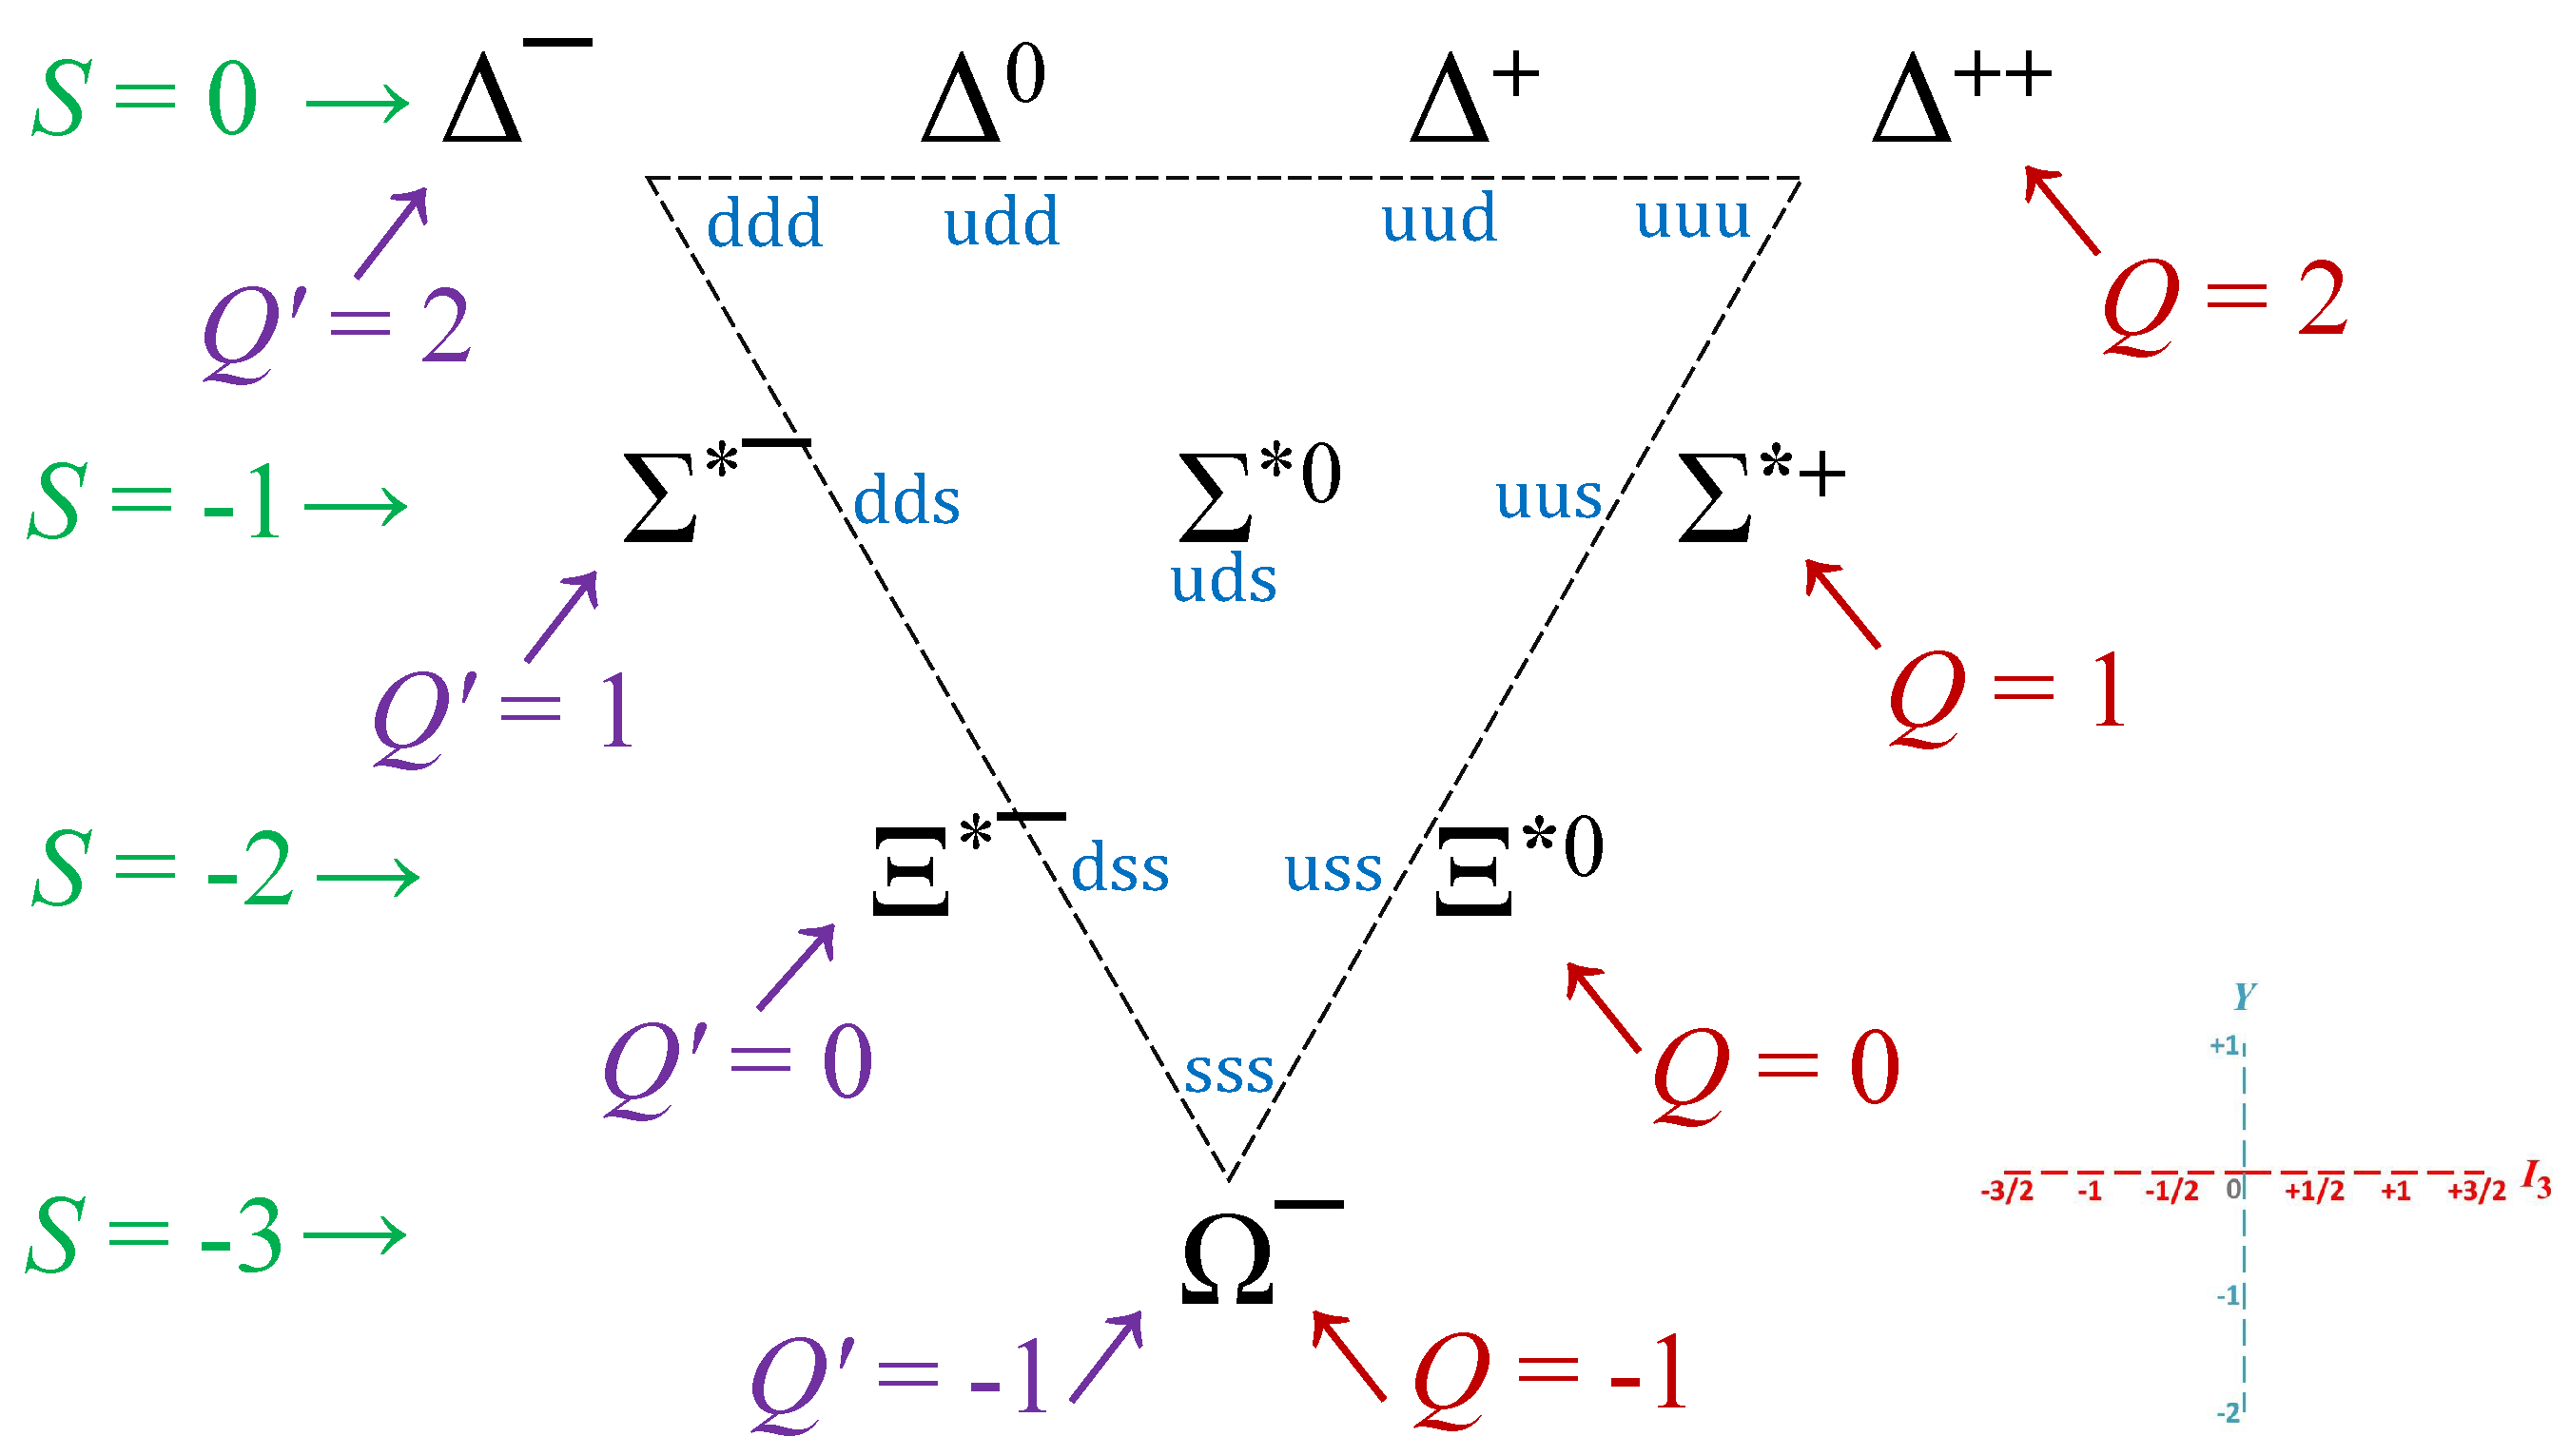
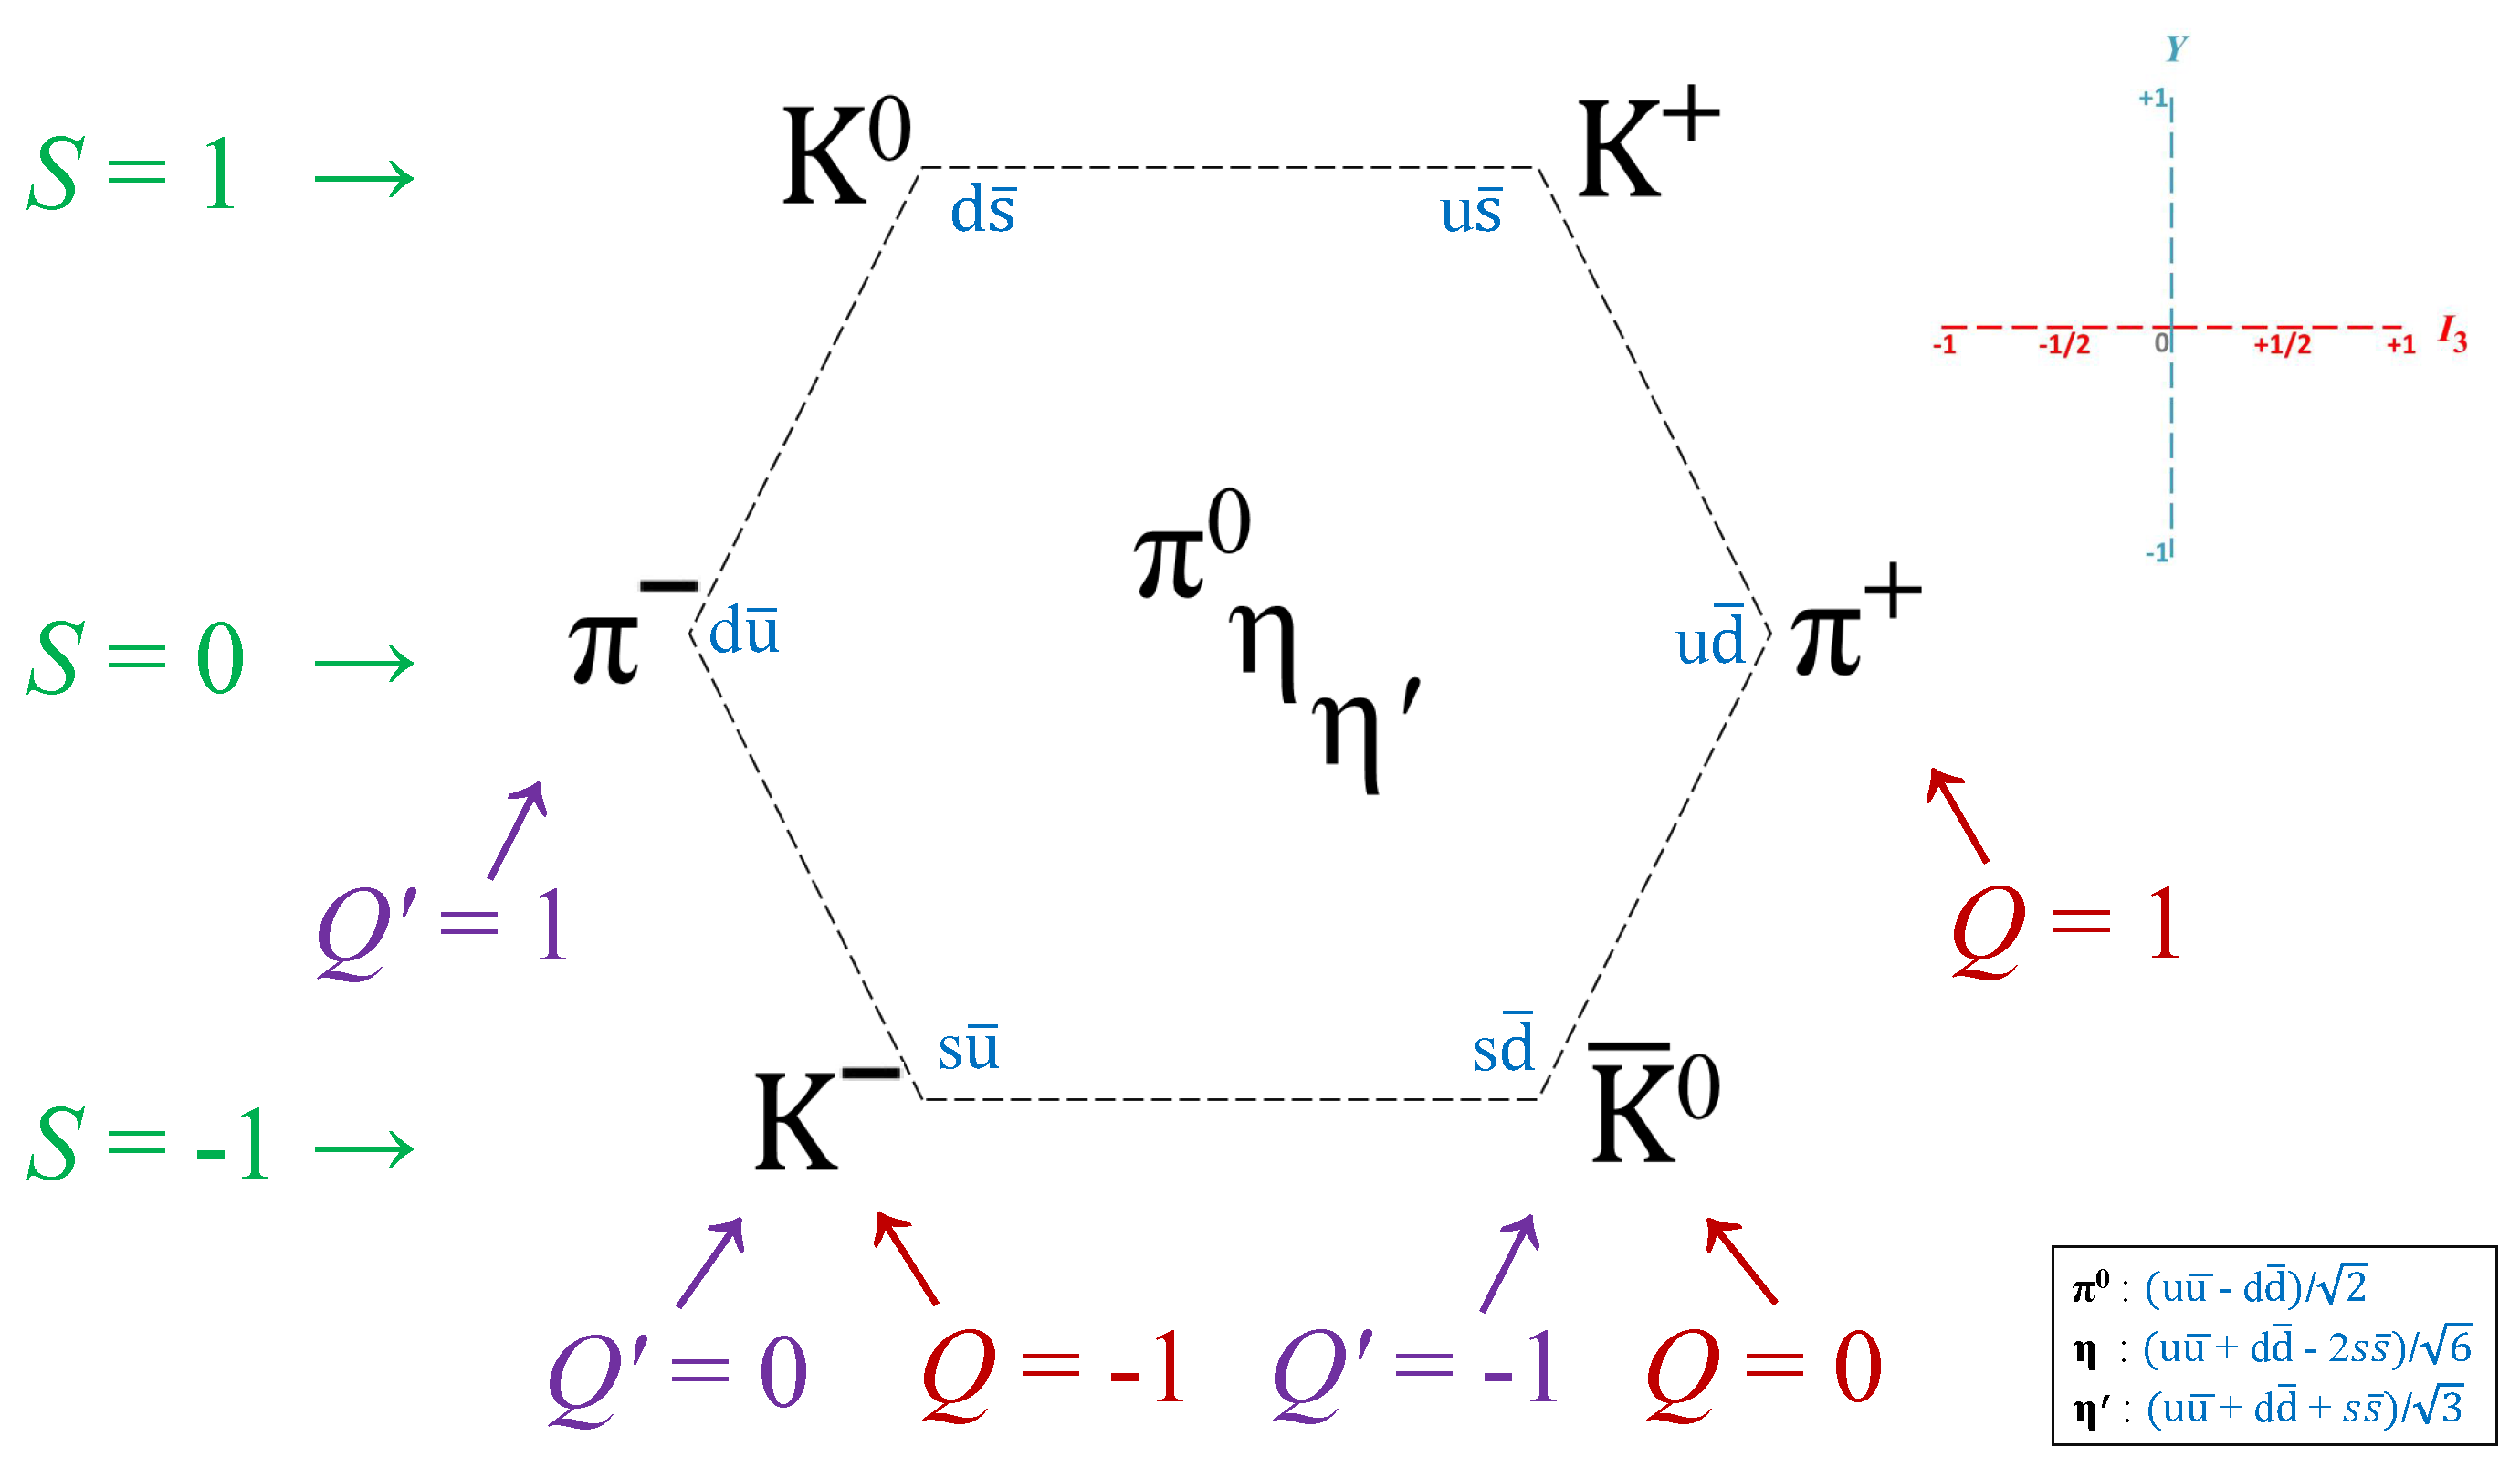
- The strong charge () is the missing quantum number needed to complete the weight diagrams of the SM, as shown in Figure 1, Figure 2 and Figure 3 below. It is instrumental in deconstructing, for the first time, the hypercharge Y into an EM (Q) and a “strong” () component (i.e., ; see Section 4 for details).
2. Particle Rest Masses, Mass Deficits, and Their Binding Factors
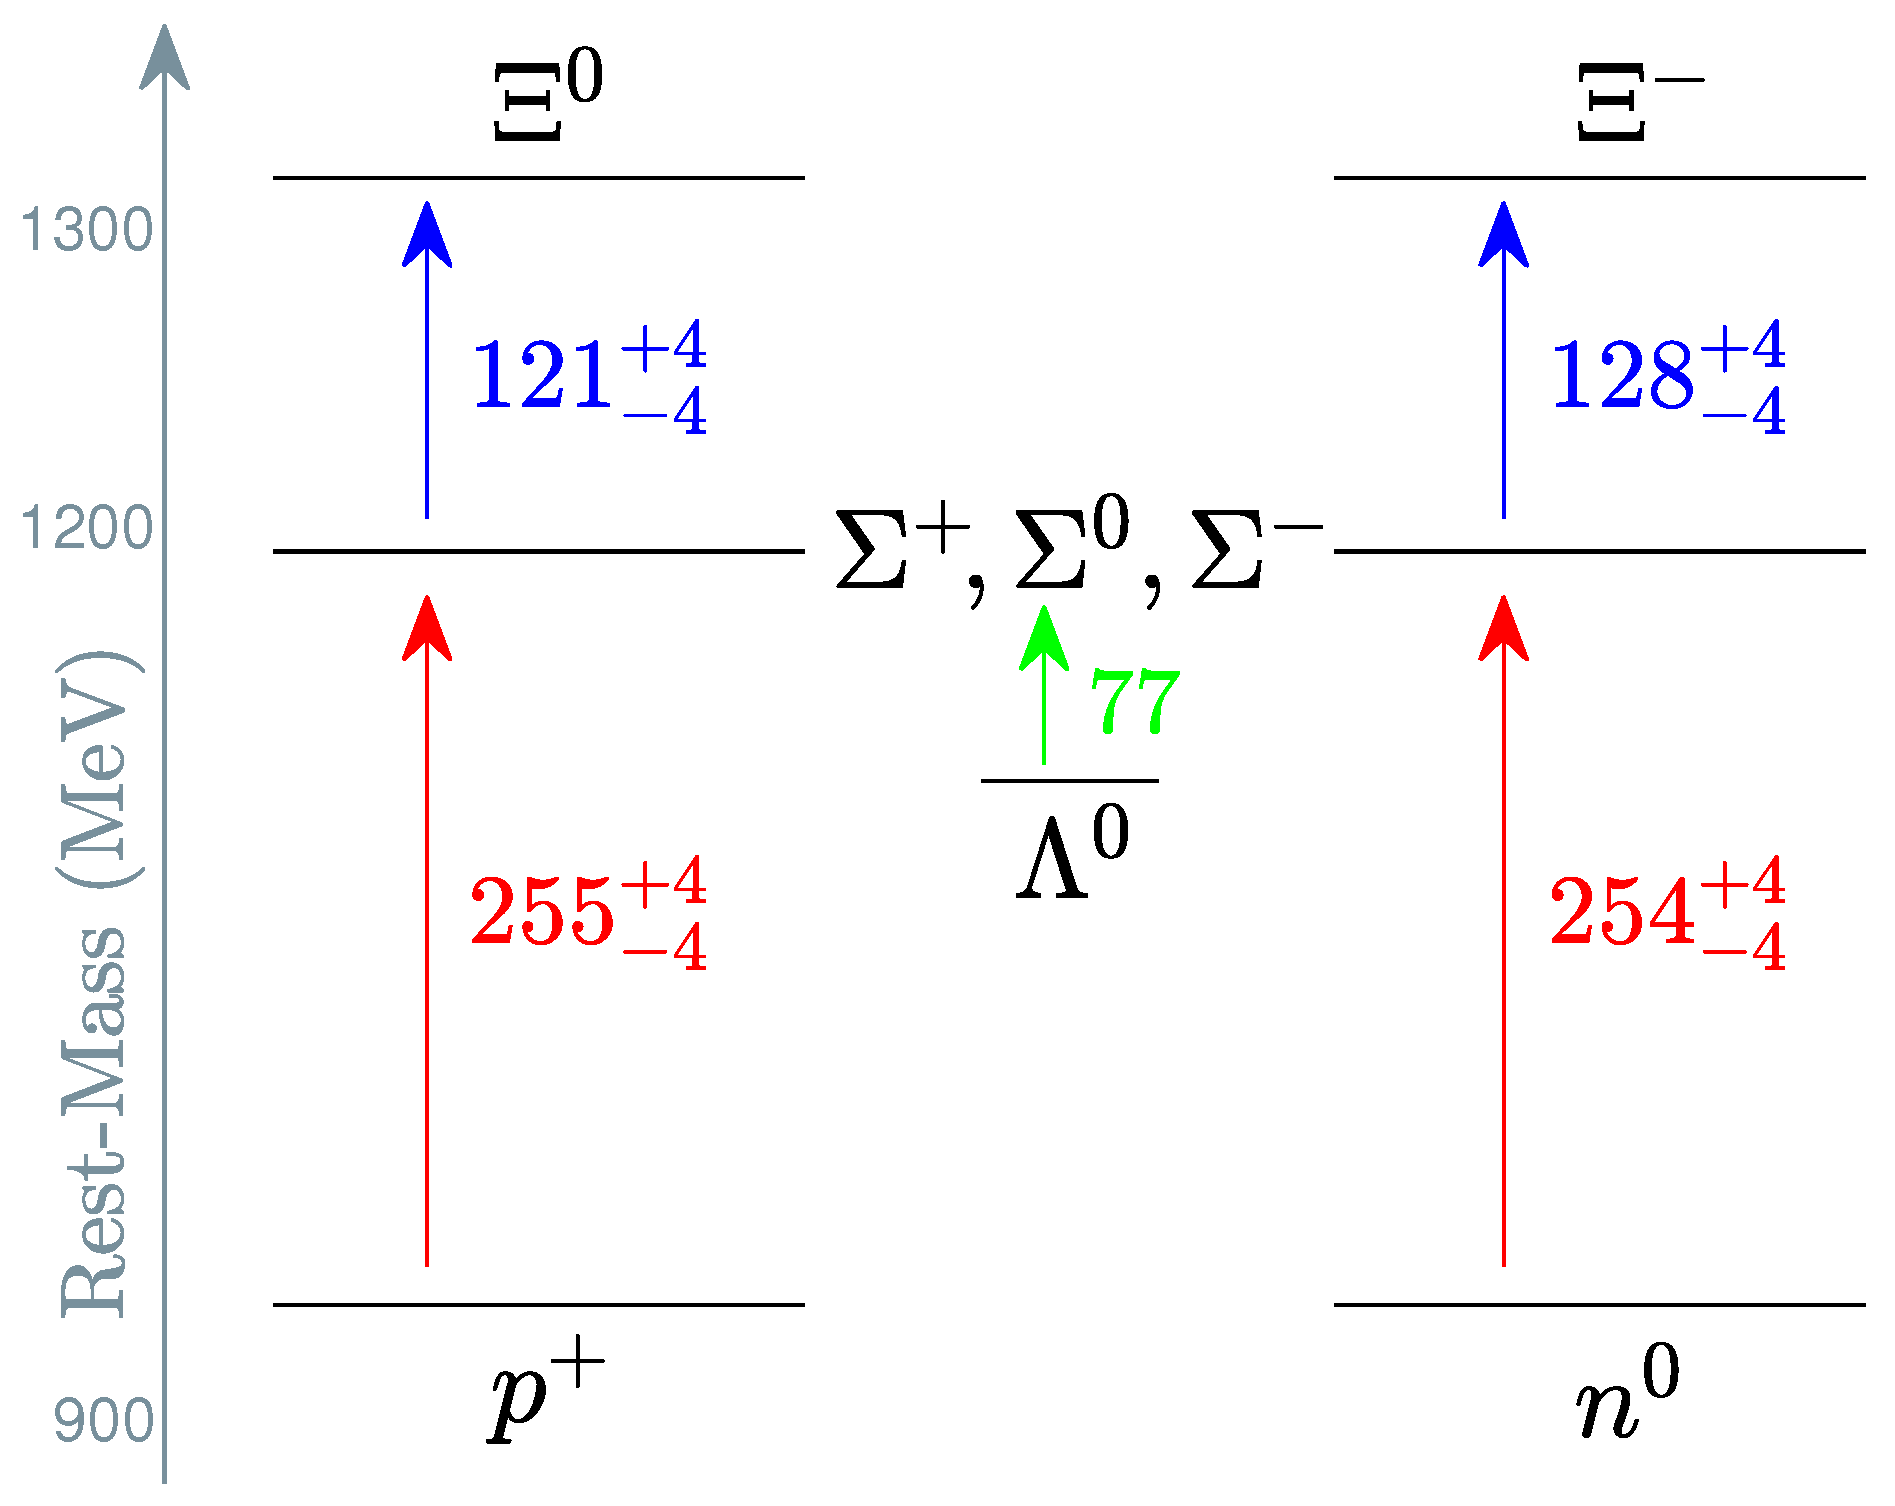
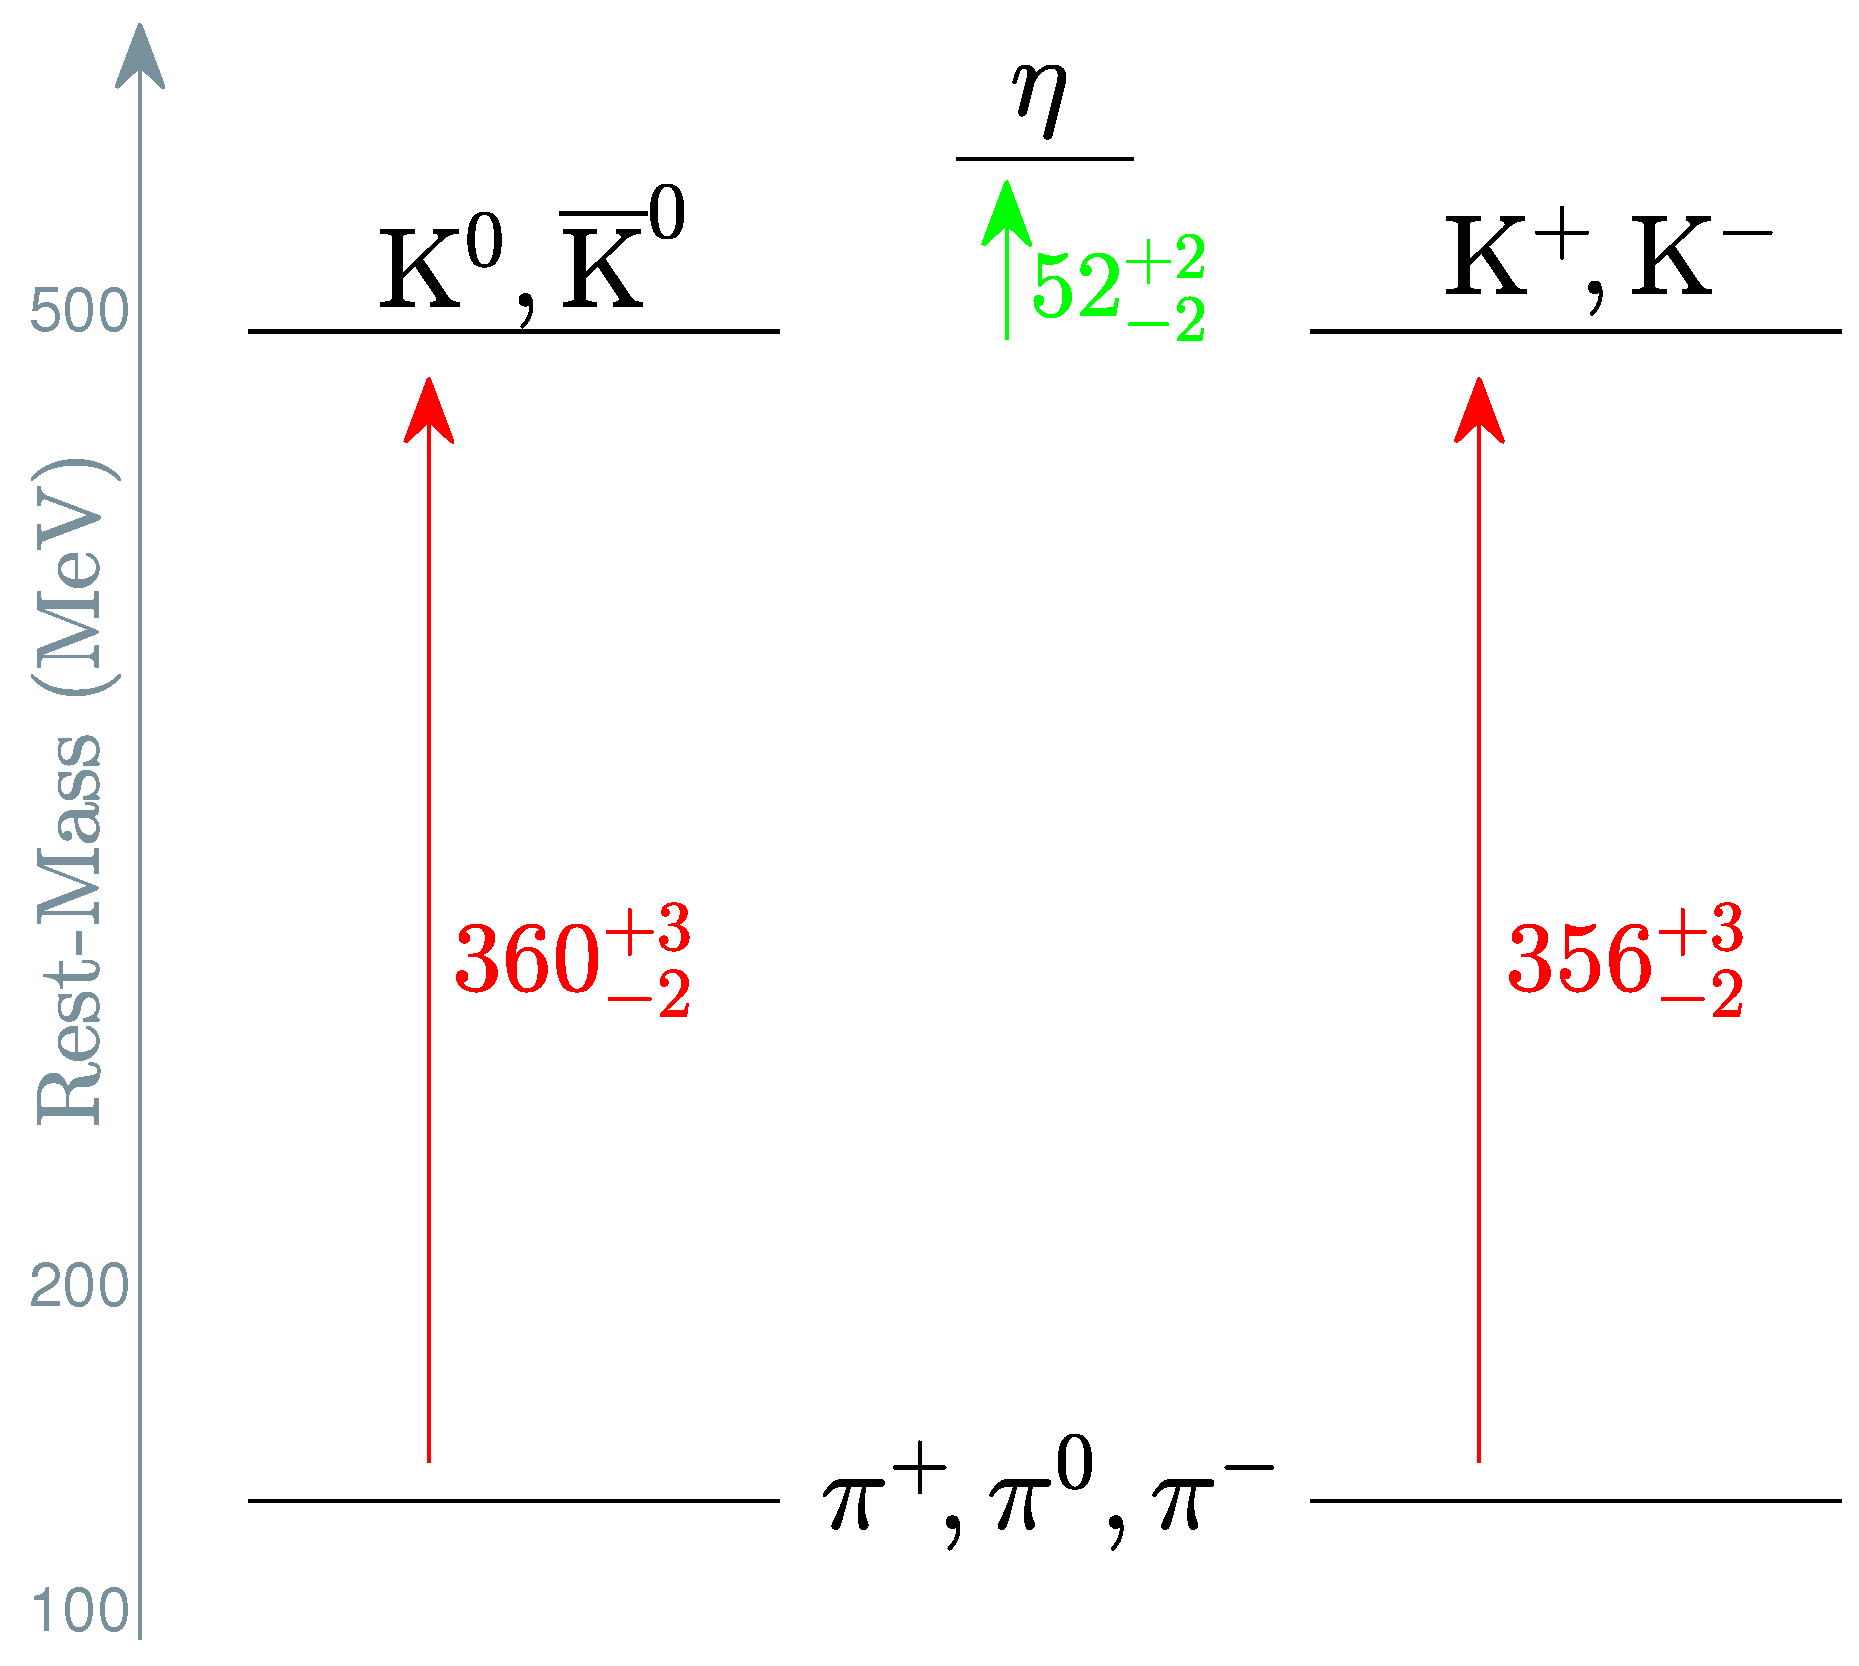
2.1. Rest Mass Jumps between Particle Groups
- (1)
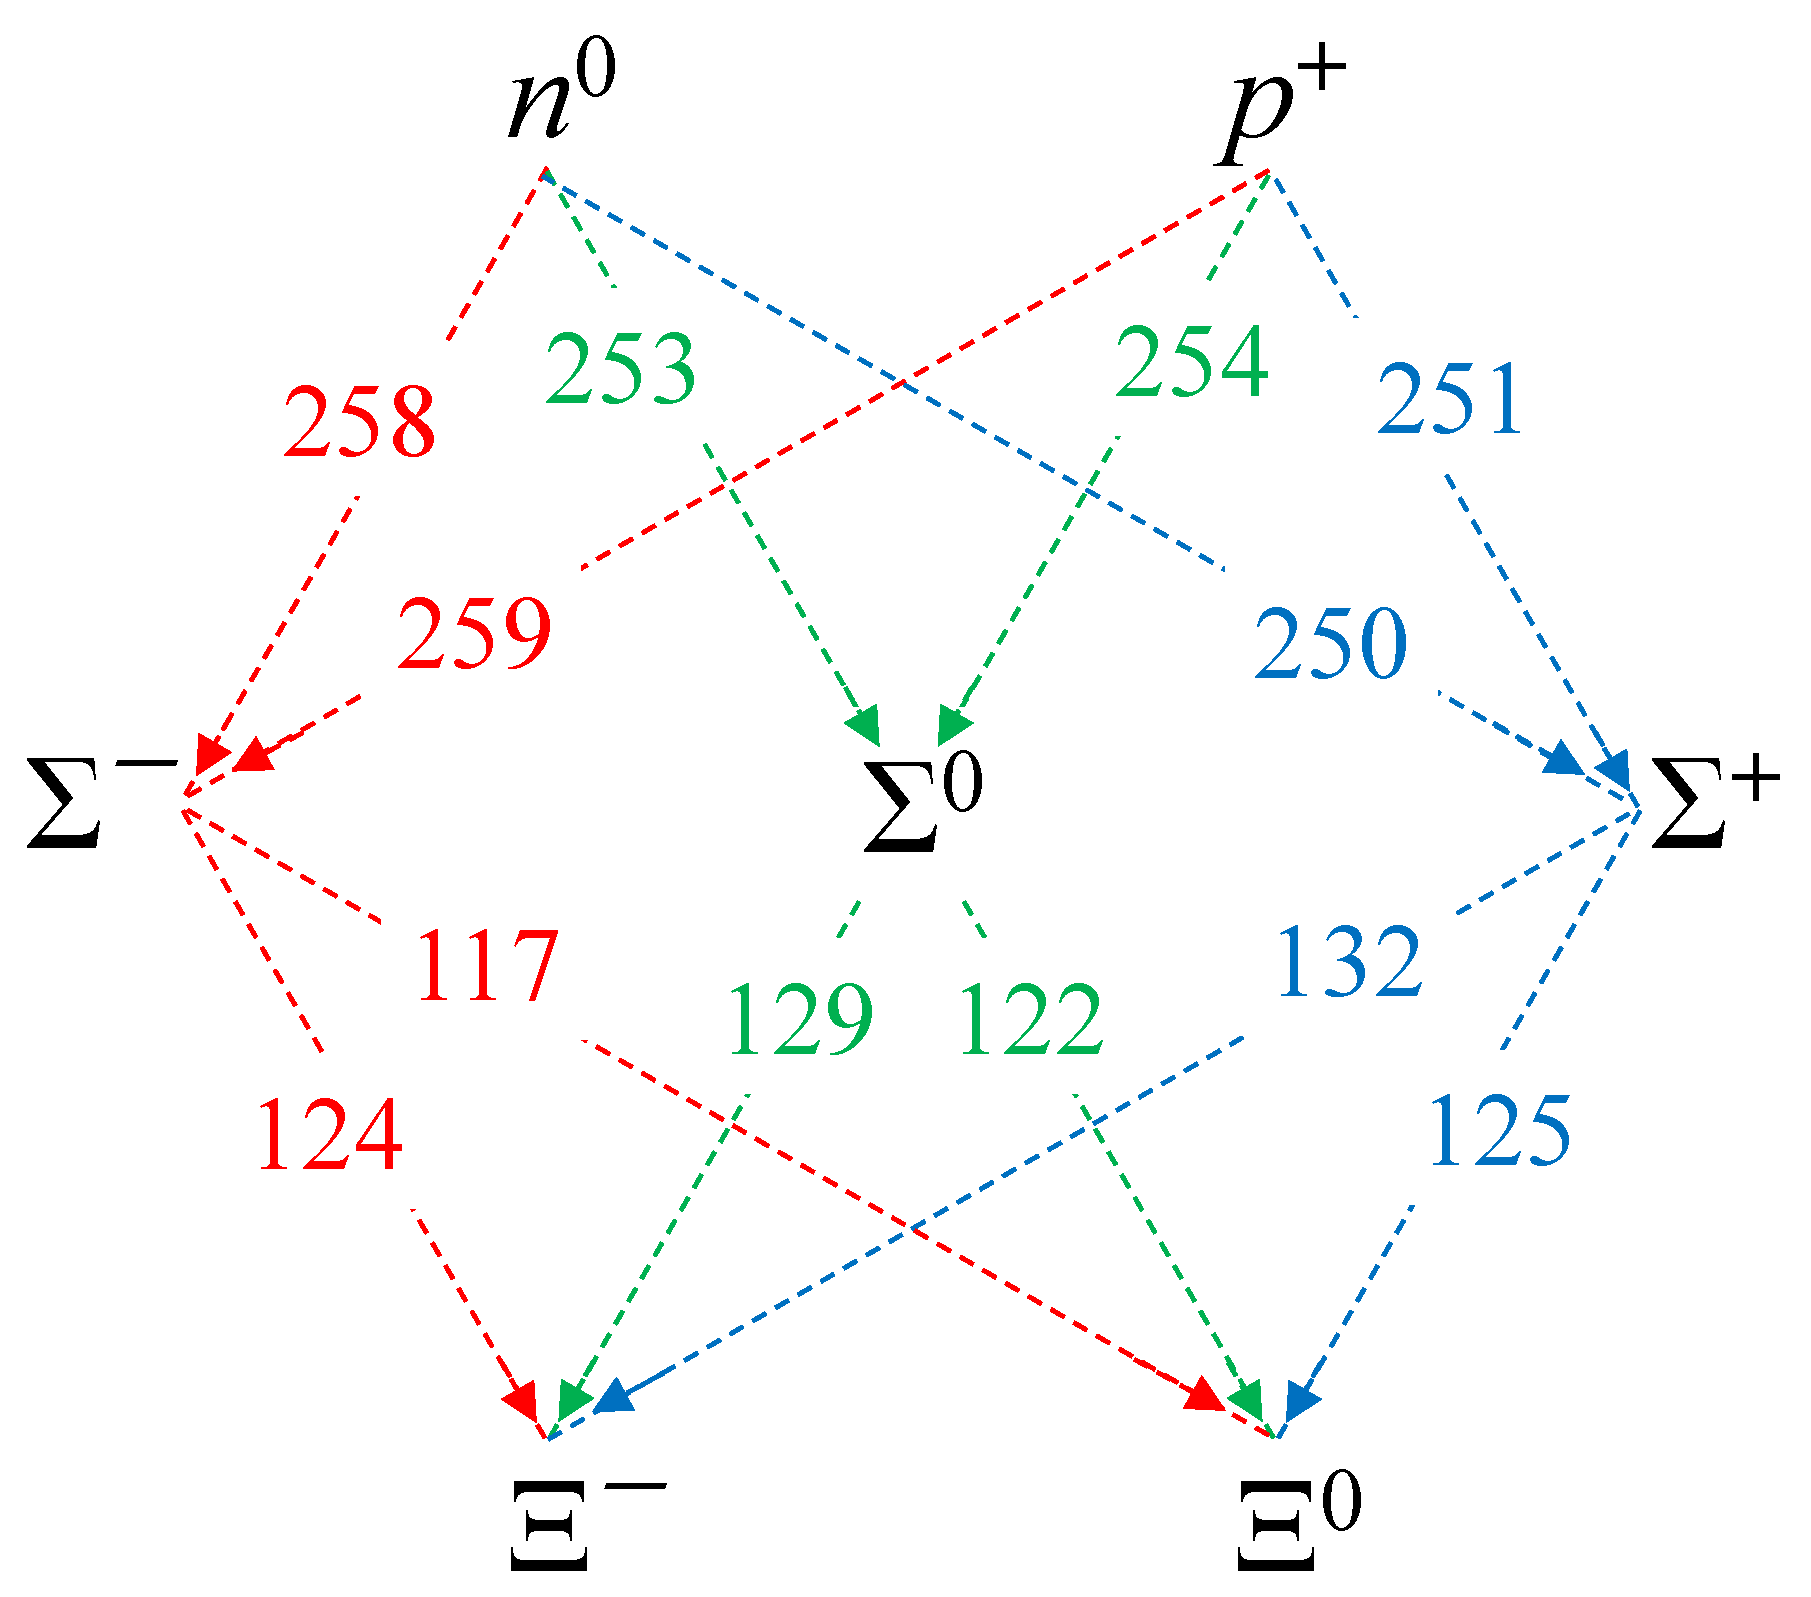
- baryons: 256 MeV and 128 MeV (Figure 4 and Figure A1), although the smaller 121 MeV jump to deviates from the rule for unknown reasons; also, the decay () always emits a 77 MeV photon (), an important result that allows us to investigate the isospin content of baryons in Appendix B.
- (2)
- (3)
- (4)
- vector mesons : 120 MeV in both jumps (see Table 4).

2.2. Mass Deficits and Binding Factors
3. Coulomb-Repulsion Origin of Mass-Deficit Differences in Nucleons and Pions
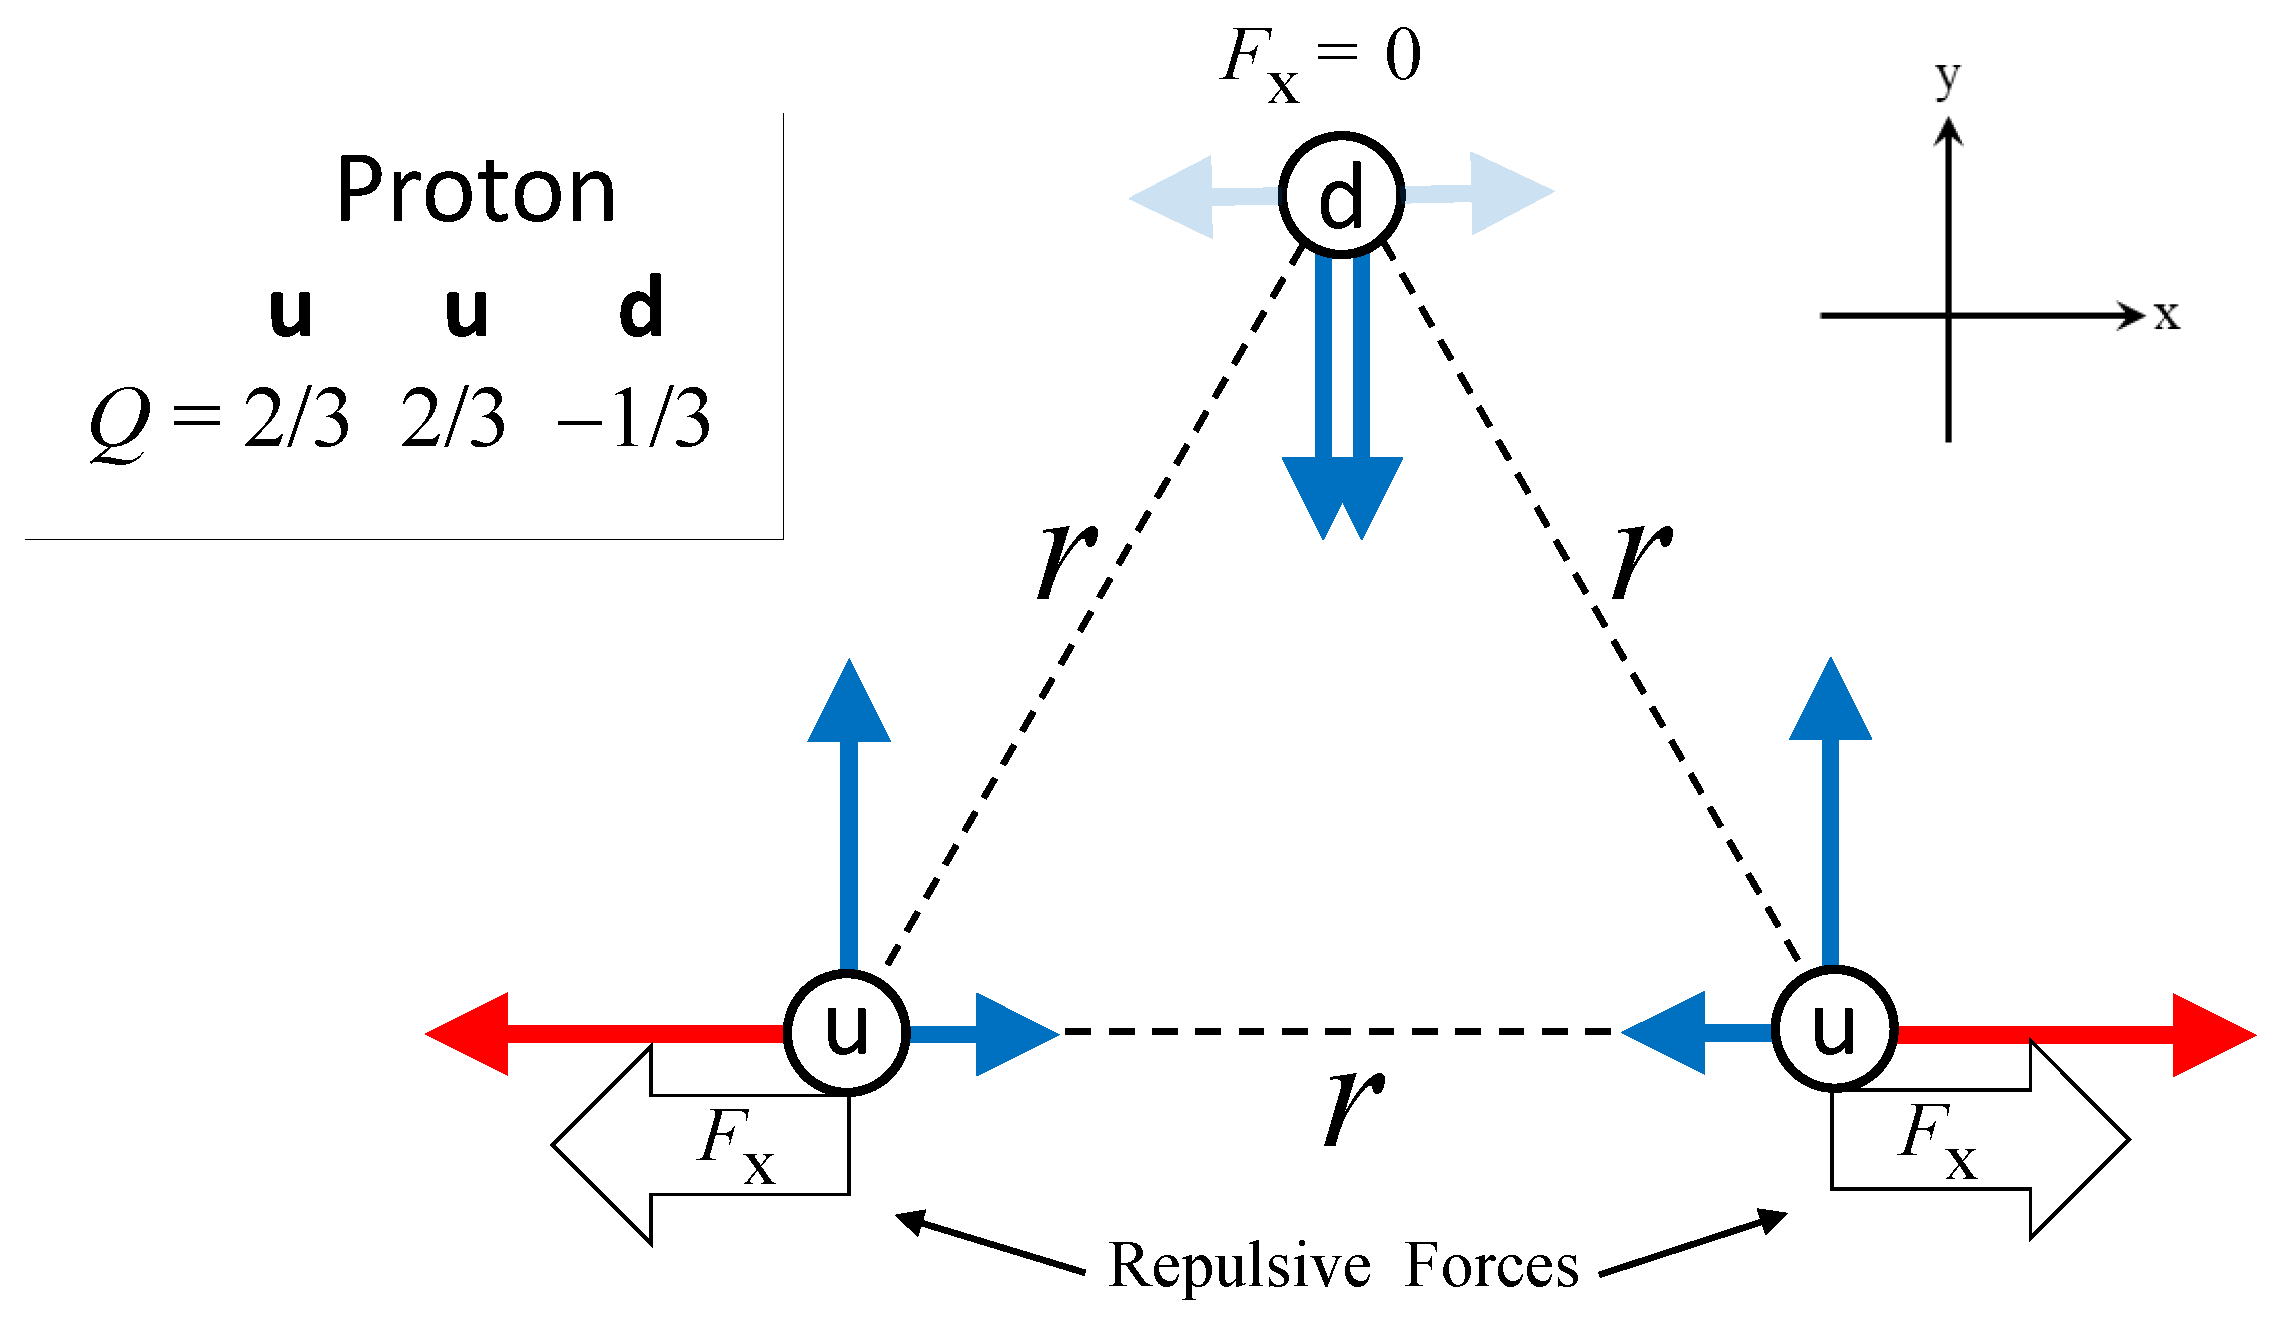
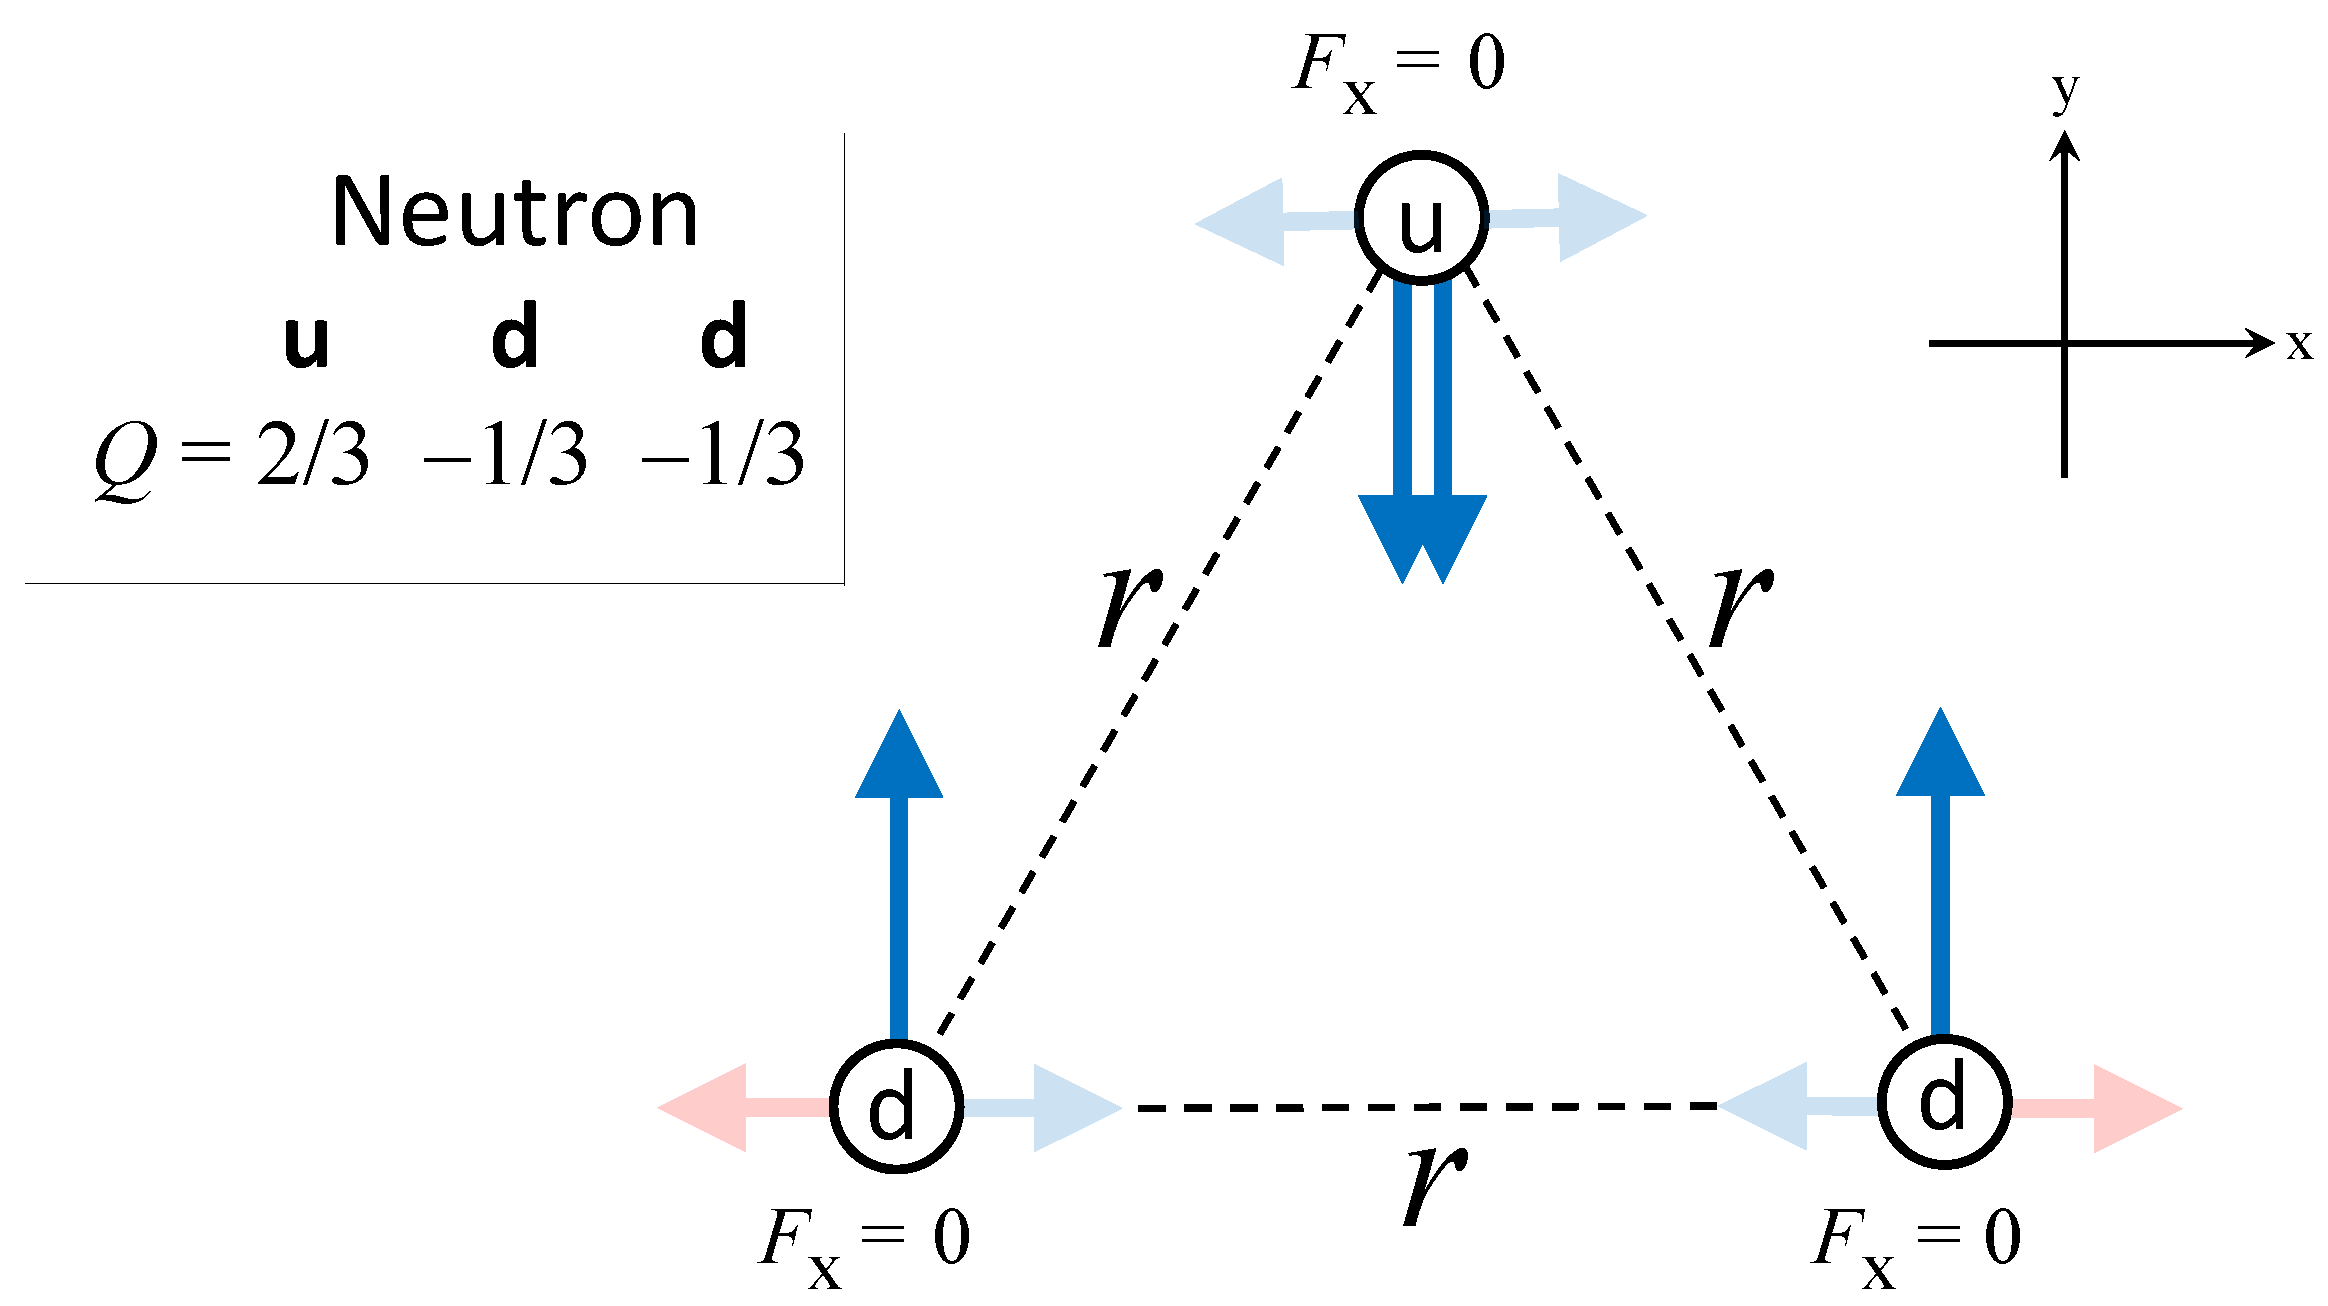
3.1. Nucleons
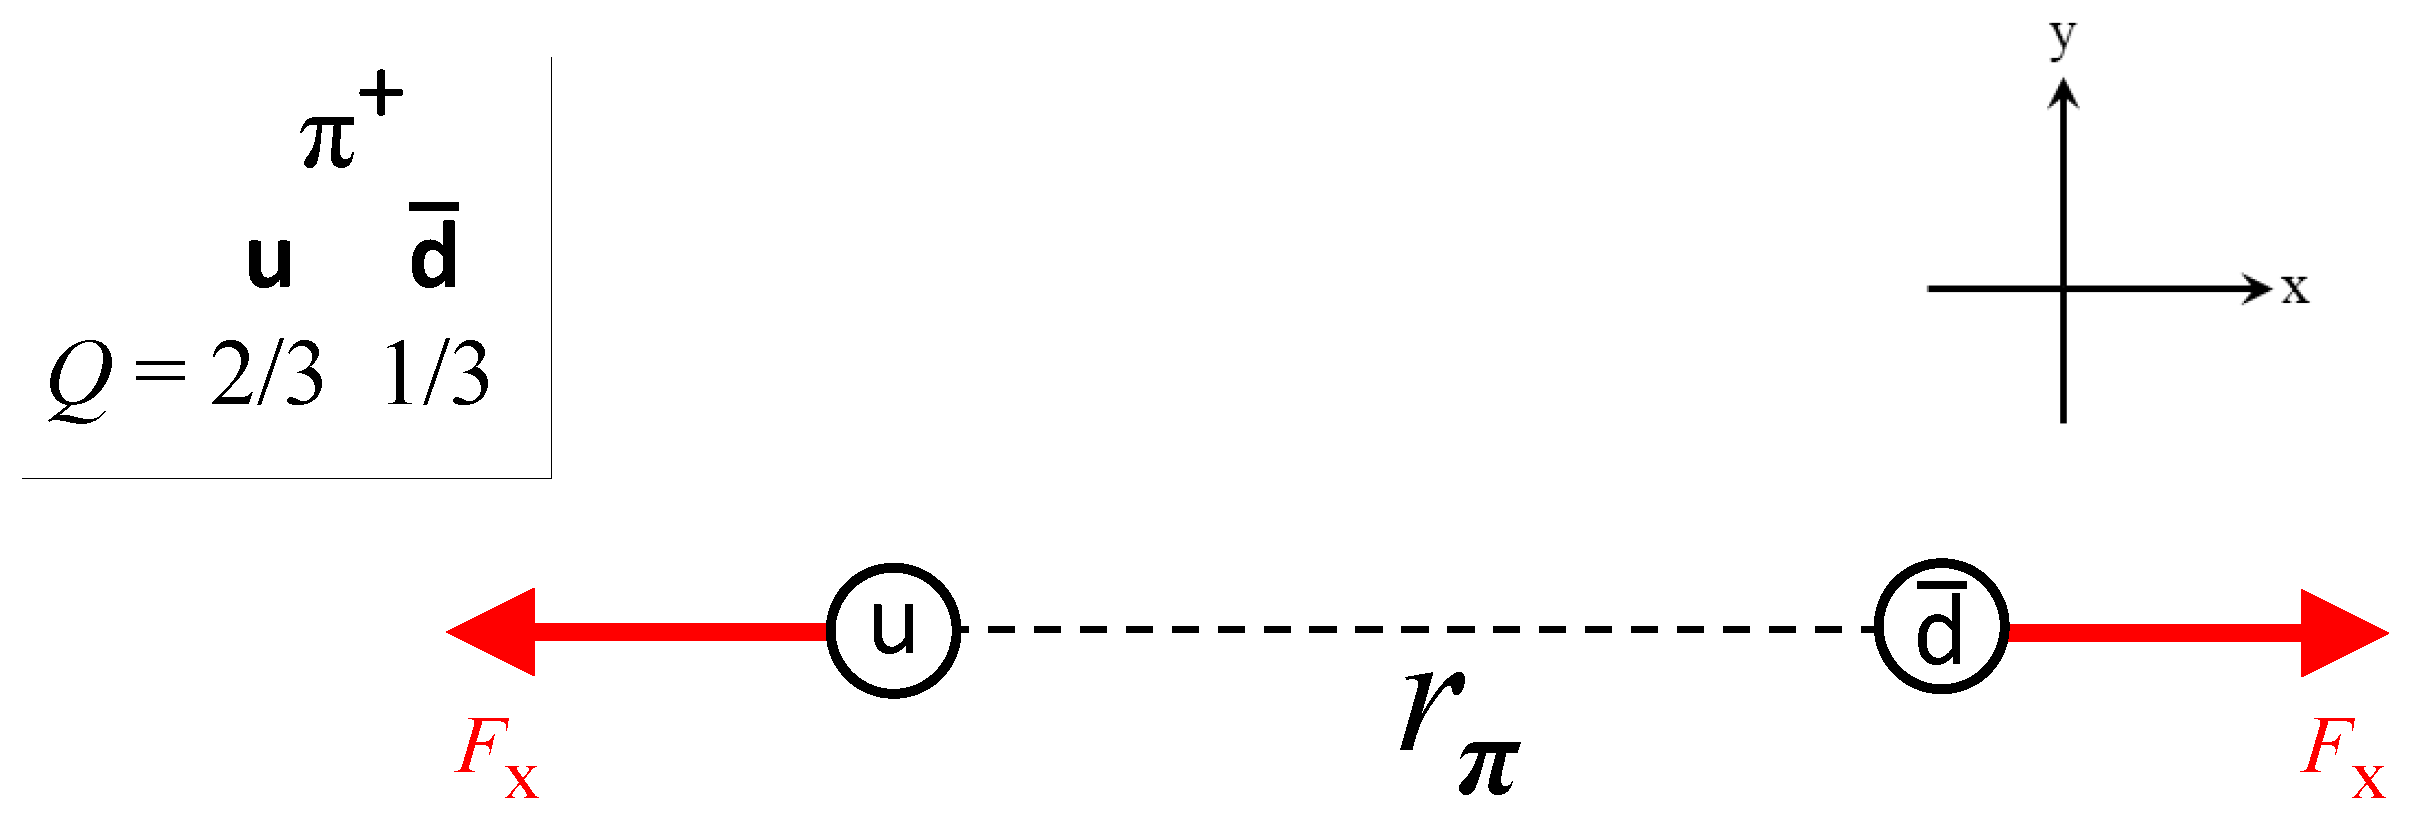
3.2. Pions
3.3. and Baryons
4. The Inconspicuous Strong Charge ()
- (a)
- In some kaon decays, and can produce three pions via the reactions of and , respectively [1,2]. The only quantum number that differentiates charged from neutral kaon decays is , which switches from and from , respectively (see Table 4). No other quantum number can capture such oppositely directed transitions in these two types of weak decays of the K triplet. We revisit kaon decays in Appendix B and Appendix C.
- (b)
- In quarks (Table 5), is the only quantum number (among EM, strong, and weak numbers) that exhibits a repetitive pattern with increasing quark mass in each generation. This is a notable property, especially since for the EM charge (Q), the pattern breaks down in the first-generation (u, d) quarks.
5. Strong/Em Decays Based on Conservation
5.1. Baryon Octet
5.2. Baryon Decuplet
5.3. Pseudoscalar Meson Nonet
5.4. Vector Meson Nonet
5.5. Summary of Table 6, Table 7, Table 8 and Table 9
- (1a)
- The baryon octet shows virtually no strong decays. Only (uds) decays via photon emission (pions are not produced), and the proton does not decay at all. All other decays are due to weak interactions, and they all characteristically produce pions or leptons (see top of Table 6).
- (1b)
- (2)
- (3a)
- In the meson group, the pions show strong/EM decays, but the kaons show only weak decays (Table 8). At higher energies, the D and B mesons show very few strong/EM decays.
- (3b)

| Decay | (s) | |
|---|---|---|
| The only strong/EM decay in the octet is | ||
| All other octet decays go to pions/leptons and are weak, e.g., | ||
| −1 | ||
| Notes: | ||
| Higher-energy states do show strong/EM decays, e.g., | ||
| −1 →−1 0 = −1 | ||
| −1 = 0 | ||
| but and are noted for not having strong/EM decays | ||
| −1 0 = −1 | ||
| 0→ −1 0 −1 = −2 | ||
| and is noted for also having some weak decays, e.g., | ||
| 1 1 = 2 | ||
| or with a emitted in place of (then, ). | ||
| Decay | (s) | |
|---|---|---|
| All decuplet decays are strong/EM, e.g., | ||
| −1→ 0 −1 = −1 | ||
| 2→ 1 1 = 2 | ||
| 1→ 0 1 = 1 | ||
| −1→ 0 −1 = −1 | ||
| −1→−1 0 = −1 | ||
| except for (which is quite long-lived), e.g., | ||
| −1→ 0 0 = 0 | ||
| Notes: | ||
| All higher-energy states also show strong/EM decays, e.g., | ||
| 1 1 = 2 | ||
| −1 → 0 −1 = −1 | ||
| 0 1 = 1 | ||
| −1 → 0 −1 = −1 | ||
| 0 0 = 0 | Unknown | |
| Decay | (s) | |
|---|---|---|
| Some pion decays and the decays are strong/EM, e.g., | ||
| −1 0 1 = 0 | ||
| −1 1 0 = 0 | ||
| 0 0 = 0 | ||
| Kaon decays are weak, e.g., | ||
| −1 0 = −1 | ||
| 0 0 0 = 0 | ||
| Notes: | ||
| Higher-energy states (D and B mesons) show but a few strong/EM decays, viz., | ||
| 1 −1 = 0 | ||
| 1 −1 = 0 | ||
| 0 −1 1 = 0 | ||
| 1 0 = 1 | ||
| The famous production of [38,39] is strong, viz. | ||
| −1 0 1 = 0 | ||
| but subsequent decays are weak, i.e., () and ( = −1). | ||
| It is interesting that kaons are produced in strong decays but then decay only via the weak interaction. | ||
| Decay | (s) | |
|---|---|---|
| All nonet decays are strong/EM, e.g., | ||
| −1 →−1 0 = −1 | ||
| 1 → 1 0 = 1 | ||
| 0 → −1 1 = 0 | ||
| 0 → −1 0 1 = 0 | ||
| 0 → 0 0 = 0 | ||
| 0 → 1 −1 = 0 | ||
| 1 → 0 1 = 1 | ||
| Notes: | ||
| Higher-energy states ( and mesons) show strong/EM decays in almost all cases, e.g., | ||
| 1 −1 = 0 | ||
| Unknown | ||
| except for a striking exception, namely the weak decay | ||
| 0 0 = 0 | ||
| or with a photon emitted in place of . | ||
5.6. Electromagnetic versus Strong Decays
- (a)
- (b)
- Decays of the baryons are said to be strong [38], as they all conserve total isospin. But and each show two decay channels, so it becomes hard to argue that the strong force somehow cannot settle into one preferred mode of decay in driving these resonances back to their ground states.
5.6.1. The Important Role of the Absolute Difference ()
- (a)
- Reactions emitting photons reveal their primarily EM nature, as do reactions emitting neutral vector mesons (, , or —but not , whose enormous 9.46-GeV rest mass trumps that of all the other particles).
- (b)
- By showing their true EM nature, reactions with (i.e., ) teach us that in cases where across the entire decay reaction (i.e., ), (non-)conservation of I becomes practically irrelevant; then, the reaction is mediated primarily by the EM interaction.
- (c)
- The decay of produces a charged meson and a , the only particle that actually carries EM charge. This EM reaction also shows that = 0, which differentiates it from (i) the other = 0 EM decays producing photons (see Case 1) and (ii) the -producing and decays mediated by the strong interaction (see Case 2).
5.6.2. Decay Channels of and Resonances
- (a)
- Based on the criterion, the primary modes of are strong (ST), but the decay of the neutral to charged pions is EM (Table 10). Since for all particles involved, ; thus, the strong charge is obviously conserved in all of these decays. But the charge distance () is not conserved in the ubiquitous decay of , telling us that this is an EM reaction (Case 3 in Table 10).
- (b)
- The decays of and , as well as the primary decays of and down to their parental states ( and , respectively), are mediated by the strong interaction (Case 2 in Table 10 [38,40]), and they are not going to occupy us further. On the other hand, and have two additional decay channels in which they do not return to their parental states ( and , respectively), viz.,and
6. Summary of Results and Open Questions
6.1. Summary of Results
6.2. Open Questions
- (1a)
- Consider the binding factors () of the nucleons listed at the top of Table 2 ( and 67.9 for and , respectively). Their sum, 137.7, is close (within 0.5%) to the reciprocal of the EM fine-structure constant () [3], i.e., the famous number [6,42]. Then, the average binding factor () of each quark in each nucleon appears to be very close toIt is not surprising that the fine-structure constant may be involved in the specification of the dimensionless binding factors. But the principles behind this identification, as well as the identifications that follow, are not yet known; thus, we cannot formally dismiss the possibility of a coincidence at this time. Nevertheless, the concurrences listed in items (1)–(3) are too many to be explained by a sequence of fortuitous events.
- (1b)
- Consider next the binding factors () of the pions listed at the top of Table 4 ( for ). This value is close (within 0.4%) to half of the reciprocal of the weak-interaction coupling constant (, i.e., ), whereevaluated based on the gauge factor () [6] of the weak interaction. It seems unavoidable that the fundamental coupling constants of the subatomic interactions are correlated with the binding factors of the ground states, the nucleons, and the pions.
- (2a)
- The above identifications are also supported, to an extent, by the constituent quarks of the baryons, which show, by far, the largest values among all elementary particles (Table 3). Their average binding factor () for each individual quark is only 0.7% smaller than the “strong” value ofFor the values of these low-energy resonances (just 293 MeV above the nucleons), the “strong” factor of 4/3 appears to be necessary in rescaling the well-known EM factor of (see Equation (18) above).
- (2b)
- We identified the above strong factor of 4/3 with the quadratic Casimir charge () of the SU(3) fundamental representation. The Casimir charge () commonly appears in SU(3) in strong interactions. For instance, it helps define the short-range term of the potential energy of the quarkonia c and b [7,43].Therefore, by extension, it seems that all s listed in Table 2, Table 3 and Table 4 are related to the fundamental QCD couplings and their gauge factors in multifarious ways [6,7]. In such a case, the value for each particle reveals information about the constituent subatomic fields that support the current quarks and antiquarks in the dynamic environments they set up inside the particles.
- (3)
- The small differences in values within the same state (or group of particles) are significant. They seem to be caused by the components of the strong field and the particular ways they use to bind each individual particle (or there are no differences in cases in which the values are identical within the same group; Table 2, Table 3 and Table 4). This conclusion stems from the following surprising congruence: the precise ratios of the baryons and the nucleons are equal, viz.,and the pionic ratio () is not too different, although we used a value for that is only an approximation for the mixed neutral state ().
- (4a)
- It is generally believed that there are no asymmetries between quarks and antiquarks, and this belief has sparked many investigations toward understanding today’s “baryon asymmetry”, the complete dominance of matter over antimatter in the present universe [44,45,46,47]. On the other hand, results from the LHCb experiment [48] indicated a substantial asymmetry (CP violation) in the weak decay of (last reaction in Table 6 with in the final state; see also [49] for similar LHCb results in weak decays of the charmed meson).
- (4b)
- In the course of our investigation, we uncovered a theoretical basis for CP violation in mesons. In Appendix C, we show that the energy levels of quarks and antiquarks are not symmetric, as is widely believed. The energy cost for building higher-mass quarks is much less than for antiquarks, and their ground states also differ. In particular, building an antiquark from its ground state (i.e., ) costs 182 more MeV than building an s quark from its own ground state, i.e., (Figure A4). These characteristic energy costs of (anti)quark transitions may be unobservable for now, but we hope they can at least be measured in lattice-QCD numerical simulations [50,51,52,53].
Author Contributions
Funding
Data Availability Statement
Acknowledgments
Conflicts of Interest
Abbreviations
| CODATA | Committee On Data |
| CP | Charge Parity |
| EM | Electromagnetic |
| LHCb | Large Hadron Collider beauty |
| NNG | Nakano–Nishijima–Gell-Mann |
| PDG | Particle Data Group |
| QCD | Quantum Chromodynamics |
| SM | Standard Model |
| ST | Strong |
Appendix A. Mass Jumps between Particles
Appendix B. Valence Quarks in Σ/Λ0/Ξ/Ω/Ξ* Baryons
Appendix B.1. Octet Σ and Λ0 Baryons
- (1a)
- The energy cost to maintain a quark flip becomes a gain when the quarks flip in the opposite direction, that is, the energies of the u→d and d→u quark flips obey and so on for all the other flips. Thus, quark flipping is assumed to be a reversible process.
- (1b)
- The same property also holds for isospin transition energies, viz., and . Thus, an isospin transition is assumed to be a reversible process as well.
- (2a)
- The energy cost to maintain a u→s quark flip is the sum of the costs of the u→d and d→s flips, that is, the energies obey and so on for all the other striding quark flips.
- (2b)
- The same property also holds for the isospin transition energies, that is, .
Appendix B.2. Discussion of the Σ-Λ0 Results
- (a)
- The u→d quark flip is inexpensive ( MeV). This explains why u→d is the only flip to a higher-mass quark in the quark sequence [38]. The transition involves the exchange of a virtual boson with a mass of 80.377 GeV [2], so the actual flipping cost () is truly negligible. Also, there is no energy charge for changes in ud flips, as we already know from the - results of Section 3.1. Furthermore, the small energy budget involved in ud flips is consistent with the ubiquity of the decays via weak interactions [38,54].
- (b)
- The decays of s→u and s→d release substantial amounts of energy (126–127 MeV). This energy is ∼64% larger than the isospin transition energy of 76.96 MeV quoted in Equation (A8) above—comparable to the differences in rest mass between and baryons (Figure 4) to the rest masses (Table 4) of the pions emitted in decays (Table 6).
- (c)
- The energy release from changes is small (e.g., MeV, about 30% of ), but this energy also becomes available to the surrounding strong field for other tasks.
- (d)
- A curious finding is the following: We define by the energy needed to support a quark flip to a higher-mass s quark (i.e., d→s or u→s, as in Equation (A7)), plus the 1-MeV anti-Coulombic contribution of u→s in (Section 3.3); and by the rest-energy differential between the two quarks; then, we find that the corresponding “mass deficit” is effectively the same in both cases, viz.as it should be, since EM forces and quark rest-mass differences have been accounted for, and the isospin energy () is the same in both cases ( for the s quark; Table 5).
- (e)
- Despite the similarity between cases in item (d), the decay of s→u dominates entirely in nature (s→d, in which does not occur), but for an EM-related reason. Virtual neutral-vector bosons () do not mediate quark transitions [6,38], and bosons always modify the quark charge. This prevents weak s→d transitions and makes the EM charge factor of (Section 2.2 and Table 5) all the more important for the quarks that own it (residing in u- and c-flavored hadrons).
Appendix B.3. Octet Ξ Baryons
Appendix B.4. The Ω− Baryon
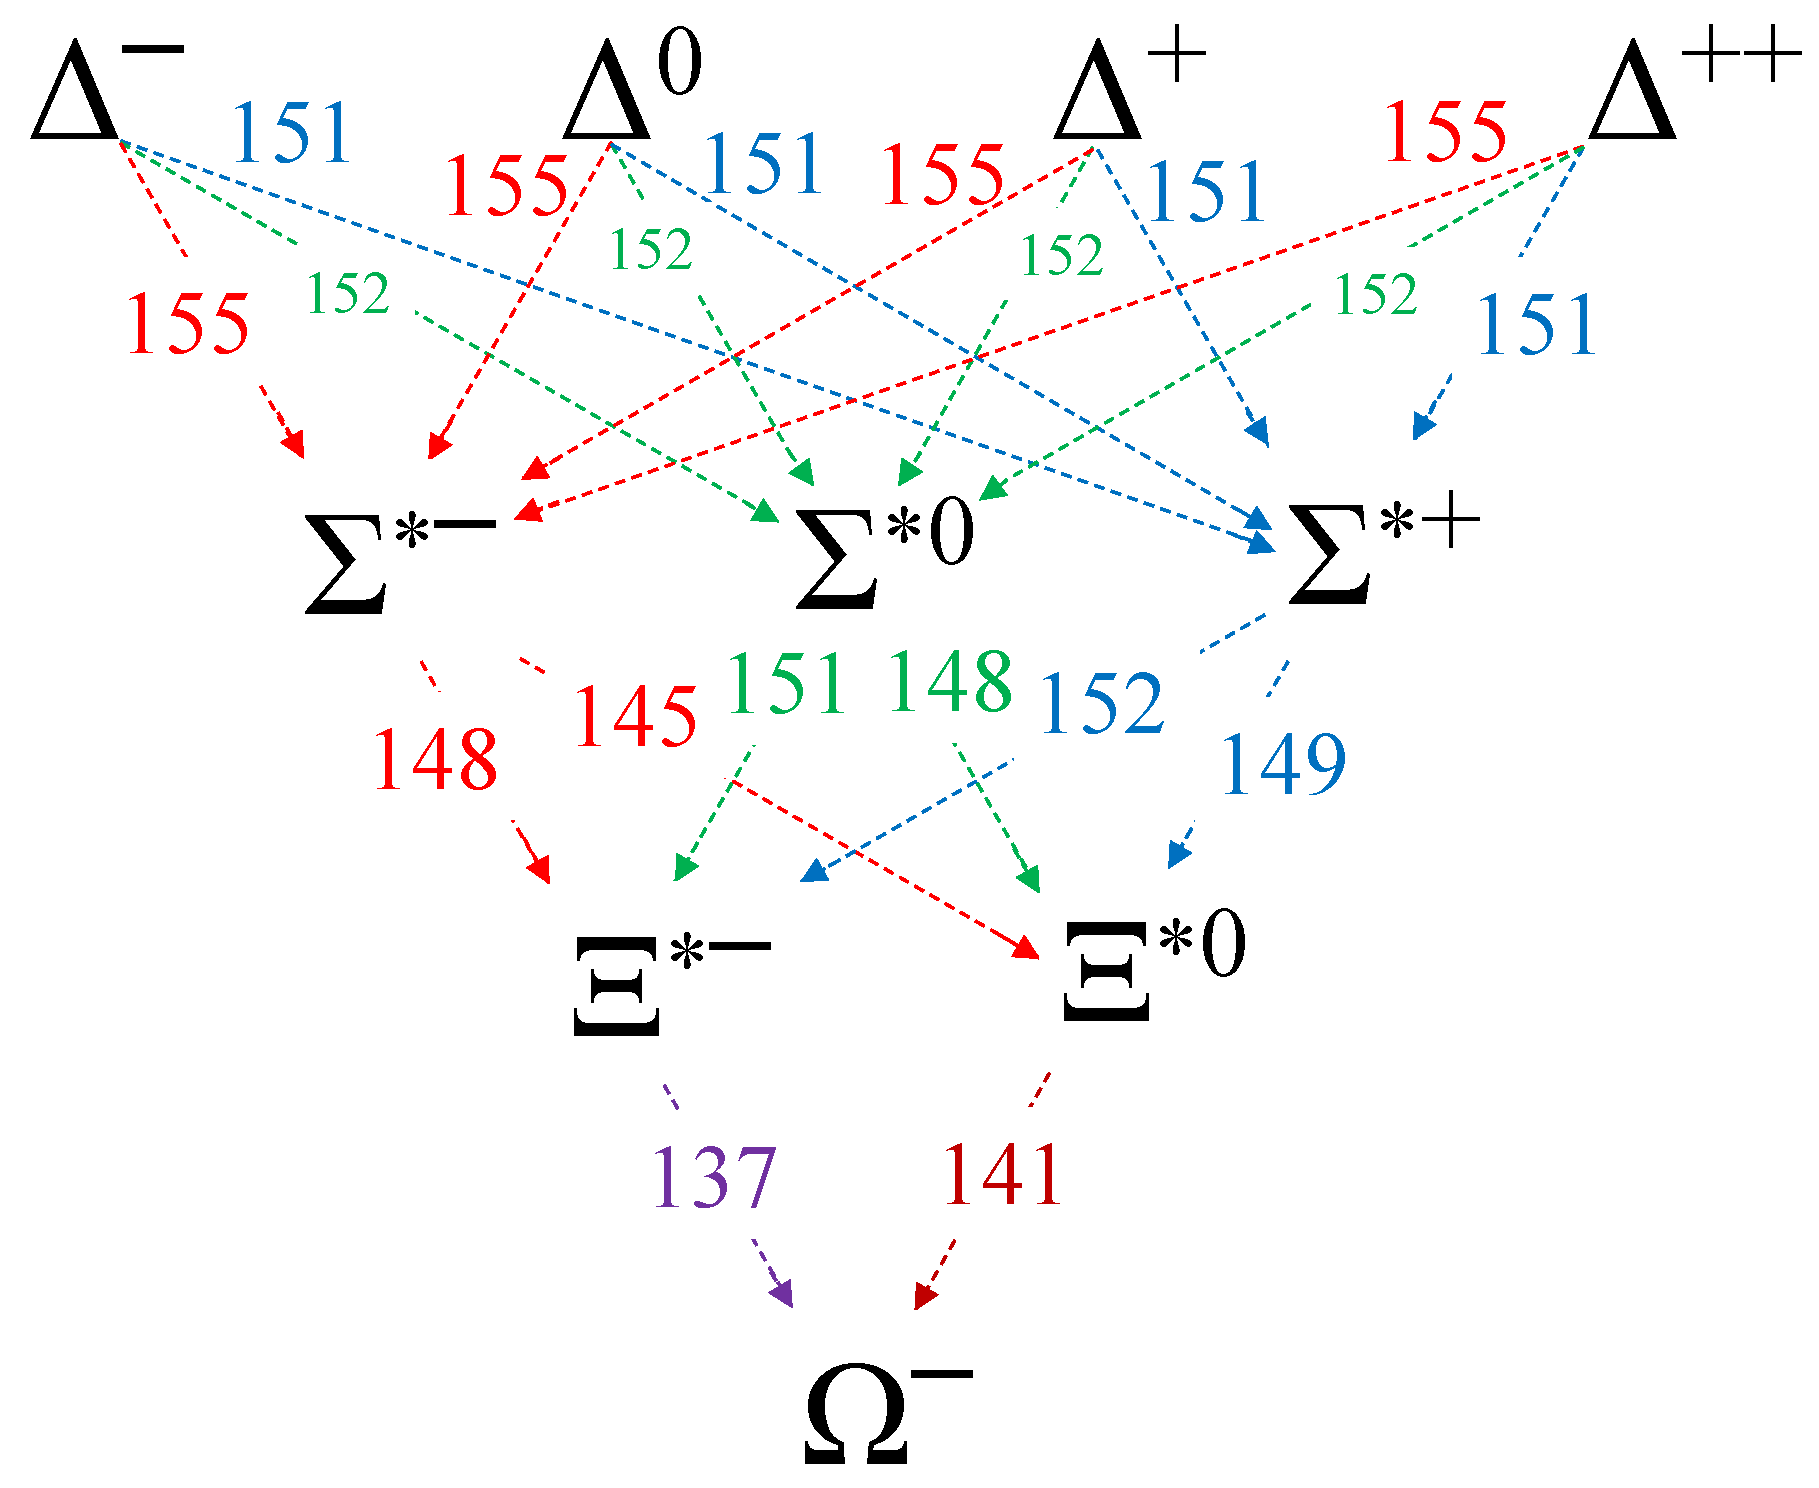
Appendix B.5. Ξ* Baryon Decays Emitting Pions
Appendix C. Valence Antiquarks in K and π Pseudoscalar Mesons

References
- Zyla, P.A.; Barnett, R.M.; Beringer, J.; Dahl, O.; Dwyer, A.D.; Groom, E.D.; Lin, C.J.; Lugovsky, K.S.; Pianori, E.; Robinson, J.D.; et al. Review of Particle Physics (RPP 2020). Prog. Theor. Exp. Phys. 2020, 2020, 083C01. [Google Scholar]
- Particle Data Group; Workman, R.L.; Burkert, V.D.; Crede, V.; Klempt, E.; Thoma, U.; Tiator, L.; Agashe, K.; Aielli, G.; Allanach, B.C.; et al. 2022 Review of particle physics. Prog. Theor. Exp. Phys. 2022, 2022, 083C01. [Google Scholar]
- Tiesinga, E.; Mohr, P.J.; Newell, D.B.; Taylor, B.N. CODATA recommended values of the fundamental physical constants: 2018. Rev. Mod. Phys. 2021, 93, 025010. [Google Scholar] [CrossRef]
- Frisch, D.H.; Thorndike, A.M. Elementary Particles; Van Nostrand: New York, NY, USA, 1964. [Google Scholar]
- Thiel, A.; Afzal, F.; Wunderlich, Y. Light baryon spectroscopy. Prog. Part. Nucl. Phys. 2022, 125, 103949. [Google Scholar]
- Peskin, M.E.; Schroeder, D.V. An Introduction to Quantum Field Theory; CRC Press: Boca Raton, FL, USA, 1995. [Google Scholar]
- Bali, G.S. QCD forces and heavy quark bound states. Phys. Rep. 2001, 343, 1. [Google Scholar] [CrossRef]
- Durr, S.; Fodor, Z.; Frison, J.; Hoelbling, C.; Hoffmann, R.; Katz, S.D.; Krieg, S.; Kurth, T.; Lellouch, L.; Lippert, T.; et al. Ab initio determination of light hadron masses. Science 2008, 322, 1224. [Google Scholar] [CrossRef] [PubMed]
- Yang, Y.B.; Liang, J.; Bi, Y.J.; Chen, Y.; Draper, T.; Liu, K.F.; Liu, Z. Proton mass decomposition from the QCD energy momentum tensor. Phys. Rev. Lett. 2018, 121, 212001. [Google Scholar] [CrossRef]
- Metz, A.; Pasquini, B.; Rodini, S. Understanding the proton mass in QCD. SciPost Phys. Proc. 2022, 8, 105. [Google Scholar] [CrossRef]
- Pohl, R.; Antognini, A.; Nez, F.; Amaro, F.D.; Biraben, F.; Cardoso, J.M.; Covita, D.S.; Dax, A.; Dhawan, S.; Fernandes, L.M.; et al. The size of the proton. Nature 2010, 466, 213. [Google Scholar] [CrossRef] [PubMed]
- Antognini, A.; Nez, F.; Schuhmann, K.; Amaro, F.D.; Biraben, F.; Cardoso, J.M.; Covita, D.S.; Dax, A.; Dhawan, S.; Diepold, M.; et al. Proton Structure from the Measurement of 2S-2P Transition Frequencies of Muonic Hydrogen. Science 2013, 339, 417. [Google Scholar] [CrossRef]
- Bezginov, N.; Valdez, T.; Horbatsch, M.; Marsman, A.; Vutha, A.C.; Hessels, E.A. A measurement of the atomic hydrogen Lamb shift and the proton charge radius. Science 2019, 365, 1007. [Google Scholar] [CrossRef]
- Xiong, W.; Gasparian, A.; Gao, H.; Dutta, D.; Khandaker, M.; Liyanage, N.; Pasyuk, E.; Peng, C.; Bai, X.; Ye, L.; et al. A small proton charge radius from an electron–proton scattering experiment. Nature 2019, 575, 147. [Google Scholar] [CrossRef] [PubMed]
- Karr, J.P.; Marchand, D.; Voutier, E. The proton size. Nat. Rev. Phys. 2020, 2, 601. [Google Scholar] [CrossRef]
- Ericson, T.; Weise, W. Pions and Nuclei; Oxford University Press: New York, NY, USA, 1988. [Google Scholar]
- Borsanyi, S.; Durr, S.; Fodor, Z.; Hoelbling, C.; Katz, S.D.; Krieg, S.; Lellouch, L.; Lippert, T.; Portelli, A.; Szabo, K.K.; et al. Ab initio calculation of the neutron-proton mass difference. Science 2015, 347, 1452. [Google Scholar] [CrossRef] [PubMed]
- Gasser, J.; Leutwyler, H. Implications of scaling for the proton-neutron mass difference. Nucl. Phys. B 1975, 94, 269. [Google Scholar] [CrossRef]
- Thomas, A.W.; Wang, X.G.; Young, R.D. Electromagnetic contribution to the proton-neutron mass splitting. Phys. Rev. C 2015, 91, 015209. [Google Scholar] [CrossRef]
- Erben, F.B.; Shanahan, P.E.; Thomas, A.W.; Young, R.D. Dispersive estimate of the electromagnetic charge symmetry violation in the octet baryon masses. Phys. Rev. C 2014, 90, 065205. [Google Scholar] [CrossRef]
- Gasser, J.; Hoferichter, M.; Leutwyler, H.; Rusetsky, A. Cottingham formula and nucleon polarizabilities. Eur. Phys. J. C 2015, 75, 375. [Google Scholar] [CrossRef]
- Gasser, J.; Leutwyler, H.; Rusetsky, A. Sum rule for the Compton amplitude and implications for the proton–neutron mass difference. Eur. Phys. J. C 2020, 80, 1121. [Google Scholar] [CrossRef]
- Gasser, J.; Leutwyler, H.; Rusetsky, A. On the mass difference between proton and neutron. Phys. Lett. B 2021, 814, 136087. [Google Scholar] [CrossRef]
- Leutwyler, H. Theoretical aspects of chiral dynamics. In Proceedings of the 8th International Workshop on Chiral Dynamics—PoS(CD15), Pisa, Italy, 29 June–3 July 2015. [Google Scholar]
- Walker-Loud, A.; Carlson, C.E.; Miller, G.A. Electromagnetic self-energy contribution to Mp − Mn and the isovector nucleon magnetic polarizability. Phys. Rev. Lett. 2012, 108, 232301. [Google Scholar] [CrossRef] [PubMed]
- Sato, K.; Watanabe, H.; Yamazaki, T. Calculation of the pion charge radius from an improved model-independent method. In Proceedings of the 39th International Symposium on Lattice Field Theory—PoS(LATTICE2022), Bonn, Germany, 8–13 August 2022. [Google Scholar]
- Duran, B.; Meziani, Z.E.; Joosten, S.; Jones, M.K.; Prasad, S.; Peng, C.; Armstrong, W.; Atac, H.; Chudakov, E.; Bhatt, H.; et al. Determining the gluonic gravitational form factors of the proton. Nature 2023, 615, 813. [Google Scholar] [CrossRef] [PubMed]
- Bars, I.; Hanson, A.J. Quarks at the ends of the string. Phys. Rev. D 1976, 13, 1744. [Google Scholar] [CrossRef]
- Kalashnikova, Y.S.; Nefediev, A.V. 1 + 1 string with quarks at the ends revisited. Phys. Lett. B 1997, 399, 274. [Google Scholar] [CrossRef]
- Nefediev, A.V. Light-light and heavy-light mesons in the model of QCD string with quarks at the ends. AIP Conf. Proc. 2002, 619, 595. [Google Scholar]
- Pasechnik, R.; šumbera, M. Phenomenological review on quark-gluon plasma: Concepts vs. observations. Universe 2017, 3, 7. [Google Scholar] [CrossRef]
- Fritzsch, H. Quarks. In Murray Gell-Mann and the Physics of Quarks; Birkhäuser: Cham, Switzerland, 2018. [Google Scholar]
- Bulava, J.; Hörz, B.; Knechtli, F.; Koch, V.; Moir, G.; Morningstar, C.; Peardon, M. String breaking by light and strange quarks. Phys. Lett. B 2019, 793, 493. [Google Scholar] [CrossRef]
- Coleman, S.; Glashow, S.L. Electrodynamic properties of baryons in the unitary symmetry scheme. Phys. Rev. Lett. 1961, 6, 423. [Google Scholar] [CrossRef]
- Nakano, T.; Nishijima, K. Charge independence for V-particles. Prog. Theor. Phys. 1953, 10, 581. [Google Scholar] [CrossRef]
- Nishijima, K. Charge independence theory of V particles. Prog. Theor. Phys. 1955, 13, 285. [Google Scholar] [CrossRef]
- Gell-Mann, M. The interpretation of the new particles as displaced charge multiplets. Nuovo C. 1956, 4 (Suppl. S2), 848. [Google Scholar] [CrossRef]
- Rohlf, J.W. Modern Physics; John Wiley: New York, NY, USA, 1994. [Google Scholar]
- Barnes, V.E.; Connolly, P.L.; Crennell, D.J.; Culwick, B.B.; Delaney, W.C.; Fowler, W.B.; Hagerty, P.E.; Hart, E.L.; Horwitz, N.; Hough, P.V.C.; et al. Observation of a hyperon with strangeness minus three. Phys. Rev. Lett. 1964, 12, 204. [Google Scholar] [CrossRef]
- Povh, B.; Rith, K.; Scholz, C.; Zetsche, F.; Rodejohann, W. Particles and Nuclei, 4th ed.; Springer: Berlin, Germany, 2004. [Google Scholar]
- Christman, J.R. Isospin: Conserved in Strong Interactions. 2001. Available online: www.physnet.org/modules/pdf_modules/m278.pdf (accessed on 26 October 2023).
- Miller, A.I. 137: Jung, Pauli, and the Pursuit of a Scientific Obsession; WW Norton: New York, NY, USA, 2009. [Google Scholar]
- Eichten, E.; Gottfried, K.; Kinoshita, T.; Lane, K.D.; Yan, T.M. Charmonium: The model. Phys. Rev. D 1978, 17, 3090. [Google Scholar] [CrossRef]
- Dimopoulos, S.; Susskind, L. Baryon number of the universe. Phys. Rev. D 1978, 18, 4500. [Google Scholar] [CrossRef]
- Shaposhnikov, M.E.; Farrar, G.R. Baryon asymmetry of the universe in the Minimal Standard Model. Phys. Rev. Lett. 1993, 70, 2833. [Google Scholar]
- Riotto, A.; Trodden, M. Recent progress in baryogenesis. Ann. Rev. Nucl. Part Sci. 1999, 49, 46. [Google Scholar] [CrossRef]
- Canetti, L.; Drewes, M.; Shaposhnikov, M. Matter and antimatter in the universe. New J. Phys. 2012, 14, 095012. [Google Scholar] [CrossRef]
- The LHCb Collaboration. Measurement of matter-antimatter differences in beauty baryon decays. Nat. Phys. 2017, 13, 391. [Google Scholar] [CrossRef]
- The LHCb Collaboration. Observation of CP violation in charm decays. Phys. Rev. Lett. 2019, 122, 211803. [Google Scholar] [CrossRef]
- Davies, C.T.; Follana, E.; Gray, A.; Lepage, G.P.; Mason, Q.; Nobes, M.; Shigemitsu, J.; Trottier, F.H.; Wingate, M.; Aubin, C. High-precision lattice QCD confronts experiment. Phys. Rev. Lett. 2004, 92, 022001. [Google Scholar] [CrossRef]
- De Grand, T.; De Tar, C. Lattice Methods for Quantum Chromodynamics; World Scientific: Singapore, 2006. [Google Scholar]
- Gattringer, C.; Lang, C.B. Quantum Chromodynamics on the Lattice; Springer: Berlin, Germany, 2010. [Google Scholar]
- Bazanov, A. Nonperturbative QCD simulations with 2 + 1 flavors of improved staggered quarks. Rev. Mod. Phys. 2010, 82, 1349. [Google Scholar] [CrossRef]
- Kónya, J.; Nagy, N.M. Nuclear and Radiochemistry, 2nd ed.; Elsevier: Amsterdam, The Netherlands, 2018. [Google Scholar]
- Heisenberg, W. Über den Bau der Atomkerne. I. Z. Phys. 1932, 77, 1. [Google Scholar] [CrossRef]
| Quantity/Number | Symbol | Definition for a Particle |
|---|---|---|
| Intrinsic angular | ||
| Rest mass | M | Invariant mass–energy content |
| Mass deficit | ; also called “mass defect” [4] | |
| Binding factor | divided by a linear combination of valence | |
| (anti)quark masses; see, e.g., Equations (2) and (3) in the text | ||
| Strangeness | S | for s quarks and antiquarks |
| Charm | C | for c quarks and antiquarks |
| Bottomness | for b quarks and antiquarks | |
| Total isospin | I | A subset of flavor symmetry for u and d quarks and their antiquarks |
| Isospin component 3 | Component 3 of isospin vector | |
| Hypercharge | Y | , where is the baryon number |
| and the topness is for all known particles [2] | ||
| Electric charge | Q | The physical property of the electromagnetic field |
| “Strong charge” | ; see, e.g., Equation (13) in the text | |
| Weak isospin component 3 | Component 3 of weak isospin vector (SU(2) only) | |
| Weak hypercharge | ||
| “Weak charge” |
| Particle | Quark | Rest Mass | I | S | C | Y | ||||||
|---|---|---|---|---|---|---|---|---|---|---|---|---|
| Symbol | Content | (MeV) | () | (MeV) | ||||||||
| uud | 938.27208 | +1 | 1/2 | 0 | 0 | 0 | 1/2 | 1 | 0 | 69.8 | 929.2821 | |
| udd | 939.56541 | 0 | 1/2 | 0 | 0 | 0 | 1 | 1 | 67.9 | 928.0654 | ||
| uds | 1115.683 | 0 | 0 | 0 | 0 | 0 | 0 | 0 | 9.92 | 1015.45 | ||
| uds | 1192.642 | 0 | 1 | 0 | 0 | 0 | 0 | 0 | 10.7 | 1092.41 | ||
| uus | 1189.37 | +1 | 1 | 0 | 0 | 1 | 0 | 10.7 | 1091.65 | |||
| dds | 1197.449 | 1 | 0 | 0 | 0 | 1 | 10.7 | 1094.71 | ||||
| uss | 1314.86 | 0 | 1/2 | 0 | 0 | 1/2 | 5.89 | 1125.90 | ||||
| dss | 1321.71 | 1/2 | 0 | 0 | 0 | 5.90 | 1130.24 | |||||
| udc | 2286.46 | +1 | 0 | 0 | 1 | 0 | 0 | 2 | 1 | 0.396 | 1009.6 | |
| udb | 5619.6 | 0 | 0 | 0 | 0 | 0 | 0 | 0 | 0.342 | 1432.8 | ||
| uuc | 2453.97 | +2 | 1 | 0 | 1 | 0 | 1 | 2 | 0 | 0.463 | 1179.6 | |
| udc | 2452.9 | +1 | 1 | 0 | 1 | 0 | 0 | 2 | 1 | 0.461 | 1176.1 | |
| ddc | 2453.75 | 0 | 1 | 0 | 1 | 0 | 2 | 2 | 0.461 | 1174.4 | ||
| usc | 2578.4 | +1 | 1/2 | 1 | 0 | 1/2 | 1 | 0 | 0.460 | 1212.8 | ||
| dsc | 2579.2 | 0 | 1/2 | 1 | 0 | 1 | 1 | 0.459 | 1211.1 | |||
| ssc | 2695.2 | 0 | 0 | 1 | 0 | 0 | 0 | 0 | 0.454 | 1238.4 | ||
| uub | 5810.56 | +1 | 1 | 0 | 0 | 1 | 0 | 0.388 | 1626.2 | |||
| udb | (5810.56) | 0 | 1 | 0 | 0 | 0 | 0 | 0 | 0.388 | 1623.7 | ||
| ddb | 5815.64 | 1 | 0 | 0 | 0 | 1 | 0.388 | 1626.3 | ||||
| ssb | 6046.1 | 0 | 0 | 0 | 0.385 | 1679.3 | ||||||
| usc | 2467.94 | +1 | 1/2 | 1 | 0 | 1/2 | 1 | 0 | 0.418 | 1102.4 | ||
| dsc | 2470.90 | 0 | 1/2 | 1 | 0 | 1 | 1 | 0.418 | 1102.8 | |||
| ucc | 3621.2 | +2 | 1/2 | 0 | 2 | 0 | 1/2 | 3 | 1 | 0.212 | 1079.0 | |
| dcc | (3621.2) | +1 | 1/2 | 0 | 2 | 0 | 3 | 2 | 0.212 | 1076.5 | ||
| usb | 5791.9 | 0 | 1/2 | 0 | 1/2 | 0.354 | 1516.3 | |||||
| dsb | 5797.0 | 1/2 | 0 | 0 | 0.355 | 1518.9 | ||||||
| usb | (5791.9) | 0 | 1/2 | 0 | 1/2 | 0.354 | 1516.3 | |||||
| dsb | (5797.0) | 1/2 | 0 | 0 | 0.355 | 1518.9 |
| Particle | Quark | Rest Mass | Q | I | S | C | Y | |||||
|---|---|---|---|---|---|---|---|---|---|---|---|---|
| Symbol | Content | (MeV) | () | (MeV) | ||||||||
| uuu | 1232 | +2 | 3/2 | 0 | 0 | 0 | 3/2 | 1 | 94.6 | 1225.5 | ||
| uud | 1232 | +1 | 3/2 | 0 | 0 | 0 | 1/2 | 1 | 0 | 91.9 | 1223.0 | |
| udd | 1232 | 0 | 3/2 | 0 | 0 | 0 | 1 | 1 | 89.3 | 1220.5 | ||
| ddd | 1232 | 3/2 | 0 | 0 | 0 | 1 | 2 | 86.9 | 1218.0 | |||
| uus | 1382.80 | +1 | 1 | 0 | 0 | 1 | 0 | 12.6 | 1285.1 | |||
| uds | 1383.7 | 0 | 1 | 0 | 0 | 0 | 0 | 0 | 12.5 | 1283.5 | ||
| dds | 1387.2 | 1 | 0 | 0 | 0 | 1 | 12.5 | 1284.5 | ||||
| uss | 1531.80 | 0 | 1/2 | 0 | 0 | 1/2 | 7.03 | 1342.8 | ||||
| dss | 1535.0 | 1/2 | 0 | 0 | 0 | 7.02 | 1343.5 | |||||
| sss | 1672.45 | 0 | 0 | 0 | 0 | 4.97 | 1392.3 | |||||
| uuc | 2518.41 | +2 | 1 | 0 | 1 | 0 | 1 | 2 | 0 | 0.488 | 1244.1 | |
| udc | 2517.5 | +1 | 1 | 0 | 1 | 0 | 0 | 2 | 1 | 0.487 | 1240.7 | |
| ddc | 2518.48 | 0 | 1 | 0 | 1 | 0 | 2 | 2 | 0.486 | 1239.1 | ||
| usc | 2645.56 | +1 | 1/2 | 1 | 0 | 1/2 | 1 | 0 | 0.485 | 1280.0 | ||
| dsc | 2646.38 | 0 | 1/2 | 1 | 0 | 1 | 1 | 0.485 | 1278.3 | |||
| ssc | 2765.9 | 0 | 0 | 1 | 0 | 0 | 0 | 0 | 0.480 | 1309.1 | ||
| uub | 5830.32 | +1 | 1 | 0 | 0 | 1 | 0 | 0.393 | 1646.0 | |||
| udb | (5830.32) | 0 | 1 | 0 | 0 | 0 | 0 | 0 | 0.392 | 1643.5 | ||
| ddb | 5834.74 | 1 | 0 | 0 | 0 | 1 | 0.393 | 1645.4 | ||||
| usb | 5952.3 | 0 | 1/2 | 0 | 1/2 | 0.392 | 1676.7 | |||||
| dsb | 5955.33 | 1/2 | 0 | 0 | 0.392 | 1677.3 |
| Particle | Quark | Rest Mass | Q | I | S | C | Y | |||||
|---|---|---|---|---|---|---|---|---|---|---|---|---|
| Symbol | Content | (MeV) | () | (MeV) | ||||||||
| u | 139.5704 | +1 | 1 | 0 | 0 | 0 | 1 | 0 | 14.8 | 132.74 | ||
| d | 139.5704 | 1 | 0 | 0 | 0 | 0 | 1 | 14.8 | 132.74 | |||
| 134.9768 | 0 | 1 | 0 | 0 | 0 | 0 | 0 | 0 | ||||
| 547.862 | 0 | 0 | 0 | 0 | 0 | 0 | 0 | 0 | ⋯ | ⋯ | ||
| 957.78 | 0 | 0 | 0 | 0 | 0 | 0 | 0 | 0 | ⋯ | ⋯ | ||
| u | 493.677 | +1 | 1/2 | 1 | 0 | 0 | 1/2 | 1 | 0 | 4.07 | 398.12 | |
| s | 493.677 | 1/2 | 0 | 0 | 0 | 4.07 | 398.12 | |||||
| d | 497.611 | 0 | 1/2 | 1 | 0 | 0 | 1 | 1 | 4.07 | 399.54 | ||
| s | 497.611 | 0 | 1/2 | 0 | 0 | 1/2 | 4.07 | 399.54 | ||||
| High-mass mesons () | ||||||||||||
| c | 2983.9 | 0 | 0 | 0 | 0 | 0 | 0 | 0 | 0 | 0.0874 | 443.9 | |
| b | 9398.7 | 0 | 0 | 0 | 0 | 0 | 0 | 0 | 0 | 0.124 | 1038.7 | |
| D mesons () | ||||||||||||
| c | 1869.61 | +1 | 1/2 | 0 | 1 | 0 | 1/2 | 1 | 0 | 0.234 | 594.9 | |
| c | 1864.84 | 0 | 1/2 | 0 | 1 | 0 | 1 | 1 | 0.233 | 592.7 | ||
| c | 1968.30 | +1 | 0 | 1 | 1 | 0 | 0 | 2 | 1 | 0.230 | 604.9 | |
| s | 1968.30 | 0 | 0 | 0 | 0.230 | 604.9 | ||||||
| B mesons () | ||||||||||||
| u | 5279.34 | +1 | 1/2 | 0 | 0 | 1 | 1/2 | 1 | 0 | 0.262 | 1097.2 | |
| d | 5279.65 | 0 | 1/2 | 0 | 0 | 1 | 1 | 1 | 0.262 | 1095.0 | ||
| s | 5366.88 | 0 | 0 | 0 | 1 | 0 | 0 | 0 | 0.256 | 1093.5 | ||
| c | 6274.9 | +1 | 0 | 0 | 1 | 1 | 0 | 2 | 1 | 0.123 | 824.9 | |
| Vector mesons () | ||||||||||||
| u | 775.11 | +1 | 1 | 0 | 0 | 0 | 1 | 0 | 85.5 | 768.28 | ||
| d | 775.11 | 1 | 0 | 0 | 0 | 0 | 1 | 85.5 | 768.28 | |||
| 775.26 | 0 | 1 | 0 | 0 | 0 | 0 | 0 | 0 | ||||
| 782.66 | 0 | 0 | 0 | 0 | 0 | 0 | 0 | 0 | ||||
| u | 891.66 | +1 | 1/2 | 1 | 0 | 0 | 1/2 | 1 | 0 | 8.15 | 796.10 | |
| d | 895.81 | 0 | 1/2 | 1 | 0 | 0 | 1 | 1 | 8.13 | 797.74 | ||
| s | 1019.461 | 0 | 0 | 0 | 0 | 0 | 0 | 0 | 0 | 4.46 | 832.7 | |
| c | 3096.916 | 0 | 0 | 0 | 0 | 0 | 0 | 0 | 0 | 0.110 | 556.9 | |
| b | 9460.30 | 0 | 0 | 0 | 0 | 0 | 0 | 0 | 0 | 0.132 | 1100.3 | |
| c | 2010.26 | +1 | 1/2 | 0 | 1 | 0 | 1/2 | 1 | 0 | 0.289 | 735.6 | |
| c | 2006.96 | 0 | 1/2 | 0 | 1 | 0 | 1 | 1 | 0.289 | 734.8 | ||
| c | 2112.1 | +1 | 0 | 1 | 1 | 0 | 0 | 2 | 1 | 0.284 | 748.7 | |
| u | 5325.2 | +1 | 1/2 | 0 | 0 | 1 | 1/2 | 1 | 0 | 0.273 | 1143.0 | |
| d | 5325.2 | 0 | 1/2 | 0 | 0 | 1 | 1 | 1 | 0.273 | 1140.5 | ||
| s | 5415.4 | 0 | 0 | 0 | 1 | 0 | 0 | 0 | 0.267 | 1142.0 | ||
| c | (6274.9) | +1 | 0 | 0 | 1 | 1 | 0 | 2 | 1 | 0.123 | 824.9 | |
| q = | u | d | s | c | b | t |
|---|---|---|---|---|---|---|
| Rest masses | ||||||
| 2.16 | 4.67 | 93.4 | 1.27 | 4.18 | 172.5 | |
| MeV | MeV | MeV | GeV | GeV | GeV | |
| Electric charge factors | ||||||
| 2 | 1 | 1 | 2 | 1 | 2 | |
| Quantum Numbers | ||||||
| All Interactions | ||||||
| Q | 2/3 | 2/3 | 2/3 | |||
| Strong Interactions | ||||||
| 0 | 0 | 0 | 0 | |||
| Y | 1/3 | 1/3 | 4/3 | 4/3 | ||
| 2/3 | 2/3 | 2/3 | ||||
| Weak Interactions | ||||||
| (Left-Chiral Quarks) | ||||||
| 1/2 | 1/2 | |||||
| 1/3 | 1/3 | 1/3 | 1/3 | 1/3 | 1/3 | |
| 2/3 | 2/3 | 2/3 | ||||
| EM or ST? | Decay | (s) | ||
|---|---|---|---|---|
| Case 1: on the left side and across the entire decay reaction. | ||||
| The 8 examples from Table 6, Table 7, Table 8 and Table 9 are | ||||
| −1 → −1 0 = −1 | ||||
| −1 = 0 | ||||
| Unknown | ||||
| 1 0 = 1 | ||||
| Unknown | ||||
| EM | When across the decay reaction, then , and it does not appear in | |||
| the wave functions. Isospin (non-)conservation then becomes a meaningless distinction. | ||||
| Photon emission in many reactions also reveals their predominantly EM nature. | ||||
| Note: The s of , , and are long, so weak interactions are involved too. | ||||
| Case 2: on the left side and conserved across the reaction. | ||||
| The 9 examples from Table 6, Table 7, Table 8 and Table 9 are | ||||
| −1 → 0 −1 = −1 | ||||
| 2 → 1 1 = 2 | ||||
| 1 → 0 1 = 1 | ||||
| −1 → −1 0 = −1 | ||||
| 1 1 = 2 | ||||
| −1 → 0 −1 = −1 | ||||
| −1 → −1 0 = −1 | ||||
| 1 → 1 0 = 1 | ||||
| ST | When and is conserved in the decay, then is also conserved. | |||
| Then, the decay reaction is mediated primarily by the strong interaction. | ||||
| Note: All s are very short, a typical property of predominantly strong decays. | ||||
| Case 3: on at least one side and is not conserved across the reaction. | ||||
| The 14 examples from Table 7, Table 8 and Table 9 are | ||||
| −1→ 0 −1 = −1 | ||||
| 0 1 = 1 | ||||
| −1 → 0 −1 = −1 | ||||
| −1 0 1 = 0 | ||||
| −1 1 0 = 0 | ||||
| 1 −1 = 0 | ||||
| 1 −1 = 0 | ||||
| 0 −1 1 = 0 | ||||
| 0 → −1 1 = 0 | ||||
| 0 → −1 0 1 = 0 | ||||
| 0 → 0 0 = 0 | ||||
| 0 → 1 −1 = 0 | ||||
| 1 → 0 1 = 1 | ||||
| 1 −1 = 0 | ||||
| EM | When on at least one side and is not conserved, then is not conserved either. | |||
| Then, the decay reaction is mediated primarily by the EM interaction. | ||||
| Note: The s of , , and are long, so weak interactions are involved too. | ||||
Disclaimer/Publisher’s Note: The statements, opinions and data contained in all publications are solely those of the individual author(s) and contributor(s) and not of MDPI and/or the editor(s). MDPI and/or the editor(s) disclaim responsibility for any injury to people or property resulting from any ideas, methods, instructions or products referred to in the content. |
© 2024 by the authors. Licensee MDPI, Basel, Switzerland. This article is an open access article distributed under the terms and conditions of the Creative Commons Attribution (CC BY) license (https://creativecommons.org/licenses/by/4.0/).
Share and Cite
Christodoulou, D.M.; Kazanas, D. On the Energy Budget of Quarks and Hadrons, Their Inconspicuous “Strong Charge”, and the Impact of Coulomb Repulsion on the Charged Ground States. Particles 2024, 7, 653-682. https://doi.org/10.3390/particles7030038
Christodoulou DM, Kazanas D. On the Energy Budget of Quarks and Hadrons, Their Inconspicuous “Strong Charge”, and the Impact of Coulomb Repulsion on the Charged Ground States. Particles. 2024; 7(3):653-682. https://doi.org/10.3390/particles7030038
Chicago/Turabian StyleChristodoulou, Dimitris M., and Demosthenes Kazanas. 2024. "On the Energy Budget of Quarks and Hadrons, Their Inconspicuous “Strong Charge”, and the Impact of Coulomb Repulsion on the Charged Ground States" Particles 7, no. 3: 653-682. https://doi.org/10.3390/particles7030038
APA StyleChristodoulou, D. M., & Kazanas, D. (2024). On the Energy Budget of Quarks and Hadrons, Their Inconspicuous “Strong Charge”, and the Impact of Coulomb Repulsion on the Charged Ground States. Particles, 7(3), 653-682. https://doi.org/10.3390/particles7030038