Abstract
Recent advancements have shown tensions between observations and our current understanding of the Universe. Such observations may include the tension and massive galaxies at high redshift that are older than traditional galaxy formation models have predict. Since these observations are based on redshift as the primary distance indicator, a bias in the redshift may explain these tensions. While redshift follows an established model, when applied to astronomy it is based on the assumption that the rotational velocity of the Milky Way galaxy relative to the observed galaxies has a negligible effect on redshift. But given the mysterious nature of the physics of galaxy rotation, that assumption needed to be tested. The test was done by comparing the redshift of galaxies rotating in the same direction relative to the Milky Way to the redshift of galaxies rotating in the opposite direction relative to the Milky Way. The results show that the mean redshift of galaxies that rotate in the same direction relative to the Milky Way is higher than the mean redshift of galaxies that rotate in the opposite direction. Additionally, the redshift difference becomes larger as the redshift gets higher. The consistency of the analysis was verified by comparing data collected by three different telescopes, annotated using four different methods, released by three different research teams, and covering both the northern and southern ends of the galactic pole. All the datasets are in excellent agreement with each other, showing consistency in the observed redshift bias. Given the “reproducibility crisis” in science, all the datasets used in this study are publicly available, and the results can be easily reproduced. This observation could be the first direct empirical reproducible observation for the Zwicky’s “tired-light” model.
1. Introduction
The unprecedented imaging power of JWST has revealed new information about the Universe that is not aligned with some of the current fundamental cosmological assumptions. For instance, the presence of galaxies at redshift higher than 13 [1] or even as high as 15 [2] was not expected according to previous assumptions [3]. Mature massive galaxies observed at redshift of ∼11 [4] also challenge the cosmological model and the history of the Universe. The existence of massive galaxies at high redshift was reported also before JWST was launched [5], and JWST provided more and deeper instances of such galaxies, showing that mature galaxies were prevalent in the early Universe. Another example of a puzzling unexplained observation is the tension, reflected by two different messengers that provide two different expansion rates and ages of the Universe [6,7,8,9,10,11,12,13]. Since both measure the same Universe, it can be assumed that at least one of these measurements is biased.
These puzzling observations introduce a challenge to cosmology: if the distance indicators are accurate, the standard cosmological model is incomplete. If the current standard cosmological theories are complete, then the distance indicators may not be fully accurate. That is, either the standard cosmological theories need to be revised, or the redshift as a distance indicator needs to be revised, but the two may not be able to co-exist without modifications. While some solutions include alternative cosmological models, it has also been suggested that the tensions can be solved by changing the redshift model [14,15,16,17,18].
The redshift of an astronomical object is expected to correspond to the linear velocity of the object relative to Earth. But in addition to the linear velocity, the measurement of the redshift of a galaxy can also be affected by the rotational velocity of the galaxy, as well as the rotational velocity of the Milky Way. The rotational velocity of a luminous object can affect the Doppler shift effect [19,20,21], but since the rotational velocity of a galaxy is far smaller than its linear velocity, it is assumed that the effect of the rotational velocity is negligible. When the redshift of the galaxy is higher, the effect of the rotational velocity is expected to be even smaller. In any case, the rotational velocity of galaxies is ignored in common redshift models. However, it should be noted that the physics of a galaxy’s rotation, and, namely, its rotational velocity, are still among the most mysterious and most provocative phenomena in nature.
While the puzzling nature of the physics of galaxy rotation was noted in the first half of the 20th century [22], it was not until five decades later that it became part of mainstream science [23,24]. Common explanations include dark matter [23] or modified Newtonian dynamics [25], but numerous other explanations have also been proposed [26,27,28,29,30,31,32,33,34,35]. However, despite over a century of scientific research, there is no complete explanation for the nature of galaxy rotation [26,36,37,38,39,40,41,42,43,44,45,46,47,48,49].
The purpose of this experiment was to examine the impact of the galaxy rotational velocity on the redshift. This could be done by observing galaxies located around the galactic pole, and comparing the redshift of galaxies rotating in the same direction relative to the Milky Way to the redshift of galaxies rotating in the opposite direction relative to the Milky Way. An observed difference in the redshift could indicate that the redshift is affected by the rotational velocity, and, therefore, that the way it is implemented in astronomy is incomplete.
2. A Possible Link between Galaxy Rotational Velocity and Redshift
A preliminary possible link between redshift and the rotational velocity of galaxies has been proposed through empirical observations showing that galaxies that rotate in the same direction relative to the Milky Way have different redshift compared to galaxies that rotate in the opposite direction relative to the Milky Way [50]. The analysis was based on several different datasets of galaxies acquired by two different telescopes, and annotated by their direction of rotation, using several different annotation methods. Since galaxies with leading arms are extremely rare [51], the direction of rotation was determined by the arms of the galaxies. The analysis was based on galaxies at the field centered at the galactic pole and on the field, to increase the number of galaxies and, consequently, the statistical significance. The analysis was done for both the northern and southern ends of the galactic pole [50].
The catalogs used in the experiment included galaxies annotated by the Ganalyzer algorithm [52,53], by the SpArcFiRe method [54,55], and by the manual annotation of Galaxy Zoo, such that the “superclean” criterion of 95% agreement between the annotations [56] was used. All of these methods determine the spin direction of the galaxies based on analysis of the shape of the galaxy arms. The datasets are all available publicly. The SDSS and DESI galaxies annotated by the Ganalyzer algorithm are available at https://people.cs.ksu.edu/~lshamir/data/zdifference/ (accessed on 15 July 2024). The set of galaxies annotated by the SpArcFiRe method can be found at https://people.cs.ksu.edu/~lshamir/data/sparcfire/ (accessed on 15 July 2024). The annotations of Galaxy Zoo can be accessed through SDSS CAS server at http://casjobs.sdss.org/CasJobs/default.aspx (accessed on 15 July 2024). Table 1 shows the mean redshift of galaxies that rotate in the same direction and in the opposite direction relative to the Milky Way.

Table 1.
The mean redshift of galaxies that rotate in the same direction relative to the Milky Way galaxy (MW) and the mean redshift of galaxies that rotate in the opposite direction relative to the Milky Way (OMW). The p values are the one-tailed p values determined by the Student t-test. All datasets are publicly available. The experiments are described in detail in [50].
As the table shows, all the catalogs show lower redshift for galaxies that rotate in the opposite direction relative to the Milky Way. With the exception of the small Galaxy Zoo catalog, in all cases the difference is statistically significant. The observed z difference was higher when using the smaller field centered at the galactic pole compared to the larger field. This can be explained by the difference in the relative rotational velocity, which is expected to increase when the galaxies are located closer to the galactic pole. The SpArcFiRe algorithm was used with both the original images and with the mirrored images. This was done due to the reported bias of the SpArcFiRe method [57]. SpArcFiRe provided a higher number of galaxies, but at the expense of the accuracy of the annotation, leading to a smaller absolute z though a stronger statistical signal, due to the higher number of galaxies [50]. The Ganalyzer algorithm has a simple “mechanical” symmetric nature [52,58,59], and, therefore, mirroring the galaxies did not change the results [50]. When using SpArcFiRe the results changed when the galaxy images were mirrored, but the change was not substantial, except for the expected inverse z observed when the galaxy images were mirrored.
The p-values shown in Table 1 are based on the Student t-test, which assumes normal distribution of the redshift. Because the redshift distribution does not necessarily follow normal distribution, the Student t-test may not provide the real probability of having such a distribution by chance. To verify the statistical significance, a simulation analysis was used, such that the galaxies were separated randomly into two groups, and the difference between the mean redshift of each of the two groups of galaxies was computed. This was repeated 100,000 times with the dataset of 1642 galaxies of the second row in Table 1. In 307 of the runs the difference between the first group of galaxies and the second group was larger than 0.0016, providing a probability of 0.0031 of occurrence by chance [50].
The DESI Legacy Survey data were collected around the southern galactic pole, and, therefore, galaxies in the southern galactic pole rotating in the same direction relative to the Milky Way would seem to rotate in the opposite direction compared to galaxies in the northern galactic pole rotating in the same direction relative to the Milky Way. This provides an additional verification that the difference is not a feature of some unknown behavior of the galaxy annotation methods, as such an effect would be consistent across the sky, rather than flipping and providing inverse results at the two ends of the galactic pole [50]. An additional control experiment was performed by using SDSS galaxies from the same source that rotate in opposite directions in fields that are perpendicular to the galactic pole. For instance, in the 20 × 20 degree fields centered at the z was 0.00022 ± 0.004, which is statistically insignificant.
Table 2 shows the differences between the flux in different wavelengths. The flux differences between galaxies that rotate in opposite directions show a difference of ∼10% in the different filters, and the absolute difference is larger when the wavelength is shorter [50].
Table 2.
Flux differences in different filters between galaxies that rotate in the same and in the opposite direction relative to the Milky Way. The data are the galaxies and the field shown in the first row of Table 1. The p values were determined by a simple two-tailed Student t-test.
3. Analysis of HSC DR3 Galaxies
The analysis shown in Section 2 and in [50] shows a consistent but relatively small redshift bias. But these analyses are based on galaxies imaged mostly by SDSS, with one experiment with galaxies obtained through the DESI Legacy Survey. Therefore, most galaxies used for the experiments included in Table 1 are of relatively low redshift. This makes it difficult to profile the change in z when the redshift changes. That is, if z increases at a higher redshift, it can provide an indication that the redshift bias is higher for high-redshift galaxies.
To profile the dependence between z and the redshift, an experiment was performed with the third data release (DR3) of the hyper suprime-cam (HSC). Using the 8.2 m Subaru telescope, HSC provides a high level of detail of galaxies with higher redshift compared to galaxies imaged by the SDSS or DESI Legacy Surveys. This allowed us to annotate galaxies with higher redshift by their direction of rotation, and to test whether the redshift bias increases with the redshift.
The galaxies used in the experiment included all the HSC DR3 galaxies that have redshift in SDSS DR17. This included 101,415 galaxies with redshift of . The purpose of the redshift limit was to avoid galaxies that could not be annotated accurately by their visible spin patterns. The galaxies were annotated by the Ganalyzer algorithm [52,53], as described in [50]. This led to a clean dataset of 13,477 galaxies.
A smaller dataset of annotated galaxies compared to the initial dataset was expected because not all galaxies are necessarily spiral and not all spiral galaxies have a direction of rotation that can be identified. Manual inspection of 100 galaxies, randomly selected, showed that all the galaxies were annotated accurately. The dataset can be accessed at https://people.cs.ksu.edu/~lshamir/data/zdifference_hsc/ (accessed on 15 July 2024). The redshift distribution of the galaxies is displayed in Figure 1. Although most galaxies have a relatively low redshift, the catalog still contains more than 1000 galaxies with .
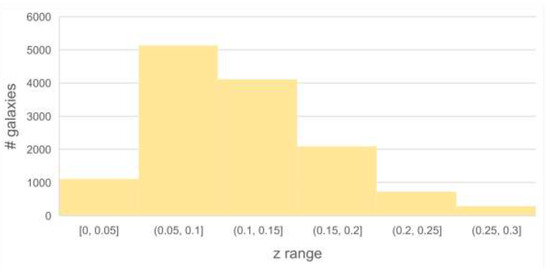
Figure 1.
Distribution of the redshift of the HSC DR3 galaxies.
While providing better image quality and depth compared to the catalogs summarized in Section 2, the downside of the HSC catalog used here is that it covers neither the south nor the north end of the galactic pole. Therefore, the galaxies used for the analysis were galaxies that are closer to the south end of the galactic pole, as well as galaxies that are close to the north end of the galactic pole. The declination of the galaxies ranged between to . The distribution of the right ascension is shown in Figure 2. The catalog contains 4724 galaxies that are within 60∘ from the southern galactic pole and 8753 galaxies that are within 60∘ from the northern galactic pole.
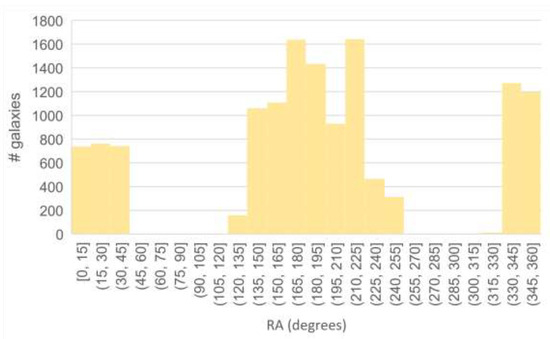
Figure 2.
Distribution of the RA in the dataset of HSC DR3 galaxies.
Table 3 and Table 4 show the mean redshift of galaxies rotating in the same direction relative to the Milky Way galaxy and the mean redshift of galaxies rotating in the opposite direction relative to the Milky Way galaxy in the southern and northern galactic poles, respectively. The tables show the difference between the mean z among all the galaxies, but also the differences when the galaxy population is separated into 0.1 redshift ranges. As the table shows, in both ends of the galactic pole there is a statistically significant difference between the redshift of the galaxies rotating in the same direction as the galactic pole and the galaxies rotating in the opposite direction relative to the galactic pole.
Table 3.
Redshift of the galaxies around the southern galactic pole that rotate in the same direction as the Milky Way galaxy and in the opposite direction relative to the Milky Way. The p values are the Student t-test probabilities of such differences being stronger by chance.
Table 4.
Mean redshift of galaxies around the northern galactic pole rotating in the same direction relative to the Milky Way and the mean redshift of galaxies rotating in the opposite direction relative to the Milky Way.
The directions of rotation of the galaxies observed on the opposite sides of the galactic pole were inverse, such that a galaxy located around the north end of the galactic pole and rotating in the same direction relative to the Milky Way would seem to rotate in the opposite direction if it was located at the south end of the galactic pole. This was naturally taken into account in the analysis, but the consistency between both ends of the galactic pole showed that the differences were not driven by an unknown bias in the annotation, as such a bias would have been consistent at both ends of the galactic pole, and would not flip based on the locations of the galaxies in the sky.
As discussed in Section 2, the p-values were based on the Student t-test, and, therefore, on the assumption that the redshift was distributed normally. Since that assumption might not necessarily have been correct, a simulation was performed, such that the galaxies were separated into two groups randomly, and the mean redshift of one group was compared to the mean redshift of the galaxies of the other group [50]. After 100,000 tests, the galaxies close to the southern galactic pole were separated into two random groups with a mean redshift difference larger than 0.00363 in 518 runs. The same experiment when using the galaxies closer to the northern galactic pole showed a mean redshift difference larger than 0.002451 in 230 of the runs. These simulation experiments show that the probability of such a separation by mere chance is far below 1%.
The simple separation of the analysis into several redshift ranges shows that z increases as the redshift gets higher. That observation is consistent at both ends of the galactic pole. Figure 3 shows the z in the different redshift ranges.
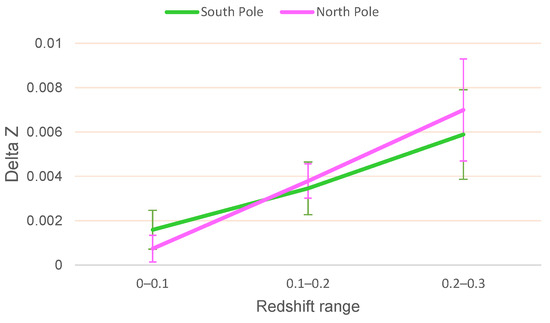
Figure 3.
z in different redshift ranges at the south and north ends of the galactic pole. Both ends of the galactic pole show a very similar z increase.
The statistical significance of the increase in z can also be determined by using a simple Pearson correlation after assigning the galaxies that rotate in the same direction relative to the the Milky Way with the value 1 and the galaxies that rotate in the opposite direction relative to the Milky Way as −1. When using galaxies closer to the northern galactic pole the Pearson correlation is 0.0296, and the probability of such a correlation by chance is p = 0.02. When using galaxies closer to the southern galactic pole, the Pearson correlation is 0.02669, and the p is 0.0064.
4. Verification Using a Third-Party Dataset
To further test the consistency of the bias, the observation described in Section 2 and Section 3 was compared to a third-party catalog [60]. That catalog was prepared by five undergraduate students who manually annotated SDSS galaxies, and the galaxy images were also mirrored, to offset for possible human bias [60]. While the purpose of that dataset was not to compare redshift or test the impact of the rotational velocity of the Milky Way, 14,462 of the galaxies in that dataset had redshift, and, therefore, could be used for the analysis. The dataset can be accessed at https://ars.els-cdn.com/content/image/1-s2.0-S0370269311003947-mmc1.txt (accessed on 15 July 2024). The redshift of all the galaxies that had spectra was smaller than 0.1, and the redshift distribution is displayed in Figure 4. The distribution of the RA is displayed in Figure 5. As the figure shows, the majority of the galaxies are in relatively close proximity to the northern galactic pole.
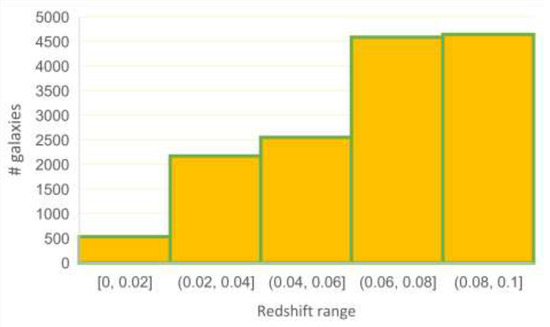
Figure 4.
Distribution of the redshift of the galaxies in the catalog of [60]. The redshift of all the galaxies is smaller than 0.1.
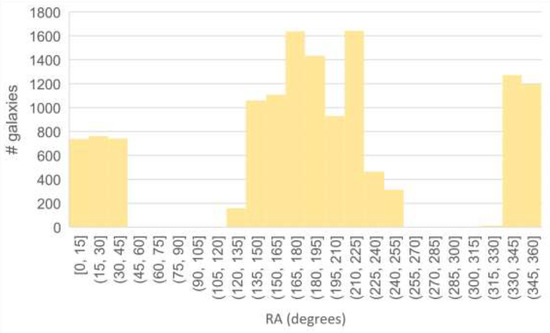
Figure 5.
Distribution of the RA in the catalog of [60]. Most galaxies are closer to the north end of the galactic pole.
A very simple analysis of the data shows that the mean redshift of the galaxies that rotate clockwise in that catalog is 0.06586 ± 0.00029, while the mean redshift of galaxies rotating counterclockwise is 0.065 ± 0.00029. The probability of such difference being by chance is 0.018. While the statistically significant redshift difference may seem unexpected, most of the galaxies are located near the northern galactic pole, and, therefore, the lower redshift for the galaxies that rotate counterclockwise is in agreement with the results shown in Table 4 using the HSC data taken from the northern galactic pole, as well as the other datasets show in Table 1. Table 5 shows the mean z of the galaxies rotating in the same direction as the Milky Way galaxy in the catalog [60], and the mean z of the galaxies that rotate in the opposite direction relative to the Milky Way in the southern and northern galactic poles.
Table 5.
Redshift of the galaxies annotated by [60] around the southern and northern galactic poles that rotate in the same direction as the Milky Way galaxy and in the opposite direction relative to the Milky Way. The older third-party dataset was used to confirm the results observed with the other datasets.
As the table shows, the z around the northern galactic pole agrees well with the z observed by HSC around the northern galactic pole at the same redshift range of 0–0.1, as shown in Table 4. The opposite end of the galactic pole also shows that galaxies that rotate in the opposite direction relative to the Milky Way have lower redshift compared to galaxies that rotate in the same direction, but in the case of the [60] catalog the difference is not statistically significant, possibly due to the low number of galaxies in that part of the sky.
Since the redshift of the galaxies in that catalog is limited to , a direct comparison to the redshift ranges used in Table 4 is not possible. However, when using the galaxies around the northern galactic pole, the Pearson correlation coefficient between the direction of rotation and the redshift is 0.02033, and the probability of this coefficient being by chance is ∼0.01. This provides an indication that the bias increases with the redshift, as was also observed with the data from HSC DR3. The third-party dataset, therefore, shows the same observation as the dataset of HSC DR3 galaxies and, in fact, the data from all other premier sky surveys.
5. Possible Link to Zwicky’s “Tired-Light” Model
The early Universe as imaged by JWST is different from the early Universe predicted by the standard model. Among other explanations, that tension was proposed to have a link to Fritz Zwicky’s “tired-light” (TL) theory [16,18,61,62,63,64,65,66,67,68,69,70].
According to TL, photons lose their energy along their traveling path through the Universe. This can lead to differences in the redshift as observed from Earth, and, therefore, galaxies that are more distant from Earth can have redshift that differs from galaxies that are closer to Earth. If this theory is correct, it would explain the early mature galaxies observed by JWST, as their true age would not the same age that their redshift indicates. In its extreme form, TL can argue that the Big Bang is merely an artifact created by TL, and that the Universe is in fact in steady state. One of the downsides of the model is that there is no empirical observation showing that photons indeed lose their energy as they travel through the Cosmos.
An empirical experiment that shows a redshift bias that grows as the redshift becomes higher is difficult to perform at cosmological-scale distance, since the only information that can be obtained is the redshift as observed from Earth. While the distances of the galaxies can be estimated through other candles, such as Ia supernovae, it is difficult to prove whether the redshift of a galaxy is higher because the galaxy indeed moves faster away from Earth in accordance to the Big Bang theory, because of TL, or because of a combination of the two. Ia supernovae are also limited in the distance range compared to the redshift, and, therefore, a redshift bias in the very high redshift will be difficult to profile using Ia supernovae.
But when using the rotational velocity of the Earth within the Milky Way galaxy, a small redshift bias is expected, due to the rotational velocity of the Earth. That bias is expected to affect galaxies rotating in the same direction relative to the Milky Way differently than it affects galaxies rotating in the opposite direction relative to the Milky Way. That bias is expected to be small, but according to several datasets, as shown here, it is statistically significant. More importantly, the bias grows with the redshift, suggesting that it is not the velocity alone that leads to the bias. The rotational velocity of the Earth within the Milky Way galaxy is obviously a constant that does not change, and the radial velocity of galaxies rotating in the same direction relative to the Milky Way galaxy is expected to be, on average, the same as the radial velocity of galaxies that rotate in the opposite direction relative to the Milky Way. The idea that the redshift can change with the distance, and not necessarily the velocity, might be an indication supporting Fritz Zwicky’s century-old theory.
That observation can also be related to the far higher number of galaxies that rotate in the opposite direction relative to the Milky Way as imaged by JWST [71]. The JWST deep field images show that 140% more galaxies rotate in the opposite direction relative to the Milky Way [71]. A possible explanation is that galaxies that rotate in the opposite direction relative to the Milky Way are brighter, due to the Doppler shift effect. Due to TL, the brightness difference becomes more significant when the galaxies are more distant from Earth, and, therefore, many more galaxies are observed rotating in the opposite direction relative to the Milky Way. Earlier observations made before JWST saw that first light also showed such asymmetry that grew with the redshift [72,73], although at the lower redshift range the asymmetry was far milder than the asymmetry observed in the early Universe image by JWST.
6. Conclusions
Unexpected observations, such as the tension and galaxies that according to the current theories are expected to be older than traditional galaxy formation models predict, are challenging the standard cosmological model. If the cosmological model is complete and fully accurate, the distance measurements and, primarily, the redshift are biased. If the redshift is fully accurate then the standard cosmological model and basic theories regarding galaxy formation and the history of the Universe are incomplete. In any case, the redshift as used currently and the existing basic cosmological theories cannot co-exist without modifications.
This paper presents empirical observations that show that the redshift model may be biased and that the bias might be driven by the rotational velocity of the Milky Way galaxy relative to the rotational velocity of the observed galaxies. The observed bias is consistent across different telescopes and different annotation methods, and it shows very similar bias at both ends of the galactic pole. It is also consistent in catalogs that were collected for other purposes by different research teams.
The empirical observations described in this paper are provided with the data to ensure that the results can be reproduced. It has been shown that the vast majority of the scientific results cannot be reproduced [74], introducing the challenge known as the “reproducibility crisis” in science [75,76,77,78]. The ability to access the data and reproduce the results allows us to advance science in a transparent manner and to avoid errors that might not be noticeable to a reader unless they have access to the data.
In current astrophysics and cosmology practices, the redshift is used in most cases by ignoring the rotational velocity of the Milky Way, as the rotational velocity is far lower than the linear velocity and can, therefore, be considered negligible. But it should be noted that the physics of galaxy rotation and, in particular, the rotational velocity of galaxies are still not fully understood [22,26,33,36,37,38,39,40,41,42,43,44,45,46,47,49,79,80,81,82,83,84,85]. Theories such as dark matter [23] or MOND [25] have been proposed to explain the anomaly of the rotational velocity of galaxies, but several decades of research still have not led to a proven explanation for the provocative nature of the rotational velocity of galaxies.
It is difficult to identify an immediate explanation for the link between the rotational velocity and the redshift as observed from Earth. A possible explanation is the tired-light theory. But, as mentioned above, the physics of galaxy rotation in general are difficult to explain without making unproven assumptions. Since the redshift is the most common distance indicator in cosmological scales, a bias in the redshift can impact a large number of other studies that make use of the redshift.
Because the bias tends to become larger when the redshift gets higher, it is possible that such bias can explain anomalies, such as galaxies that according to the existing theories are expected to be older than traditional galaxy formation models predict. The experiments described here were based on relatively low redshift ranges and, therefore, it is still unclear whether higher redshift will have significant redshift bias. Studying the bias in higher redshift would require using a large number of galaxies with redshift imaged by space-based instruments, such as JWST, at around the galactic pole.
Because is determined by using the redshift, a redshift bias can also explain the observed tension. For instance, when using the SH0ES catalog [86] of Ia supernovae, by just selecting the galaxies that rotate in the same direction as the Milky Way, drops from ∼73.7 to ∼69.05 km/s Mpc−1 [87], which is within the statistical error from as observed by the CMB. When using only the SH0ES galaxies rotating in the opposite direction relative to the Milky Way, increases to ∼74.2 km/s Mpc−1 [87]. Although SH0ES contains a relatively small number of Ia supernovae with their host galaxies, this suggests that redshift as a distance indicator may depend on the rotational velocity relative to the rotational velocity of the Milky Way. This observation is also aligned with the contention that the tension may require new physics that apply to the entire Universe, rather than certain changes in the physics of the early Universe [88]. Because is determined by using the redshift, redshift bias can also be related to the observed anisotropy [89,90,91,92,93], which is another puzzling observation that does not have an immediate explanation.
It is also possible that the redshift difference is not a bias, and that galaxies that rotate in the opposite direction relative to the Milky Way are indeed closer to Earth compared to galaxies that rotate in the same direction relative to the Milky Way. In that case, the alignment with both ends of the galactic pole is merely a coincidence. Such large-scale alignment is far larger than any known cluster, super-cluster, or filament in the cosmic web. That may be in agreement with numerous other observations that suggest that the cosmological principle is violated [93].
Although alignment in galaxy spin directions is expected [94,95], it is not expected to form a cosmological-scale axis. If such an axis indeed exists and it is not driven by the impact of the rotational velocity on the redshift measurements then it can be linked with theories such as dipole cosmology [96,97,98,99,100] or the rotating Universe [101,102,103,104,105]. Theories that assume a Universe rotating around a cosmological-scale axis include black hole cosmology [106,107,108,109,110,111,112,113,114,115] and ellipsoidal Universe [116,117,118,119,120].
Tensions between the expected age of some galaxies and the age of the Universe, as well as other cosmological-scale anisotropies and observations, such as the tension, challenge our understanding of the Universe. It is clear that the current theories cannot co-exist with the redshift model as it is used currently, and, therefore, if the current theories are complete then this means that the redshift as a distance indicator is incomplete. This paper shows consistent evidence that the redshift depends on the rotational velocity of the Milky Way relative to the observed objects. The bias is small, but if it increases in the redshift ranges of the JWST deep fields then this would potentially explain the existence of mature galaxies in the early Universe.
Funding
This research was funded in part by NSF grant 2148878.
Data Availability Statement
All datasets used in this paper are publicly available. HSC DR3 galaxy data are available at https://people.cs.ksu.edu/~lshamir/data/zdifference_hsc/ (accessed on 15 July 2024). Annotated SDSS and DESI galaxies from the northern and southern galactic poles are available at https://people.cs.ksu.edu/~lshamir/data/zdifference/ (accessed on 15 July 2024). The data used by Michael Longo can be accessed at https://ars.els-cdn.com/content/image/1-s2.0-S0370269311003947-mmc1.txt (accessed on 15 July 2024). SDSS galaxies annotated by SPARCFIRE are available at https://people.cs.ksu.edu/~lshamir/data/sparcfire/ (accessed on 15 July 2024). Galaxy Zoo data are publicly available through SDSS CAS at http://casjobs.sdss.org/CasJobs/default.aspx (accessed on 15 July 2024).
Acknowledgments
I would like to thank the two anonymous reviewers and the associate editor for their helpful comments.
Conflicts of Interest
The author declares no conflicts of interest.
References
- Curtis-Lake, E.; Carniani, S.; Cameron, A.; Charlot, S.; Jakobsen, P.; Maiolino, R.; Bunker, A.; Witstok, J.; Smit, R.; Chevallard, J.; et al. Spectroscopic confirmation of four metal-poor galaxies at z= 10.3–13.2. Nat. Astron. 2023, 7, 622–632. [Google Scholar] [CrossRef]
- Whitler, L.; Endsley, R.; Stark, D.P.; Topping, M.; Chen, Z.; Charlot, S. On the ages of bright galaxies 500 Myr after the big bang: Insights into star formation activity at z>15 with JWST. Mon. Not. R. Astron. Soc. 2023, 519, 157–171. [Google Scholar] [CrossRef]
- Cowley, W.I.; Baugh, C.M.; Cole, S.; Frenk, C.S.; Lacey, C.G. Predictions for deep galaxy surveys with JWST from ΛCDM. Mon. Not. R. Astron. Soc. 2018, 474, 2352–2372. [Google Scholar] [CrossRef]
- Glazebrook, K.; Nanayakkara, T.; Schreiber, C.; Lagos, C.; Kawinwanichakij, L.; Jacobs, C.; Chittenden, H.; Brammer, G.; Kacprzak, G.G.; Labbe, I.; et al. A massive galaxy that formed its stars at z˜ 11. Nature 2024, 628, 277–281. [Google Scholar] [CrossRef]
- Neeleman, M.; Prochaska, J.X.; Kanekar, N.; Rafelski, M. A cold, massive, rotating disk galaxy 1.5 billion years after the Big Bang. Nature 2020, 581, 269–272. [Google Scholar] [CrossRef] [PubMed]
- Wu, H.Y.; Huterer, D. Sample variance in the local measurements of the Hubble constant. Mon. Not. R. Astron. Soc. 2017, 471, 4946–4955. [Google Scholar] [CrossRef]
- Mörtsell, E.; Dhawan, S. Does the Hubble constant tension call for new physics? J. Cosmol. Astropart. Phys. 2018, 2018, 025. [Google Scholar] [CrossRef]
- Bolejko, K. Emerging spatial curvature can resolve the tension between high-redshift CMB and low-redshift distance ladder measurements of the Hubble constant. Phys. Rev. D 2018, 97, 103529. [Google Scholar] [CrossRef]
- Davis, T.M.; Hinton, S.R.; Howlett, C.; Calcino, J. Can redshift errors bias measurements of the Hubble Constant? Mon. Not. R. Astron. Soc. 2019, 490, 2948–2957. [Google Scholar] [CrossRef]
- Pandey, S.; Raveri, M.; Jain, B. Model independent comparison of supernova and strong lensing cosmography: Implications for the Hubble constant tension. Phys. Rev. D 2020, 102, 023505. [Google Scholar] [CrossRef]
- Camarena, D.; Marra, V. Local determination of the Hubble constant and the deceleration parameter. Phys. Rev. Res. 2020, 2, 013028. [Google Scholar] [CrossRef]
- Di Valentino, E.; Mena, O.; Pan, S.; Visinelli, L.; Yang, W.; Melchiorri, A.; Mota, D.F.; Riess, A.G.; Silk, J. In the realm of the Hubble tension—A review of solutions. Class. Quantum Gravity 2021, 38, 153001. [Google Scholar] [CrossRef]
- Riess, A.G.; Yuan, W.; Macri, L.M.; Scolnic, D.; Brout, D.; Casertano, S.; Jones, D.O.; Murakami, Y.; Anand, G.S.; Breuval, L.; et al. A comprehensive measurement of the local value of the Hubble constant with 1 km s−1 Mpc−1 uncertainty from the Hubble Space Telescope and the SH0ES team. Astrophys. J. Lett. 2022, 934, L7. [Google Scholar] [CrossRef]
- Crawford, D.F. Curvature pressure in a cosmology with a tired-light redshift. Aust. J. Phys. 1999, 52, 753–777. [Google Scholar] [CrossRef]
- Pletcher, A.E. Why Mature Galaxies Seem to have Filled the Universe shortly after the Big Bang. Qeios 2023. [Google Scholar]
- Gupta, R. JWST early Universe observations and ΛCDM cosmology. Mon. Not. R. Astron. Soc. 2023, 524, 3385–3395. [Google Scholar] [CrossRef]
- Lee, S. The cosmological evolution condition of the Planck constant in the varying speed of light models through adiabatic expansion. Phys. Dark Universe 2023, 42, 101286. [Google Scholar] [CrossRef]
- Lovyagin, N.; Raikov, A.; Yershov, V.; Lovyagin, Y. Cosmological model tests with JWST. Galaxies 2022, 10, 108. [Google Scholar] [CrossRef]
- Marrucci, L. Spinning the Doppler effect. Science 2013, 341, 464–465. [Google Scholar] [CrossRef]
- Lavery, M.P.; Barnett, S.M.; Speirits, F.C.; Padgett, M.J. Observation of the rotational Doppler shift of a white-light, orbital-angular-momentum-carrying beam backscattered from a rotating body. Optica 2014, 1, 1–4. [Google Scholar] [CrossRef]
- Liu, B.; Chu, H.; Giddens, H.; Li, R.; Hao, Y. Experimental observation of linear and rotational Doppler shifts from several designer surfaces. Sci. Rep. 2019, 9, 8971. [Google Scholar] [CrossRef]
- Oort, J.H. Some Problems Concerning the Structure and Dynamics of the Galactic System and the Elliptical Nebulae NGC 3115 and 4494. Astrophys. J. 1940, 91, 273. [Google Scholar] [CrossRef]
- Rubin, V.C. The rotation of spiral galaxies. Science 1983, 220, 1339–1344. [Google Scholar] [CrossRef] [PubMed]
- El-Neaj, Y.A.; Alpigiani, C.; Amairi-Pyka, S.; Araújo, H.; Balaž, A.; Bassi, A.; Bathe-Peters, L.; Battelier, B.; Belić, A.; Bentine, E.; et al. AEDGE: Atomic experiment for dark matter and gravity exploration in space. EPJ Quantum Technol. 2020, 7, 1–27. [Google Scholar] [CrossRef]
- Milgrom, M. A modification of the Newtonian dynamics as a possible alternative to the hidden mass hypothesis. Astrophys. J. 1983, 270, 365–370. [Google Scholar] [CrossRef]
- Sanders, R. Mass discrepancies in galaxies: Dark matter and alternatives. Astron. Astrophys. Rev. 1990, 2, 1–28. [Google Scholar] [CrossRef]
- Capozziello, S.; De Laurentis, M. The dark matter problem from f (R) gravity viewpoint. Ann. Phys. 2012, 524, 545–578. [Google Scholar] [CrossRef]
- Chadwick, E.A.; Hodgkinson, T.F.; McDonald, G.S. Gravitational theoretical development supporting MOND. Phys. Rev. D 2013, 88, 024036. [Google Scholar] [CrossRef]
- Farnes, J.S. A unifying theory of dark energy and dark matter: Negative masses and matter creation within a modified ΛCDM framework. Astron. Astrophys. 2018, 620, A92. [Google Scholar] [CrossRef]
- Rivera, P.C. An Alternative Model of Rotation Curve that Explains Anomalous Orbital Velocity, Mass Discrepancy and Structure of Some Galaxies. Am. J. Astron. Astrophys. 2020, 7, 73–79. [Google Scholar] [CrossRef]
- Nagao, S. Galactic Evolution Showing a Constant Circulating Speed of Stars in a Galactic Disc without Requiring Dark Matter. Rep. Adv. Phys. Sci. 2020, 4, 2050004. [Google Scholar] [CrossRef]
- Blake, B.C. Relativistic Beaming of Gravity and the Missing Mass Problem. J. Cosmol. 2022, 26, 15390–15409. [Google Scholar]
- Gomel, R.; Zimmerman, T. The Effects of Inertial Forces on the Dynamics of Disk Galaxies. Galaxies 2021, 9, 34. [Google Scholar] [CrossRef]
- Skordis, C.; Złośnik, T. New relativistic theory for modified Newtonian dynamics. Pattern Recognit. Lett. 2021, 127, 161302. [Google Scholar] [CrossRef] [PubMed]
- Larin, S.A. Towards the Explanation of Flatness of Galaxies Rotation Curves. Universe 2022, 8, 632. [Google Scholar] [CrossRef]
- Mannheim, P.D. Alternatives to dark matter and dark energy. Prog. Part. Nucl. Phys. 2006, 56, 340–445. [Google Scholar] [CrossRef]
- Kroupa, P. The dark matter crisis: Falsification of the current standard model of cosmology. Publ. Astron. Soc. Aust. 2012, 29, 395–433. [Google Scholar] [CrossRef]
- Kroupa, P.; Pawlowski, M.; Milgrom, M. The failures of the standard model of cosmology require a new paradigm. Int. J. Mod. Phys. D 2012, 21, 1230003. [Google Scholar] [CrossRef]
- Kroupa, P. Galaxies as simple dynamical systems: Observational data disfavor dark matter and stochastic star formation. Can. J. Phys. 2015, 93, 169–202. [Google Scholar] [CrossRef]
- Arun, K.; Gudennavar, S.; Sivaram, C. Dark matter, dark energy, and alternate models: A review. Adv. Space Res. 2017, 60, 166–186. [Google Scholar] [CrossRef]
- Akerib, D.S.; Alsum, S.; Araújo, H.M.; Bai, X.; Bailey, A.J.; Balajthy, J.; Beltrame, P.; Bernard, E.P.; Bernstein, A.; Biesiadzinski, T.P.; et al. Results from a Search for Dark Matter in the Complete LUX Exposure. Phys. Rev. Lett. 2017, 118, 021303. [Google Scholar] [CrossRef]
- Bertone, G.; Tait, T.M. A new era in the search for dark matter. Nature 2018, 562, 51–56. [Google Scholar] [CrossRef]
- Aprile, E.; Aalbers, J.; Agostini, F.; Alfonsi, M.; Althueser, L.; Amaro, F.D.; Anthony, M.; Arneodo, F.; Baudis, L.; Bauermeister, B.; et al. Dark Matter Search Results from a One Ton-Year Exposure of XENON1T. Phys. Rev. Lett. 2018, 121, 111302. [Google Scholar] [CrossRef] [PubMed]
- Skordis, C.; Złośnik, T. Gravitational alternatives to dark matter with tensor mode speed equaling the speed of light. Phys. Rev. D 2019, 100, 104013. [Google Scholar] [CrossRef]
- Sivaram, C.; Arun, K.; Rebecca, L. MOND, MONG, MORG as alternatives to dark matter and dark energy, and consequences for cosmic structures. J. Astrophys. Astron. 2020, 41, 1–6. [Google Scholar] [CrossRef]
- Hofmeister, A.M.; Criss, R.E. Debate on the Physics of Galactic Rotation and the Existence of Dark Matter. Galaxies 2020, 8, 54. [Google Scholar] [CrossRef]
- Byrd, G.; Howard, S. Spiral galaxies when disks dominate their halos (using arm pitches and rotation curves). J. Wash. Acad. Sci. 2021, 107, 1. [Google Scholar]
- Haslbauer, M.; Banik, I.; Kroupa, P.; Wittenburg, N.; Javanmardi, B. The high fraction of thin disk galaxies continues to challenge ΛCDM cosmology. Astrophys. J. 2022, 925, 183. [Google Scholar] [CrossRef]
- Haslbauer, M.; Kroupa, P.; Zonoozi, A.H.; Haghi, H. Has JWST already falsified dark-matter-driven galaxy formation? Astrophys. J. Lett. 2022, 939, L31. [Google Scholar] [CrossRef]
- Shamir, L. A Simple Direct Empirical Observation of Systematic Bias of the Redshift as a Distance Indicator. Universe 2024, 10, 129. [Google Scholar] [CrossRef]
- Buta, R.J.; Byrd, G.G.; Freeman, T. The ringed spiral galaxy NGC 4622. I. Photometry, kinematics, and the case for two strong leading outer spiral arms. Astron. J. 2003, 125, 634. [Google Scholar] [CrossRef]
- Shamir, L. Ganalyzer: A tool for automatic galaxy image analysis. Astrophys. J. 2011, 736, 141. [Google Scholar] [CrossRef]
- Shamir, L. Ganalyzer: A tool for automatic galaxy image analysis. ASCL 2011, ascl:1105.011. [Google Scholar]
- Davis, D.R.; Hayes, W.B. SpArcFiRe: Scalable Automated Detection of Spiral Galaxy Arm Segments. Astrophys. J. 2014, 790, 87. [Google Scholar] [CrossRef]
- Davis, D.; Hayes, W. SpArcFiRe: SPiral ARC FInder and REporter. Astrophys. Source Code Libr. 2021, ascl:2107.010. [Google Scholar]
- Lintott, C.J.; Schawinski, K.; Slosar, A.; Land, K.; Bamford, S.; Thomas, D.; Raddick, M.J.; Nichol, R.C.; Szalay, A.; Andreescu, D.; et al. Galaxy Zoo: Morphologies derived from visual inspection of galaxies from the Sloan Digital Sky Survey. Mon. Not. R. Astron. Soc. 2008, 389, 1179–1189. [Google Scholar] [CrossRef]
- Hayes, W.B.; Davis, D.; Silva, P. On the nature and correction of the spurious S-wise spiral galaxy winding bias in Galaxy Zoo 1. Mon. Not. R. Astron. Soc. 2017, 466, 3928–3936. [Google Scholar] [CrossRef]
- Shamir, L. Analysis of the alignment of non-random patterns of spin directions in populations of spiral galaxies. Particles 2021, 4, 11–28. [Google Scholar] [CrossRef]
- Shamir, L. Analysis of spin directions of galaxies in the DESI Legacy Survey. Mon. Not. R. Astron. Soc. 2022, 516, 2281–2291. [Google Scholar] [CrossRef]
- Longo, M.J. Detection of a Dipole in the Handedness of Spiral Galaxies with Redshifts z 0.04. Phys. Lett. B 2011, 699, 224–229. [Google Scholar] [CrossRef]
- Zwicky, F. On the redshift of spectral lines through interstellar space. Proc. Natl. Acad. Sci. USA 1929, 15, 773–779. [Google Scholar] [CrossRef] [PubMed]
- Yourgrau, W.; Woodward, J. Tired light and the missing mass problem. Acta Phys. Acad. Sci. Hung. 1971, 30, 323–329. [Google Scholar] [CrossRef]
- Vigier, J.P. Cosmological Implications of Non-Velocity Redshifts—A Tired-Light Mechanism. In Cosmology, History, and Theology; Springer: Berlin/Heidelberg, Germany, 1977; pp. 141–157. [Google Scholar]
- Shao, M.H. The energy loss of photons and cosmological redshift. Phys. Essays 2013, 26, 183–190. [Google Scholar] [CrossRef]
- Kragh, H. Is the universe expanding? Fritz Zwicky and early tired-light hypotheses. J. Astron. Hist. Herit. 2017, 20, 2–12. [Google Scholar] [CrossRef]
- Shao, M.H.; Wang, N.; Gao, Z.F. Tired light denies the big bang. In Redefining Standard Model Cosmology; IntechOpen: London, UK, 2018; pp. 13–29. [Google Scholar]
- Sato, M. Tired light: An alternative interpretation of the accelerating universe. Phys. Essays 2019, 32, 43–47. [Google Scholar] [CrossRef]
- LaViolette, P.A. Expanding or static Universe: Emergence of a new paradigm. Int. J. Astron. Astrophys. 2021, 11, 190–231. [Google Scholar] [CrossRef]
- Lopez-Corredoira, M. History and Problems of the Standard Model in Cosmology. arXiv 2023, arXiv:2307.10606. [Google Scholar]
- Gupta, R.P. On Dark Matter and Dark Energy in CCC+ TL Cosmology. Universe 2024, 10, 266. [Google Scholar] [CrossRef]
- Shamir, L. Galaxy spin direction asymmetry in JWST deep fields. Publ. Astron. Soc. Aust. 2024, 41, e038. [Google Scholar] [CrossRef]
- Shamir, L. Patterns of galaxy spin directions in SDSS and Pan-STARRS show parity violation and multipoles. Astrophys. Space Sci. 2020, 365, 136. [Google Scholar] [CrossRef]
- Shamir, L. Large-scale asymmetry in galaxy spin directions: Analysis of galaxies with spectra in DES, SDSS, and DESI Legacy Survey. Astron. Notes 2022, 343, e20220010. [Google Scholar] [CrossRef]
- Stodden, V.; Seiler, J.; Ma, Z. An empirical analysis of journal policy effectiveness for computational reproducibility. Proc. Natl. Acad. Sci. USA 2018, 115, 2584–2589. [Google Scholar] [CrossRef] [PubMed]
- Baker, M. Reproducibility crisis. Nature 2016, 533, 353–366. [Google Scholar]
- Miyakawa, T. No raw data, no science: Another possible source of the reproducibility crisis. Mol. Brain 2020, 13, 24. [Google Scholar] [CrossRef]
- Sayre, F.; Riegelman, A. The reproducibility crisis and academic libraries. Coll. Res. Libr. 2018, 79, 2. [Google Scholar] [CrossRef]
- Ball, P. Is AI leading to a reproducibility crisis in science? Nature 2023, 624, 22–25. [Google Scholar] [CrossRef]
- Opik, E. An estimate of the distance of the Andromeda Nebula. Astrophys. J. 1922, 55, 406–410. [Google Scholar] [CrossRef]
- Babcock, H.W. The rotation of the Andromeda Nebula. Lick Obs. Bull. 1939, 19, 41–51. [Google Scholar] [CrossRef]
- Rubin, V.C.; Ford, W.K., Jr. Rotation of the Andromeda nebula from a spectroscopic survey of emission regions. Astrophys. J. 1970, 159, 379. [Google Scholar] [CrossRef]
- Rubin, V.C.; Ford, W.K., Jr.; Thonnard, N. Extended rotation curves of high-luminosity spiral galaxies. IV-Systematic dynamical properties, SA through SC. Astrophys. J. 1978, 225, L107–L111. [Google Scholar] [CrossRef]
- Rubin, V.C.; Ford, W.K., Jr.; Thonnard, N. Rotational properties of 21 SC galaxies with a large range of luminosities and radii, from NGC 4605/R= 4kpc/to UGC 2885/R= 122 kpc. Astrophys. J. 1980, 238, 471–487. [Google Scholar] [CrossRef]
- Rubin, V.C.; Burstein, D.; Ford, W.K., Jr.; Thonnard, N. Rotation velocities of 16 Sa galaxies and a comparison of Sa, Sb, and Sc rotation properties. Astrophys. J. 1985, 289, 81–98. [Google Scholar] [CrossRef]
- Sofue, Y.; Rubin, V. Rotation curves of spiral galaxies. Annu. Rev. Astron. Astrophys. 2001, 39, 137–174. [Google Scholar] [CrossRef]
- Khetan, N.; Izzo, L.; Branchesi, M.; Wojtak, R.; Cantiello, M.; Murugeshan, C.; Agnello, A.; Cappellaro, E.; Della Valle, M.; Gall, C.; et al. A new measurement of the Hubble constant using Type Ia supernovae calibrated with surface brightness fluctuations. Astron. Astrophys. 2021, 647, A72. [Google Scholar] [CrossRef]
- McAdam, D.; Shamir, L. Asymmetry between galaxy apparent magnitudes shows a possible tension between physical properties of galaxies and their rotational velocity. Symmetry 2023, 15, 1190. [Google Scholar] [CrossRef]
- Vagnozzi, S. Seven hints that early-time new physics alone is not sufficient to solve the Hubble tension. Universe 2023, 9, 393. [Google Scholar] [CrossRef]
- Javanmardi, B.; Porciani, C.; Kroupa, P.; Pflam-Altenburg, J. Probing the isotropy of cosmic acceleration traced by type Ia supernovae. Astrophys. J. 2015, 810, 47. [Google Scholar] [CrossRef]
- Krishnan, C.; Mohayaee, R.; Colgáin, E.Ó.; Sheikh-Jabbari, M.; Yin, L. Hints of FLRW breakdown from supernovae. Phys. Rev. D 2022, 105, 063514. [Google Scholar] [CrossRef]
- Cowell, J.A.; Dhawan, S.; Macpherson, H.J. Potential signature of a quadrupolar Hubble expansion in Pantheon+ supernovae. arXiv 2022, arXiv:2212.13569. [Google Scholar] [CrossRef]
- McConville, R.; Colgain, E. Anisotropic distance ladder in Pantheon+ supernovae. arXiv 2023, arXiv:2304.02718. [Google Scholar]
- Aluri, P.K.; Cea, P.; Chingangbam, P.; Chu, M.C.; Clowes, R.G.; Hutsemékers, D.; Kochappan, J.P.; Krasiński, A.; Lopez, A.M.; Liu, L.; et al. Is the observable Universe consistent with the cosmological principle? Class. Quantum Gravity 2023, 40, 094001. [Google Scholar] [CrossRef]
- d’Assignies D, W.; Chisari, N.E.; Hamaus, N.; Singh, S. Intrinsic alignments of galaxies around cosmic voids. Mon. Not. R. Astron. Soc. 2022, 509, 1985–1994. [Google Scholar] [CrossRef]
- Kraljic, K.; Davé, R.; Pichon, C. And yet it flips: Connecting galactic spin and the cosmic web. Mon. Not. R. Astron. Soc. 2020, 493, 362–381. [Google Scholar] [CrossRef]
- Ebrahimian, E.; Krishnan, C.; Mondol, R.; Sheikh-Jabbari, M. Towards a realistic dipole cosmology: The dipole ΛCDM model. arXiv 2023, arXiv:2305.16177. [Google Scholar]
- Krishnan, C.; Mondol, R.; Sheikh-Jabbari, M. A Tilt Instability in the Cosmological Principle. arXiv 2022, arXiv:2211.08093. [Google Scholar] [CrossRef]
- Allahyari, A.; Ebrahimian, E.; Mondol, R.; Sheikh-Jabbari, M. Big Bang in Dipole Cosmology. arXiv 2023, arXiv:2307.15791. [Google Scholar]
- Krishnan, C.; Mondol, R.; Sheikh-Jabbari, M. Dipole cosmology: The Copernican paradigm beyond FLRW. J. Cosmol. Astropart. Phys. 2023, 2023, 020. [Google Scholar] [CrossRef]
- Krishnan, C.; Mondol, R.; Jabbari, M.S. Copernican paradigm beyond FLRW. Symmetry 2023, 15, 428. [Google Scholar] [CrossRef]
- Gödel, K. An example of a new type of cosmological solutions of Einstein’s field equations of gravitation. Rev. Mod. Phys. 1949, 21, 447. [Google Scholar] [CrossRef]
- Ozsváth, I.; Schücking, E. Finite rotating universe. Nature 1962, 193, 1168–1169. [Google Scholar] [CrossRef]
- Gödel, K. Rotating universes in general relativity theory. Gen. Relativ. Gravit. 2000, 32, 1419–1427. [Google Scholar] [CrossRef]
- Chechin, L. Rotation of the Universe at different cosmological epochs. Astron. Rep. 2016, 60, 535–541. [Google Scholar] [CrossRef]
- Campanelli, L. A conjecture on the neutrality of matter. Found. Phys. 2021, 51, 56. [Google Scholar] [CrossRef]
- Pathria, R. The universe as a black hole. Nature 1972, 240, 298–299. [Google Scholar] [CrossRef]
- Stuckey, W. The observable universe inside a black hole. Am. J. Phys. 1994, 62, 788–795. [Google Scholar] [CrossRef]
- Easson, D.A.; Brandenberger, R.H. Universe generation from black hole interiors. J. High Energy Phys. 2001, 2001, 024. [Google Scholar] [CrossRef]
- Popławski, N.J. Radial motion into an Einstein–Rosen bridge. Phys. Lett. B 2010, 687, 110–113. [Google Scholar] [CrossRef]
- Christillin, P. The Machian origin of linear inertial forces from our gravitationally radiating black hole Universe. Eur. Phys. J. Plus 2014, 129, 1–3. [Google Scholar] [CrossRef]
- Dymnikova, I. Universes Inside a Black Hole with the de Sitter Interior. Universe 2019, 5, 111. [Google Scholar] [CrossRef]
- Chakrabarty, H.; Abdujabbarov, A.; Malafarina, D.; Bambi, C. A toy model for a baby universe inside a black hole. Eur. Phys. J. C 2020, 80, 1–10. [Google Scholar] [CrossRef]
- Popławski, N.J. A nonsingular, anisotropic universe in a black hole with torsion and particle production. Gen. Relativ. Gravit. 2021, 53, 1–14. [Google Scholar] [CrossRef]
- Gaztanaga, E. The Black Hole Universe, part I. Symmetry 2022, 14, 1849. [Google Scholar] [CrossRef]
- Gaztanaga, E. The Black Hole Universe, Part II. Symmetry 2022, 14, 1984. [Google Scholar] [CrossRef]
- Campanelli, L.; Cea, P.; Tedesco, L. Ellipsoidal universe can solve the cosmic microwave background quadrupole problem. Phys. Rev. Lett. 2006, 97, 131302. [Google Scholar] [CrossRef]
- Campanelli, L.; Cea, P.; Tedesco, L. Cosmic microwave background quadrupole and ellipsoidal universe. Phys. Rev. D 2007, 76, 063007. [Google Scholar] [CrossRef]
- Gruppuso, A. Complete statistical analysis for the quadrupole amplitude in an ellipsoidal universe. Phys. Rev. D 2007, 76, 083010. [Google Scholar] [CrossRef]
- Campanelli, L.; Cea, P.; Fogli, G.; Tedesco, L. Cosmic parallax in ellipsoidal universe. Mod. Phys. Lett. A 2011, 26, 1169–1181. [Google Scholar] [CrossRef]
- Cea, P. The ellipsoidal universe in the Planck satellite era. Mon. Not. R. Astron. Soc. 2014, 441, 1646–1661. [Google Scholar] [CrossRef]


Disclaimer/Publisher’s Note: The statements, opinions and data contained in all publications are solely those of the individual author(s) and contributor(s) and not of MDPI and/or the editor(s). MDPI and/or the editor(s) disclaim responsibility for any injury to people or property resulting from any ideas, methods, instructions or products referred to in the content. |
© 2024 by the author. Licensee MDPI, Basel, Switzerland. This article is an open access article distributed under the terms and conditions of the Creative Commons Attribution (CC BY) license (https://creativecommons.org/licenses/by/4.0/).