Abstract
The Cryo-PoF project is an R&D project funded by the Italian Insitute for Nuclear Research (INFN) in Milano-Bicocca (Italy). The technology at the basis of the project is Power over Fiber (PoF). By sending laser light through an optical fiber, this technology delivers electrical power to a photovoltaic power converter, in order to power sensors or electrical devices. Among the several advantages this solution can provide, we can underline the spark-free operation when electric fields are present, the removal of noise induced by power lines, the absence of interference with electromagnetic fields, and robustness in hostile environments. R&D for the application of PoF in cryogenic environments started at Fermilab in 2020; for the DUNE Vertical Drift detector, it was needed to operate the Photon Detector System on a high-voltage cathode surface. Cryo-PoF, starting from this project, developed a single-laser input line system to power, at cryogenic temperatures, both an electronic amplifier and Photon Detection devices, tuning their bias by means of the input laser power, without adding ancillary fibers. The results obtained in Milano-Bicocca will be discussed, presenting the tests performed using power photosensors at liquid nitrogen temperature.
1. Introduction
Power over Fiber (PoF) is a technology, already employed at the industrial level, which, in order to power sensors and electrical devices, transmits laser power over a non-conductive optical fiber to an Optical Power Converter (OPC) [1]. R&D for the application of PoF at cryogenic temperatures started at Fermilab (USA) in 2020, motivated by the needs of the DUNE Vertical Drift (VD) detector [2]; the Photon Detection System of the DUNE VD module is supposed to operate on a high-voltage cathode surface, a prohibitive condition for using copper cables [3].
Thanks to the non-conductivity of optical fibres, PoF offers high robustness in a hostile environment and no interference with electromagnetic fields, together with other several advantages, like the removal of noise induced by standard power lines and spark-free operation. The Cryo-PoF project aims to power both photosensors (SiPMs) and their cold electronics, using a single PoF line and to tune SiPMs voltage bias as a function of the laser power. In this paper, we will describe a Cryo-PoF setup and the results obtained with 20 SiPMs at Milano-Bicocca laboratory. Other results of the Cryo-PoF project can be found in [4].
2. The Cryo-PoF Setup
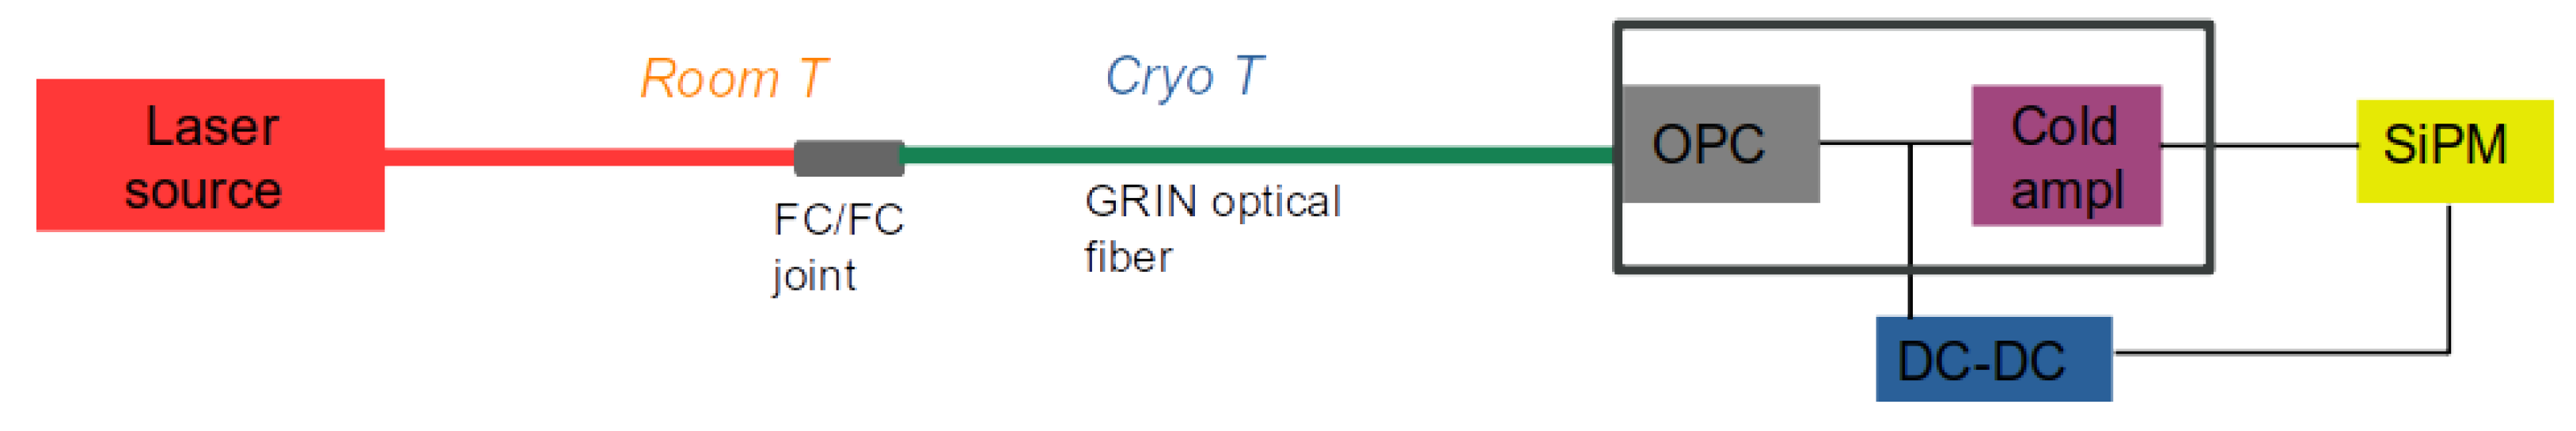
The Cryo-PoF setup is schematised in Figure 1 and it is mainly composed of a laser source, the OPC, the electronic board, and the photosensors. The starting point is the laser source, which is directly connected, through an FC/FC joint and an optical fiber, to the OPC. The OPC, together with the cold amplifier, is mounted on the electronic board; it powers the DC-DC boost converter, the photosensors and the amplifier.

Figure 1.
Schematic representation of the Cryo-PoF setup. The laser light power is transformed into electrical power by the OPC. The OPC is the power source for the DC-DC boost converter, the SiPM, and the cold amplifier. The laser source is at room temperature, while the the other elements are at cryogenic temperatures.
The laser source is a 808 nm GaAs laser, manufactured by Broadcom , directly connected to a graded index multimode optical fiber with a 62.5 µm core diameter and numerical aperture of 0.27 [5]. The laser wavelength was selected to be as far as possible from the SiPMs’ photon detection efficiency peak (500 nm [6]), ensuring good power and efficiency for our purposes. The laser output power can be tuned by means of the applied input current. We characterized the laser source at room temperature, in terms of linearity, power losses, and stability over time, recording information from an additional connected optical fiber. To prevent possible light leakage, we used a graded index optical fiber with a 62.5 µm core diameter and numerical aperture of 0.27, with a black reinforced 3.8 mm diameter Furcation Tubing. Furcation Tubings consist of an outer PVC jacket, KevlarTM protective threads, a polypropylene inner fiber tube, and a pull string for fiber insertion. The KevlarTM threads that surround the inner tube protect the fiber from damage by cushioning any impact incurred by the PVC outer jacket. The jacket suffered no damage after various thermal cycles in liquid nitrogen. We measured approx. 4.5% power loss associated with the use of an FC/FC joint and the additional fiber. Registering the laser power for 2 h with fixed input power P0 ∼ 1 W, we found a quite stable output over time: with an average difference of Mean (P0 – Pi) = 17.1 mW, where Pi is the power registered at time i. We notice unstable behaviour during the first 30 min of operation; if we exclude this time from the calculation, we found the following: and Mean (P0 – Pi) = 15.9 mW (see Figure 2).
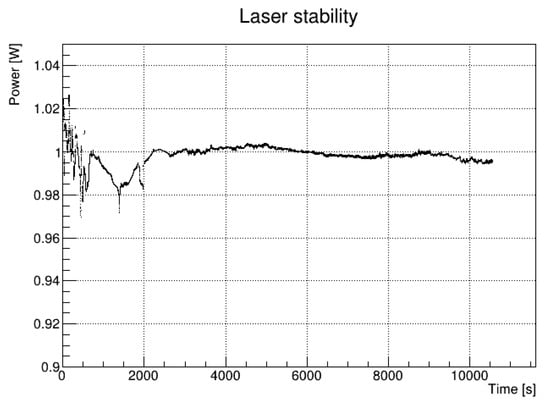
Figure 2.
Laser power stability with fixed input power P0 ∼ 1 W. with an average difference of Mean (P0 – ) = 17.1 mW, where is the power registered at time i. If the first 30 min of operation are excluded, and Mean (P0 – ) = 15.9 mW are found.
The OPC, manufactured by BroadcomTM, is the key component of the PoF line [7]. This device transforms the laser light into voltage up to 7 V. We tested its performance, evaluating the maximum power and current output both at room and cryogenic temperatures (liquid nitrogen and liquid argon) for different power . We measured the current versus voltage (IV) curve by means of a KeithleyTM 4200A-SCS semiconductor parameter analyser. The efficiency at room temperature is 50%, with a maximum current delivered of 91.4 mA, while at cryogenic temperatures, the efficiency is lower at 30%, with a maximum current of = 82.4 mA [4].
The OPC is mounted on the electronic board and its output voltage powers the SiPM cold amplifier, the DC-DC boost converter, and the SiPM.
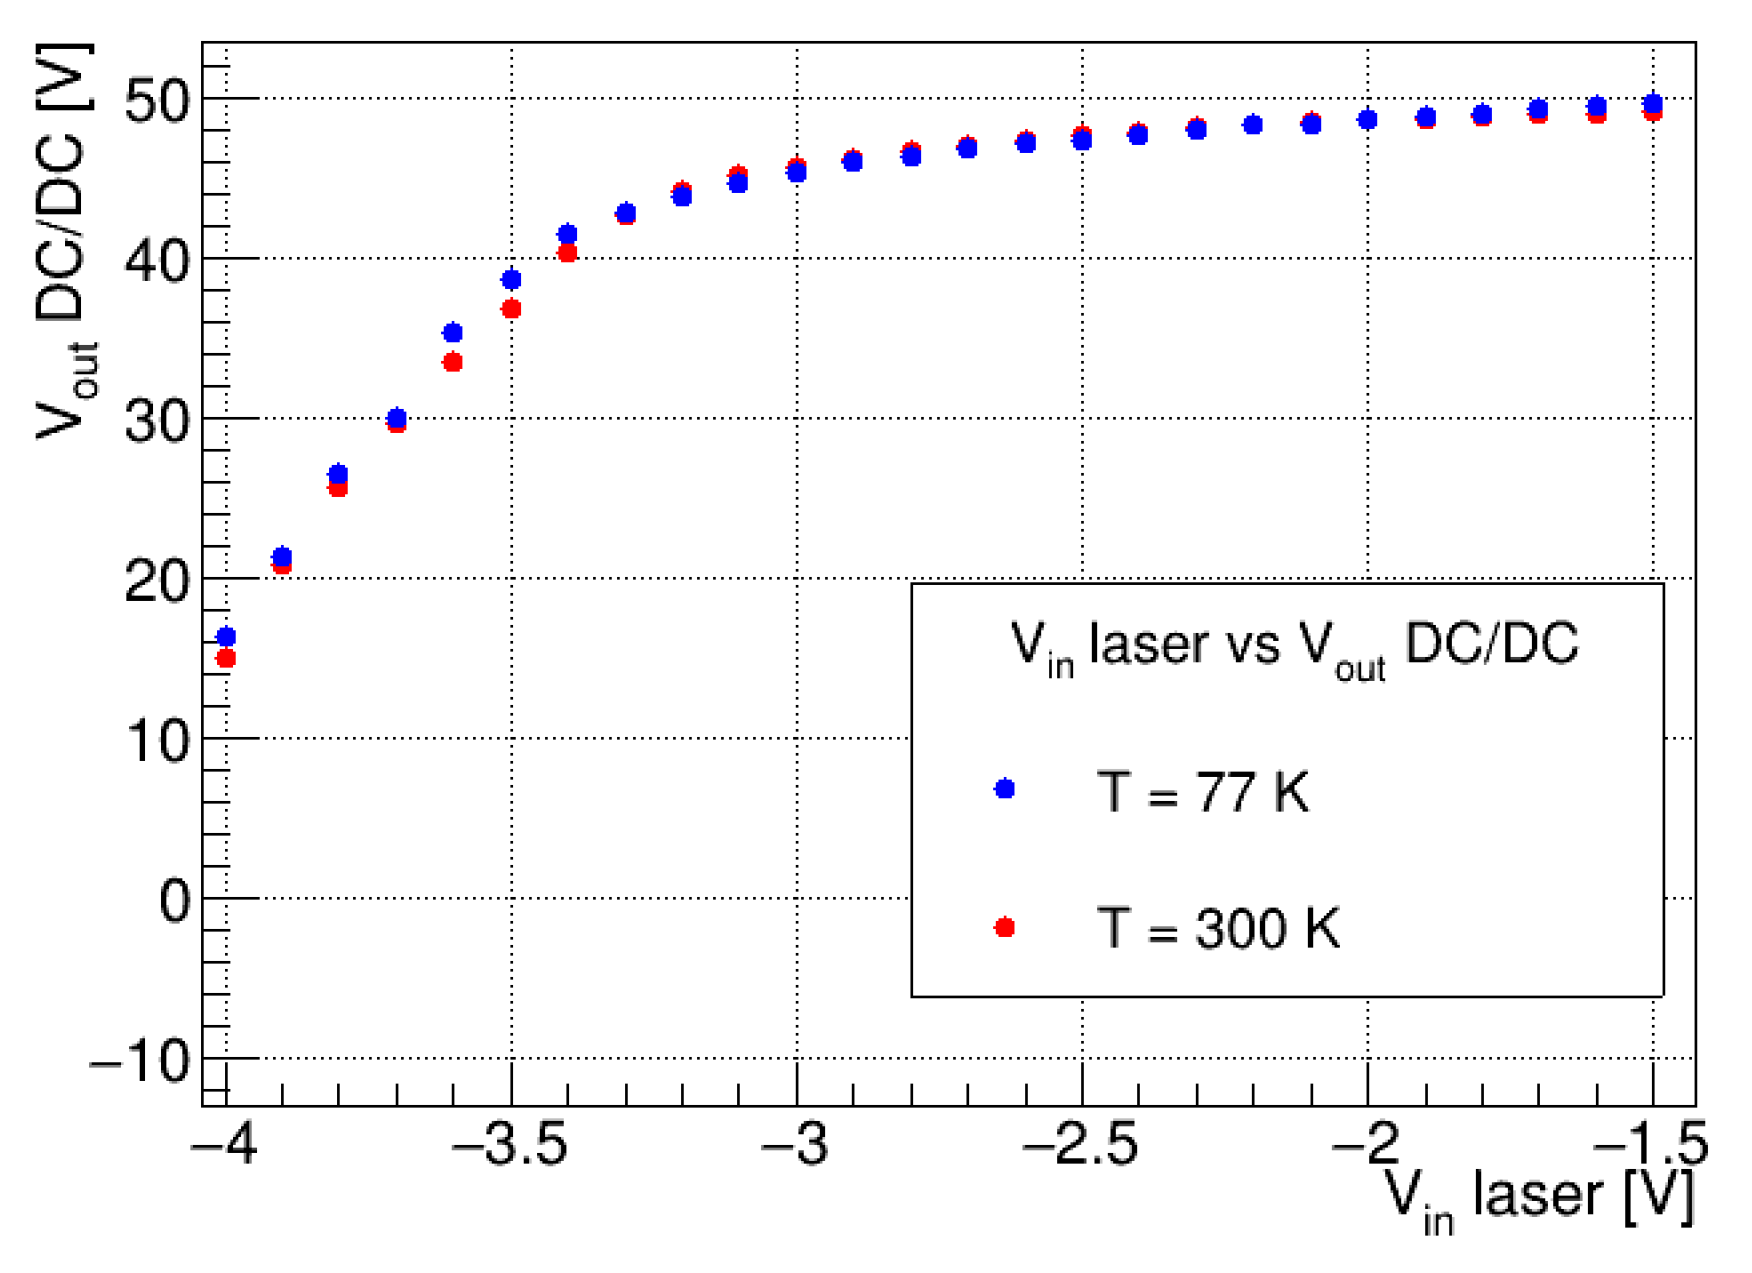
The DC-DC boost converter was developed by the INFN Milano group and it boosts the OPC output voltage to the desired SiPM bias [8]. It required an input voltage () of approx. ∼ 5 V, with an output voltage () between 40 V and 50 V and a power consumption of ∼100 mW, at liquid nitrogen temperature, to give the required bias to the SiPM model used in the test. As shown in Figure 3, the DC-DC can be set as a function of the laser power, i.e, of its input voltage .
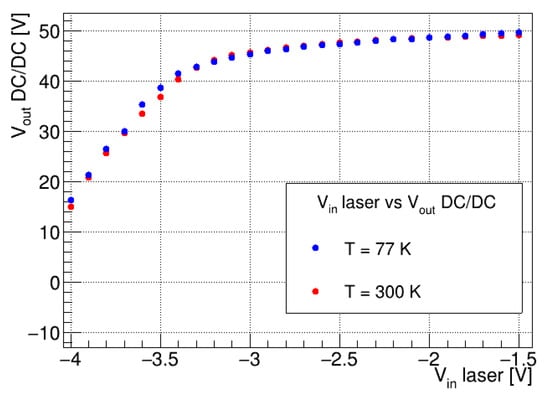
Figure 3.
DC-DC as a function of the input laser power: the laser power is proportional to the applied input voltage (laser). The blue dots corresponds to the test in liquid nitrogen, while the red one corresponds to the test at room temperature.
The cold amplifier was developed by the DUNE Milano Biccoca group [9]. It requires = 3.3 V as input, coming directly from the OPC, and it amplifies the SiPMs output signal. Its power consumption is 2.4 mW per channel.
3. Tests with Photosensors
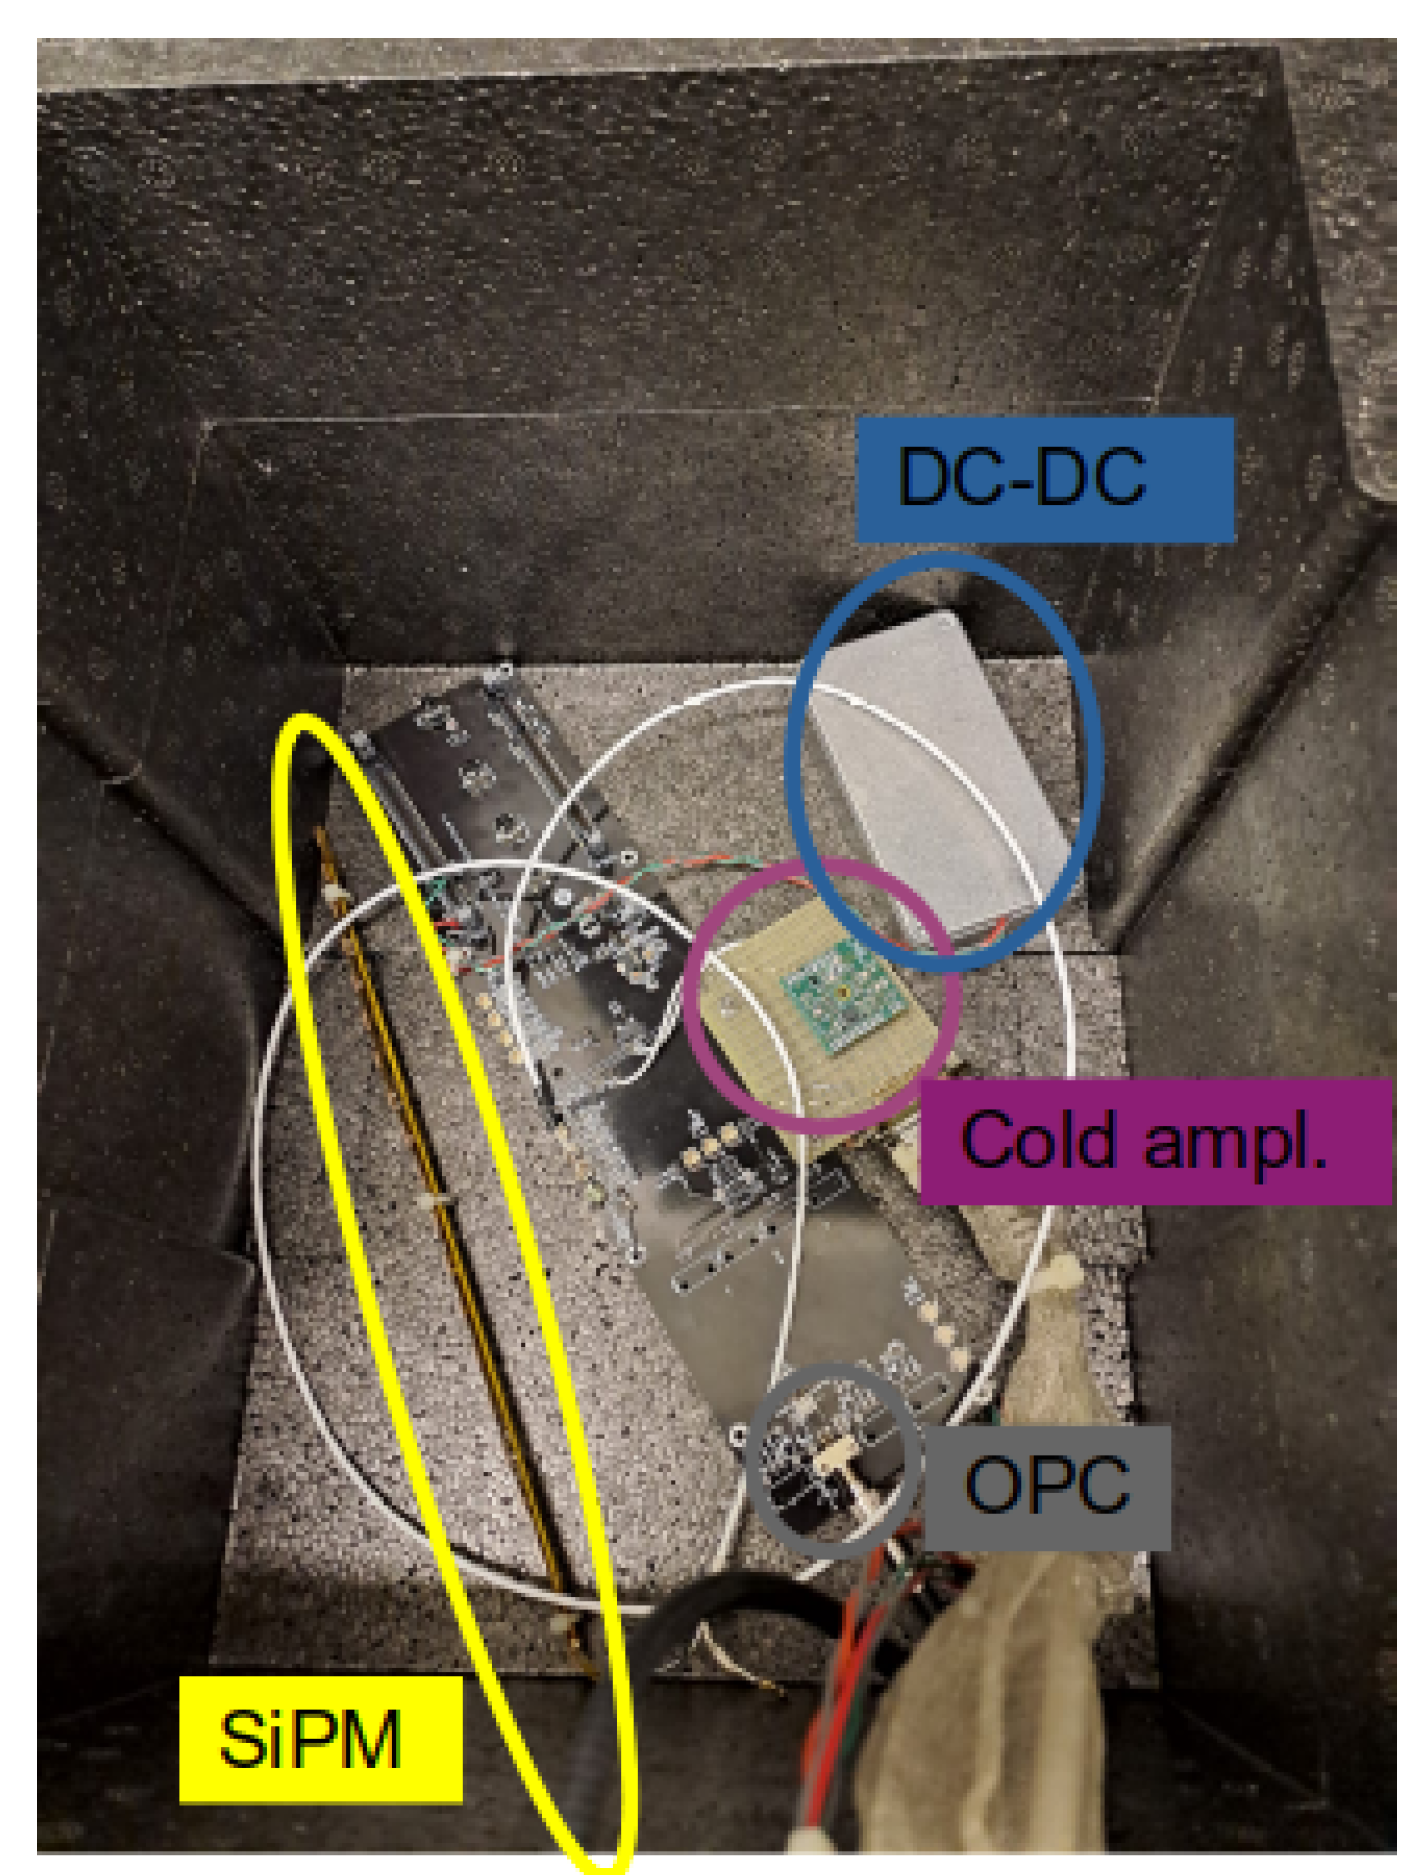
We tested the performance of the Cryo-PoF line powering 20 HamamatsuTM SiPMs in a liquid nitrogen bath (see Figure 4). To reduce the induced noise, the DC-DC is placed in a metal box. The SiPM used for these tests is the HamamatsuTM S13360-9935- 75 µm-HQR, specifically developed by Hamamatsu for the DUNE experiment, with a breakdown voltage of = 42.0 V at cryogenic temperatures [6].

Figure 4.
A picture of the Cryo-PoF electronic board to be immersed in the liquid nitrogen bath: the OPC (gray), the amplifier (purple), the DC-DC box (blue), and the 20 SIPMs (yellow) are highlighted.
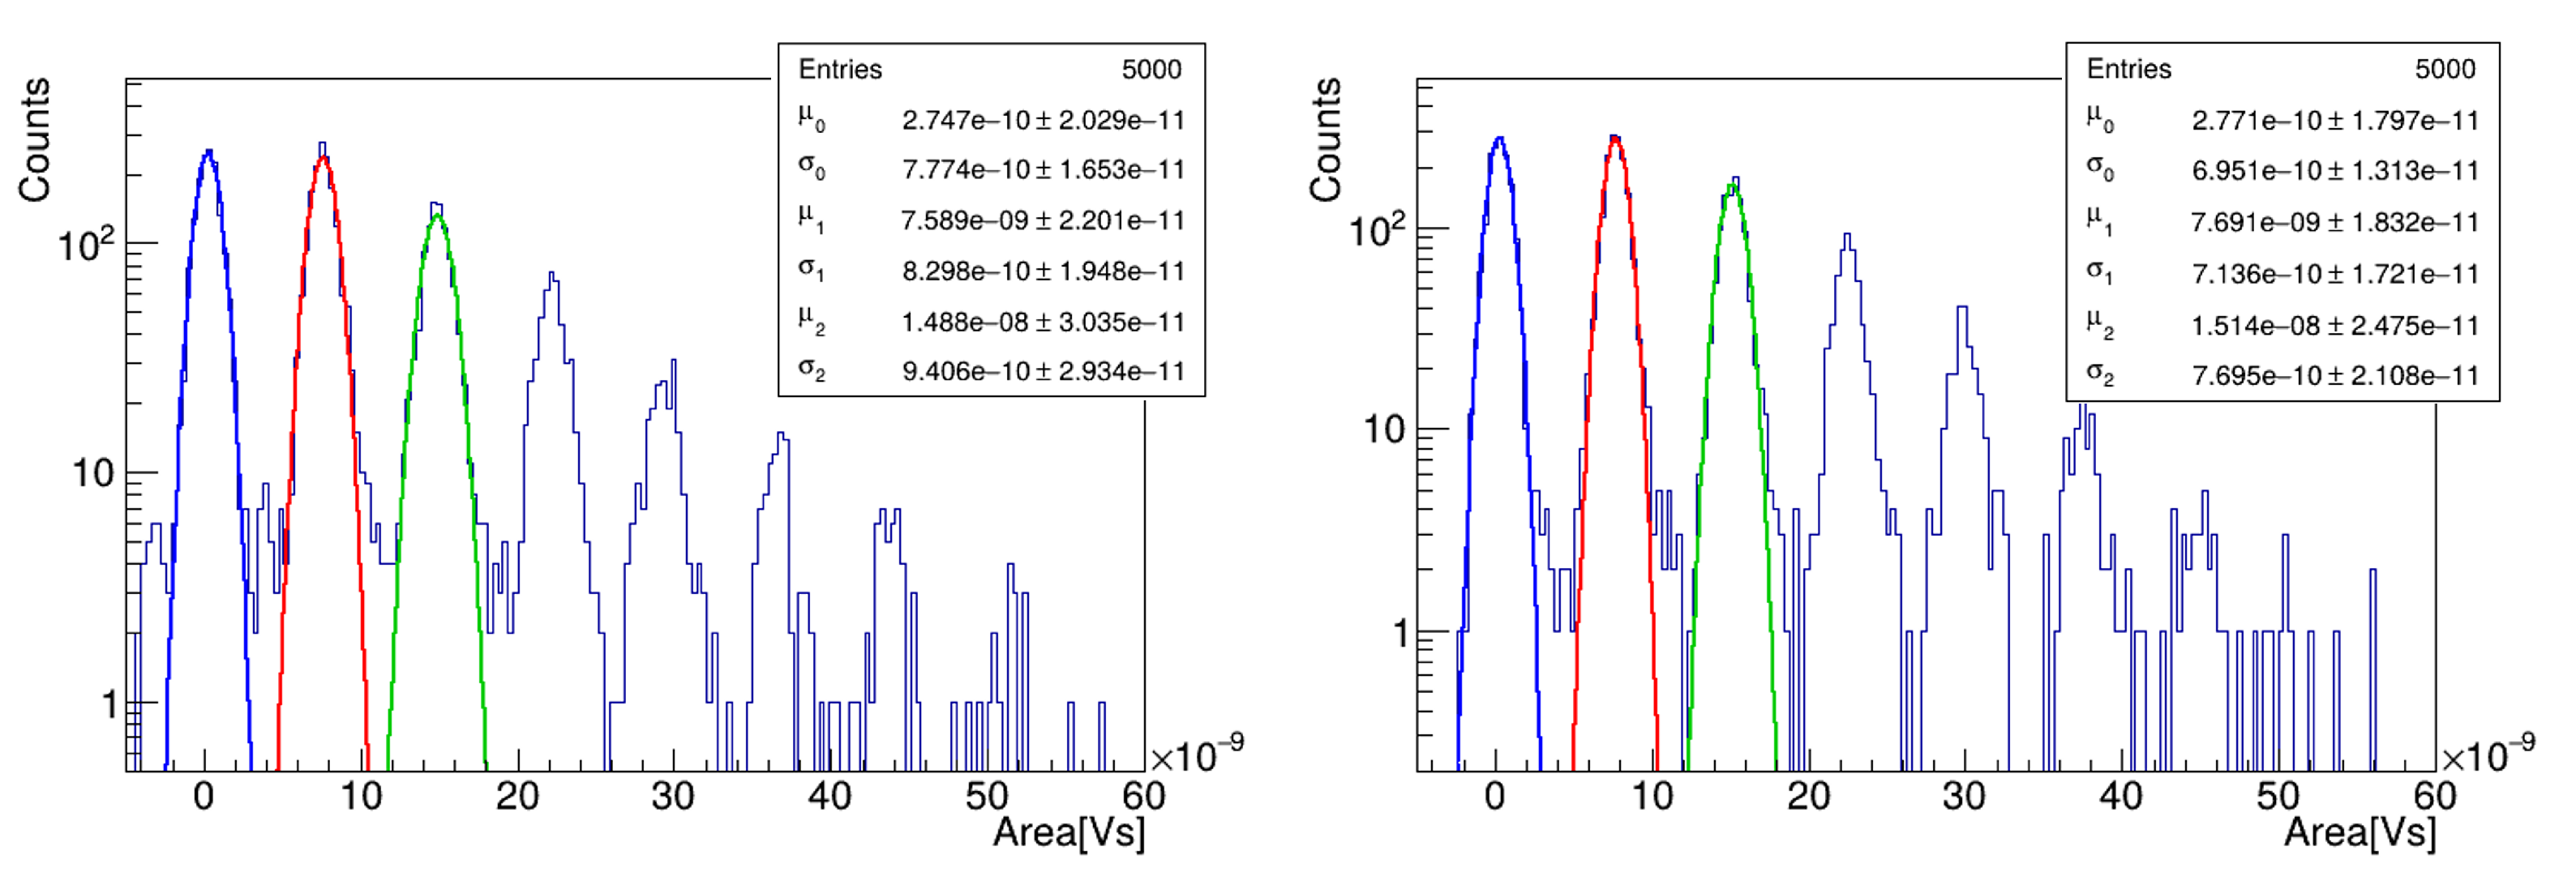
In order to evaluate the Cryo-PoF performance, we powered the system both with standard copper cables and with the Cryo-PoF system. SiPMs were illuminated by a LED light; the amount of light was chosen to have around one or twp photons detected by the SiPM. Three different overvoltages (OVs) were used: 45 V, 46 V, and 47 V. For each OV, 5 k waveforms were registered. In Figure 5, the photoelectron spectra obtained with the two configurations are shown: each waveform is integrated in a time window of 900 ns and the integral is plotted in an histogram. The resulting histogram is then fitted with a linear combination of three Gaussians. The Signal-to-Noise Ratio (SNR) is calculated as the ratio between the gain of the SiPM () and the width of the Gaussian noise (). As can be seen by the SNR result in Table 1, the performance of the PoF system are comparable with the copper cable ones. Residual noise from DC-DC probably weakened Cryo-PoF performance.
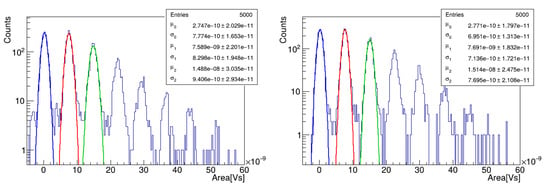
Figure 5.
Photoelectron spectra obtained reading out the 20 SiPMs, powered with Cryo-PoF (left) and a standard copper cable (right). Measurements were taken with V = 46 V, i.e., laser power of 1 W with the Cryo-PoF configuration. SiPMs were illuminated by an LED light; the amount of light was chosen to have around one or two photons detected by the SiPMs. In each histogram are plotted the integrals (time window of 900 ns) of 5 k waveform. The plots are fitted with a linear combination of three Gaussians; the peaks correspond to 0 (blue curve), 1 (red curve), and 2 (green curve) photoelectrons recorded.

Table 1.
Signal-to-Noise Ratio (SNR) of 20 Hamamatsu SiPMs, biased with standard copper cable and Cryo-PoF system, at three different overvoltages.
4. Conclusions
Cryo-PoF is an R&D project that is expected to replace standard copper cables with optical fibres in order to power sensors in physical experiments where the conditions are prohibitive, such us cryogenic environments and high voltage surfaces. The technology at the basis of the project is Power over Fiber (PoF): a laser light is delivered through an optical fiber to a photovoltaic power converter to produce electrical power. We tested the setup with photosensors in a cryogenic bath, using liquid argon detectors: the main goal was to power both the SiPM and cold amplifier, using a single Power over Fiber line. The goal was fully attained, since we were able to obtain signals from the SiPMs and to change their bias and overvoltage conditions by simply modifying the laser power. Comparing the performance values (in terms of Signal-to-Noise Ratio) of the SiPMs at different overvoltages with and without PoF, we obtained very promising results. This technology can be further improved, finding use in rare event physics and quantum computing once its performance at temperatures lower than liquid nitrogen temperature are investigated.
Author Contributions
Conceptualization, A.F. and M.T.; Formal analysis, A.F. and M.T.; Funding acquisition, M.T.; Investigation, A.F., A.A., E.J.C.M., C.G., L.M., M.T. and V.T.; Project administration, M.T.; Software, A.F., C.B., M.J.D.G. and M.T.; Supervision, M.L., G.P. and F.T.; Validation, A.F. and M.T.; Visualization, M.T.; Writing—original draft, A.F.; Writing—review & editing. All authors have read and agreed to the published version of the manuscript.
Funding
The project was funded by the Istituto Nazionale di Fisica Nucleare (Italy) by means of Grant “CSN5 Grant Giovani 2021” and by the Italian Ministry of University and Research under the project PRIN2020 ”Photon detection in Extreme Environments for Fundamental and Applied Physics”.
Data Availability Statement
The raw data supporting the conclusions of this article will be made available by the authors on request.
Acknowledgments
The authors are grateful to the Fermilab and BNL DUNE groups and the University of Parma for support and suggestions.
Conflicts of Interest
The authors declare no conflicts of interest.
References
- Werthen, J.G.; Widjaja, S.; Wu, T.C.; Liu, J. Power over fiber: A review of replacing copper by fiber in critical applications. Opt. Technol. Arming Safing Fuzing Firing 2005, 5871, 85–90. [Google Scholar]
- Pellico, W.; Arroyave, M.A.; Behera, B.; Cavanna, F.; Guo, F.; Heindel, A.; Jung, C.K.; Silverio, D.L.; Caicedo, D.M.; McGrew, C. Power over fiber development for HEP detectors. Nucl. Instrum. Meth. A 2024, 1068, 169880. [Google Scholar] [CrossRef]
- Abud, A.A.; Abi, B.; Acciarri, R.; Acero, M.A.; Adames, M.R.; Adamov, G.; Adamowski, M.; Adams, D.; Adinolfi, M.; Adriano, C. The DUNE Far Detector Vertical Drift Technology Technical Design Report. J. Instrum. 2024, 19, T08004. [Google Scholar] [CrossRef]
- Torti, M.; Andreani, A.; Brizzolari, C.; Carniti, P.; Morales, E.C.; Gonzales, M.D.; Falcone, A.; Gotti, C.; Lazzaroni, M.; Meazza, L.; et al. Results from Cryo-PoF: Power over fiber for fundamental and applied physics at cryogenic temperature. Nucl. Instrum. Meth. A 2024, 1068, 169753. [Google Scholar]
- Broadcom, 808-nm High-Power 2W Laser Module. Available online: https://docs.broadcom.com/docs/AFBR-POMEK2204-PB (accessed on 14 February 2023).
- Andreotti, M.; Bertolucci, S.; Branca, A.; Brizzolari, C.; Brunetti, G.; Calabrese, R.; Carniti, P.; Casazza, D.; Cattadori, C.; Calvo, E.; et al. Cryogenic characterization of Hamamatsu HWB MPPCs for the DUNE photon detection system. JINST 2024, 19, T01007. [Google Scholar] [CrossRef]
- Broadcom, AFBR-POC206L Optical Power Converter 6VDC, FC Port. Available online: https://docs.broadcom.com/doc/AFBR-POCxxxL-DS (accessed on 14 February 2023).
- Gallice, N.; Santoro, D.; Cova, P.; Delmonte, N.; Lazzaroni, M.; Sala, P.; Zani, A. Development of a cryogenic DC-DC Boost Converter: Devices characterization and first prototype measurements. In Proceedings of the 2022 IEEE International Instrumentation and Measurement Technology Conference (I2MTC), Ottawa, ON, Canada, 16–19 May 2022; pp. 1–6. [Google Scholar]
- Brizzolari, C.; Carniti, P.; Cattadori, C.; Cristaldo, E.; de la Torre Rojo, A.; Delgado, M.; Falcone, A.; Francis, K.; Gallice, N.; Gotti, C.; et al. Cryogenic front-end amplifier design for large SiPM arrays in the DUNE FD1-HD photon detection system. J. Instrum. 2022, 17, P11017. [Google Scholar] [CrossRef]

Disclaimer/Publisher’s Note: The statements, opinions and data contained in all publications are solely those of the individual author(s) and contributor(s) and not of MDPI and/or the editor(s). MDPI and/or the editor(s) disclaim responsibility for any injury to people or property resulting from any ideas, methods, instructions or products referred to in the content. |
© 2025 by the authors. Licensee MDPI, Basel, Switzerland. This article is an open access article distributed under the terms and conditions of the Creative Commons Attribution (CC BY) license (https://creativecommons.org/licenses/by/4.0/).