Article

Changes in Water Infiltration after Simulated Wetting and Drying Periods in two Biochar Amendments

by
Karolina Villagra-Mendoza
1,* and
Rainer Horn
2
1
School of Agricultural Engineering, Instituto Tecnológico de Costa Rica, Campus Cartago, Cartago 159-7050, Costa Rica
2
Institute for Plant Nutrition and Soil Science, Christian-Albrechts University Kiel, Hermann Rodewaldstr. 2, 24118 Kiel, Germany
*
Author to whom correspondence should be addressed.
Soil Syst. 2019, 3(4), 63; https://doi.org/10.3390/soilsystems3040063
Submission received: 16 July 2019 / Revised: 6 September 2019 / Accepted: 19 September 2019 / Published: 25 September 2019

Abstract

:
Biochar impacts soil-water related processes such as infiltration and contributes to the hydrological response of catchments. The aim of this work is to determine the impact of wetting and drying conditions on the infiltration behavior of two biochar amendments and to validate the performance of three infiltration models: Kostiakov, Horton, and Philips. Two materials, sand and a sandy loam, were mixed with 0%, 2.5%, and 5% (by dry wt.) mango wood biochar produced at a highest heating rate of 600 °C and with a particle size of <63 μm. A sequence of four wetting and drying cycles were simulated. In each cycle, infiltration was measured. We found that biochar addition decreased infiltration because the formation of narrower pores reduced infiltration capacity. The higher the biochar dosage, the more resilient the treatment became concerning the changes on the water infiltrated. Repetitive wetting and drying cycles resulted in a reconfiguration of structural pores affecting the transport of water and air. The infiltration models of Kostiakov and Horton could predict the infiltration dynamics in the amended materials, although they show some instabilities along the WD cycles.

1. Introduction

Increased food demand and decreased arable land productivity threaten food security. Crop production in degraded lands demands more water and nutrients in order to provide enough food for a growing population. In general, rainfall is the main source of water for agriculture, however, global changes affect water availability with consequences for a sustainable environment and crop production. Many regions are facing long dry periods, whereas other regions are suffering from intense and frequent rain events [1]. The Food and Agriculture Organization of the United Nations mentions that about 25% of global arable land is degraded and this is turning into a critical situation to face global demands [2]. Therefore, there is a need to provide soil and water management solutions to agricultural regions facing water scarcity. Biochar as soil amendment is considered to be a complementary soil management option to enhance soil quality due to its ability to improve soil physical, hydraulic, and chemical soil conditions [3,4,5,6,7,8,9,10,11,12]. Biochar has a great ability to absorb and store water [13] by modifying soil water retention properties, total porosity, and pore structure [14,15,16].
It is well known that water infiltration plays a key role in watershed hydrology. The efficiency on how water enters the soil surface is delimited by factors such as initial water content, surface sealing, vegetation, and surface crack formation [17,18,19,20,21]. Once rain or irrigated water enters the soil, depending on its water-holding capacity, a fraction of water is retained in the soil matrix and becomes available for plants while especially coarse pores conduct soil water into deeper soil layers. Some studies, with contradictory results, have investigated the effect of biochar on the infiltration capacity of amended soils. Novak et al. [22] described an increased water infiltration due to the addition of different biochars. Gopal et al. [21] observed a decrease of the infiltration rate in biochar amendments, mainly due to a decrease of macropores and an increase in water retention capacity. Villagra-Mendoza et al. [23] reported that charcoal combined with compost amendments reduced surface water infiltration and delayed percolation time compared to the unamended soil, enhancing soil water retention. Itsukushima et al. [24] observed higher initial and final infiltration rates in amended soils with bamboo charcoal and humus than in unamended soils. Hamidreza Sadeghi et al. [25] reported that both the time of biochar application before the rainfall event and an increased water holding capacity were key factors to reducing surface runoff. Hardie et al. [26] as well as Doerr and Thomas [27] concluded that soil hydrophobicity resulted in a retarded infiltration time, and a longer time to runoff generation. However, while the active growth of fungi and bacteria communities in the biochar pores has demonstrated an ability to resist long dry periods [28], and might preserve soil structural health, it may at the same time contribute to reducing infiltration and increasing runoff, due to the formation of some fungal structures that increase water repellency [29]. Zhi-guo et al. [30] suggested that biochar from agriculture and forest biomass decreased surface runoff and delayed time for its initiation. Abrol et al. [31] stated that biochar is a useful option for soil conservation by ameliorating infiltration and controlling soil erosion. However, the interrelation between soil water flow patterns, environment, and management conditions is quite complex and not yet completely understood. Therefore, there is a need to simplify these relations in order to apply infiltration models as valuable tools to save time and to avoid costs for field measurements. Physically based infiltration models such as Green-Ampt, Philips or Smith Parlange [32,33,34,35], semi-empirical models such as Horton [32,36,37], or empirical models such as Kostiakov or Holtan [32,38,39] are commonly used. The selection of the most appropriate model depends on the data collected and the quality of fitting required. For instance, Jačka et al. [34] suggested that empirical models perform better than physically based models and the latter perform better when using laboratory data than field data. To apply these models, some general restrictions or assumptions are considered: (1) the soil profile is homogeneous and the initial water content is constant [34,40,41]; (2) the soil structure and pore size distribution are assumed to be temporally stable, and the soil bulk is considered to be rigid [42,43]; (3) preferential flow is not considered [43,44]; (4) hysteresis, cracks, entrapped air, and soil water repellency are ignored [43]; (5) ponding surface conditions are considered constant [34]; and (6) a uniform rainfall or irrigation rate must be assumed [39]. Although these models are widely used, it is unclear how biochar amended soils may respond to the general model assumptions and parameters.
Although many studies have pointed out the positive effects of biochar amendments on the soil hydrology, it is still unclear the potential contribution of biochar application as an agricultural management practice, in particular under extreme weather conditions. Wetting and drying cycles (WD) change soil structure, modify soil pore distribution and enhance the formation of cracks and macropores, leading to preferential flow that consequently alter the amount of water and gas transported in the soil matrix [17,45,46]. Additionally, soil rigidity has been proven to increase with biochar addition [10,47]. This work pursues to investigate the impact of wetting and drying (WD) conditions on the water infiltration capacity and the ability of the Kostiakov, Philip, and Horton models to predict the infiltration behavior of two biochar amendments.

2. Materials and Methods

2.1. Experimental Analysis

Two soil materials, classified based on the German Standard [48], were mixed with two application rates (2.5 and 5% dry weight) of a mango wood biochar pyrolized at 600 °C and sieved through 63 µm. A medium sand with grain size diameter between 0.20 and 0.63 mm and a sandy loam soil collected from the first 30 cm (Ah horizon) of a Luvisol derived from glacial marl located in Schleswig-Holstein, near Kiel in Germany were tested. The climate of this region is oceanic with a mean annual precipitation of 860 mm. Precipitation occurs throughout the year, with a maximum average of 73.5 mm in August. The mean annual temperature is 18 °C with a mean maximum monthly temperature of 22 °C in July and a mean monthly minimum of 0 °C in January and February. The soil is classified as a haplic Luvisol [49].
The substrates were air dried and sieved through 2 mm. Six treatments were set as S0 (sand without biochar), S2.5 (sand +2.5% biochar), S5 (sand +5% biochar), SL0 (sandy loam without biochar), SL2.5 (sandy loam +2.5% biochar), and SL5 (sandy loam +5% biochar).
Three replicates of soil cores with a volume of 100 cm 3 per treatment were compacted to obtain average soil densities of 1.51 g / cm 3 for the sandy treatments (S) and 1.39 g / cm 3 for the sandy loam. Three simulated wet and dry (WD) periods were performed per sample. The wet condition (W) refers to the soil cores completely wetted after infiltration (100% saturation) and the dry condition (D) was set as oven dry at 30 °C for 72 h. Infiltration capacity was measured after each cycle with a minidisc infiltrometer. The sequence of the WD cycles applied is shown in Table 1. After each drying period, height changes of each soil core were registered in order to quantify changes in bulk density. Additionally, the weight of each sample was used to determine the initial soil water content.
Water repellency was estimated after each drying cycle with the method described by Hallet [50] and Tillman et al. [51]. Sorptivity for both, water ( S w ), and ethanol ( S E ) was calculated as described below:
S = Q f 4 b r
where Q is the rate of uptake of the liquid ( cm 3 / s ), b is a soil-water related parameter taken as 0.55 [52], r is the radius of the tip of the infiltrometer ( cm ), and f is the air porosity ( m 3 / m 3 ). The repellency index RI, was estimated as follows:
R I = 1.95 S E S w
where 1.95 is a constant value obtained from the relation of the surface tension and the viscosity of ethanol and water [47].
The minidisc infiltrometer had an internal diameter of 23 mm. Time and water volume changes in the graduated minidisc infiltrometer were registered until volume changes reached a steady flow. Infiltration rate ( i ) was determined as the difference of volume between two consecutive readings by the time interval between the same two readings. Cumulative infiltration ( I c u m ) was determined by the difference between the initial water volume infiltrated and the volume at each time step, divided by the internal contact area of the minidisc infiltrometer.

2.2. Statistical Analysis

Soil physical and hydraulic parameters such as bulk density, soil total porosity, and saturated hydraulic conductivity were described in Villagra-Mendoza and Horn [47]. The mean and standard deviations of i and Icum were calculated for each treatment. The analysis of variance (ANOVA) with p < 0.05 was used to assess differences of final and mean infiltration rates as well as cumulative infiltration for different wetting and dry periods. Post-hoc testing (HSD Tukey’s test (p < 0.05)) was used for multiple comparison and to determine significant differences between means. Means grouped with the same letters indicate no significant differences. All statistical analyses were performed with the software R studio v.3.5.2.

2.3. Modelling of Infiltration
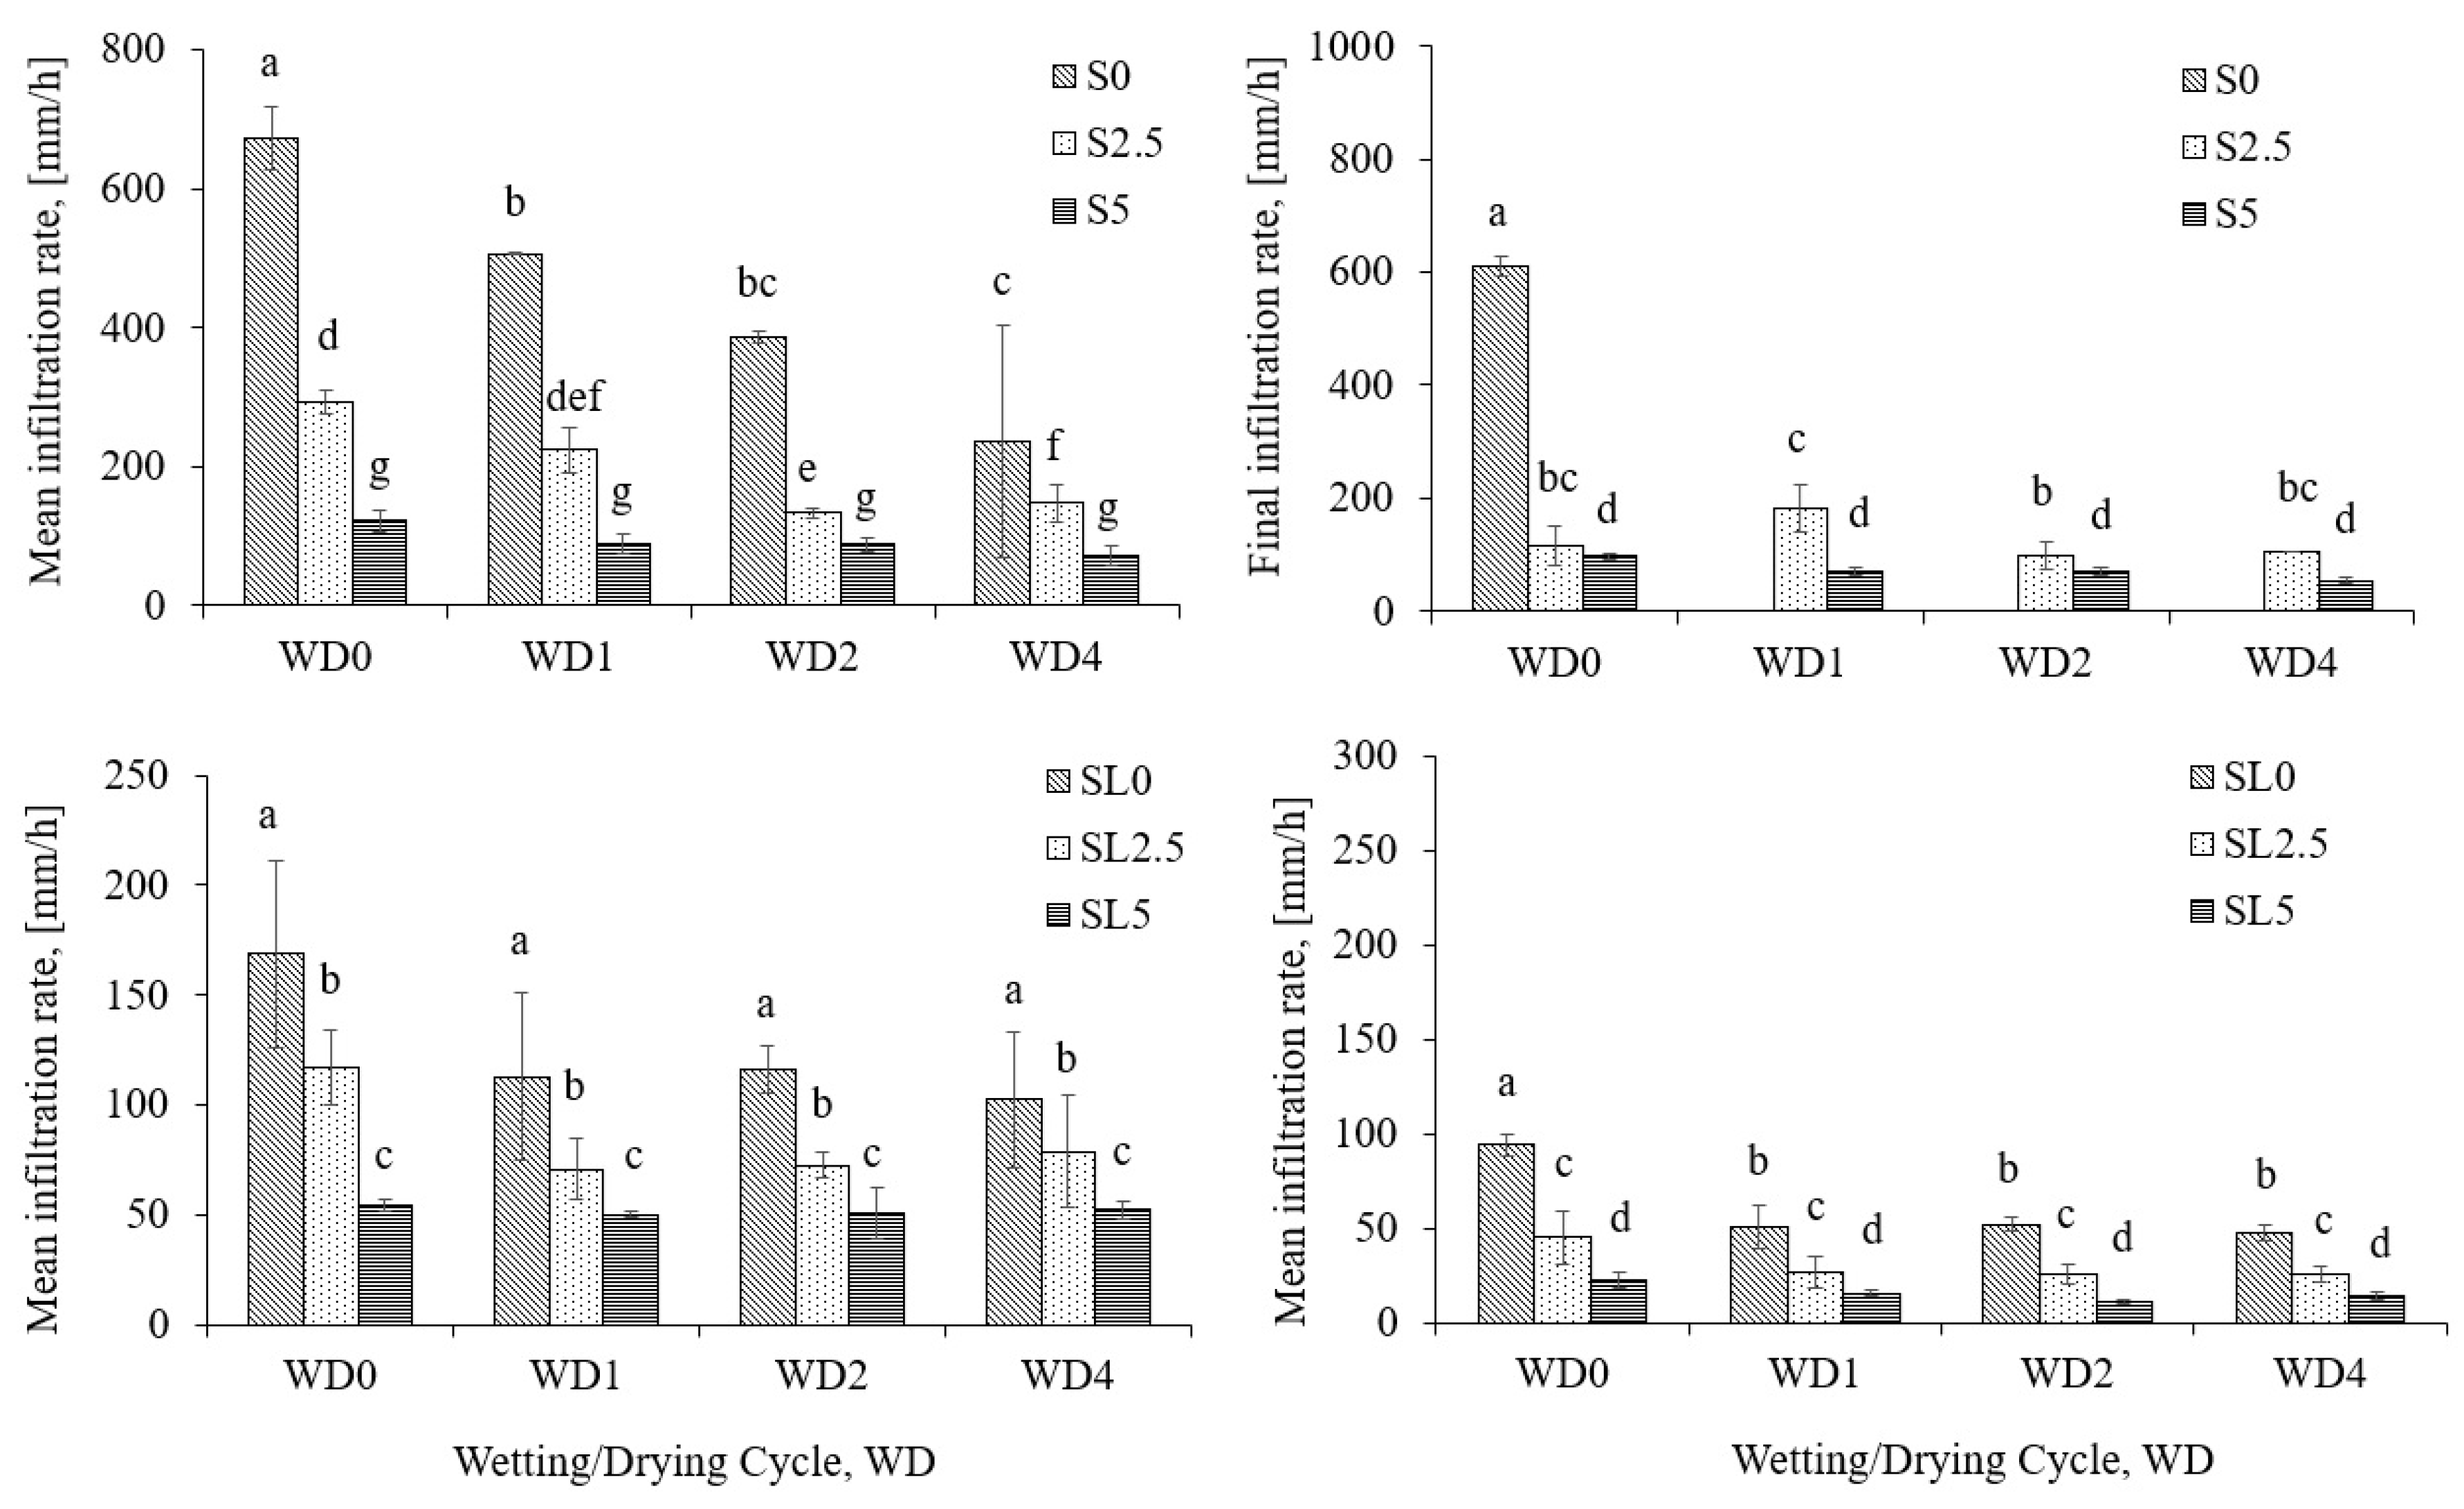
The predicted infiltration capacity from three infiltration models were compared with the infiltration curves measured after each wetting and drying (WD) period. Cumulative infiltration ( I c u m ) and infiltration rate ( i ) based on the Philip model (cited by Lal and Shukla [53]) were expressed as:
I c u m = S s t 1 / 2 + A t
i = 1 2 S s t 1 / 2 + A
where S s is an estimate of sorptivity ( mm / h 1 / 2 ) and A is an empirical constant known as the soil-water transmissivity and is related to saturated hydraulic conductivity ( mm / h ) .
The Horton model (cited by Baver et al. [54]) was expressed as:
I c u m = I b t + ( I o I b ) β [ 1 exp ( β t ) ]
i = I b   t + ( I o I b ) exp ( β t )
where I o is the initial infiltration capacity ( mm / h ) at t = 0 , I b is the final rate of the infiltration capacity ( mm / h ) and β is a constant which describes the decreasing rate of infiltration capacity.
The Kostiakov model [55] is described as:
I c u m = a b + 1 t b + 1
i = a t b
where t is infiltration time ( h ) and a ,   b are fitting parameters of the curve as a function of texture, soil water content and bulk density.
The quality of the models was verified with the coefficient of determination (R2), a residue analysis by means of the root mean square error (RMSE) and the Nash–Sutcliffe model efficiency coefficient (NSE):
R M S E = i = 1 n ( Y o b s Y p r e d ) 2 n
N S E = 1 i = 1 n ( Y o b s Y p r e d ) 2 i = 1 n ( Y o b s Y o b s ¯ ) 2
where Y o b s represents the measured data, Y p r e d the predicted data through the models, Y o b s ¯ the arithmetic mean of the measured data, and n the number of observations. Model outputs with RMSE values less than half the standard deviation of the measured data were considered to be appropriate for model evaluation. The model performance criteria for the NSE values was considered as very good for 0.75 < NSE ≤ 1.00, good for 0.65 < NSE ≤ 0.75, satisfactory for 0.50 < NSE ≤ 0.65, and unsatisfactory for NSE ≤ 0.50 [56].

3. Results

Table 2 summarizes some chemical and physical soil properties of the amendments reported in Villagra-Mendoza and Horn [47]. The sandy (S) and the sandy loam (SL) treatments showed a non-significant increase in the small fraction of the particle size distribution due to the addition of biochar. The biochar addition did not significantly change pH, whereas a larger fraction of biochar increased the content of total carbon.
The applied wetting and drying (WD) cycles changed the bulk density of the treatments (Table 3). The unamended sand (S0) showed a greater and constant increase of the bulk density compared to the amended sandy treatments S2.5 and S5. It was observed that S2.5 and S5 tended to swell during wetting, decreasing bulk density. After drying, shrinkage was of similar magnitude in relation to swelling in treatments S2.5 and S5, and therefore overall changes in bulk density were small. In the sandy loam (SL) treatments, bulk density remained similar along the different WD cycles.
Hydrophobicity was determined as means of the repellency index, RI. Based on Tillman et al. [51], RI ≤ 1 is attributed to non-repellent soils, while RI > 1 indicates that a soil is water repellent. Table 4 shows the water repellency index, R I , oscillating within the different WD cycles and no clear trend was observed for any of the treatments studied. There was also no clear correlation observed between hydrophobicity and the biochar content along the WD cycles applied. Except for WD2 in S0 and WD4 for treatment S5, all sandy mixtures remained hydrophilic during all WD cycles. In general, in the sandy mixtures the higher the biochar application rate the higher was the R I , although most of the treatments kept their hydrophilic condition. The unamended sandy loam (SL0) was already hydrophobic and biochar increased slightly the hydrophobicity of the mixtures. However, no clear trend was observed between the effect of WD cycles and the hydrophobic condition of these treatments.
The enhancement of soil rigidity, due to the addition of biochar, made the soil amendments more resilient to repetitive wetting and drying (WD) in the sandy (S) and sandy loam (SL) mixtures (Figure 1). We observed that the larger the biochar fraction, the smaller the mean and final infiltration rates, in particular in the sandy mixtures. Furthermore, a biochar application rate of 5% caused less changes on the mean infiltration rate along the WD cycles in comparison to the other application rates. In the sandy amendments, mean infiltration rate decreased in comparison to the unamended sand (S0) in WD0 by 57% and 82% for treatments S2.5 and S5, respectively, whereas smaller changes in the mean infiltration rate were detected for the sandy loam mixtures; with respect to SL0 in WD0, 30% and 68% decreases occurred for treatments SL2.5 and SL5, respectively (see Figure 1). In comparison to S0, the final infiltration rate (Ib) decreased up to 81% and 84% for S2.5 and S5, respectively; and, in comparison to SL0, Ib decreased by 52% and 75% for SL2.5 and SL5, respectively.
The occurrence of WD cycles resulted in an oscillating behavior concerning both the mean and final infiltration rates for most soil materials. The greatest decrease of mean infiltration was observed in the unamended sand. In S0, mean infiltration decreased by 42.5% in WD1, and 65% in WD2 and WD4, compared to WD0. As the biochar application rate increased, the decrease of mean infiltration along the WD cycles (in comparison to WD0) was smaller. In treatment S2.5, the mean infiltration rate decreased with respect to WD0 by 23%, 55%, and 50%, whereas, in S5 the decrease was 26%, 27%, and 40% with respect to WD1, WD2, and WD4, respectively. In the sandy loam treatments, non-significant changes of mean infiltration rate were observed in the WD cycles, and the biochar application rate of 5% produced the smallest mean infiltration decrease along the WD cycles applied. Final infiltration rate did not significantly change along the WD cycles, although an oscillating trend was observed.
Figure 2 shows the pattern of cumulative infiltration (Icum) at specific time periods of 15, 30, and 45 min, during different WD cycles. In the unamended sand (S0), the final infiltration rate was reached within a period shorter than 30 min during WD1 and WD2. For WD4, the final infiltration rate was reached after 45 min. In the sandy amendments S2.5 and S5, the addition of biochar increased the time to reach steady flow (longer than 45 min) but also decreased the amount of water infiltrated along the time, compared with S0. In S2.5 the WD cycles did not enhance infiltration capacity and a slight significant decrease of infiltration capacity was observed at each time step. In the S5 treatment, the amount of water which infiltrated at each time step remained similar. We noticed that the application of WD cycles did not cause any significant change.
Infiltration capacity was validated with three different infiltration models (Kostiakov, Horton, and Philip) under two different wetting and drying cycles WD1 and WD4, compared to the initial condition WD0. Infiltration model parameters for all treatments are shown in Table 5. The Philip model was not able to explain infiltration dynamics for treatments S2.5 and S5, and for all SL treatments the model generated unrealistic values related to the saturated hydraulic conductivity parameter. Based on the criteria of assuming an acceptable model performance by comparing RMSE values to standard deviation, output with unacceptable results were obtained in Kostiakov for S2.5 in WD1, Horton for S2.5 in all cycles, and SL0 in WD0. Applying the NSE performance criteria [56], unsatisfactory output results were obtained in Kostiakov for S2.5 in WD0 and WD1, Horton for S2.5 in all cycles, S5 in WD4 and SL0 in WD0, and Philip for S0 in WD4.
Figure 3 and Figure 4 show the plotted observed and predicted infiltration rates for the sandy (S) and sandy loam (SL) treatments, respectively. Based on the RMSE and NSE criteria (Table 5) it was observed that infiltration was well approximated by Kostiakov and Horton in all WD cycles for the sandy treatments (S0 and S5), whereas in S2.5 Horton overestimated the infiltration rate. Although Philip showed a good approximation in S0 and S5, the other two models provided better performance ratings in overall. The Kostiakov model showed to be robust in the sandy loam treatments in all WD cycles, especially in SL0 and SL2.5, though in SL5 Horton provided a higher performance in all WD cycles.

4. Discussion

Biochar acts as a binding material generating a more rigid soil volume [7,57]. However, there are differences between the textural behavior, as could be proved with our results. Sandy biochar amendments (S2.5 and S5) did not alter considerably their bulk densities during the WD cycles. In the sandy loam, however, the more biochar was added, the less shrinkage occurred. These results are consistent with a previous report of Bodner et al. [58]. They proofed that the presence of macropores, like in S0, makes the soil more sensitive to deformation compared to substrates with smaller pores, which resist higher capillary stress. Thus, a higher dosage of biochar enhanced the soil strength of the amended materials, presenting relatively higher rigidity when wetting and less bulk deformation at higher drying conditions.
In the sandy mixtures, mean infiltration rate decreased the more the higher was the added biochar. An application rate of 5% however, resulted in less infiltration rate changes along the WD cycles. In the sandy loam mixtures, changes were less evident in the mean infiltration rate between different biochar dosages and along the WD cycles. The oscillation of the mean and final infiltration rate through the WD cycles corresponded to the presence of more fine pores in the amendments that slowed down water infiltration during wetting and the rearrangement of soil aggregates during drying. Novak et al. [22] used pelletized manure and lignocellulosic feedstock with a size material between 2 mm and 6 mm. They determined that biochar initially improved water infiltration in an amended sandy loam soil and attributed it to bulk density changes by the formation of more pore space able to enhance water flow. However, water infiltration declined after additional water leaching due to the clogging of pores by biochar physical disintegration. Despite this, bulk density decreased in the amended materials (S and SL), the authors consider that this parameter is not sensitive enough to explain changes in infiltration capacity since this parameter does not provide information about the pore conformation and connectivity in the bulk soil. Although bulk density drastically changed in S0 from WD0 to WD1, mean and cumulative infiltration did not significantly decrease between these two WD cycles. Final infiltration rate decreased significantly in the first WD (WD1) cycle especially for the unamended treatments, however as the biochar application rate increased, final infiltration remained stable along the WD cycles in the amendments. This might assume a higher resistance of the biochar amendments to internal pore changes and to the formation of macro-aggregates during drying. As reported in Villagra-Mendoza and Horn [59], under initial infiltration conditions, when the soil is partially moistened, the higher the fraction of biochar, the higher is the transport of water (in terms of unsaturated hydraulic conductivity) due to the intensification of a finer inter-particle pore formation, especially in the sandy loam amendments. This could be another mechanism that may help to keep similar infiltration conditions along the WD cycles.
Soil water repellency is largely associated with low infiltration rates and increased runoff [9,60,61]. It is also very prominent in coarse textured soils due to their relative small SSA and/or in soils with less than 10% of clay, although in some cases fine textures have shown some repellency degrees due to the formation of soil aggregates, which reduce the surface area covered later by a hydrophobic skin [27,62]. The hydrophilic condition of the unamended sand ( S 0 ) did not manifest any opposition to the flow entering the soil surface during infiltration and presented higher mean infiltration rates, especially in WD0 and WD1. In the sandy loam ( SL ), all treatments reacted in a hydrophobic manner, which resulted in a reduced rate of water infiltration. These findings partially agreed with the results of Doerr et al. [62]. He reported an increase in the hydrophobicity of amended coarse textured soils as the dosage of biochar increased; results are also consistent with the findings of Herath et al. [63] who used a corn stover as biochar feedstock (with a dominant particle size between 0.5 and 2 mm) and reported no effect on finer textures. They suggested that the effect of biochar addition on hydrophobicity was soil type dependent. Githinji [6] used biochar from peanut hulls and a particle size of <2 mm and concluded that an increasing rate of biochar application produced a decreasing trend of cumulative infiltration in a sandy loam soil, and attributed this trend to biochar hydrophobicity. He observed a linear decrease of K s a t with increasing biochar application rate, which also caused the reduction of the cumulative infiltration. Hardie [19] reported an increase of soil water repellency after intense drying (using heating oven-dry) conditions. These reports are contrary to the results of this study, since the sandy mixtures ( S ) did not show any water repellency with repetitive wetting and drying. Water repellency only appeared with a biochar application rate of 5%. In the sandy loam ( SL ) after simulating repetitive wetting and drying, the SL mixtures presented an oscillating behavior. The dynamics of this behavior assumes that wetting periods decreased hydrophobicity and drying caused a re-distribution of the organic molecules that restored hydrophobicity of the SL samples to some degree, as suggested by Doerr and Thomas [27].
Due to the complexity of the pattern behavior of the soil parameters under study after different WD cycles, three simple infiltration models with accessible derived parameters were assessed. In general, Kostiakov showed to be more robust in all treatments (except S2.5) and in most of the WD cycles. Empirical models, such as Kostiakov, has proved to fit well to measure data although its parameters lack of physical meaning [35,38,64,65,66]. As reported by Li et al. [61], this good performance was obtained because the fitting parameters are not related to the wetting front depth. Authors such as Haghiabi et al. [67] suggested to using the logarithmic characteristic of infiltration to estimate the parameters of Kostiakov, since this modification provides better estimations. In the unamended sand (S0), all infiltration models (Kostiakov, Horton, and Philip) performed well when predicting infiltration along the WD cycles, with the exception of the Philip model in WD4, but as the biochar application rate increased, the Kostiakov model was more robust. If only the performance of the infiltration models in WD0 were considered, these results agree with findings of van De Genachte et al. [32] that reported a better estimation of infiltration in high clay content soils by using Philip, Kostiakov, and Horton equations; meanwhile for coarse sand the Philip approach better described the infiltration behavior. van De Genachte et al. found some heterogeneities in parameter A (hydraulic conductivity) because of the poor structure of the coarse soil dominated by the matrix flow, while in the high clay content soils, a high contribution of preferential flow was present due to the formation of subangular blocky structures with abundant channels.
Other studies have obtained good estimations of infiltration using the Philip model. For instance, Ayodele et al. [68] observed good fitting results of the Philip equation in an amended loamy fine sand soil. Likewise, Carrick et al. [69] confirmed that hydrophobicity (by means of sorptivity) was the main mechanism affecting early-time infiltration, with sorptivity being one of the main parameters of the Philip infiltration model. In the unamended sandy loam SL 0 and SL 2.5 , due to the formation of some small cracks at the soil surface (after the application of the WD cycles), the Horton equation had a good performance too, because it was able to estimate the initial preferential flow, as suggested by van De Genachte et al. [32].
In the Philip model, predicted negative A values suggested that this model was not applicable to amended sandy loam substrates for any of the WD cycles studied. A study of Bayabil et al. [66] reported negative steady infiltration rates, which presumes that this model may be unstable under special circumstances.
Although the empirical models have been well documented to explain the infiltration processes, it was demonstrated that the models studied were unable to predict infiltration through all the WD cycles studied, particularly for the biochar amendments. This may be due to the complexity that brings the biochar properties to the amended soils, which must be further investigated. Wetting and drying demonstrated some soil instabilities not capable to be represented by any conventional model. Information about crack volume and length after each wetting and drying period, rearrangement of soil aggregates, unsaturated hydraulic conductivity and even the effect of hydrophobicity should be assessed in future work. Models with separation of flow domains (soil matrix and macropores) may provide better results, although more soil parameters may be required.

5. Conclusions

Infiltration rates decreased in a sandy and sandy loam substrates amended with biochar (derived from mango wood and pyrolized at a heating rate of 600 °C) with a particle size of <63 μm, in contrast to previous studies that reported an enhancement of water infiltrated in biochar amendments.
Biochar as amendment may help to decrease structural pore changes by providing more soil rigidity to overcome changes in infiltration capacity caused by repetitive wetting and drying cycles.
The empirical infiltration models of Kostiakov and Horton provided proof that can be used to explain infiltration in an acceptable way through different wetting and drying cycles, although other soil parameters may be investigated to enhance the modeling accuracy.

Author Contributions

Conceptualization, K.V.-M.; Methodology, K.V.-M. and R.H.; Software, K.V.-M.; Validation, K.V.-M.; Formal Analysis, K.V.-M.; Investigation, K.V.-M.; Resources, R.H.; Writing—Original Draft Preparation, K.V.-M.; Writing—Review & Editing, K.V.-M. and R.H.; Supervision, R.H.

Funding

This research received no external funding.

Acknowledgments

The main author is grateful to the Institute for Plant Nutrition and Soil Science of the Christian-Albrechts University Kiel for laboratory access. Special thanks to the IPSWaT Program supported by the Ministry of Education and Research (BMBF) of Germany, and the Academic Affairs Vice-presidency of the Instituto Tecnológico de Costa Rica (Costa Rica Institute of Technology) for the financial support.

Conflicts of Interest

The authors declare no conflicts of interest.

References

  1. IPCC. Climate Change 2014: Synthesis Report; Contribution of Working Groups I, II and III to the Fifth Assessment Report of the Intergovernmental Panel on Climate Change [Core Writing Team]; Pachauri, R.K., Meyer, L.A., Eds.; IPCC: Geneva, Switzerland, 2014; p. 151. [Google Scholar] [CrossRef]
  2. FAO; ITPS. Status of the World’s Soil Resources (SWSR); Main Report; Food and Agriculture Organization of the United Nations and Intergovermental Technical Panel on Soils: Rome, Italy, 2015; ISBN 978-92-5-109004-6. [Google Scholar]
  3. Eastman, C.M. Soil Physical Characteristics of an Aeric Ochraqualf Amended with Biochar. Master’s Thesis, Ohio State University, Columbus, OH, USA, 2011. [Google Scholar]
  4. Bayabil, H.K.; Lehman, J.C.; Yitaferu, B.; Stoof, C.R.; Steenhuis, T.S. Hydraulic properties of clay soils as affected by biochar and charcoal amendments. In Rainwater Management for Resilient Livelihoods in Ethiopia, Proceedings of the Nile Basin Development Challenge Science Meeting, Addis Ababa, Ethiopia, 9–10 July 2013; NBDC Technical Report 5; Mekuria, W., Ed.; International Livestock Research Institute: Nairobi, Kenya, 2013. [Google Scholar]
  5. Barnes, R.T.; Gallagher, M.E.; Masiello, C.A.; Liu, Z.; Dugan, B. Biochar-Induced Changes in Soil Hydraulic Conductivity and Dissolved Nutrient Fluxes Constrained by Laboratory Experiments. PLoS ONE 2014, 9, e108340. [Google Scholar] [CrossRef] [PubMed]
  6. Githinji, L. Effect of Biochar Application Rate on Soil Physical and Hydraulic Properties of a Sandy Loam. Arch. Agron. Soil Sci. 2014, 60, 457–470. [Google Scholar] [CrossRef]
  7. Ouyang, L.; Wang, F.; Tang, J.; Yu, L.; Zhang, R. Effects of Biochar Amendment on Soil Aggregates and Hydraulic Properties. J. Soil Sci. Plant Nutr. 2013, 13, 991–1002. [Google Scholar] [CrossRef]
  8. Hardie, M.; Clothier, B.; Bound, S.; Oliver, G.; Close, D. Does Biochar Influence Soil Physical Properties and Soil Water Availability? Plant Soil 2014, 376, 347–361. [Google Scholar] [CrossRef]
  9. Lopez, V.D. Biochar as a Soil Amendment: Impact on Hydraulic and Physical Properties of an Arable Loamy Sand Soil. Master’s Thesis, University of California, Merced, CA, USA, 2014. [Google Scholar]
  10. Ajayi, A.E.; Holthusen, D.; Horn, R. Changes in Microstructural Behaviour and Hydraulic Functions of Biochar Amended Soils. Soil Tillage Res. 2016, 155, 166–175. [Google Scholar] [CrossRef]
  11. Lim, T.J.; Spokas, K.A.; Feyereisen, G.; Novak, J.M. Predicting the Impact of Biochar Additions on Soil Hydraulic Properties. Chemosphere 2016, 142, 136–144. [Google Scholar] [CrossRef] [PubMed]
  12. Obia, A.; Mulder, J.; Martinsen, V.; Cornelissen, G.; Børresen, T. In Situ Effects of Biochar on Aggregation, Water Retention and Porosity in Light-Textured Tropical Soils. Soil Tillage Res. 2016, 155, 35–44. [Google Scholar] [CrossRef]
  13. Sohi, S.; Lopez-Capel, E.; Krull, E.; Bol, R. Biochar’s Roles in Soil and Climate Change: A Review of Research Needs; CSIRO Land and Water Science Report 05/09; CSIRO: Canberra, Australia, 2009; p. 64. [Google Scholar]
  14. Novak, J.M.; Busscher, W.J.; Watts, D.W.; Amonette, J.E.; Ippolito, J.A.; Lima, I.M.; Gaskin, J.; Das, K.C.; Steiner, C.; Ahmedna, M.; et al. Biochars Impact on Soil-Moisture Storage in an Ultisol and two Aridisols. Soil Sci. 2012, 177, 310–320. [Google Scholar] [CrossRef]
  15. Burrell, L.D.; Zehetner, F.; Rampazzo, N.; Wimmer, B.; Soja, G. Long-Term Effects of Biochar on Soil Physical Properties. Geoderma 2016, 282, 96–102. [Google Scholar] [CrossRef]
  16. Ajayi, A.E.; Horn, R. Comparing the Potentials of Clay and Biochar in Improving Water Retention and Mechanical Resilience of Sandy Soil. Int. Agrophys. 2016, 30, 391–399. [Google Scholar] [CrossRef]
  17. Römkens, M.J.M.; Prasad, S.N. Rain Infiltration into Swelling/Shrinking/Cracking Soils. Agric. Water Manag. 2006, 86, 196–205. [Google Scholar] [CrossRef]
  18. Chartier, M.P.; Rostagno, C.M.; Pazos, G.E. Effects of Soil Degradation on Infiltration Rates in Grazed Semiarid Rangelands of Northeastern Patagonia, Argentina. J. Arid Environ. 2011, 75, 656–661. [Google Scholar] [CrossRef]
  19. Hardie, M.A. Effect of Antecedent Soil Moisture on Infiltration and Preferential Flow in Texture Contrast Soils. Ph.D. Thesis, University of Tasmania, Hobart, Australia, 2011. [Google Scholar]
  20. De Almeida, W.S.; Panachuki, E.; de Oliveira, P.T.S.; da Silva Menezes, R.; Sobrinho, T.A.; de Carvalho, D.F. Effect of soil tillage and vegetal cover on soil water infiltration. Soil Tillage Res. 2018, 175, 130–138. [Google Scholar] [CrossRef]
  21. Gopal, P.; Bordoloi, S.; Ratnam, R.; Lin, P.; Cai, W.; Buragohain, P.; Garg, A.; Sreedeep, S. Investigation of Infiltration Rate for Soil-Biochar Composites of Water Hyacinth. Acta Geophys. 2019, 67, 231–246. [Google Scholar] [CrossRef]
  22. Novak, J.; Sigua, G.; Watts, D.; Cantrell, K.; Shumaker, P.; Szogi, A.; Johnson, M.G.; Spokas, K. Biochars Impact on Water Infiltration and Water Quality through a Compacted Subsoil Layer. Chemosphere 2016, 142, 160–167. [Google Scholar] [CrossRef] [PubMed]
  23. Villagra-Mendoza, K.; Ortiz-Malavassi, E.; Otterpohl, R. Role of Charcoal Addition on Infiltration Processes and Soil water Content Characteristics of a Sandy Loam Soil. Agric. Eng. Int. CIGR J. 2017, 19, 9–15. [Google Scholar]
  24. Itsukushima, R.; Ideta, K.; Iwanaga, Y.; Sato, T.; Shimatani, Y. Evaluation of Infiltration Capacity and Water Retention Potential of Amended Soil Using Bamboo Charcoal and Humus for Urban Flood Prevention. In Proceedings of the 11th International Symposium on Ecohydraulics, Melbourne, Australia, 7–12 February 2016. [Google Scholar]
  25. Hamidreza Sadeghi, S.; Hazbavi, Z.; Kiani Harchegani, M. Controllability of Runoff and Soil Loss from Small Plots Treated by Vinasse-Produced Biochar. Sci. Total Environ. 2016, 541, 483–490. [Google Scholar] [CrossRef] [PubMed]
  26. Hardie, M.A.; Cotching, W.E.; Doyle, R.B.; Holz, G.; Lisson, S.; Mattern, K. Effect of Antecedent Soil Moisture on Preferential Flow in a Texture-Contrast Soil. J. Hydrol. 2011, 398, 191–201. [Google Scholar] [CrossRef]
  27. Doerr, S.H.; Thomas, A.D. The Role of Soil Moisture in Controlling Water Repellency: New Evidence from Forest Soils in Portugal. J. Hydrol. 2000, 231–232, 134–147. [Google Scholar] [CrossRef]
  28. Liang, C.; Zhu, X.; Fu, S.; Méndez, A.; Gascó, G.; Paz-Ferreiro, J. Biochar Alters the Resistance and Resilience to Drought in a Tropical Soil. Environ. Res. Lett. 2014, 9, 1–6. [Google Scholar] [CrossRef]
  29. Chau, H.W.; Goh, Y.K.; Vujanovic, V.; Si, B.C. Wetting Properties of Fungi Mycelium Alter Soil Infiltration and Soil Water Repellency in a γ-Sterilized Wettable and Repellent Soil. Fungal Biol. 2012, 116, 1212–1218. [Google Scholar] [CrossRef] [PubMed]
  30. Zhi-Guo, L.; Chi-Ming, G.; Run-Hua, Z.; Mohamed, I.; Guo-Shi, Z.; Li, W.; Runqin, Z.; Fang, C.; Yi, L. The Benefic Effect Induced by Biochar on Soil Erosion and Nutrient Loss of Slopping Land under Natural Rainfall Conditions in Central China. Agric. Water Manag. 2017, 185, 145–150. [Google Scholar]
  31. Abrol, V.; Ben-Hur, M.; Verheijen, F.G.A.; Keizer, J.J.; Martins, M.A.S.; Tenaw, H.; Tchehansky, L.; Graber, E.R. Biochar Effects on Soil Water Infiltration and Erosion under Seal Formation Conditions: Rainfall Simulation Experiment. J. Soils Sediments 2016, 16, 2709–2719. [Google Scholar] [CrossRef]
  32. Van De Genachte, G.; Mallants, D.; Ramos, J.; Deckers, J.A.; Feyen, J. Estimating Infiltration Parameters from Basic Soil Properties. Hydrol. Process. 1996, 10, 687–701. [Google Scholar] [CrossRef]
  33. Liu, J.; Zhang, J.; Feng, J. Green–Ampt Model for Layered Soils with Nonuniform Initial Water Content Under Unsteady Infiltration. Soil Sci. Soc. Am. J. 2008, 72, 1041. [Google Scholar] [CrossRef]
  34. Jačka, L.; Pavlásek, J.; Pech, P.; Kuráž, V. Assessment of Evaluation Methods Using Infiltration Data Measured in Heterogeneous Mountain Soils. Geoderma 2016, 276, 74–83. [Google Scholar] [CrossRef]
  35. Igbadunh, E.; Othman, M.K.; Ajayi, A.S. Performance of Selected Water Infiltration Models in Sandy Clay Loam Soil in Samaru Zaria. Glob. J. Res. Eng. 2016, 16, 8–14. [Google Scholar]
  36. Xue, J.; Gavin, K. Effect of Rainfall Intensity on Infiltration into Partly Saturated Slopes. Geotech. Geol. Eng. 2008, 26, 199–209. [Google Scholar] [CrossRef]
  37. Ghosh, B.; Pekkat, S. A Critical Evaluation of Measurement Induced Variability in Infiltration Characteristics for a River Sub-Catchment. Meas. J. Int. Meas. Confed. 2019, 132, 47–59. [Google Scholar] [CrossRef]
  38. Adindu, R.U.; Igbokwe Kelechi, K.; Chigbu Timothy, O.; Ike-Amadi, C.A. Application of Kostiakov’s Infiltration Model on the Soils of Umudike, Abia State—Nigeria. Am. J. Environ. Eng. 2014, 4, 1–6. [Google Scholar] [CrossRef]
  39. Uloma, A.R.; Samuel, A.C.; Kingsley, I.K. Estimation of Kostiakov’s Infiltration Model Parameters of Some Sandy Loam Soils of Ikwuano–Umuahia, Nigeria. Open Trans. Geosci. 2014, 1, 34–38. [Google Scholar] [CrossRef]
  40. Barrera, D.; Masuelli, S. An Extension of the Green-Ampt Model to Decreasing Flooding Depth Conditions, with Efficient Dimensionless Parametric Solution. Hydrol. Sci. J. 2011, 56, 824–833. [Google Scholar] [CrossRef]
  41. Angelaki, A.; Sakellariou-Makrantonaki, M.; Tzimopoulos, C. Theoretical and Experimental Research of Cumulative Infiltration. Transp. Porous Media 2013, 100, 247–257. [Google Scholar] [CrossRef]
  42. Elrick, D.E.; Reynolds, W.D. Infiltration from constant-head well permeameters and infiltrometers. In Advances in Measurement of Soil Physical Properties: Bringing Theory into Practice; Topp, G.C., Reynolds, D., Green, R.E., Eds.; SSSA Spec. Publ. 30; Soil Science Society of America: Madison, WI, USA, 1992. [Google Scholar] [CrossRef]
  43. Clothier, B.; Scotter, D. Unsaturated water transmission parameters obtained from infiltration. In Methods of Soil Analysis, Part 4: Physical Methods; Dane, J.H., Topp, G.C., Eds.; Soil Science Society of America: Madison, WI, USA, 2002; pp. 879–898. [Google Scholar]
  44. Dohnal, M.; Dušek, J.; Vogel, T.; Císlerová, M.; Lichner, L.; Štekauerová, V. Ponded Infiltration into Soil with Biopores—Field Experiment and Modeling. Biologia 2009, 64, 580–584. [Google Scholar] [CrossRef]
  45. Zhao, Y.; De Maio, M.; Vidotto, F.; Sacco, D. Influence of Wet-Dry Cycles on the Temporal Infiltration Dynamic in Temperate Rice Paddies. Soil Tillage Res. 2015, 154, 14–21. [Google Scholar] [CrossRef]
  46. Peng, X.; Horn, R.; Smucker, A. Pore Shrinkage Dependency of Inorganic and Organic Soils on Wetting and Drying Cycles. Soil Sci. Soc. Am. J. 2007, 71, 1095–1104. [Google Scholar] [CrossRef]
  47. Villagra-Mendoza, K.; Horn, R. Effect of Biochar Addition on Hydraulic Functions of Two Textural Soils. Geoderma 2018, 326, 88–95. [Google Scholar] [CrossRef]
  48. Boden, A.G. Bodenkundliche Kartieranleitung, 5th ed.; Schweizerbart’sche Verlagsbuchhandlung: Stuttgart, Germany, 2005. [Google Scholar]
  49. Burbaum, B.; Filipinski, M. Die Böden Schleswig-Holsteins—Entstehung, Verbreitung, Nutzung, Eigenschaften und Gefährdung; Landesamt für Landwirtschaft, Umwelt und ländliche Räume Schleswig-Holstein: Flintbek, Germany, 2012; Volume 4. [Google Scholar]
  50. Hallett, P.D. An introduction to soil water repellency. In Proceedings of the 8th International Symposium on Adjuvants for Agrochemicals (ISAA2007), Columbus, OH, USA, 6–9 August 2007. [Google Scholar]
  51. Tillman, R.W.; Scotter, D.R.; Wallis, M.G.; Clothier, B.E. Water-Repellency and Its Measurement by Using Intrinsic Sorptivity. Aust. J. Soil Res. 1989, 27, 637–644. [Google Scholar] [CrossRef]
  52. White, I.; Sully, M.J. Macroscopic and Microscopic Capillary Length and Time Scales from Field Infiltration. Water Resour. Res. 1987, 23, 1514–1522. [Google Scholar] [CrossRef]
  53. Lal, R.; Shukla, M.K. Principles of Soil Physics; Taylor & Francis: New York, NY, USA, 2005. [Google Scholar]
  54. Baver, L.D.; Gardner, W.H.; Gardner, W.R. Soil Physics, 4th ed.; Sons, J.W., Ed.; John Wiley & Sons: Hoboken, NJ, USA, 1972. [Google Scholar]
  55. Kostiakov, A.N. The Dynamics of the Coefficient of Water Percolation in Soils and the Necessity for Studying It from a Dynamic Point of View for Purpose of Amelioration. Soc. Soil Sci. 1932, 14, 17–21. [Google Scholar]
  56. Moriasi, D.N.; Arnold, J.G.; Van Liew, M.W.; Bingner, R.L.; Harmel, R.D.; Veith, T.L. Model Evaluation Guidelines for Systematic Quatification of Accuracy in Watershed Simulations. Trans. ASABE 2007, 50, 885–900. [Google Scholar] [CrossRef]
  57. Sun, F.; Lu, S. Biochars Improve Aggregate Stability, Water Retention, and Pore-Space Properties of Clayey Soil. J. Plant Nutr. Soil Sci. 2014, 177, 26–33. [Google Scholar] [CrossRef]
  58. Bodner, G.; Scholl, P.; Kaul, H.P. Field Quantification of Wetting-Drying Cycles to Predict Temporal Changes of Soil Pore Size Distribution. Soil Tillage Res. 2013, 133, 1–9. [Google Scholar] [CrossRef] [PubMed]
  59. Villagra-Mendoza, K.; Horn, R. Effect of Biochar on the Unsaturated Hydraulic Conductivity of Two Amended Soils. Int. Agrophys. 2018, 32, 373–378. [Google Scholar] [CrossRef]
  60. EUROPA; Verheijen, F.; Jeffery, S.; Bastos, A.C.; van der Velde, M.; Diasfas, I. Biochar Application to Soils: A Critical Scientific Review of Effects on Soil Properties, Processes and Functions; EUROPA: Luxembourg, 2010. [Google Scholar] [CrossRef]
  61. Li, Y.; Ren, X.; Hill, R.; Malone, R.; Zhao, Y. Characteristics of Water Infiltration in Layered Water-Repellent Soils. Pedosphere 2017, 28, 775–792. [Google Scholar] [CrossRef]
  62. Doerr, S.H.; Shakesby, R.A.; Walsh, R.P.D. Soil Water Repellency: Its Causes, Characteristics and Hydro-Geomorphological Significance. Earth Sci. Rev. 2000, 51, 33–65. [Google Scholar] [CrossRef]
  63. Herath, H.M.S.K.; Camps-Arbestain, M.; Hedley, M. Effect of Biochar on Soil Physical Properties in Two Contrasting Soils: An Alfisol and an Andisol. Geoderma 2013, 209–210, 188–197. [Google Scholar] [CrossRef]
  64. Canarache, A.; Motoc, E.; Dumitriu, R. Infiltration Rate as Related to Hydraulic Conductivity, Moisture Deficit and Other Soil Properties. Soil Sci. 1968, 392–401. [Google Scholar]
  65. Hasan, M.; Chowdhury, T.; Drabo, M.; Kassu, A.; Glenn, C. Modeling of Infiltration Characteristics by Modified Kostiakov Method. J. Water Resour. Prot. 2015, 7, 1309–1317. [Google Scholar] [CrossRef] [Green Version]
  66. Bayabil, H.K.; Dile, Y.T.; Tebebu, T.Y.; Engda, T.A.; Steenhuis, T.S. Evaluating Infiltration Models and Pedotransfer Functions: Implications for Hydrologic Modeling. Geoderma 2019, 338, 159–169. [Google Scholar] [CrossRef]
  67. Haghiabi, A.H.; Abedi-Koupai, J.; Heidarpour, M.; Mohammadzadeh-Habili, J. A New Method for Estimating the Parameters of Kostiakov and Modified Kostiakov Infiltration Equations. World Appl. Sci. J. 2011, 1515, 129–135. [Google Scholar]
  68. Ayodele, A.; Oguntunde, P.; Joseph, A.; De Souza Dias Junior, M. Numerical Analysis of the Impact of Charcoal Production on Soil Hydrological Behavior, Runoff Response and Erosion Susceptibility. Revista Brasileira de Ciência do Solo 2009, 33, 137–145. [Google Scholar] [CrossRef]
  69. Carrick, S.; Buchan, G.; Almond, P.; Smith, N. Atypical Early-Time Infiltration into a Structured Soil near Field Capacity: The Dynamic Interplay between Sorptivity, Hydrophobicity, and Air Encapsulation. Geoderma 2011, 160, 579–589. [Google Scholar] [CrossRef]
Figure 1. Measured mean infiltration rate ( i ) and final infiltration rate (Ib) for the sandy ( S ) and sandy loam ( SL ) treatments during different wetting and drying cycles (WD). Same letters in the same treatment at different WD cycles are significantly similar (p < 0.05). Error bars denote standard deviation from the mean (N = 3).
Soilsystems 03 00063 g001
Figure 2. Measured cumulative infiltration (Icum) at 15, 30, and 45 min during the wetting and drying cycles WD0, WD1, WD2, and WD4 for the sandy (S) and the sandy loam (SL) treatments. Same letters in the same time period at different WD cycles are significantly similar (p < 0.05). Error bars denote standard deviation from the mean (N = 3).
Soilsystems 03 00063 g002
Figure 3. Scatter plot of the observed and predicted infiltration rate i (mm/h) using the Kostiakov, Philip and Horton models for the sandy (S) treatments (S0, S2.5 and S5) for two extreme wetting and drying (WD) cycles WD1 and WD4, compared to WD0. The diagonal represents the line of best fit.
Soilsystems 03 00063 g003
Figure 4. Scatter plot of the observed and predicted infiltration rate i (mm/h) using the Kostiakov, Philip and Horton models for the sandy loam (SL) treatments (SL0, SL2.5 and SL5) for two extreme wetting and drying (WD) cycles WD1 and WD4, compared to WD0. The diagonal represents the line of best fit.
Soilsystems 03 00063 g004
Table 1. Description of the sequence of WD cycles applied. WD cycles were executed sequentially.
CycleDescription of the Sequence of the Cycle
WD0Sampling preparationInf
WD1 DryInf
WD2 DryInf
WD4 DryInfDryInf
WD: wetting and drying cycle; Inf: infiltration (up to 100% saturation); Dry: oven-dry at 30 °C for 72 h.
Table 2. Main physical and chemical properties reported in [47]. Particle size distribution is based on the German Standard classification [48].
TreatmentpHTCSandSiltClay
%%
S07.540.16 ± 0.01 a990.40.6
S2.57.471.83 ± 0.02 b990.70.3
S57.503.56 ± 0.03 c990.01.0
SL06.831.35 ± 0.01 d54.132.513.4
SL2.56.983.27 ± 0.03 e54.032.913.1
SL57.084.85 ± 0.04 f53.733.912.4
Biochar7.1278.36
Variables with the same letters are not significantly different (p < 0.05)
Table 3. Effect of the simulated WD cycles on the bulk density ( ρ d ) and volumetric soil water content ( θ ) on the sandy ( S ) and sandy loam ( SL ) mixtures.
Wetting and Drying Cycles (WD)
WD0WD1WD2WD4
ρ d θ ρ d θ ρ d θ ρ d θ
S01.551.3 ± 0.541.54 ± 0.031.1 ± 0.451.61 ± 0.071.2 ± 0.461.711.0
S2.51.52 ± 0.032.0 ± 1.321.49 ± 0.031.7 ± 1.141.47 ± 0.031.1 ± 0.311.480.7
S51.48 ± 0.011.7 ± 0.311.46 ± 0.021.1 ± 0.281.46 ± 0.021.1 ± 0.211.430.8
SL01.38 ± 0.024.6 ± 0.721.36 ± 0.021.8 ± 0.101.37 ± 0.012.1 ± 0.171.381.9
SL2.51.40 ± 0.055.5 ± 0.861.39 ± 0.061.9 ± 0.041.38 ± 0.052.4 ± 0.121.351.6
SL51.40 ± 0.045.2 ± 0.791.36 ± 0.051.9 ± 0.111.35 ± 0.022.3 ± 0.111.371.9
ρd in g/cm3 and θ in cm3/cm3.
Table 4. Effect of wetting and drying (WD) cycles for the repellency index, RI, of the sandy (S) and sandy loam (SL) treatments.
TreatmentWD1WD2WD4
S00.62.270.38
S2.50.940.690.78
S50.480.991.10
SL01.762.281.52
SL2.51.993.142.51
SL51.891.642.33
Table 5. Mean infiltration model parameters obtained from the Kostiakov, Horton and Philip models; for the sandy (S) and sandy loam (SL) treatments during two extreme wetting and drying (WD) cycles WD1 and WD4 compared to the initial WD condition WD0.
Model/WDParameterS0S2.5S5SL0SL2.5SL5
Kostiakov
WD0A355.1164.892.1111.765.318.7
B−0.369−0.510−0.295−0.588−0.762−0.989
NSE0.750.420.880.860.950.72
RMSE94.1072.9812.5063.4530.9272.96
  σ   201.5698.5898.58176.97136.17141.42
WD1A319.8128.761.665.335.718.7
B−0.340−0.520−0.440−0.641−0.951−0.921
NSE0.89−0.630.950.920.900.57
RMSE62.1670.049.0134.4340.1685.67
  σ   204.2256.6656.66123.44133.93133.88
WD4A142.293.660.970.144.8N.D
B−0.563−0.417−0.244−0.714−0.834N.D
NSE0.780.600.980.840.90--
RMSE79.8823.202.0141.0440.07--
  σ   175.4437.8637.86106.80127.44129.10
Horton
WD0Io1829.22503.2252.4666.5568.5565.2
Ib610.591.884.697.936.922.6
  β   15.33.42.92.02.48.9
NSE0.96−44.940.55−0.030.550.84
RMSE38.78649.3524.50174.7388.8855.62
  σ   201.5698.5898.58176.97136.17141.42
WD1Io1540.42682.0313.0609.0564.0507.6
Ib407.5121.668.450.526.815.6
  β   11.56.95.53.75.75.0
NSE0.92−92.920.760.640.970.95
RMSE53.18531.6920.4972.3421.8129.52
  σ   204.2256.6656.66123.44133.93133.88
WD4Io936.3386.8128.8585.3572.0474.5
Ib157.164.452.447.425.614.1
  β   6.31.72.13.73.32.8
NSE0.81−3.300.490.620.700.65
RMSE74.4876.279.0564.2167.9973.74
  σ   175.4437.8637.86106.80127.44129.10
Philip
WD0A125.8N.D46.5−86.4−66.2−137.2
S431.1N.D88.4363.9271.2293.0
NSE0.66--0.92------
RMSE110.20--10.18------
  σ   201.5698.5898.58176.97136.17141.42
WD1A305.1N.DN.D−57.1−143.2−115.4
S241.1N.DN.D230.7312.4241.7
NSE0.79----------
RMSE86.17----------
  σ   204.2256.6656.66123.44133.93133.88
WD4A161.956.634.4−87.5−65.2−68.9
S154.2106.251.9309.2246.0234.8
NSE0.330.880.94------
RMSE139.8112.493.06------
  σ   175.4437.8637.86106.80127.44129.10
NSE: Nash-Sutcliffe efficiency; RMSE: root mean square error; σ : standard deviation of the measured data.

