1. Introduction
Organic soil amendments (OAs) based on plant residues are suggested sustainable measures to preserve agricultural soil fertility [
1,
2] by acting as slow-release, long-term fertilizers that maintain and restore soil organic matter (SOM). Since there is the political aim in Europe to reduce the use of mineral fertilizers (Farm to Fork Strategy, [
3]) and to increase the incorporation and sequestration of carbon in soil [
4], increased use of carbon-rich organic materials on agricultural soils is expected in the future. Plant-based waste materials are of particular interest to be incorporated into the soil to achieve these goals. However, the properties of different organic materials vary widely depending on the combination of raw materials and production conditions used. Accordingly, different impacts of soil amelioration are expected using different OAs.
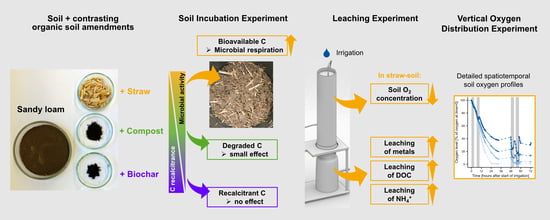
Two important properties that vary between different OAs are the bioavailability of the carbon and the ratio of carbon to nitrogen (C/N). Both properties determine the changes to soil quality parameters after application. Recalcitrant carbon, as in composted or pyrolyzed materials such as biochar, will rather take part in physicochemical interactions, such as water retention or anion and cation exchange. Readily available carbon, as in fresh biomass or dry non-composted material such as straw, can strongly increase soil microbial activity. The resulting high microbial respiration and nutrient turnover rates could lead to competition with plants for oxygen and nitrogen compounds. Therefore, OAs should be applied with care to prevent undesirable consequences.
It is well-known that microbial organic matter decomposition is one major driver of oxygen consumption in soil. Soil respiration decreases in deeper soil layers because organic matter and oxygen are mainly supplied to the surface and upper layers of soil. If soil pores are filled with water due to precipitation, irrigation, or flooding events, aeration of the soil will be limited since oxygen diffuses 10,000 times slower through the water as compared to air [
5]. This results in hypoxic conditions within the soil if the demand for oxygen exceeds the resupply. Plant roots, soil animals, and microorganisms of non-paddy soils that require oxygen might be harmed, and crop growth and yield might be reduced. Moreover, numerous chemical processes that depend on redox potential will be strongly affected, such as the mineral forms of nitrogen in the soil, leading to economically and ecologically problematic N-losses via leaching and gaseous emissions [
6]. The mobility of metals in the soil will also be strongly affected by changes in redox potential. Some elements, such as Mn and Fe, are especially sensitive to changes in redox potential since their oxides precipitate, while their reduced ions are water soluble and mobile in soil. Oxides of Mn and Fe also contain other metals, so their mobility might be affected as well [
5]. Thus, the redox potential is expected to change the mobility of essential plant micronutrients as well as toxic heavy metals. Because minerals, microorganisms, and plants react fast to changes in oxygen availability and redox potential, it is important to understand the dynamics of oxygen in organically amended soils upon rainfall.
Detailed records of soil oxygen concentrations in relation to precipitation during field experiments have been made in the context of greenhouse gas emissions [
7]. During several events with substantial precipitation, oxygen concentrations did not decrease below 5%
v/
v at a depth of 30 cm in well-drained soil, whereas oxygen dropped to near 0% several times in poorly-drained soil [
7]. This study showed that hypoxia can form in temperate soils upon precipitation, even without the additional application of organic material. However, a study on grassland soil found no substantial oxygen decrease in soils irrigated with up to 100 mm, except for a short-term drop to 13%
v/
v immediately after the deposition of urine [
8]. In laboratory experiments, manure was found to deplete oxygen quickly after injection into soils, and anoxia prevailed for more than two days [
9,
10]. Similarly, the application of straw particles lowered oxygen concentrations of the surrounding soil below 10% within a few hours, while biochar, a recalcitrant carbon material, did not [
11]. Applications of straw in a field experiment resulted in only slightly lowered or even increased oxygen concentrations, but when in combination with N-sources and higher precipitation, oxygen concentrations dropped to about 10%
v/
v [
12]. These studies showed that the extent and speed of hypoxia formation in soil was increased with higher availability of carbon and nutrients and with higher precipitation.
However, there was a gap in the existing literature because most of the studies that provided insights into soil oxygen concentrations of non-paddy soils were limited to one type of organic soil amendment, did not measure microbial activity, or investigated the effects on either the N cycle or metals in soil. Thus, a study was missing that compared several OAs of different substrate qualities that allowed to link the properties of different organic materials to the observed effects on microbial respiration and oxygen consumption in irrigated non-paddy soil and combined these data with analyses of the macro- and micronutrients for plants and other metals leached from the soil. Therefore, the objectives of this study were to perform the following:
- (i)
Compare different OAs of contrasting substrate quality regarding their effect on the microbial activity and availability of N in soil;
- (ii)
Investigate whether an increased microbial activity due to OAs can lead to hypoxia in soil;
- (iii)
Investigate how the OAs and the potentially resulting hypoxia affect the leaching of macronutrients and metals from soil.
To this end, we characterized the relationship between organic material properties, microbial activity, soil oxygen, mineral nutrients, and metals in soil to improve our understanding of the consequences of the application of OAs. These soil processes of interest were investigated in laboratory incubation and soil column leaching studies. The hypothesis was that biochar, compost, and straw represent a gradient of increasing C degradability for soil microorganisms and that this will result in increased microbial respiration, which causes hypoxia in soil upon irrigation with consequences for the leaching of nutrients and metals from soil.
2. Materials and Methods
2.1. Soil Characteristics
A sandy loam soil, the reference soil RefeSol 01-A, was obtained from the Fraunhofer Institute for Molecular Biology and Applied Ecology (IME, Schmallenberg, Germany). It was sampled from the topsoil (0–25 cm) of a Dystric Cambisol. The soil was sieved to 2 mm and stored in loosely tied plastic bags at 4 °C for less than three months before use. Soil characteristics as determined by IME were 69.8% sand, 24.4% silt, 5.9% clay, pHCaCl2 = 5.38, pHH2O = 6.03, Corg = 9.5 g kg−1, Ntotal = 0.81 g kg−1, CECeff (effective cation exchange capacity) = 1.4 cmol(+) kg−1, WHCmax (maximum water holding capacity) = 293 g kg−1.
As WHC
max depends on soil packing, we determined WHC
max for the soil packed in the soil columns used for the experiments of this study to be 257.5 g kg
−1 (see
Supplementary Material). This value was used as 100% WHC
max for setting WHC-related water contents in all experiments conducted.
2.2. Organic Soil Amendments
Three different organic materials were used for the amendment of soil. Shredded wheat straw was provided by a local farm near Aachen, Germany, and the stalks were further cut by hand with scissors to a length <6 cm. The compost and the biochar product (Palaterra
® Initial) were provided by Palaterra, St. Alban, Germany. According to the manufacturer, the compost was made from green cuttings of municipal parks and lawns and was fully matured. The biochar product consisted of 80% biochar made from wood (>600 °C), mixed with 10% organic residues and 10% mineral amendments, inoculated with a mixture of microorganisms, and fermented (“loading” of the raw biochar). Such biological post-pyrolysis treatments are required before the application of biochar to temperate soils and lead to the formation of an organic coating on the biochar’s surface [
13,
14].
Relative dry mass of OAs was determined after drying at 105 °C to constant weight and was found to be 92.0% for straw, 67.2% for compost, and 45.5% for biochar product.
2.3. Chemical Analysis of Soil and Organic Amendments
2.3.1. Elemental CHN Analysis of Soil and Organic Amendments
The total content of C, N, and H of soil and the OAs were determined using an elemental analyzer in CHN mode (VARIO EL III, Elementar Analysensysteme, Langenselbold, Germany). The soil and OAs were dried at 105 °C until weight constancy, ground with a mortar, and afterward kept in a desiccator with silica gel. For soil and the OAs, four replicates of 20 mg and 5 mg, respectively, were prepared for analysis by packing the sample material into tin boats and placing them into the autosampler of the elemental analyzer. Before analysis of the samples, the device was calibrated with 6 replicates of 5 mg acetanilide. To calculate the changes of the C, N, and H contents of the soil due to the OAs, the dry weight of the OAs had to be considered because the fresh weight of the OAs was used for the amendment of the soil.
2.3.2. Metal Analysis of Soil, Organic Amendments, and Fertilizer
The contents of 12 metals in the soil, the OAs, and the mineral fertilizers ammonium nitrate and superphosphate were analyzed (aqua regia soluble fractions). The materials were dried and homogenized so a representative aliquot could be taken for analysis. The samples were digested according to [
15] method B. For this purpose, 6 mL of HCl and 2 mL of HNO
3 were added to 0.5 g of sample in microwave vessels and left for 30 min at room temperature. The vessels were placed in the microwave, and the following temperature program was started: 15 min heating up to 175 °C, 10 min holding 175 °C, and 30 min without heating. After reaching room temperature, the samples were filtered (2–3 μm). Process control using pure water was treated identically in parallel.
For measuring concentrations of manganese (Mn), iron (Fe), aluminum (Al), chromium (Cr), cobalt (Co), nickel (Ni), zinc (Zn), arsenic (As), cadmium (Cd), mercury (Hg), lead (Pb), and uranium (U), inductively coupled plasma–mass spectrometry (ICP–MS, SYS-IM-7700, Agilent Technologies, Santa Clara, CA, USA) was used. With the dilutions that were required to measure the different elements in their appropriate concentration rage, each sample was measured multiple times, so the quantification of elements could be confirmed by measuring another dilution of the same sample.
2.4. Soil Incubation Experiment in Buckets
The Soil Incubation Experiment was designed to investigate how microbial activity and nitrate availability in the soils developed after the organic amendment at a 1% rate. To this end, four buckets were each filled with 500 g of soil (dry weight). Three of them received additional 5 g of one of the three OAs (wet weight). All buckets received the same amount of water, which was calculated to set the non-amended soil to 50% of WHCmax and were homogenized with a spatula. The resulting three soil mixtures and the non-amended soil are jointly referred to as “soils”. The buckets were loosely sealed with aluminum foil, and the soils were incubated at 18 °C in the dark for seven weeks, regularly maintaining the water content according to loss of weight. Sampling for microbial activity assay and determination of nitrate was performed after 0, 1, 2, 3, 4, and 7 weeks during this incubation period, as described below.
2.4.1. Dimethyl Sulfoxide Reductase Activity Assay
As a measure of microbial activity, the dimethyl sulfoxide reductase activity assay [
16] was performed with minor modifications. For this purpose, 1 g of soil was transferred into a 20 mL brown glass vial, 200 µL of a 5% aqueous solution of dimethyl sulfoxide (DMSO) was added, and the vial was sealed gas-tight (
n = 3). After 24 h at 29 ± 2 °C, the amount of formed DMS was analyzed by manually injecting 100 µL of headspace into gas chromatography-mass spectrometry (GC–MS, Agilent Technologies, Santa Clara, CA, USA, 6890N, DB-5ms capillary column 30 m × 250 µm × 0.25 µm, split ratio 16.4:1, injection temperature 250 °C, oven isothermal at 50 °C). Quantification was performed according to a linear calibration (6.68–133.65 ng DMS per injection).
2.4.2. Analysis of Nitrate in Soils
To investigate the readily available amount of nitrate in the soils during the incubation, eluates were produced by shaking 16 g of soil (wet weight) in 80 mL of 0.01 M calcium chloride solution (1:5
w:
v) for 1 h on an orbital shaker at 160 rpm (
n = 1). After filtration (20 µm, Whatman 41), eluates were stored at −20 °C. Immediately after refrigerating of eluates, photometric determination of nitrate was performed according to [
17] with slight modifications using a double-beam photometer (UV-160A, Shimadzu, Kyoto, Japan). Samples were acidified with H
2SO
4 and split. In one sample part, nitrate was reduced by copper-covered zinc granules overnight. The reduced sample was used as reference for the photometric measurement of the original sample at 210 nm. Linear calibration ranged from 0.2–3.6 mg NO
3-N/L. While no technical replicates were performed for the nitrate determination, the sampling of a time series allowed us to validate the measurements.
2.5. Leaching Experiment in Soil Columns
For the amendment of the soil, 12.3 g of one of the OAs (wet weight) was mixed into 1230.3 g of soil (dry weight). The resulting three soil mixtures and the non-amended soil are jointly referred to as “soils”. All soils received the same amount of water, which was calculated to set the non-amended soil to 50% of WHC
max. Columns were made from PVC tubes (height of 33 cm, inner diameter of 5.9 cm). On the bottom, a funnel was attached, and the leachate was collected in a plastic bottle below. A sieve plate (PVC, 1 mm holes) was placed on the bottom of each soil column with a Whatman 41 paper filter and a glass wool layer on top. The experimental setup is presented in
Figure 1A. The filling of the columns with the soil was performed in portions by gently compressing with a stamp to aim for a homogenous soil density of 1.5 g/cm
3, resulting in a height of 30 ± 2 cm.
Six replicates were prepared from each soil for incubation at 18 ± 1 °C for seven weeks in the dark. The columns were loosely sealed with aluminum foil, and the water content was maintained by adding water according to loss of weight.
2.5.1. Oxygen Measurements
After seven weeks of incubation and prior to application, one oxygen sensor per column was installed at approx. 2 cm from the edge of the column and to a depth of 7 cm (as seen in
Figure 1A). Fiber optic oxygen sensors (DP-PSt7-10, detection limit 15 ppb, PreSens, Regensburg, Germany) together with a stand-alone fiber optic oxygen transmitter device (Microx 4, PreSens, Regensburg, Germany) were used. Oxygen measurements at each sensor were performed manually about every 30 min during the first and third as well as during the beginning of the second and fourth irrigation events. A single measurement was performed between the second and third as well as after the fourth irrigation event. Because an optical measurement technique was used, a single measurement took only a few seconds and did not consume the oxygen required for detection. Before irrigation started, oxygen levels close to normoxia were detected at all oxygen sensors (19.4–21.2%
v/
v), indicating a thorough oxygen supply to all columns. To facilitate comparison of the data, these initial oxygen levels were set to 100% for each individual sensor.
2.5.2. Application of Fertilizer to Soil Columns
Application of mineral N- and P-fertilizers was performed on three of the six replicates from each soil with aqueous solutions of ammonium nitrate (EMSURE®, ≥95%, Merck) and superphosphate (Superphosphate 18%, ICL Fertilizers, Ludwigshafen, Germany). Per column, 39.1 mg of ammonium nitrate and 15.31 mg of superphosphate were applied (called “+F”), which equals 6.83 mg of NH4-N, 6.83 mg of NO3-N, and 0.68 mg of PO4-P, or 50 kg N ha−1 and 4.4 kg P ha−1. The three remaining replicates from each soil did not receive any application and were used as non-fertilized controls.
2.5.3. Irrigation of Soil Columns and Sampling
Irrigation was started 24 h after the application of fertilizer. Similar to [
18], a rate of 200 mm 0.01 M calcium chloride solution was applied dropwise (548 mL per column). The amount was divided into four irrigation events of 50 mm each, applied over a period of approx. 60 h (0–4 h 50 mm, 6–10 h 50 mm, 48–52 h 50 mm, 54–58 h 50 mm). These are approximate values due to variations in dripping speed and infiltration rates between individual columns. The leachate samples were collected before the start of the next irrigation event.
2.5.4. Analysis of Ammonium, Nitrate, and Phosphate in Leachates
Photometric methods for determination of ammonium, nitrate, and phosphate were performed on a double-beam photometer (UV-160A, Shimadzu, Kyoto, Japan), according to [
17], with slight modifications, immediately after refrigerating of leachate samples. In brief, for the determination of ammonium, samples were mixed with an alkaline solution of sodium nitroprusside, sodium salicylate, and sodium dichloroisocyanuric acid, and absorbance was photometrically measured at 660 nm after 30 min. Linear calibration ranged from 0.3–3.2 mg NH
4-N/L. The determination of nitrate was conducted as described above (
Section 2.4.2). For determination of ortho-phosphate, samples were filtered (0.45 µm) and mixed with ascorbic acid, ammonium heptamolybdate, and potassium antimonyl tartrate, and absorbance was photometrically measured at 700 nm after 10 min. Linear calibration ranged from 0.01–0.5 mg PO
4-P/L.
2.5.5. Metal Analysis in Leachates
At each sampling time point after the four irrigation events, 10 mL of the leachate was taken for metal analysis and pre-stabilized with 100 μL of pure nitric acid. After all four pre-stabilized leachates from one soil column were pooled, 200 µL of pure hydrochloric acid was added. In addition to the collected samples, the 0.01 M CaCl
2 solution used for irrigation and process control (pure water filtered to 0.45 µm) was analyzed. Measurements of metals were performed as described in
Section 2.3.2. Metal contents of samples were calculated by subtracting the values of the process control to correct for potential background metal contamination.
2.5.6. Dissolved Organic Carbon in Leachates
To estimate the amount of dissolved organic carbon (DOC) leached from soil columns, UV absorption of the leachates of the second irrigation event was analyzed based on findings that the content of DOC in the soil solution is positively correlated (r
2 = 0.93,
n = 50, 0.5–14.7 mg DOC L
−1) with the absorbance at λ = 254 nm [
19]. Original leachate samples were filtered (0.45 µm) to remove particulate organic matter. Measurements were performed on the day of sampling. Amounts of DOC in soil solution were calculated from the absorbance at 254 nm (A
254 nm, unit: m
−1) according to Formula (1) from [
19].
The calculated DOC contents in the leachates of this study exceeded the range of 0.5–14.7 mg L
−1 that was given by [
19], but it was assumed that the linear relationship of DOC and A
254nm was still valid for the range of the samples.
2.6. Vertical Oxygen Distribution Experiment in Soil Columns
In order to investigate the depth-relation of the oxygen concentration, three additional soil columns were set up: soil without amendment, straw–soil, and straw–soil +F. The soil columns were built and packed identically to the ones used in the Leaching Experiment but with fiber optic sensors (DP-PSt7-10, PreSens, Regensburg, Germany) being inserted horizontally from the side at different depths (at 2 cm, 7 cm, 15 cm, and 28 cm below the surface,
Figure 1B). During packing of the columns, the sensors were inserted through small holes in the PVC tubes, with the tip of the sensor placed in the middle of the soil column. The holes were sealed with sealant (Terostat-IX, Henkel Technologies, Düsseldorf, Germany) from the outside of the column. Incubation, application of mineral fertilizers, and irrigation were done as described in
Section 2.5.2 and
Section 2.5.3. Before irrigation started, oxygen levels close to normoxia were detected at all oxygen sensors (19.4–20.6%
v/
v), indicating thorough oxygen supply to all columns and at all depths. For easier data evaluation, these initial oxygen levels were set to 100% for each individual sensor. Oxygen measurements were performed about every 30 min during irrigation and for a few hours after an irrigation event had ended.
2.7. Statistical Analysis
Analysis of variance (ANOVA, one-way, α = 0.05) followed by Tukey’s tests for multiple comparisons (α = 0.05) of CHN analysis data and leached amounts of nutrients, metals, and DOC were conducted in GraphPad Prism (version 6, Graphpad Software, Boston, MA, USA).
4. Discussion
4.1. Linking Organic Material Properties to Microbial Activity and Nitrate Consumption
The OAs compared in this study (straw from wheat, compost made from green cuttings, and biochar made from wood) were all plant-based, carbon-rich materials but represented a gradient of processing from non-processed to composted to pyrolyzed material. The higher the degree of processing, the more recalcitrant and less accessible the delivered carbon to the soil microorganisms, which was confirmed in the elemental analysis (
Table 1) and DMSO-reductase activity assay (
Figure 2). The H/C ratio was suggested as an indicator to compare the recalcitrance of biochars [
20]. A low H/C value indicates high aromaticity and low degradability of the C for soil microorganisms. The H/C ratio of the biochar product was much lower than that of the straw and compost. However, the H/C ratio only works well for materials of high C content and low content of other H-binding partners, such as O and N. Therefore, the H/C ratio did not indicate the differences in the C degradability of the compost and straw properly. Instead, the microbial activity after the amendment was a better indicator of this.
The high microbial activity in straw–soil was related to the readily available C, which stimulates the activity of r-strategists in microbial communities [
21]. The absence of such an increase of microbial activity in the other soils showed that the compost provided only a little, and the biochar provided no substantial amounts of readily degradable C to the soil. The remarkably high and variable microbial activity in straw–soil at week 0 (
Figure 2) might be due to carbohydrates that were released from the straw material and were immediately available to the initial soil microbial community that was adapting its metabolism to the incubation conditions. However, with the nitrate depletion within the first week (
Figure 3), straw degradation was delayed, and microbial activity was lower after one week. Then, K-strategists might have been in advance [
22]. In short, the microbial activity was driven by the different availability of the C from the OAs.
Due to its high C/N ratio (
Table 1), straw input caused a high microbial demand for N to convert the available C from straw into biomass. An appropriate C/N ratio for microbial degradation of organic materials is in the range of 25–30 [
23]. Thus, the C/N ratio of the compost was the most suitable among the OAs and similar to what was reported for other green composts [
24,
25], and no nitrate depletion was observed. The C/N ratio of the biochar product was comparable to the straw, but due to the low availability of the C from biochar, no nitrate depletion occurred. Instead, nitrate concentrations in non-amended, compost soil, and biochar soil increased during incubation, indicating that net nitrification took place during the aerobic incubation conditions. The N content of the biochar product was higher than that of many raw wood-based biochars [
26,
27,
28] since the biochar product used in this study had passed a biological post-pyrolysis treatment which “loaded” the biochar with nutrients. Nevertheless, the provision of N by biochar or compost was much less important for microbial activity than the provision of degradable C by straw, causing the observed clear differences (
Figure 2).
The rise of the microbial activity from week two to week four in all soils indicated a growing microbial biomass that peaked at or after week four, while afterward, there was a decline observed in all soils (
Figure 2). The incubation period of seven weeks was chosen to pass the microbial priming effect based on a study that reported that two months after compost application, the microbial biomass declined by 60–85% due to the decline of easily available compounds ([
29], cited in [
30]). This supports the microbial activity measurements of this study. Therefore, the seven weeks of incubation were suitable to pass the peak of the priming effect after the application of the OAs, and further treatments and analyses, such as the irrigation of the soil columns, took place during a more stable phase of the development of the soil microbial communities.
With the elemental analyses and the Soil Incubation Experiment, the first objective of this study, to compare different OAs of contrasting substrate quality regarding their effect on the microbial activity and availability of N in soil, was achieved.
4.2. Depletion of Oxygen in Organically Amended Soils
Strong hypoxia was observed in the straw-amended soil columns (
Figure 4) due to the high microbial activity (high oxygen consumption rate) in combination with the heavy irrigation (low oxygen diffusion rate). Because the non-amended soil, compost soil, and biochar soil showed a much lower microbial activity (
Figure 2), the oxygen consumption in these soils was much lower than in straw–soil. Consequently, the oxygen consumption rate was not high enough to cause extensive hypoxia in these soils upon irrigation. Similar results on a smaller scale were reported by [
11], who observed the formation of hypoxia around straw particles in moist soil (at 85% of WHC
max). Surprisingly, the authors found that the soil around particles of biochar remained oxic. The authors attributed this observation to the high porosity of the biochar enhancing oxygen diffusion. In our study, however, biochar soil showed slightly stronger hypoxia than non-amended soil upon irrigation (
Figure 4). This can be explained by the different properties of the biochar used. In the study reported by [
11], raw biochar was used, while in our study, the biochar received a biological loading process. Thus, the biochar product used in our study did not increase oxygen diffusion but probably inhabited respiring microorganisms in its organic coating [
13], resulting in the observed differences in these two studies.
From the Leaching Experiment, it was concluded that only straw but not compost or biochar amendments led to oxygen depletion in soil upon irrigation due to the provision of easily degradable carbon increasing the microbial oxygen demand, especially after the application of mineral N. Other studies support the finding that bioavailable organic matter controls bulk oxygen concentrations [
31]. However, having only one sensor per soil column and the variability of the replicate soil columns being high (
Figure 4), a more detailed investigation of the processes in the straw–soil columns were needed. The Vertical Oxygen Distribution Experiment was a repetition of parts of the Leaching Experiment with an improved setup (four oxygen sensors per column). Overall lower oxygen concentrations were measured as compared to the respective soil columns in the Leaching Experiment. This indicated that the installation of the oxygen sensors from the side and the possibility of sealing this spot with sealant was superior to the installation of the oxygen sensors from the top (without sealant). Thus, the results from the Vertical Oxygen Distribution Experiment were considered to be more precise. This experiment was not conducted with compost soil and biochar soil because their microbial activity was similar to the non-amended soil (
Figure 2), and the Leaching Experiment showed that their oxygen concentrations upon irrigation were similar to the non-amended soil (
Figure 4). Thus, the oxygen profile of the non-amended soil (
Figure 8A) can be considered to be representative of the compost soil and biochar soil as well. To conclude, the use of multiple sensors at different depths in the Vertical Oxygen Distribution Experiment confirmed the findings from the Leaching Experiment but allowed a much deeper insight and improved our understanding of the spatiotemporal dynamics of the oxygen concentration in irrigated amended soils.
The dynamic fluctuations of oxygen in the upper centimeters of the soils (
Figure 8) most likely occurred due to the resupply of oxygen from the atmosphere as soon as the irrigation stopped, as the water could drain well through the sandy soil and evaporate from the surface. Since the soil used was sieved and homogenously packed, no macropores were responsible for the oxygen influx, while an accelerated diffusion of oxygen between the soil and the walls of the column cannot be excluded. With a natural soil structure, the reoxygenation of the soil might be similar or even faster due to macropores. However, oxygen entering the column was consumed rapidly due to the high microbial oxygen demand or chemical redox reactions, resulting in the observed fluctuations. Because the mineral fertilizers enabled faster straw degradation, the depletion of oxygen was much faster in fertilizer-applied columns (
Figure 8C). The resupply of oxygen from the atmosphere barely reached the sensor at −7 cm in the water-saturated straw–soil +F column but was consumed in the upper soil layers already. It took about 24 h after the second irrigation event had stopped for the oxygen levels to start rising again at the sensor at −7 cm. This data showed that the hypoxia was long-lasting in soil parts that were more than just a few centimeters away from the soil surface.
The experiments clearly showed that oxygen depletion is fast, extensive, and long-lasting in different depths of straw-amended soil after irrigation, even when the incorporation of the straw was already seven weeks ago (
Figure 8). It is well known that straw-amended soils significantly increase basal respiration compared to unamended soils [
32] and that this enhances methanogenesis in paddy soils [
33,
34]. Here, we show that straw amendments can result in almost anoxic conditions within a few hours upon irrigation, even in temperate sandy soils with low initial organic C and even months after the amendment with straw. Thus, the second objective, to investigate whether an increased microbial activity due to OAs can lead to hypoxia in soil, was achieved.
4.3. Consequences for Mineral Nutrients and Toxic Metals
The leaching of macronutrients and metals was markedly affected by the application of the OAs. The almost complete retention of fertilizer-applied nitrate in straw–soil +F was probably the result of denitrification, assimilation, and dissimilatory nitrate reduction to ammonium (DNRA). The hypoxic conditions in the straw–soil and straw–soil +F might have especially induced DNRA because a high C/N ratio of the substrate, like straw, favors DNRA, whereas a low ratio favors denitrification [
35,
36,
37]. Consequently, the nitrate that was applied with the fertilizer was partly transformed into ammonium, which was found in the leachates of the straw-amended soils (
Figure 5). Most of the leached ammonium was found in the leachates after the third and fourth irrigation events, indicating that DNRA-performing microorganisms were especially active between the second and third irrigation event, when straw-amended soils were clearly hypoxic. It was shown in other studies that nitrogen fixation could be greatly increased after the addition of straw followed by waterlogging [
38,
39,
40], which also could have increased the amounts of ammonium in straw–soil and leachate. Therefore, these high amounts of ammonium most likely originated from the adaptation of the microbial metabolism to the hypoxic conditions and the substrate quality of the straw.
Regarding metals, especially the compost and superphosphate were found to contain elevated amounts of several metals, including contaminants such as Cd, As, or U (
Table 2). There are currently no limits for U in organic or mineral fertilizers in Germany, but the German Environment Agency suggests setting limit values for P-fertilizers similar to Cd [
41]. However, this input of metals via the application of OAs and mineral fertilizers was not reflected by the content of metals in the leachates. Instead, the mobility of metals initially present in soil was changed by the addition of OAs, most substantially by the addition of straw (
Figure 6), due to changes in redox potential and the release of DOC (
Figure 7). DOC can form complexes with multiple metals in soil and increase their leaching [
42,
43]. In low redox conditions, especially Mn(III,IV)oxides are reduced to Mn
2+ and Fe(III)oxides to Fe
2+, which increases their solubility, mobility, and plant availability. At decreasing redox potential, Mn ions are reduced earlier than Fe ions, resulting in higher mobility and earlier transfer of Mn than Fe in soils [
5]. Consequently, Mn was found in even higher concentrations than Fe in leachate from straw-amended soil columns (
Figure 6). Since Mn and Fe oxides often contain other metals, such as Mo, Co, Cu, and Zn, their reduction can increase the mobility of these metals as well [
5]. Concentrations of Zn, however, were not increased from straw–soil, showing that further interactions caused a net reduction of the mobility of Zn in straw–soil. Higher amounts of Co and As leached from straw–soil while their content was low in the straw material; therefore, they might have been released from iron- and manganese-oxides in the reducing oxygen-depleted milieu. While Mn, Fe, Zn, and Ni are important micronutrients for crop plants and Co is needed by microorganisms that are essential to plants [
44], As and Cd are toxic to all organisms. The impact of the straw-induced lower redox conditions, therefore, mobilized plant nutrients and toxicants at the same time.
Despite the stronger hypoxia in the mineral fertilized soils (
Figure 4) that could have increased the leaching of metals, lower concentrations of metals leached from the fertilized soil columns overall. Because the phosphates and sulfates of the superphosphate are possible direct interaction partners for metal cations [
45], they might have reduced the solubility of metals in soil by forming precipitates. The addition of nitrate with mineral N-fertilizer must have mitigated the reduction in redox potential, and therefore it partly prevented the reduction of Mn- and Fe-oxides since nitrate serves as an electron acceptor in the soil during hypoxia [
46]. Consequently, the concentrations of Mn, Fe, and Al were not higher but significantly lower in leachates from straw–soil when the mineral fertilizers were applied.
Despite the metal adsorption potential that is often attributed to biochars [
47,
48], concentrations of metals were not strongly decreased in leachates from biochar-amended soil columns (
Figure 6). Only the concentrations of Zn and Cd in the leachate were reduced, although their content was higher in the biochar material than in the soil. This indicated a binding capacity of the biochar for Zn and Cd, which prevented the leaching of parts of soil-borne Zn and Cd. However, the leaching of Zn and Cd was even stronger and reduced by the compost amendment. Many binding sites of the biochar product might have been already occupied due to the “loading” process of the biochar product and reduced adsorption capacity compared to raw biochar. Therefore, no adsorption potential to the biochar specifically was observed for any of the metals investigated. In all experiments conducted, the biochar product did not show strong effects on microbial activity, oxygen demand, leaching of nutrients and metals, DOC, or pH. Therefore, the biochar product might be suitable for increasing carbon sequestration in arable soil without causing substantial effects on soil processes and soil organisms. However, other interactions, such as the adsorption of organic substances, have not been investigated in this study.
Overall, the third objective, to investigate how the OAs and the hypoxia affect the leaching of macronutrients and metals from the soil, was achieved by conducting the Leaching Experiment.
4.4. Relevance for Field Situation
Many different types of soils are used as arable land, and the texture of the soil is one key parameter to drive the aeration of the soil. The soil used in this study was less prone to the formation of hypoxia due to the sandy texture, allowing good drainage, and the low initial carbon content, indicating low microbial biomass. Nevertheless, strong hypoxia was observed upon irrigation after the application of organic matter from straw and mineral fertilizers to this soil. This effect is expected to be promoted by fine soil texture, higher organic C, and shortly after straw incorporation—conditions that apply to many field situations.
The investigated upper 30 cm of soil represents the managed (plowed) soil horizon (Ap) in agricultural soils and the main crop root area. From a farmer’s perspective, the transition of nitrate into ammonium, as observed in the straw–soil columns, is beneficial for plant nutrition because ammonium is much less prone to leaching than nitrate. However, it is likely that not all nitrate was converted to ammonium in straw–soil, and large amounts of N were also lost to gaseous emissions of N2 and N2O, which have not been investigated in this study. Nevertheless, nitrate leaching into groundwater is a serious environmental impact of intensive agriculture. The presented data suggest that straw amendments can mitigate the leaching of nitrate after the application of mineral N fertilizer and retain N in soil. However, straw applications increase the competition of plants and microorganisms for oxygen and N, and the negative consequences of those conditions need to be considered and prevented.
There are only a few studies available that investigated soil oxygen concentrations in the field to compare our findings from the laboratory with the field situation. In a field trial in Northern China, oxygen concentrations were monitored under different crops, irrigation, and fertilization regimes [
12]. Oxygen concentrations slightly dropped (to about 16–20% O
2 v/
v) within four hours after irrigation (short-term surface flooding, 70 mm), similar to the findings of our study, and rose again within the following one or two days after water infiltration. Formation of hypoxia was slower but more intense (about 6–18% O
2 v/
v) after an extreme rainfall (311 mm). Overall, hypoxia was less intense than in our study, despite the straw return and conventional N fertilization. This indicates that under field conditions, plant roots, and macropores ease the oxygen influx into soil. In addition, crop plants have a strong impact on the endpoints investigated in this study by influencing pH, carbon availability, and oxygen levels in their rhizosphere [
49]. Therefore, plants are relevant to the field situation. Nevertheless, the main conclusion drawn from our oxygen measurements, that in water-saturated soils, microbial activity can cause hypoxic conditions that will last for longer than 24 h in parts that are more than just a few centimeters away from normoxic air, is expected to be also valid in the field situation.
Further research is required to investigate the occurrence of hypoxia in different soil types, upon different precipitation intensities, and during different arable management strategies. Other organic materials, such as liquid manure, which also cause fast anoxia in soil [
9,
10], are expected to have similar or even stronger impacts than straw and are used frequently in arable farming. Systematic investigations into such scenarios will allow a deeper mechanistic understanding and the evaluation of the importance of different parameters that play a role in the formation of hypoxia. This knowledge is needed to develop strategies to mitigate strong hypoxia in temperate agricultural soils to prevent the insufficient supply of oxygen and nitrogen to crop roots and the increased mobility of toxic metals in soil.
5. Conclusions
To conclude, the hypothesis was found to be true: the degree of processing determined the bioavailability of the C of the OAs and was overall the most determining factor that had a far-reaching impact on all endpoints measured. The strongest effect on microbial activity was observed by the straw amendment. Due to the high C/N ratio of straw, nitrate was depleted, and the high microbial oxygen demand resulted in steep oxygen gradients and almost anoxic conditions within a few hours after the start of irrigation. Especially, if mineral N- and P-fertilizers were added, hypoxia occurred fast and lasted for at least a few days. Apparently, microbial N cycling adapted to these conditions as amounts of ammonium were increased. The straw amendment, therefore, could mitigate nitrate leaching. However, it caused the mobilization and leaching of metals present in the soil, including essential plant micronutrients as well as toxic metals. The compost only slightly increased microbial activity and, despite high metal contents, reduced the leaching of Zn and Cd. The biochar product mostly showed no effect compared to non-amended soil throughout all experiments and, therefore, might be suitable for carbon sequestration without substantially affecting soil processes and organisms. Field studies that investigate the prevalence and effects of hypoxia in the presence of plant roots and macropores are required to close knowledge gaps in order to prevent negative impacts of the application of OAs with high bioavailability on crop plants, soil organisms, and the environment.


 ,
, 


