Article

Response of Sunflower Yield and Water Productivity to Saline Water Irrigation in the Coastal Zones of the Ganges Delta

by
Khokan Kumer Sarker
1,
Mohammed Mainuddin
2,*,
Richard W. Bell
3,
SK Shamshul Alam Kamar
1,
Mohammad A. R. Akanda
1,
Bidhan Chandro Sarker
4,
Priya Lal Chandra Paul
5,
Mark Glover
6,
Mustafa Kamal Shahadat
1,
Mohammad Shahidul Islam Khan
1,
Md. Harunor Rashid
1 and
Edward G. Barrett-Lennard
3
1
Bangladesh Agricultural Research Institute (BARI), Gazipur 1701, Bangladesh
2
CSIRO Environment, Canberra, ACT 2601, Australia
3
Centre for Sustainable Farming Systems, Murdoch University, Perth, WA 6150, Australia
4
Agrotechnology Discipline, Khulna University, Khulna 9208, Bangladesh
5
Bangladesh Rice Research Institute, Gazipur 1701, Bangladesh
6
CSIRO Agriculture and Food, Canberra, ACT 2601, Australia
*
Author to whom correspondence should be addressed.
Soil Syst. 2024, 8(1), 20; https://doi.org/10.3390/soilsystems8010020
Submission received: 4 August 2023 / Revised: 20 November 2023 / Accepted: 23 January 2024 / Published: 29 January 2024

Abstract

:
The intensification of cropping systems in the salt-affected coastal zones of the Ganges Delta can boost food security in the region. The scarcity of fresh water, coupled with varying degrees of soil and water salinity are however limiting factors for the expansion of irrigated cropping in that area. In this study, we assessed the potential of growing sunflowers using combinations of low and medium saline water for irrigation. The experiments were conducted at two locations with six irrigation treatments in 2016–2017 and 2017–2018. The treatments were: T1—two irrigations at early vegetative (25–30 days after sowing; DAS) and flowering stages (60–65 DAS) with low salinity water (LSW, electric conductivity, ECw < 2 dS m−1); T2—two irrigations, one at the vegetative stage with LSW and one at the flowering stage with medium salinity water (MSW, 2 < ECw < 5dS m−1); T3—two irrigations, one at the vegetative stage with LSW and one at seed development stage (75–80 DAS) with MSW; T4—three irrigations at the vegetative, flowering and seed development stages with LSW; T5—three irrigations, at vegetative stage with LSW, and flowering and seed development stages with MSW; and T6—three irrigations, two at the vegetative and flowering stages with LSW and one at the seed development stage with MSW. Irrigation with LSW at early growth stages and MSW at later growth stages did not significantly (p < 0.05) affect the yield compared to the LSW irrigation at early and later growth stages. Crop water productivity and irrigation water productivity of sunflowers (p < 0.001) increased substantially with the decreasing amount of irrigation water with an average of 1.18 kg m−3 and 2.22 kg m−3 in 2017 and 0.92 kg m−3 and 1.29 kg m−3 in 2018, respectively. Grain yield was significantly correlated with root zone solute potential. The flowering and seed development stages of sunflowers in February–March were sensitive to both low and medium saline water irrigation for seed yield. Overall, the results show that irrigation with LSW (ECw < 2dS m−1) at early growth stages and MSW (2 < ECw < 5dS m−1) at later growth stages could be an option for dry-season sunflowers in the coastal zones of the Ganges Delta which would allow double cropping in this area.

1. Introduction

Coastal saline soils are a growing concern for food security [1]. The coastal zone of the Ganges Delta, where the livelihood of 40 million people mostly depends on agriculture, is affected by varying degrees of soil and water salinity, increased salt-water intrusion and scarcity of suitable irrigation water in the dry season [2]. In the dry (rabi) season, crop establishment can be limited by waterlogging during the optimum sowing period, while soils dry out and accumulate salt in the root zone later [1,2]. Consequently, about 0.7–0.8 million ha of agricultural land remains fallow, which can be brought under cultivation [3,4]. In many countries, fresh water is relatively scarce, and saline water irrigation reduces crop yield. However, with appropriate management practices crop production is possible in saline areas [5]. The scarcity of fresh water, drought and accumulation of salts combined with varying degrees of salinity affect the crop growth and limit the expansion of crop area in the dry season in the coastal zones of Bangladesh. In this study, we tested the use of low and medium-salinity water in place of low-salinity or fresh water for growing sunflowers (Helianthus annuus) in the dry season [4,6,7,8,9].
Sunflower is an important crop that is also moderately tolerant to salinity [10]. In the Ganges coastal zones where sunflower is a promising crop, there are limited volumes of fresh water, but more abundant volumes of low to medium-salinity water stored in ponds and canals. The salinity gradually increases from low to medium-salinity levels at the later growth stage of crops [11]. The strategic use of fresh water combined with the use of saline water for irrigation is an opportunity to increase crop yields and profits [12]. Non-saline water can be mixed with saline water and applied in the field, while the two water sources can be used alternately or in sequence leaving more saline water for later growth stages [13]. Other options for crop cultivation in the coastal zones include the use of salt-tolerant crop varieties and irrigation of the crops at the salt-sensitive growth stages with fresh water.
Sunflowers are most sensitive to saline irrigation water at flowering stages [14]. At later growth stages, saline water (≤7 dS m−1) can be used to irrigate the plants due to higher salinity tolerance [14,15]. Several studies reported on the use of saline water for sunflowers by conjunctive use of fresh and saline water [15,16,17,18], alternating use of fresh and saline water [19], cyclic use of fresh and saline water [20,21] and conjunctive use of surface water and groundwater resources [22]. Saline water can be used in coastal agriculture to irrigate crops and is being used in other countries like Israel, Iraq and Kuwait [23,24] to grow different crops. In the Ganges region, there are sources of saline water stored in ponds/canals and management of the pond/canal can maintain their water salinity at low to medium levels, creating opportunities for irrigation in coastal areas [2,15]. Several studies [12,25] suggest using fresh and saline water at different growth stages of crops where there is a scarcity of fresh water. However, these findings remain site specific in their application and lack an overall synthesis or overarching principles that could be applied to the coastal zone of the Ganges Delta. Therefore, this study has been undertaken to understand how sunflower seed yield and water productivity respond to low and medium saline water irrigation in the Ganges coastal zone.

2. Materials and Methods

2.1. Location of the Study Sites, Weather and Soil Characteristics

The study was carried out at Dacope, Khulna (latitude: 22°34′53″ N, longitude: 89°27′44″ E) and Amtali, Barguna (latitude: 22°07′45.8″ N, longitude: 90°13′44″ E), both located on the Ganges Tidal Floodplain. The mean maximum and minimum air temperature, pan evaporation and precipitation during the crop growing seasons of 2016–2017 and 2017–2018 at the experiment sites are presented in Figure 1. The soil texture is clay loam (Table 1). Before crop sowing, soil samples were randomly collected in 15 cm increments to 60 cm within the experimental plots to determine the soil’s physical properties. Soil organic carbon for determination of organic matter was estimated by the wet oxidation method [26]. The soil physical properties were determined at the Soil Science Laboratory of Bangladesh Agricultural Research Institute (BARI), Gazipur (Table 1).

2.2. Experimental Design and Treatments

The field experiments were laid out in a randomized complete block design with six treatments and three replications. The treatments were: T1—two irrigations, at early vegetative (25–30 days after sowing, DAS) and flowering stage (60–65 DAS) with low salinity water (LSW, electric conductivity, ECw < 2 dS/m); T2—two irrigations, one at vegetative stage with LSW and one at flowering stage with medium-salinity water (MSW, 2 < ECw < 5 dS/m); T3—two irrigations, one at vegetative stage with LSW and one at seed development stage (75–80 DAS) with MSW; T4—three irrigations at vegetative, flowering and seed development stages with LSW; T5—three irrigations, at vegetative stage with LSW, and flowering and seed development stages with MSW; and T6—three irrigations, at vegetative and flowering stages with LSW and at seed development stage with MSW.

2.3. Crop Management

The crop management practices recommended by BARI were followed for sunflower growing. Recommended fertilizer doses (N129 P32 K60 S21 Mg6 Zn2 B1.6 kg ha−1) for sunflower were applied in the form of urea, triple superphosphate, potassium chloride, gypsum, zinc sulfate and borax, respectively [27]. The unit plot size was 7.2 × 4 m. Sunflower (Hysun-33) was sown on 15 and 24 December in 2016 and on 17 and 22 December in 2017 at Dacope and Amtali, respectively, with row to row distance of 60 cm and plant-to-plant spacing of 40 cm. The seed was sown into untilled (no tillage) wet soil by dibbling method [28] with sub-surface placement of banded fertilizers. Half of the nitrogen and potassium and all of the phosphorus, sulfur, zinc and boron were applied as basal doses. Basal doses of the recommended fertilizers were mixed and placed manually into the soil uniformly. The remaining nitrogen and potassium were applied (before the flower initiation stage) and covered by soil followed by irrigation. No significant pest or disease infestation were observed in the experimental plots. Sunflower was harvested on 6 and 14 April 2017 and 12 and 13 April 2018 at Dacope and Amtali, respectively.

2.4. Measuring Soil Water Content, Soil Electrical Conductivity and Solute Potential

Soil water content, soil salinity and solute potential of soil solutions at different growth stages were determined for each treatment. Soils were sampled from 0–60 cm soil depth in 15 cm increments. Gravimetric soil water content (SWC) was determined. The soil samples were subsampled, mixed together, weighed and dried at 105 °C for 48 h and reweighed to determine gravimetric water content. The electrical conductivity (EC) in a 1:5 (soil:water suspension) extract (EC1:5) was determined and converted to EC in a saturated extract (ECe, dS m−1) using Equation (1) [5,29,30].
EC e = EC 1 : 5 × cf
where ECe is the soil solution salinity (dS m−1), cf is the conversion factor (8.6 for clay, clay loam soils [29,30]), EC1:5 is the electrical conductivity (dS m−1) of the 1:5 soil:water extract and SWC is the gravimetric soil water content (%, weight basis). EC1:5 was determined using a portable conductivity meter (Tri-meter model: pH/EC and TEMP-983) that can be inserted directly into the 1:5 soil solution. The solute potential of soil solution was calculated by the following Equation (2) [31,32].
φ o = 22580 × EC 1 : 5 SWC
where φ o is the osmotic solute (kPa).

2.5. Irrigation Water Salinity

The water salinity (ECw) of the pond (low salinity) and bunded canal (medium salinity) irrigation sources at both locations were monitored during the crop-growing seasons. The average of three measuring points in the pond and the bunded canal was considered for measuring the water salinity at 10-day intervals from each site. Mean values of the irrigation water salinity (ECw) during crop growing seasons (2016–2017 and 2017–2018) over two locations are shown in Figure 2A,B and Figure 2C,D, respectively. The irrigation water salinity (ECw) of the pond ranged from 0.5 (December) to <2 dS m−1 (March–April) and the canal water salinity ranged from 0.7 to ≤5 dS m−1 over two years and locations (Figure 2A–D). The classification of irrigation water salinity as low or medium salinity was based on the classification of Rhodes et al. (1992), Mila et al. (2021), USSLS (1994), Reddi and Reddy (1995), Michael (1978) and Majumdar (2004), [5,11,33,34,35,36]. In this study, the low (ECw < 2 dS m−1) and medium saline water (2 < ECw < 5 dS m−1) were used for applying irrigation of the sunflower plants (Figure 2).

2.6. Estimation of Irrigation Water Use

Seasonal evapotranspiration (ETa) of sunflowers was calculated using a soil water balance Equation (3) [37,38].
ET a = I + P e ±   Δ SMC D p R So
where ETa is the sunflower seasonal evapotranspiration (mm), I is the irrigation water (mm), Dp is deep percolation water (mm), Rso is surface runoff, Δ SMC is the change of soil water between sowing and harvesting (mm) and Pe is effective rainfall (mm). Here, we assume no soil water losses or additions through deep percolation, surface runoff and capillary rise. Each plot was separated by a 1.5 m distance. Therefore, the parameters of Dp and Rso were considered zero in this study. Irrigation water (I) was applied based on the pan evaporation method at different crop growth stages (initial stage, vegetative stage, flowering and grain development stages) [33,34]. A class A evaporation pan placed near the experiment was used to estimate irrigation water requirement (I, mm) for full irrigation using the following equation.
I = E p × K p
V = I × A
where I is the amount of irrigation water (mm), Ep is the cumulative pan evaporation (mm) and Kp is the pan coefficient, which was considered to be 0.7 [34]. V is the volume of irrigation amount (liter) and A is the area of the plot (m2). The estimated irrigation water (Table 2) was supplied using a polyethylene hose pipe by pumping water from the water sources. A water flow meter was used to measure the volume of irrigation water. Effective rainfall (Pe) was calculated (Table 2) as per [33,39,40], using the following equation:
P e = P total   125 0.25   P total   / 125 if   P total < 250   mm  
P e = 125 + 0.1   P total if   P total > 250   mm
where Ptotal is the rainfall (mm). Δ SMC is the change in soil water during sowing and harvesting and follows Equation (8) [34,37].
Δ SMC   = n = i n M C s i M C h i 100 × b i × d r i
where MCsi is soil water content during sowing and MChi is soil water content at harvest in the ith layer of the soil profile, n is the number of soil layer (0–15, 15–30, 30–45 and 45–60 cm). bi is the bulk density of the ith soil layer (gm cm−3) and dri is the root zone depth of the ith soil layer (cm). SWC (%) was determined using the oven drying method. The soil samples were well-mixed together, subsampled, weighed, dried at 105 °C for 48 h and reweighed to determine SWC.

2.7. Sunflower Yield, Crop Water Productivity (CWP) and Irrigation Water Productivity (IWP)

The yield-contributing characters and seed yield of sunflowers were recorded. Five plants were randomly chosen to measure the seed yield components from each treatment. Economic seed yields (t ha−1) were measured from the plants harvested from two selected rows of each plot (5.76 m2). The sunflower seed yield was manually harvested, cleaned and weighed after sun drying and converted to t ha−1 at 12% moisture content. The CWP and IWP were calculated to evaluate the efficient use of irrigation water at the level of sunflower production using the following equations [37,41].
CWP = SY   × 100 ETa
IWP = SY   × 100 I
where CWP is the crop water productivity (kg m−3), SY is the sunflower seed yield (t ha−1), ETa is the total seasonal crop water use (mm), IWP is the irrigation water productivity (kg m−3) and I is the amount of applied irrigation water (mm).

2.8. Statistical Analysis

Data on sunflower seed yield and yield contributing parameters, CWP and IWP, were statistically analyzed to test the effects of different levels of saline water irrigation at two sites in two years using R-statistical version 3.5.0 (2018), developed by R-Project for Statistical Computing [42]. All the treatment means differences were tested for any significant differences at p < 0.05 probability level. The variations of extract (soil:water = 1:5) soil salinity (ECe, dS m−1), solute potential (kPa) and soil water content (SWC, % w/w) with the effect of time (month) and treatment were also analyzed and compared for significant differences at p < 0.05.

3. Results

3.1. Variation of Sunflower Seed Yield and Yield Components

The analysis of variance (ANOVA) and the treatment mean values over two locations and years for sunflower seed yield and yield contributing characters are presented in Table 3 and Table 4. The location had a markedly significant (p < 0.001) effect on the seed yield and yield contributing characters of sunflowers (Table 3) in 2016–2017 but not in 2017–2018 (Table 4). Treatment had also a highly significant effect (p < 0.001) on seed yield and yield contributing characters except seed head−1 (p < 0.10) in both years (Table 3 and Table 4). Irrigation with LSW and MSW significantly affected the yield and yield contributing characters of sunflowers. The seed yields of sunflower were 1.80 t ha−1 and 2.45 t ha−1 at Amtali and Dacope, respectively, in 2017 while in 2018, the sunflower yields were 1.39 t ha−1 and 1.50 t ha−1 at Amtali and Dacope, respectively (Table 3 and Table 4). In Dacope in 2016–2017, the seed yield of T2 was lower than T4 and T6, but not different from other treatments even though this site had the highest overall yield. At Amtali in 2016–2017 (Table 3), T4 and T6 had higher seed yield than T5, while T4 was higher than the two irrigation treatments. In 2017–2018 (Table 4), there was no significant difference in seed yield between treatments, T4 and T6, but both exceeded T5 and the 2 irrigation treatments.

3.2. Water Use, Crop Water Productivity and Irrigation Water Productivity

The seasonal crop water use (ETa), crop water productivity (CWP) and irrigation water productivity (IWP) are shown in Table 2, Table 3 and Table 4. In 2016–2017, seasonal ETa of sunflower ranged from 170 mm (T2, T3) to 233 mm (T4) at Dacope and from 122 mm (T3) to 174 mm (T5) at Amtali (Table 2). In 2018, Eta varied from 131 mm (T1, T3) to 193 mm (T6) at Dacope and 126 mm (T3) to 189 mm (T6) at Amtali (Table 2). CWP of sunflowers under different irrigation treatments ranged from 0.99 (T5) to 1.36 kg m−3 (T3), with an average of 1.19 kg m−3 over two locations in 2016–2017 (Table 3). In 2017–2018, the CWP of sunflowers under different irrigation treatments ranged from 0.79 kg m−3 (T1) to 1.03 kg m−3 (T3) with an average of 0.92 kg m−3 (Table 4). The ANOVA indicates that the interaction of location and treatment (L × T) had significant (p < 0.001) effects on CWP and IWP of sunflower during 2017 (Table 3). Treatment (T) had also a greatly significant effect (p ≤ 0.001) on CWP (Table 4) but the location (L) and the interaction of location and treatment (L × T) had no significant effect on CWP and IWP in 2018 (Table 4). In both years (2017 and 2018) and between the locations (Dacope and Amtali), T3 had the highest CWP among the treatments.

3.3. Variation in Soil Salinity

Soil salinity (ECe) during the growing season for various treatments is illustrated in Figure 3a–d. Results indicate that soil salinity (ECe) significantly (p < 0.001) varied with time during the crop growing season from December to April at 0–15, 15–30, 30–45 and 45–60 cm soil depths. The most significant (p < 0.001) effect was observed in February and March compared to the beginning and the end of the growing season over two years (2016–2017 and 2017–2018) in both locations of Amtali (Figure 3a) and Dacope (Figure 3b). At Amtali in 2016–2017 (Figure 3a(A1–A4)) and 2017–2018 (Figure 3a(a1–a4)), the results indicate that the soil salinity (ECe) significantly (p < 0.001) changes in March to 60 cm soil depth. At Dacope in 2016–2017, similar significant (p < 0.001) changes were observed in ECe in March to 60 cm soil depth in 15 cm increments (Figure 3b(D1–D4)). The highest changes in soil salinity (6.9 dS m−1) were found in February in 0–15 and 45–60 cm soil layers in 2017–2018 at Dacope (Figure 3b(d1–d4)). The results indicated that the effect of time on soil salinity increased in February–March during seed development of sunflower in both years and locations. The effect of treatments on soil salinity significantly (p < 0.001) varied in the soil depths up to 60 cm over two years (2017 and 2018) in both locations. ECe was greater at 0–15 cm depth in all treatments during February and March. Similar trends were observed on the other soil profiles. Significant (p < 0.001) changes occurred in treatment T5 compared to the other treatments in 0–60 cm with 15 cm increments at Amtali in 2016–2017 (Figure 3c). In 2017–2018 (Figure 3c), greater changes in soil salinity were observed in T2 at 0–15 and 45–60 cm depth. The treatment T2 significantly (p < 0.001) increased the soil salinity compared to the other treatments at the soil layer of 0–15 and 30–45 cm depth (Figure 3d). At Amtali in 2016–2017 (Figure 3a(A1–A4)), ECe varied from 3.1 to 6.0 dS m−1 and the highest value was in February–March in treatment T5 at all soil layers. In 2017–2018 (Figure 3a(a1–a4)), ECe varied from 3.09 to 6.4 dS m−1 and the highest was in February–March. Treatment T2 produced significantly greater ECe (5.9 dS m−1) at 0–15 cm and 30–45 cm depth, while ECe was reduced at 15–30 and 30–45 cm depth. Similar trends were observed in the Dacope location in both years (Figure 3c,d).

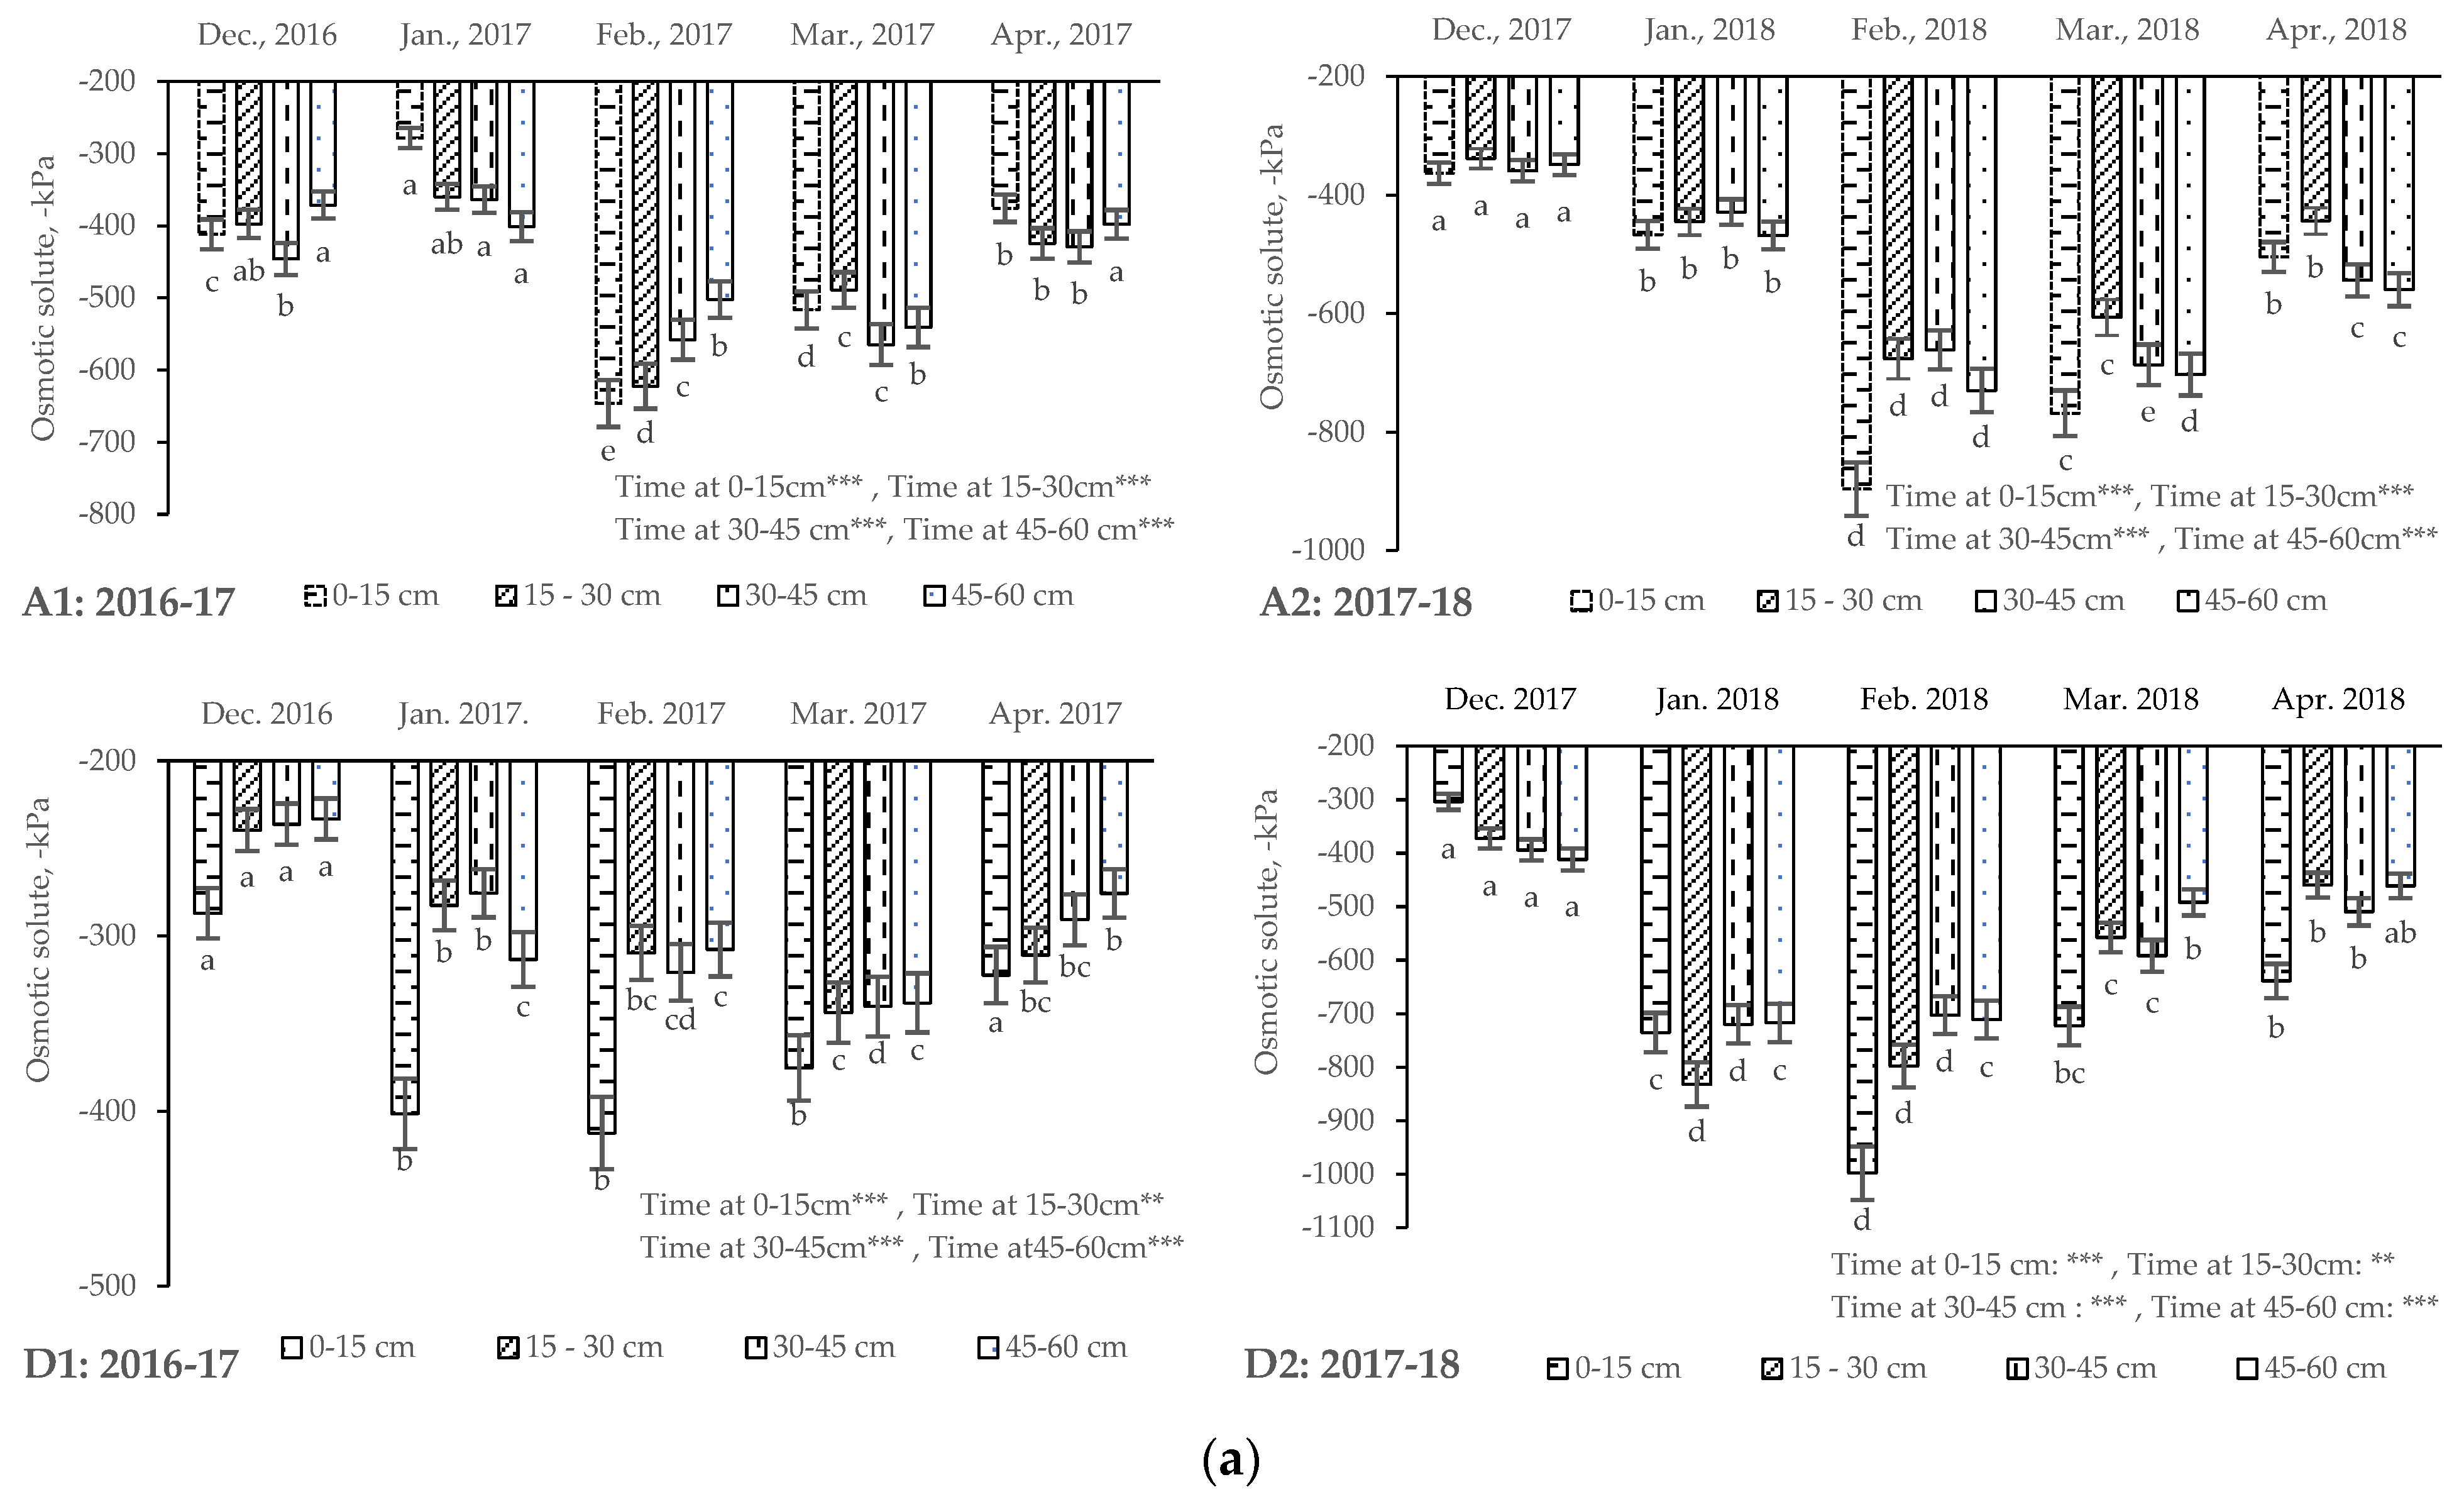
3.4. Variations of Solute Potential

The variations of solute potential with the progress of the time at 0–60 cm soil depth for each irrigation treatment are shown in Figure 4a,b. The effect of time on solute potential significantly (p < 0.001) varied at different soil depths (0–15, 15–30, 30–45 and 45–60 cm) over both locations in both years (Figure 4a). The SP decreased (negatively greater) in February more than in other months but there was a similar trend of SP in February and March. The SP was much lower at 0–15 cm soil depth in February than other soil layers. The irrigation treatments had a significant (p < 0.001) effect on SP (Figure 4b). The treatment T4 increased significantly (negatively lower) SP in both locations and both years. At Amtali, T1 and T2 had significantly lower (negatively greater) SP than other treatments at different depths of soil layers. At Dacope, T2 and T3 had significantly lower (negatively greater) SP greater than other treatments in both years. We observed that more irrigations at different growth stages of sunflower are important for better response for yield of sunflower in both environments and soils due to greater (negatively lower) SP layers, and SP was greater (negatively lower) at 45–60 cm in all treatments. The results indicate that the months of February–March were lower (negatively greater) SP at 0–15 cm depth and greater SP (negatively lower) at lower soil depth (45–60 cm).

3.5. Variations of Soil Water Content

The variations of gravimetric soil water content (SWC, %, w/w) during crop growing season for various treatments are shown in Figure 5a,b. An increase or decrease in SWC was observed following the irrigation treatments or precipitation. The results showed that the effect of time (month) on SWC significantly (p < 0.001) varied with the progress of the time in crop growing season from December to April at 0–60 cm soil profiles with 15 cm increments over both Amtali in Figure 5a(A1,A2) and Dacope in Figure 5b(D1,D2). The results indicate that SWC significantly (p < 0.001) decreased at the flowering of sunflowers in February compared to the beginning and the end of the growing season in both Amtali (Figure 5a(A1,A2)) and Dacope (Figure 5a(D1,D2)) over two years of 2016–2017 and 2017–2018. In 2016–2017 at Amtali (Figure 5a(A1)), SWC, on average, varied from 20.3 to 28.6% within 0–60 cm soil depths but was lower in upper soil layers (0–15 cm) in all cases. In 2017–2018 (Figure 5a(A2)), SWC varied from 20.6 to 30.3% during the growing season of sunflowers. In 2016–2017 at Dacope (Figure 5b(D1)), SWC averagely varied from 31.3 to 37.3% within 0–60 cm soil depths. In 2017–2018 (Figure 5a(D2)), SWC varied from 21.8 to 28.2% during the growing season and was lowest in February during sunflower flowering (21.8%).
The effect of treatments on SWC significantly (p < 0.001) varied with the soil depths over two years (2017 and 2018) in both Amtali (Figure 5b(A3,A4)) and Dacope (Figure 5b(D3,D4)). SWC was greater at the soil depth of 45–60 cm in all treatments in both locations and years. The treatment T6 had significantly greater SWC than the other treatments. In treatment T1, SWC was significantly (p < 0.001) lower compared to the other treatments. In 2016–17 at Amtali (Figure 5a(A3)), treatments T4, T5 and T6 had on average nearly similar SWC (26.2, 27.1 and 27.3%) and greater than T1, T2 and T3 (24.4, 24.6 and 24.1%) within 0–60 cm soil depths, respectively. In 2017–2018 (Figure 5a(A4)), similar trends were observed at Amtali. In 2016–2017 at Dacope (Figure 5b(D3)), treatments T5 and T6 had nearly similar SWC at 35.3 and 35.5% and greater than the other treatments. Similarly, in 2017–2018 at Dacope (Figure 5b(D4)), SWC was on average greater in T6 at 0–60 cm soil depth (26.4%). The lower SWC was observed in T1 (24.3%). The SWC decreased at later growth stages of sunflower in both years (2017 and 2018), but plant-available soil water was not drastically reduced due to maintaining the irrigation schedule and supplying the amount of water for sunflower production.

4. Discussion

The number of irrigation events, regardless of ECw was the critical determinant for sunflower seed yield and irrigation water productivity. With both LSW and MSW irrigation, sunflower seed yield was higher with three irrigations than with two irrigations at both locations in the two growing seasons. However, the use of LSW (0.5 < salinity < 2 dS m−1) followed by two irrigation events with MSW (2 < salinity < 5 dS m−1) to sunflower at later growth stages can decrease yield relative to continuous application of LSW or a single late application of MSW. There are previous reports of positive effects of medium-salinity water irrigation on crop yield [11,13,43], as well as recommendations to use saline water (≤7 dS m−1) to supplement fresh water (<2.7 dS m−1) for irrigation where fresh water is scarce. Our findings suggest that root zone solute potential is the key factor that explains the responses to a number of irrigation events and crop tolerance of MSW for irrigation.

4.1. Variation of Sunflower Seed Yield and Yield Components

We observed that yield slightly increased with an increased number of low and medium saline water irrigation in both locations (Table 3 and Table 4). The technique of conjunctive use of groundwater (1.5–3 dS m−1) at early growth stages and saline canal water (4–7 dS m−1) at later growth stages maintained maize grain yield of 8.6–9.5 t ha−1. With wheat, Mojid and Hossain [14] and Mojid et al. [12] stated that saline water irrigation could be applied at later growth stages when plants have better salinity tolerance. On the other hand, the cotton yield contributing attributes and yield was significantly higher when fresh water was used to irrigate and significantly decreased with increasing the levels of salinity from 4–12 dS m−1 [44]. In this study, irrigation levels also significantly (p < 0.001) depressed the yield components of sunflower-like seed weight head−1, as well as sunflower seed yield, if a single application of LSW was followed by two applications with MSW (Table 3 and Table 4).
An earlier study [45] reported that crop yield loss due to increased soil salinity in the dry season could be minimized when the crops are irrigated properly and maintained proper irrigation scheduling techniques. We observed that irrigations at the growth stages of early vegetative, flowering and seed development are important for a better response for plant growth and yield of sunflowers in coastal saline soils. Three irrigations at 25–30 (early growth), 60–65 (flowering) and 75–80 (seed development) days after sowing produced significantly higher head diameters and weights of seeds [46]. On the other hand, two irrigations at flowering and seed development stages are required for sunflowers for higher seed yields [47]. In addition, it is noted that earlier sowing by dibbling in zero tillage techniques resulted in crop escape from water stress for effective sunflower establishment and seed yield [48,49,50].

4.2. Seasonal Crop Water Use, Crop Water Productivity and Irrigation Water Productivity

Sofia et al. [51] reported that the average CWP of sunflower in the conjunctive use of non-saline and saline water was 0.90 kg m−3 and water productivity changed by 7.6% as compared with non-saline irrigation water without an increase in soil salinity in the root zone during the crop growth [15]. The CWP of sunflower in the use of LSW and MSW varied from 0.99 to 1.36 kg m−3 with an average value of 1.19 kg m−3 over two locations in 2017 and 0.79 kg m−3 to 1.03 kg m−3 with an average of 0.92 kg m−3 in 2018. Under deficit irrigation in non-saline conditions, Erdem et al. [52] stated that CWP and IWP of sunflowers varied from 0.062–0.094 kg m−3 and 0.080–0.247 kg m−3, respectively. We observed that irrigation affected sunflower seed yields. Sunflower yield was found to be at the maximum when the levels of available soil water content were 70–80% [53]. In other crops like maize, the technique of non-saline and saline water (1:1 water salinity of 3.5 dS m−1 and 5.7 dS m−1) on drip-irrigated maize produced the highest and lowest IWP by 15.3 kg m−3 and 8.7 kg m−3 and IWP increased with increasing irrigation water salinity up to 10.9 dS m−1 [54]. IWP of tomato increased as water salinity increased with 1.1–4.9 dS m−1 [55]. Ben-Asher et al. [56] used three salinity levels (1.8, 3.3 and 4.8 dS m−1) of saline water to irrigate grapevine and stated that salinity had no effect on IWP. Chen et al. [10] indicated that with every 1 dS m−1 increase in irrigation water salinity, sunflower yield decreased by 1.8% while IWP increased. Moreover, this study indicates that the number of irrigation events is the critical determinant for increasing sunflowers and improving water productivity to intensify the cropping system. This study showed that the CWP was significantly increased by increasing medium saline water irrigation and it could be maintained by replacing brackish water with low to medium saline water irrigation at later growth stages (T2, T5 and T6).

4.3. Variation in Soil Salinity

In the present study, the soil salinity increased in February–March during sunflower flowering and seed development (Figure 3a,b) due to high temperature, rapid soil water evaporation, increased soil cracking and capillary rise that contributed to an increase in the soil salinity. The ECe was greater at the top soil layer of 0–15 cm depth in all treatments during February and March. Similar trends were observed on the other soil profiles. The accumulation of soil salts on the top surface occurred due to soil water uptake by the plants and rapid evaporation of the soil water [28,57]; therefore, salt accumulation was generally higher in the upper soil surface. In treatments T2 and T5, salt accumulation was slightly greater than in the treatments of T1, T4 and T6 due to the use of MSW (2 ≤ 5 dS m−1) irrigation. Irrigation with MSW (canal water) after LSW (pond water) may cause a slight increase in soil salinity. It could be stated that MSW irrigation at later growth stages after LSW irrigation at early growth stage may produce more salt movement in soil profiles. The technique of low saline and medium saline water irrigation indicates a better understanding of sunflower crop response to salinity at different growth stages and growing periods. This technique is important to salt stress susceptibility during the critical growth stages of crops. The initial growth stages of crops such as early vegetative are sensitive to salt stress but the later growth stage becomes more salt tolerant [13,16,58]. This study also indicates that proper irrigation scheduling (saline water irrigation at critical growth stages) techniques are needed to minimum sacrifice yield reductions for sustainable use of limited fresh water. The choice of irrigation technique is very important for saline water irrigation to intensify the cropping in the coastal regions [11,59]. The technique of saline water (ECw: 2–5 dS m−1), together with LSW (ECw: <2 dS m−1) for irrigation during the dry winter season, resulted in sunflower yields from 1.57 to 2.33 t ha−1. Around 70% of crop roots are concentrated in the upper 30 cm of the soil profile, which is crucial to establish the acceptable salinity level during the critical growth phases of sunflowers. With adequate cultural practices, no salt could accumulate in the soil depth of 0–20 cm for a long time [23]. Li et al. [60] showed that saline water irrigation helped the accumulation of soil salts significantly at the soil surface (0–10 cm soil layers), but not at the soil depth of 40–60 cm where abundant lateral roots were found. In this study, ECe increased in February and it remained basically stable over two years in both locations for two crop cycles. The soil salinity builds up mainly due to the addition of salts from saline water irrigation and upward movement of salts through capillary rise by evaporation from shallow groundwater table (≤3 m) and gradually increased as the dry season in all crops and found maximum soil salinity at mid or flowering stage. Sunflowers are particularly affected in critical development growth stages during February–March in the coastal area of southern Bangladesh. It is clear to understand that reduced crop yields are not the only effect of salinization, but also the combined effect of soil water stress and salinity and other agronomic practices [61]. Francois [62] reported that around 5% yield reduction for each unit increase in soil salinity. Soil salinity increased with saline irrigation water (7 dS m−1) and slightly increased with brackish irrigation water (2.7 dS m−1). In this study, the results (Figure 3a,b) indicate that ECe was not substantially higher in soil profiles among the treatments due to medium saline water (2 to 4.9 dS m−1) irrigation and salinity may be tolerable for sunflower germination to crop yield production in the coastal areas of Bangladesh. Utilization of only saline water for irrigation is associated with salt accumulation in the soil, which might be harmful to plants, and diminish yields. But in Bangladesh, high precipitation (120–180 cm) during the monsoon season (June–August) in the coastal zone is an opportunity for effectively leaching and dilution of salt from the soils, and the drainage system allows flushing of the salt [40,63,64,65,66].

4.4. Variations of Solute Potential

The lower (negatively higher) SP was found in the mid-growth stages of the crop in both years (2017 and 2018) due to soil water uptake and soil water evaporation from the soil surface in both locations (Dacope and Amtali). In treatment T1, the SP slightly affected the plants, which was associated with soil salinity and moisture in both locations. Water uptake by the plants is governed by the water potential [67]. The solute potential is more closely related to sunflower crop growth [36,68]. It is an effective technique to identify the combined effect of salinity and drought. In this study, the SP is inversely proportional to the soil water content and proportional to the salt concentration in the soil (Figure 4b). Salt concentrations in the soil solution increase due to the drying of the soil, as well as the decrease (negatively increases) in SP, which limits water uptake by sunflowers at higher levels of soil salinity and lower levels of soil water [63]. Generally, plants struggle to take up water when the total potential of the soil solution exceeds −1000 kPa and will permanently wilt at −1500 kPa. We observed that when an osmotic solute is less (negatively increases) than −700 kPa, the rate of yield reduction is severe [69]. This study indicated that the SP was lower (negatively greater) in February when values were below −700 kPa. Due to decreased SWC and increased salt concentration in soil, SP stress affects the growth and yields of sunflowers [66]. An increase or decrease in SWC was observed following irrigation or precipitation and then decreased (negatively lower) or increased (negatively greater) gradually. Soil salinity and osmotic level depend on the soil texture, frequency and amount of saline water irrigation and the effects vary with the stage of crop growth [11,60].

4.5. Variations of Soil Water Content

Generally, the sunflower crop is more sensitive to water stress at flowering than at other stages [70]. This study shows that SWC was lower in the upper soil layers and greater at the lower depths of the soils (Figure 5a,b), which indicates that sunflowers could extract water from lower depths of soils (15–60 cm) to avoid water stress [71]. Doorenbos and Kassam [69] reported that soil water depletion should not exceed 45% of the available soil water at the late vegetative, flowering and grain development stages of crops. This study indicates that lower SWC in the upper soil layer during the later growth stages of sunflowers exerted a negative effect on yield, even though sunflowers can extract water up to 180 cm soil depth during the critical growth stages [71]. Sunflower yields were found to be at the maximum when the levels of available SWC were 70–80% [54]. Moreover, the study indicates that the number of irrigation events is the critical determinant for increasing sunflowers and improving water productivity to intensify the cropping system in the Ganges Delta. This study showed that WP was significantly increased by the MSW irrigation and it could be maintained by replacing water with low to medium saline water irrigation at later growth stages (T2, T5 and T6). Several studies stated that saline water can successfully be used at later growth stages for the cultivation of irrigated crops like wheat, tomato and mustard in the salt-affected zones [13,16,72,73,74].

5. Conclusions

With both low and medium-salinity water, sunflower seed yield increased with three irrigations at both locations in two growing seasons. Moreover, the use of low salinity water (0.5 < salinity < 2 dS m−1) followed by medium saline water (2 < salinity < 5 dS m−1) irrigation to sunflower at early and later growth stages had no significant effect on yield relative to continuous application of the low saline water. This technique is effective for increasing yield by avoiding low solute potential at critical growth stages of crops in the coastal salt-affected areas of southern Bangladesh. In order to obtain better sunflower seed yield, this technique could be an alternative irrigation scheduling method to practice for rabi crops like maize, wheat, barley and mustard cultivation so as to intensify the cropping system in the coastal saline areas of southern Bangladesh where freshwater availability is limited in supply. Further studies are needed to continue the expansion of rabi crops in coastal salt-affected areas of the Ganges Delta where fresh water (non-saline) is not available for rabi crop cultivation.

Author Contributions

K.K.S. outlined and conducted the original research. K.K.S., S.S.A.K., M.A.R.A., B.C.S., P.L.C.P., M.K.S., M.S.I.K. and M.H.R. were involved in planning, data collection, processing, analysis and manuscript preparation. M.M. and R.W.B. supervised, monitored, edited and reviewed with critical comments and suggestions for the manuscript. M.G. and E.G.B.-L. assisted with the analysis. All authors have read and agreed to the published version of the manuscript.

Funding

This study is funded by the Australian Centre for International Agricultural Research (ACIAR) and the Krishi Gobeshona Foundation (KGF) of Bangladesh, Grant number: LWR 2014 073.

Institutional Review Board Statement

Not applicable.

Informed Consent Statement

Not applicable.

Data Availability Statement

Data are available through the reasonable request of the corresponding author.

Acknowledgments

We would like to thank the Australian Centre for International Agricultural Research (ACIAR) and the Krishi Gobeshona Foundation (KGF) of Bangladesh. We also acknowledge the Irrigation and Water Management Division of Bangladesh Agricultural Research Institute (BARI) for providing laboratory facilities for soil and water samples analysis.

Conflicts of Interest

The authors declare no conflicts of interest.

Abbreviations

CZ, coastal zone; DAS, days after sowing; EC, electrical conductivity; ET, evapotranspiration; FC, field capacity; CWP, crop water productivity; cv, cultivar, IWP, irrigation water productivity; LSW, low saline water; MSW, medium saline water; P, precipitation; SWC, soil water content; SMC, soil moisture contribution; T, treatment; T. Aman, transplanted Aman rice.

References

  1. Vellinga, P.; Rahman, A.; Wolthuis, B.; Barrett-Lennard, E.G.; Choukr-Allah, R.; Elzenga, T.; Kaus, A.; Negacz, K. Saline agriculture: A call to Action. In Future of Sustainable Agriculture in Saline Environments, 1st ed.; Negacz, K., Vellinga, P., Barrett-Lennard, E.G., Choukr-Allah, R., Elzenga, T., Eds.; eBook Published; CRC Press: Boca Raton, FL, USA, 2021; pp. 1–13. [Google Scholar] [CrossRef]
  2. Mainuddin, M.; Rahman, M.A.; Maniruzaman, M.; Sarker, K.K.; Mandal, U.K.; Nanda, M.K.; Gaydon, D.S.; Sarangi, S.K.; Sarkar, S.; Yu, Y.; et al. The Water and Salt Balance of Polders/Islands in the Ganges Delta. J. Indian Soc. Coast. Agric. Res. 2019, 37, 45–50. [Google Scholar] [CrossRef]
  3. Schulthess, U.; Krupnik, T.J.; Ahmed, Z.U.; McDonald, A.J. Decentralized Surface Water Irrigation as a Pathway for Sustainable Intensification in Southern Bangladesh: On How Much Land Can the Drop Be Brought to the Crop? In Proceedings of the Conference on Revitalizing the Ganges Coastal Zone: Turning Science into Policy and Practices, Dhaka, Bangladesh, 21–23 October 2014; Humphreys, E., Tuong, T.P., Buisson, M.C., Pukinskis, I., Phillips, M., Eds.; CGIAR Challenge Program on Water and Food (CPWF): Colombo, Sri Lanka, 2015; pp. 542–552. [Google Scholar]
  4. Haque, M.A.; Jahiruddin, M.; Clarke, D. Effect of plastic mulch on crop yield and land degradation in south coastal saline soils of Bangladesh. Int. Soil Water Conserv. Res. 2018, 6, 317–324. [Google Scholar] [CrossRef]
  5. Rhodes, J.D.; Kandiah, A.; Mashali, A.M. The Use of Saline Water for Crop Production; FAO Irrigation and Drainage Paper 1992, No. 48; Food and Agriculture Organization of the United Nations (FAO): Rome, Italy, 1992. [Google Scholar]
  6. Humphreys, E.; Tuong, T.P.; Buisson, M.C.; Pukinskis, I.; Phillips, M. Revitalizing the Ganges Coastal Zone: Turning Science into Policy and Practices Conference Proceedings; CGIAR Challenge Program on Water and Food (CPWF): Colombo, Sri Lanka, 2015; 652p. [Google Scholar]
  7. Huq, N.; Hugé, J.; Boon, E.; Gain, A.K. Climate change impacts in agricultural communities in rural areas of coastal Bangladesh: A tale of many stories. Sustainability 2015, 7, 8437–8460. [Google Scholar] [CrossRef]
  8. Hoque, M.Z.; Haque, M.E. Impact of climate change on crop production and adaptation practices in coastal saline areas of Bangladesh. Int. J. Adv. Res. 2016, 2, 10–19. [Google Scholar]
  9. Saqib, M.; Akhtar, J.; Qureshi, R.H. Pot study on wheat growth in saline and waterlogged compact soil. Soil Tillage Res. 2004, 77, 169–177. [Google Scholar] [CrossRef]
  10. Chen, M.; Kang, Y.; Wan, S.; Liu, S. Drip irrigation with saline water for oleic sunflower (Helianthus annuus L.). Agric. Water Manag. 2009, 96, 1766–1772. [Google Scholar] [CrossRef]
  11. Mila, A.J.; Bell, R.W.; Barrett-Lennard, E.G.; Kabir, E. Salinity Dynamics and Water Availability in Water Bodies over a Dry Season in the Ganges Delta: Implications for Cropping Systems Intensification. In Future of Sustainable Agriculture in Saline Environments, 1st ed.; eBook Published; CRC Press: Boca Raton, FL, USA, 2021; pp. 305–322. [Google Scholar]
  12. Mojid, M.A.; Mia, M.S.; Saha, A.K.; Tabriz, S.S. Growth stage sensitivity of wheat to irrigation water salinity. J. Bangladesh Agric. Univ. 2014, 11, 147–152. [Google Scholar] [CrossRef]
  13. Hassanli, M.; Ebrahimian, H. Cyclic use of saline and non-saline water to increase water use efficiency and soil sustainability on drip irrigated maize. Span. J. Agric. Res. 2016, 14, e1204. [Google Scholar] [CrossRef]
  14. Mila, A.J.; Bell, R.W.; Barrett-Lennard, E.G.; Kabir, M.E.; Dell, B. Flowering is the critical growth stage for adverse effects of salinity on the grain yield of sunflower. Plant Soil 2023, 492, 285–299. [Google Scholar] [CrossRef]
  15. Mojid, M.A.; Hossain, A.B.M.Z. Conjunctive Use of Saline and Fresh Water for Irrigating Wheat (Triticum aestivum L.) at Different Growth Stages. Agriculturists 2013, 11, 15–23. [Google Scholar] [CrossRef]
  16. Murad, K.F.I.; Hossain, A.; Fakir, O.A.; Biswas, S.K.; Sarker, K.K.; Rannu, R.P.; Timsina, J. Conjunctive use of saline and fresh water increases the productivity of maize in saline coastal region of Bangladesh. Agric. Water Manag. 2018, 204, 262–270. [Google Scholar] [CrossRef]
  17. Xue, J.; Ren, L. Conjunctive use of saline and non-saline water in an irrigation district of the Yellow River Basin. Irrig. Drain. 2017, 66, 147–162. [Google Scholar] [CrossRef]
  18. Liu, X.W.; Til, F.; Chen, S.Y.; Shao, L.W.; Sun, H.Y.; Zhang, X.Y. Effects of saline irrigation on soil salt accumulation and grain yield in the winter wheat-summer maize double cropping system in the low plain of North China. J. Integr. Agric. 2016, 15, 2886–2898. [Google Scholar] [CrossRef]
  19. Sang, H.; Guo, W.; Gao, Y.; Jiao, X.; Pan, X. Effects of alternating fresh and saline water irrigation on soil salinity and chlorophyll fluorescence of summer maize. Water 2020, 12, 3054. [Google Scholar] [CrossRef]
  20. Chauhan, S.K.; Chauhan, C.P.S.; Minhas, P.S. Effect of cyclic use and blending of alkali and good quality waters on soil properties, yield and quality of potato, sunflower and Sesbania. Irrig. Sci. 2007, 26, 81–89. [Google Scholar] [CrossRef]
  21. Minhas, P.S.; Dubey, S.K.; Sharma, D.R. Comparative effects of intra/inter-seasonal cyclic uses and blending of alkali and good quality water on soil properties and crop yields under paddy wheat system. Agric. Water Manag. 2007, 87, 83–90. [Google Scholar] [CrossRef]
  22. Al Khamisi, S.A.; Prathapar, S.A.; Ahmed, M. Conjunctive use of reclaimed water and groundwater in crop rotations. Agric. Water Manag. 2023, 116, 228–234. [Google Scholar] [CrossRef]
  23. Wang, Q.; Huo, Z.; Zhang, L.; Wang, J.; Zhao, Y. Impact of saline water irrigation on water use efficiency and soil salt accumulation for spring maize in arid regions of China. Agric. Water Manag. 2016, 163, 125–138. [Google Scholar] [CrossRef]
  24. Pasternak, D.; De Malach, Y. Irrigation with brackish water under desert conditions X. Irrigation management of tomatoes (Lycopersicon esculentum Mills) on desert sand dunes. Agric. Water Manag. 1995, 28, 121–132. [Google Scholar] [CrossRef]
  25. Ma, W.; Mao, Z.; Zhenrong, Y.; van Mensvoort, M.E.F.; Driessen, M.P. Effects of saline water irrigation on soil salinity and yield of winter wheat–maize in North China Plain. Irrig. Drain. Syst. 2008, 22, 3–18. [Google Scholar] [CrossRef]
  26. Walkley, A.; Black, I.A. An examination of the Degtjareff method for determining soil organic matter, and a proposed modification of the chromic acid titration method. Soil Sci. 1934, 37, 29–38. [Google Scholar] [CrossRef]
  27. BARC (Bangladesh Agricultural Research Council). Fertilizer Recommendation Guide; BARC; Farmgate: Dhaka, Bangladesh, 2012.
  28. Paul, P.L.C.; Bell, R.W.; Barrett-Lennard, E.G.; Kabir, M.E. Opportunities and risks with early sowing of sunflower in a salt-affected coastal region of the Ganges Delta. Agron. Sustain. Dev. 2021, 41, 39. [Google Scholar] [CrossRef]
  29. Slavich, P.G.; Petterson, G.H. Estimating the electrical conductivity of saturated paste extracts from 1:5 soil: Water suspensions and texture. Aust. J. Soil Res. 1993, 31, 73–81. [Google Scholar] [CrossRef]
  30. Rengasamy, P. Soil processes affecting crop production in salt-affected soils. Funct. Plant Biol. 2010, 37, 613–620. [Google Scholar] [CrossRef]
  31. Devkota, M.; Devkota, K.P.; Martius, C.; Gupta, R.K.; McDonald, A.J.; Lamers, J.P.A. Managing soil salinity with permanent bed planting in irrigated production systems in Central Asia. Agric. Ecosyst. Environ. 2015, 202, 90–97. [Google Scholar] [CrossRef]
  32. Paul, P.L.C.; Bell, R.W.; Barrett-Lennard, E.G.; Kabir, M.E. Variation in the yield of sunflower (Helianthus annuus L.) due to differing tillage systems is associated with variation in solute potential of the soil solution in a salt-affected coastal region of the Ganges Delta. Soil Tillage Res. 2020, 197, 104489. [Google Scholar] [CrossRef]
  33. USSLS (United States Salinity Laboratory Stuff). Diagnosis and Important of Saline and Alkali Soils; Agriculture Handbook No. 60; US Government Printing Office: Washington, DC, USA, 1994. [Google Scholar]
  34. Reddi, G.H.S.; Reddy, T.Y. Efficient Use of Irrigation Water, 1st ed.; Reprint 2015; Kalyani Publishers: New Delhi, India, 1995; ISBN 81-272-0258-4. [Google Scholar]
  35. Michael, A.M. Irrigation: Theory and Practice, 1st ed.; Vikash Publishing House Pvt. Ltd.: New Delhi, India, 1978; 801p. [Google Scholar]
  36. Majumdar, D.K. Irrigation Water Management: Principles and Practice, 3rd ed.; Practice Hill of India Private Limited: New Delhi, India, 2004. [Google Scholar]
  37. Sarker, K.K.; Kamar, S.S.A.; Hossain, M.A.; Mainuddin, M.; Bell, R.W.; Barrett-Lennard, E.G.; Gaydon, D.; Glover, M.; Saha, R.R.; Ali, M.A.; et al. Cropping System Based Irrigation for Improving Crop and Water Productivity in the Coastal Zone of Bangladesh. J. Indian Soc. Coast. Agric. Res. 2019, 37, 82–97. [Google Scholar]
  38. Ierna, A.; Mauromicale, G. Potato growth, yield and water productivity response to different irrigation and fertilization regimes. Agric. Water Manag. 2018, 201, 21–26. [Google Scholar] [CrossRef]
  39. Smith, M. CROPWAT: A Computer Program for Irrigation Planning and Management; Irrigation and Drainage Paper; FAO (Food and Agriculture Organization): Rome, Italy, 1992; Volume 46. [Google Scholar]
  40. Alauddin, M.; Amarasinghe, U.A.; Sharma, B.R. Four decades of rice water productivity in Bangladesh: A spatio-temporal analysis of district level panel data. Econ. Anal. Policy 2014, 44, 51–64. [Google Scholar] [CrossRef]
  41. Wang, X.; Yang, J.; Liu, G.; Yao, R.; Yu, S. Impact of irrigation volume and water salinity on winter wheat productivity and soil salinity distribution. Agric. Water Manag. 2015, 149, 44–54. [Google Scholar] [CrossRef]
  42. R Core Team. R: A Language and Environment for Statistical Computing; R Foundation for Statistical Computing: Vienna, Austria, 2013; ISBN 3-900051-07-0. Available online: http://www.R-project.org/ (accessed on 9 August 2019).
  43. Kiani, A.; Mirlatifi, S. Effect of different quantities of supplemental irrigation and its salinity on yield and water use of winter wheat (Triticum aestivum). Irrig. Drain. 2012, 61, 89–98. [Google Scholar] [CrossRef]
  44. Gandahi, A.W.; Kubar, A.; Sarki, M.S.; Talpur, N.; Gandahi, M. Response of conjunctive use of fresh and saline water on growth and biomass of cotton genotypes. J. Basic Appl. Sci. 2017, 13, 326–334. [Google Scholar] [CrossRef]
  45. Gupta, R.K.; Abrol, I.P. Salt affected soils their reclamation and management for crop production. Adv. Soil Sci. 1990, 11, 223–288. [Google Scholar]
  46. Sarkar, R.K.; Chakrabarty, A. Yield components and yield of sunflower (Helianthus annuus), sesame (Sesamum indicum) and greengram (Phaseolus radiata) as influenced by irrigation and intercropping. Indian J. Agron. 1995, 40, 499–501. [Google Scholar]
  47. Jana, P.K.; Misra, B.; Kar, P.K. Effect of irrigation at different physiological stages of growth on yield attributes, yield, consumptive use and water use efficiency of sunflower. Indian Agric. 1982, 26, 39–42. [Google Scholar]
  48. Rashid, M.H.; Nasrin, S.; Mahalder, D. Zero tilled dibbled sunflower enables planting earlier and harvests more in the coastal saline area of Bangladesh. Int. J. Env. Sci. Dev. 2014, 5, 260–264. [Google Scholar] [CrossRef]
  49. Mondal, M.K.; Paul, P.; Humphreys, E.; Tuong, T.; Ritu, S.; Rashid, M.; Humphreys, E.; Buisson, M.; Pukinskis, I.; Phillips, M. Opportunities for Cropping System Intensification in the Coastal Zone of Bangladesh. In Proceedings of the CPWF, GBDC, WLE Conference on Revitalizing the Ganges Coastal Zone: Turning Science into Policy and Practices, Dhaka, Bangladesh, 21–23 October 2015; Humphreys, E., Tuong, T.P., Buisson, M.C., Pukinskis, I., Phillips, M., Eds.; CGIAR Challenge Program on Water and Food (CPWF): Colombo, Sri Lanka, 2015; pp. 449–476. [Google Scholar]
  50. Sarangi, S.K.; Singh, S.; Kumar, V.; Srivastava, A.K.; Sharma, P.C.; Johnson, D.E. Tillage and crop establishment options for enhancing the productivity, profitability, and resource use efficiency of rice-rabi systems of the salt-affected coastal lowlands of eastern India. Field Crops Res. 2019, 247, 107494. [Google Scholar] [CrossRef]
  51. Pereira, S.I.A.; Moreira, H.; Argyras, K.; Castro, P.M.L.; Marquesa, A.P.G.C. Promotion of sunflower growth under saline water irrigation by the inoculation of beneficial microorganisms. Appl. Soil Ecol. 2016, 105, 36–47. [Google Scholar] [CrossRef]
  52. Erdem, T.; Delbes, L.; Orta, H. Water use characteristics of sunflower (Helianthus annuus L.) under deficit irrigation. Pak. J. Biol. Sci. 2001, 4, 766–769. [Google Scholar] [CrossRef]
  53. Patel, J.C.; Singh, R.M. Yield and nutrient uptake of sunflower (Helianthus annuus L.) as influenced by irrigation, mulch and cycocel. Ind. J. Agron. 1983, 28, 205–210. [Google Scholar]
  54. Kang, Y.; Chen, M.; Wan, S. Effects of drip irrigation with saline water on waxy maize (Zea mays L. var. ceratina Kulesh) in North China Plain. Agric. Water Manag. 2010, 97, 1303–1309. [Google Scholar] [CrossRef]
  55. Wan, S.; Kang, Y.; Wang, D.; Liu, S.P.; Feng, L.P. Effect of drip irrigation with saline water on tomato (Lycopersicon esculentum Mill) yield and water use in semi-humid area. Agric. Water Manag. 2007, 90, 63–74. [Google Scholar] [CrossRef]
  56. Ben-Asher, J.; Tsuyuki, I.; Bravdo, B.M.; Sagih, M. Irrigation of grapevines with saline water: I. Leaf area index, stomatal conductance, transpiration and photosynthesis. Agric. Water Manag. 2006, 83, 13–21. [Google Scholar] [CrossRef]
  57. Bakker, D.; Hamilton, M.; Hetherington, G.J.; Spann, R. Salinity dynamics and the potential for improvement of water logged and saline land in a Mediterranean climate using permanent raised beds. Soil Tillage Res. 2010, 110, 8–24. [Google Scholar] [CrossRef]
  58. Ashraf, M.; Saeed, M.M. Effect of improved cultural practices on crop yield and soil salinity under relatively saline groundwater applications. Irrig. Drain. Syst. 2006, 20, 111–124. [Google Scholar] [CrossRef]
  59. Oron, G.; DeMalach, Y.; Gillerman, L.; David, I.; Lurie, S. Effect of Water Salinity and Irrigation Technology on Yield and Quality of Pears. Biosyst. Eng. 2002, 81, 237–247. [Google Scholar] [CrossRef]
  60. Li, C.; Lei, J.; Zhao, Y.; Xu, X.; Li, S. Effect of saline water irrigation on soil development and plant growth in the Taklimakan Desert Highway shelterbelt. Soil Tillage Res. 2015, 146, 99–107. [Google Scholar] [CrossRef]
  61. Rahman, M.M.; Penny, G.; Mondal, M.S.; Zaman, M.H.; Kryston, A.; Salehin, M.; Nahar, Q.; Islam, M.S.; Bolster, D.; Tank, J.L.; et al. Salinization in large river deltas: Drivers, impacts and socio-hydrological Feedbacks. Water Secur. 2019, 6, 100024. [Google Scholar] [CrossRef]
  62. Francois, L.E. Salinity effects on four sunflower hybrids. Agron. J. 1996, 88, 215–219. [Google Scholar] [CrossRef]
  63. Bell, R.W.; Mainuddin, M.; Barrett-Lennard, E.G.; Sarangi, S.K.; Maniruzaman, M.; Brahmachari, K.; Sarker, K.K.; Burman, D.; Gaydon, D.S. Cropping Systems Intensification in the Coastal Zone of the Ganges Delta: Opportunities and Risks. J. Indian Soc. Coast. Agric. Res. 2019, 37, 153–161. [Google Scholar]
  64. Yu, Y.; Mainuddin, M.; Maniruzzaman MMandal, U.K.; Sarangi, S.K. Rainfall and temperature characteristics in the coastal zones of Bangladesh and West Bengal, India. J. Indian Soc. Coast. Agric. Res. 2019, 37, 12–23. [Google Scholar]
  65. Schulthess, U.; Ahmed, Z.U.; Aravindakshan, S.; Rokon, G.M.; Alanuzzaman Kurishi, A.S.M.; Krupnik, T.J. Farming on the fringe: Shallow groundwater dynamics and irrigation scheduling for maize and wheat in Bangladesh’s coastal delta. Field Crops Res. 2019, 239, 135–148. [Google Scholar] [CrossRef] [PubMed]
  66. Verma, A.K.; Gupta, S.K.; Isaac, R.K. Use of saline water for irrigation in monsoon climate and deep water table regions: Simulation modeling with SWAP. Agric. Water Manag. 2012, 115, 186–193. [Google Scholar] [CrossRef]
  67. Rengasamy, P. World Salinization with Emphasis on Australia. J. Exp. Bot. 2006, 57, 1017–1023. [Google Scholar] [CrossRef]
  68. Paul, P.L.C.; Bell, R.W.; Barrett-Lennard, E.G.; Kabir, E. Straw mulch and irrigation affect solute potential and sunflower yield in a heavy textured soil in the Ganges Delta. Agric. Water Manag. 2020, 239, 106211. [Google Scholar] [CrossRef]
  69. Doorenbos, J.; Kassam, A.H. Yield Response to Water; FAO Irrigation and Drainage, Paper 33; Food and Agriculture Organization of the United Nations: Rome, Italy, 1986. [Google Scholar]
  70. Unger, P.W. Irrigation effect on sunflower growth, development, and water use. Field Crops Res. 1983, 7, 181–194. [Google Scholar] [CrossRef]
  71. Cox, W.J.; Jolliff, G.D. Growth and yield of sunflower and soybean under soil water deficits. Agron. J. 1986, 78, 226–230. [Google Scholar] [CrossRef]
  72. Jiang, J.; Huo, Z.L.; Feng, S.F.; Zhang, C.B. Effect of irrigation amount and water salinity on water consumption and water productivity of spring wheat in North-west China. Field Crop Res. 2012, 137, 78–88. [Google Scholar] [CrossRef]
  73. Malash, N.; Ali, F.; Fatahalla, M.; Hatem, M.; Tawfic, S. Response of tomato to irrigation with saline water applied by different irrigation methods and water management strategies. Int. J. Plant Prod. 2012, 2, 101–116. [Google Scholar]
  74. Singh, A.; Panda, S.N. Effect of saline irrigation water on mustard (Brassica juncea) crop yield and soil salinity in a semi-arid area of North India. Exp. Agric. 2012, 48, 99–110. [Google Scholar] [CrossRef]
Figure 1. Mean maximum (Tmax) and minimum (Tmin) air temperature (T, °C), pan evaporation (EV, mm) and rainfall (Pe, mm) during the crop growing seasons of 2016–2017 and 2017–2018 at the experiment sites of the salt-affected area of Dacope (A) and Amtali (B), respectively.
Soilsystems 08 00020 g001
Figure 2. Variations of irrigation water salinity (ECw, dS m−1) in ponds and canals at 10-day intervals during crop growing seasons of 2016–2017 and 2017–2018 at Dacope (A,B) and Amtali (C,D), respectively. Bars indicate the error percentage at 5%.
Soilsystems 08 00020 g002
Figure 3. (a) Variations in soil salinity with time (month) at different soil depths (0–15, 15–30, 30–45 and 45–60 cm) in crop growing season (December to April) at the location of Amtali in 2016–2017 (A1A4) and 2017–2018 (a1a4), respectively. T means treatment, T1 (LSW + LSW --), T2 (LSW + MSW --), T3 (LSW -- + MSW), T4 (LSW + LSW + LSW), T5 (LSW + MSW + MSW), T6 (LSW + LSW + MSW). LSW indicates low saline water (0.5 ≤ salinity ≤ 2 dS/m); MSW indicates medium saline water (2 < salinity < 5 dS m−1); -- means no irrigation applied. The timing of irrigation events was vegetative, flowering and seed development stages. Mean values within the same columns followed by different letters (a–d) are significantly different. (b) Variation in soil salinity to time (month) at different soil depths (0–15, 15–30, 30–45 and 45–60 cm) in crop growing season (December to April) at the location of Dacope in 2016–2017 (D1D4) and 2017–2018 (d1d4), respectively. Bars indicate the error percentage at 5%. T means treatment, T1 (LSW + LSW --), T2 (LSW + MSW --), T3 (LSW -- + MSW), T4 (LSW + LSW + LSW), T5 (LSW + MSW + MSW), T6 (LSW + LSW + MSW). LSW indicates low saline water (0.5 ≤ salinity ≤ 2 dS m−1); MSW indicates medium saline water (2 < salinity < 5 dS m−1). -- means no irrigation is applied. The timing of irrigation events was vegetative, flowering and seed development stages. Mean values within the same columns followed by different letters (a–e) are significantly different. (c) Variations of soil salinity (ECe) to treatment at different soil depths (0–15, 15–30, 30–45 and 45–60 cm) in crop growing season (December to April) at both locations of Amtali (A/a) in 2016–2017 and 2017–2018, respectively. Bars indicate the error percentage at 5%. T means treatment, T1 (LSW + LSW --), T2 (LSW + MSW --), T3 (LSW -- + MSW), T4 (LSW + LSW + LSW), T5 (LSW + MSW + MSW), T6 (LSW + LSW + MSW). LSW indicates low saline water (0.5 ≤ salinity ≤ 2 dS m−1); MSW indicates medium saline water (2 < salinity < 5 dS m−1). -- means no irrigation applied. The timing of irrigation events was vegetative, flowering and seed development stages. Mean values within the same columns followed by different letters (a–f) are significantly different. (d) Variations of soil salinity (ECe) to treatment at different soil depths (0–15, 15–30, 30–45 and 45–60 cm) in crop growing season (December to April) at both locations of Dacope (D/d) in 2016–2017 and 2017–2018, respectively. Bars indicate the error percentage at 5%. T means treatment, T1 (LSW + LSW --), T2 (LSW + MSW --), T3 (LSW -- + MSW), T4 (LSW + LSW + LSW), T5 (LSW + MSW + MSW), T6 (LSW + LSW + MSW). LSW indicates low saline water (0.5 ≤ salinity ≤ 2 dS m−1); MSW indicates medium saline water (2 < salinity < 5 dS m−1). -- means no irrigation applied. The timing of irrigation events was vegetative, flowering and seed development stages. Mean values within the same columns followed by different letters (a–f) are significantly different.
Soilsystems 08 00020 g003aSoilsystems 08 00020 g003b
Figure 4. (a) Effect of time on solute potential at different soil depths (0–15, 15–30, 30–45 and 45–60 cm) at Amtali (A1,A2) and Dacope (D1,D2) in 2016–2017 and 2017–2018. T means treatment, T1 (LSW + LSW --), T2 (LSW + MSW --), T3 (LSW -- + MSW), T4 (LSW + LSW + LSW), T5 (LSW + MSW + MSW), T6 (LSW + LSW + MSW). LSW indicates low saline water (0.5 ≤ salinity ≤ 2 dS m−1); MSW indicates medium saline water (2 < salinity < 5 dS m−1). -- means no irrigation applied. The timing of irrigation events was vegetative, flowering and seed development stages. Here, p values were shown: * indicates p < 0.05 significant; ** indicates p < 0.01; and *** indicates p < 0.001 highly significant. Mean values within the same columns followed by different letters (a–e) are significantly different. (b) Effect of irrigation treatments on solute potential at different soil depths (0–15, 15–30, 30–45 and 45–60 cm) at Amtali (A3,A4) and Dacope (D3,D4) in 2016–2017 and 2017–2018. T means treatment, T1 (LSW + LSW --), T2 (LSW + MSW --), T3 (LSW -- + MSW), T4 (LSW + LSW + LSW), T5 (LSW + MSW + MSW), T6 (LSW + LSW + MSW). LSW indicates low saline water (0.5 ≤ salinity ≤ 2 dS m−1); MSW indicates medium saline water (2 < salinity < 5 dS m−1). -- means no irrigation applied. Timing of irrigation events was vegetative, flowering and seed filling stages. Here, p values were shown: * indicates p < 0.05 significant; ** indicates p < 0.01; *** indicates p < 0.001 highly significant. Mean values within the same columns followed by different letters (a–c) are significantly different.
Soilsystems 08 00020 g004aSoilsystems 08 00020 g004b
Figure 5. (a) Variations of soil water content (SWC, % w/w) to time at different soil depths (0–15, 15–30, 30–45 and 45–60 cm) in crop growing season (December to April) at the location of Amtali in 2016–2017 (A1) and 2017–2018 (A2), and Dacope in 2016–2017 (D1) and 2017–2018 (D2), respectively. Bars indicate the error percentage at 5%. T means treatment, T1 (LSW + LSW --), T2 (LSW + MSW --), T3 (LSW -- + MSW), T4 (LSW + LSW + LSW), T5 (LSW + MSW + MSW), T6 (LSW + LSW + MSW). LSW indicates low saline water (0.5 ≤ salinity ≤ 2 dS m−1); MSW indicates medium saline water (2 < salinity < 5 dS m−1). -- means no irrigation applied. The timing of irrigation events was vegetative, flowering and seed development stages. Mean values within the same columns followed by different letters (a–d) are significantly different. (b) Variations of soil water content (SWC, %, w/w) in treatments at different soil depths (0–15, 15–30, 30–45 and 45–60 cm) in crop growing season (December to April) at the location of Amtali in 2016–2017 (A3) and (A4) in 2017–18 and Dacope in 2016–2017 (D3) and (D4) in 2017–2018, respectively. Bars indicate the error percentage at 5%. T means treatment, T1 (LSW + LSW --), T2 (LSW + MSW --), T3 (LSW -- + MSW), T4 (LSW + LSW + LSW), T5 (LSW + MSW + MSW), T6 (LSW + LSW + MSW). LSW indicates low saline water (0.5 ≤ salinity ≤ 2 dS m−1); MSW indicates medium saline water (2 < salinity < 5 dS m−1). -- means no irrigation applied. The timing of irrigation events was vegetative, flowering and seed development stages. Mean values within the same columns followed by different letters (a–f) are significantly different.
Soilsystems 08 00020 g005
Table 1. Initial soil physical properties in the experimental plots at Amtali and Dacope in 2016–2017.
LocationSoil Depth, cmField Capacity, % w/wClay (%)Silt (%)Texture ClassBulk Density (g/cm3)Organic Matter, g/kg
Amtali0–1531.82830Clay loam1.458.3
15–3031.42927Clay loam1.4610.2
30–4531.93128Clay loam1.439.5
45–6031.92926Clay loam1.465.9
Dacope0–1536.23521Clay loam1.3717.1
15–3035.63917Clay loam1.3910.2
30–4537.44215Clay1.319.3
45–6039.73718Clay loam1.3820.2
Table 2. Number of irrigation events, amount of applied irrigation water, seasonal water use of sunflower under different irrigation treatments during 2016–2017 and 2017–2018.
YearLocationTreatmentIrrigation (IR) EventAmount of Applied IR Water (I, mm)Pe (mm)ΔSMC (mm)ETa (mm)
1st IR (mm)2nd IR (mm)3rd IR (mm)
2016–2017DacopeT12866-9490−13171
T22866-9490−14170
T328-689690−16170
T428666816290−19233
T528666816290−21231
T628666816290−23229
AmtaliT12265-8784−6165
T22265-8784−7164
T322-1234844122
T42265129984−12171
T52265129984−9174
T62265129984−10173
2017–2018DacopeT12763-902021131
T22763-902023133
T327-64912020131
T42763641542017191
T52763641542018192
T62763641542019193
AmtaliT12161-822325130
T22161-822326131
T321-60812322126
T42161601422323188
T52161601422320185
T62161601422324189
IR indicates irrigation. Re is effective rainfall; ΔSMC is the change in soil water content. T means treatment, T1 (LSW + LSW --), T2 (LSW + MSW --), T3 (LSW -- + MSW), T4 (LSW + LSW + LSW), T5 (LSW + MSW + MSW), T6 (LSW + LSW + MSW). LSW indicates low saline water (0.5 ≤ salinity ≤ 2 dS m−1); MSW indicates medium saline water (2 < salinity < 5 dS m−1). -- means no irrigation is applied. The timing of irrigation events was vegetative, flowering and seed development stages.
Table 3. Effect of location and treatments on sunflower seed yield, yield contributing parameters, crop water productivity (CWP) and irrigation water productivity (IWP) of sunflower in 2016–2017.
Year
2016–2017
ParametersSeed No.
Head−1
Seed Weight Head−1, gHundred Seed Weight, gSeed Yield,
t ha−1
CWP,
kg m−3
IWP
kg m−3
Analysis test codes (P)
Location (L)**************
Treatment (T)ns***ns****** ***
Location × Treatment (L × T)ns*ns*******
Location
Dacope1238 a73.6 a7.0 a2.45 a1.25 a2.05 b
Amtali1021 b57.4 b5.7 b1.80 b1.12 b2.39 a
CV (%)10.38.37.65.25.66.3
Treatment
Treatment
mean values
T1 115167.4 b6.372.17 b1.29 b2.39 b
T2 112158.4 c5.972.04 c1.22 b2.25 c
T3 119865.6 b6.292.0 c1.36 a3.54 a
T4 113967.9 b6.822.29 a1.15 c1.83 d
T5 109651.0 c6.172.02 c0.99 d1.57 e
T6 117372.7 a6.622.23 ab1.11 c1.75 d
CV (%)4.14.98.84.84.74.4
Location × Treatment (L × T)
DacopeT1 123379.5 a7.02.47 ab1.44 a2.63 b
T2 126165.8 cd6.672.33 b1.37 a2.48 b
T3 122172.3 b7.012.47 ab1.46 a2.57 b
T4 122774.5 ab7.22.52 a1.08 de1.56 ef
T5 122370.8 bc6.832.39 ab1.04 ef1.47 f
T6 126078.8 a7.232.53 a1.10 de1.56 ef
AmtaliT1 106955.3 fg5.71.87 de1.13 cd2.15 c
T2 98051.0 g5.271.76 de1.07 de2.02 cd
T3 97558.8 ef5.501.54 f1.26 b4.52 a
T4 105061.3 de6.42.07 c1.21 bc2.09 cd
T5 96951.2 ef5.51.65 ef0.95 f1.67 e
T6 108666.6 cd6.01.93 cd1.11 de1.95 d
CV means coefficient of variation. CWP means crop water productivity; IWP means irrigation water productivity. Mean values within the same columns followed by different letters (a–f) are significantly different. No letter indicates non-significant effects (ns). Here, the significant F test values from analysis of variance (ANOVA) were shown: * indicates p < 0.05 significant; ** indicates p < 0.01, *** indicates p < 0.001 highly significant; and ns indicates not significant). L means location, T means treatment, T1 (LSW + LSW --), T2 (LSW + MSW --), T3 (LSW -- + MSW), T4 (LSW + LSW + LSW), T5 (LSW + MSW + MSW), T6 (LSW + LSW + MSW). LSW indicates low saline water (0.5 ≤ salinity ≤ 2 dS m−1); MSW indicates medium saline water (2 < salinity < 5 dS m−1). -- means no irrigation is applied. The timing of irrigation events was vegetative, flowering and seed development stages.
Table 4. Effect of location and treatments on sunflower seed yield, yield contributing parameters, crop water productivity (CWP) and irrigation water productivity (IWP) of sunflower in 2017–2018.
Year
2017–2018
ParametersSeed no. Head−1Seed Weight Head−1, gHundred Seed Weight, gSeed Yield,
t ha−1
CWP,
kg m−3
IWP
kg m−3
Analysis test codes (P):
Location (L)********nsnsns
Treatment (T) ns***********
Location × Treatment (L × T)***nsnsnsns
Location
Dacope1136. a66.9 a7.4 a1.500.941.28
Amtali653 b54.4 b6.2 b1.390.891.31
CV (%)4.66.87.113.713.914.8
Treatment (T)
Treatment mean valuesT1 83258.9 bc6.84 ab1.29 b0.98 a1.49 a
T2 92158.4 bc6.71 bc1.36 b1.03 a1.58 a
T3 88157.4 c6.51 c1.30 b1.01 a1.51 a
T4 90564.8 a6.84 ab1.63 a0.86 b1.10 b
T5 91061.5 abc6.80 bc1.57 a0.84 b1.06 b
T6 91962.9 ab7.13 a1.52 a0.79 b1.03 b
CV (%)6.76.33.96.57.07.2
Location × Treatment (L × T)
DacopeT1 969 b60.2 d6.391.240.941.37
T2 1163 a60.7 cd6.151.401.061.56
T3 1166 a67.1 bc6.031.401.071.54
T4 1167 a74.2 a5.971.720.891.11
T5 1195 a68.2 ab6.101.640.861.07
T6 1159 a70.8 ab6.601.610.831.04
AmtaliT1 695 c57.7 d7.291.331.021.62
T2 80 c 55.9 d7.261.321.011.60
T3 595 c47.8 e6.991.190.951.48
T4 644 c55.4 d7.701.550.821.09
T5 625 c54.8 d7.501.500.811.06
T6 80 c55.0 d7.651.430.761.01
CV means coefficient of variation. CWP means crop water productivity; IWP means irrigation water productivity. Mean values within the same columns followed by different letters (a–e) are significantly different. No letter indicates non-significant (ns). Here, the significant F test values from analysis of variance (ANOVA) were shown: * indicates p < 0.05 significant; ** indicates p < 0.01, *** indicates p < 0.001 highly significant; and ns indicates not significant). L means location, T means treatment, T1 (LSW + LSW --), T2 (LSW + MSW --), T3 (LSW -- + MSW), T4 (LSW + LSW + LSW), T5 (LSW + MSW + MSW), T6 (LSW + LSW + MSW). LSW indicates low saline water (0.5 ≤ salinity ≤ 2 dS/m); MSW indicates medium saline water (2 < salinity < 5 dS m−1), -- means no irrigation applied. The timing of irrigation events was vegetative, flowering and seed development stages.
Disclaimer/Publisher’s Note: The statements, opinions and data contained in all publications are solely those of the individual author(s) and contributor(s) and not of MDPI and/or the editor(s). MDPI and/or the editor(s) disclaim responsibility for any injury to people or property resulting from any ideas, methods, instructions or products referred to in the content.

