Article

Fractions of Organic Matter and Soil Carbon Balance in Different Phases of an Agroforestry System in the Cerrado: A Ten-Year Field Assessment

by
Juscelina Arcanjo dos Santos
1,2,
Anselmo de Deus dos Santos
1,
Camila Rodrigues Costa
1,
Alyson Silva de Araujo
1,
Gilberto Gonçalves Leite
1,
Thais Rodrigues Coser
1 and
Cícero Célio de Figueiredo
1,*
1
Faculty of Agronomy and Veterinary Medicine, University of Brasília, Campus Darcy Ribeiro, Brasilia 70910-970, FD, Brazil
2
Department of Forest Sciences, University of Brasília, Campus Darcy Ribeiro, Brasília 70910-970, DF, Brazil
*
Author to whom correspondence should be addressed.
Soil Syst. 2024, 8(2), 44; https://doi.org/10.3390/soilsystems8020044
Submission received: 9 February 2024 / Revised: 29 March 2024 / Accepted: 3 April 2024 / Published: 10 April 2024

Abstract

:
Integrated production systems composed of trees, crops and pastures have shown good results in improving soil quality and the capacity to store carbon in the soil, being efficient in mitigating greenhouse gas emissions. Despite this, changes in carbon stocks and soil organic matter fractions in the initial stages of implementing an agroforestry system remain unclear. This study evaluated the carbon balance and the dynamics of soil organic matter fractions in an agroforestry system conducted over a decade. Total carbon, labile carbon, carbon from particulate organic matter, organic carbon associated with minerals and inert carbon were determined at depths 0–10 cm, 10–20 cm and 20–40 cm. Soil carbon stocks were also estimated for the 0–40 cm depth. Total carbon increased in the agroforestry system compared with a low-productivity pasture. The total carbon stock in the last growing season (68.57 Mg ha−1) was close to the original soil stocks under native Cerrado vegetation (76.5 Mg ha−1). After 10 years, there was a positive balance in the soil carbon stock of both the total carbon and the soil organic matter fractions. The successional agroforestry system is a good alternative to increasing soil total carbon stocks and labile and non-labile fractions of soil organic matter.

1. Introduction

The increase in greenhouse gas (GHG) emissions in recent decades is one of the biggest current concerns for researchers, governments and society, mainly due to the relationship between these gases and global environmental changes. Among GHGs, the increase in CO2 emissions caused by changes in land use, including deforestation and conventional tillage systems, requires urgent changes in the way agricultural land is used [1]. The current agricultural model, characterized by intense land use and low diversity of plant species, results in physical, chemical and biological degradation of the system, consequently lowering carbon (C) stocks and reducing the contribution of agriculture to mitigating GHG emissions [2,3].
Global concern about the degradation of agricultural soils has motivated the creation of several initiatives focused on sustainable development through the adoption of the principles of regenerative and more productive agriculture. These initiatives promote the adoption of agricultural practices that increase the accumulation of C in the soil. An example is the international “4 per 1000” Initiative, which aims to show that agricultural soils have an important role in food security and global climate change through C sequestration. The Cerrado is the second largest Brazilian biome with 205 million hectares. Part of the Cerrado has been used as Brazil’s great agricultural frontier, normally associated with the degradation of natural resources. Approximately 39% of Cerrado pastures, which cover 18.2 million hectares, are degraded [4,5], highlighting the need for effective management practices that minimize soil degradation.
Integrated and diversified production systems, such as agroforestry that integrate crop, livestock and forestry components in the same area, are considered a good example of land use with potential for mitigating GHG emissions. These systems have the potential to sequester CO2 both in the above-ground biomass, mainly in the arboreal component, and in the soil, increasing the soil C stock at greater depths when compared with conventional agricultural systems [6,7,8,9].
Soil organic matter (SOM) is considered a key component of ecosystems and includes a continuum of materials comprising rapidly decomposed material, such as labile organic C, to very recalcitrant fractions, for example, non-labile C. The specific characteristics of the different components of the system influence the supply of SOM, increasing the production of organic compounds of different chemical natures and promoting an increase and diversification of the soil microbiota [10,11,12].
Several factors influence both the accumulation and spatial distribution of soil C, which can highlight climatic conditions, mainly temperature and precipitation, soil characteristics such as texture, soil structure and the type of vegetation [13,14]. Vegetation favors the entry of decomposing plant biomass, especially in the surface layer of the soil (0–30 cm) [14]. Hence, the importance of using agroforestry systems with long-cycle tree components. Several studies have demonstrated an increase in C stock in integrated production systems when compared with conventional agriculture [3,7,10,11,15]. Freitas et al. [16] evaluated C stocks in well-managed pastures and agroforestry systems in the Brazilian Cerrado and reported that these systems promoted faster recovery of soil C stocks at all depths, reaching values similar to those in the Cerrado under natural vegetation, in addition to improving other soil properties.
The objective of this study was to evaluate, throughout different phases of an agroforestry system conducted for a decade, (i) the dynamics of total C and labile and non-labile fractions of SOM fractions and(ii) the impact of suspending maize cultivation of agroforestry system on soil total C stocks. For this, the following hypotheses were tested: (i) the use of an agroforestry system with maize, Panicum maximum and Gliricidia sepium increases the total C and labile and non-labile fractions of SOM and (ii) soil C stocks are kept at least for four years after the suppression of the agricultural component (maize) from the agroforestry system.

2. Materials and Methods

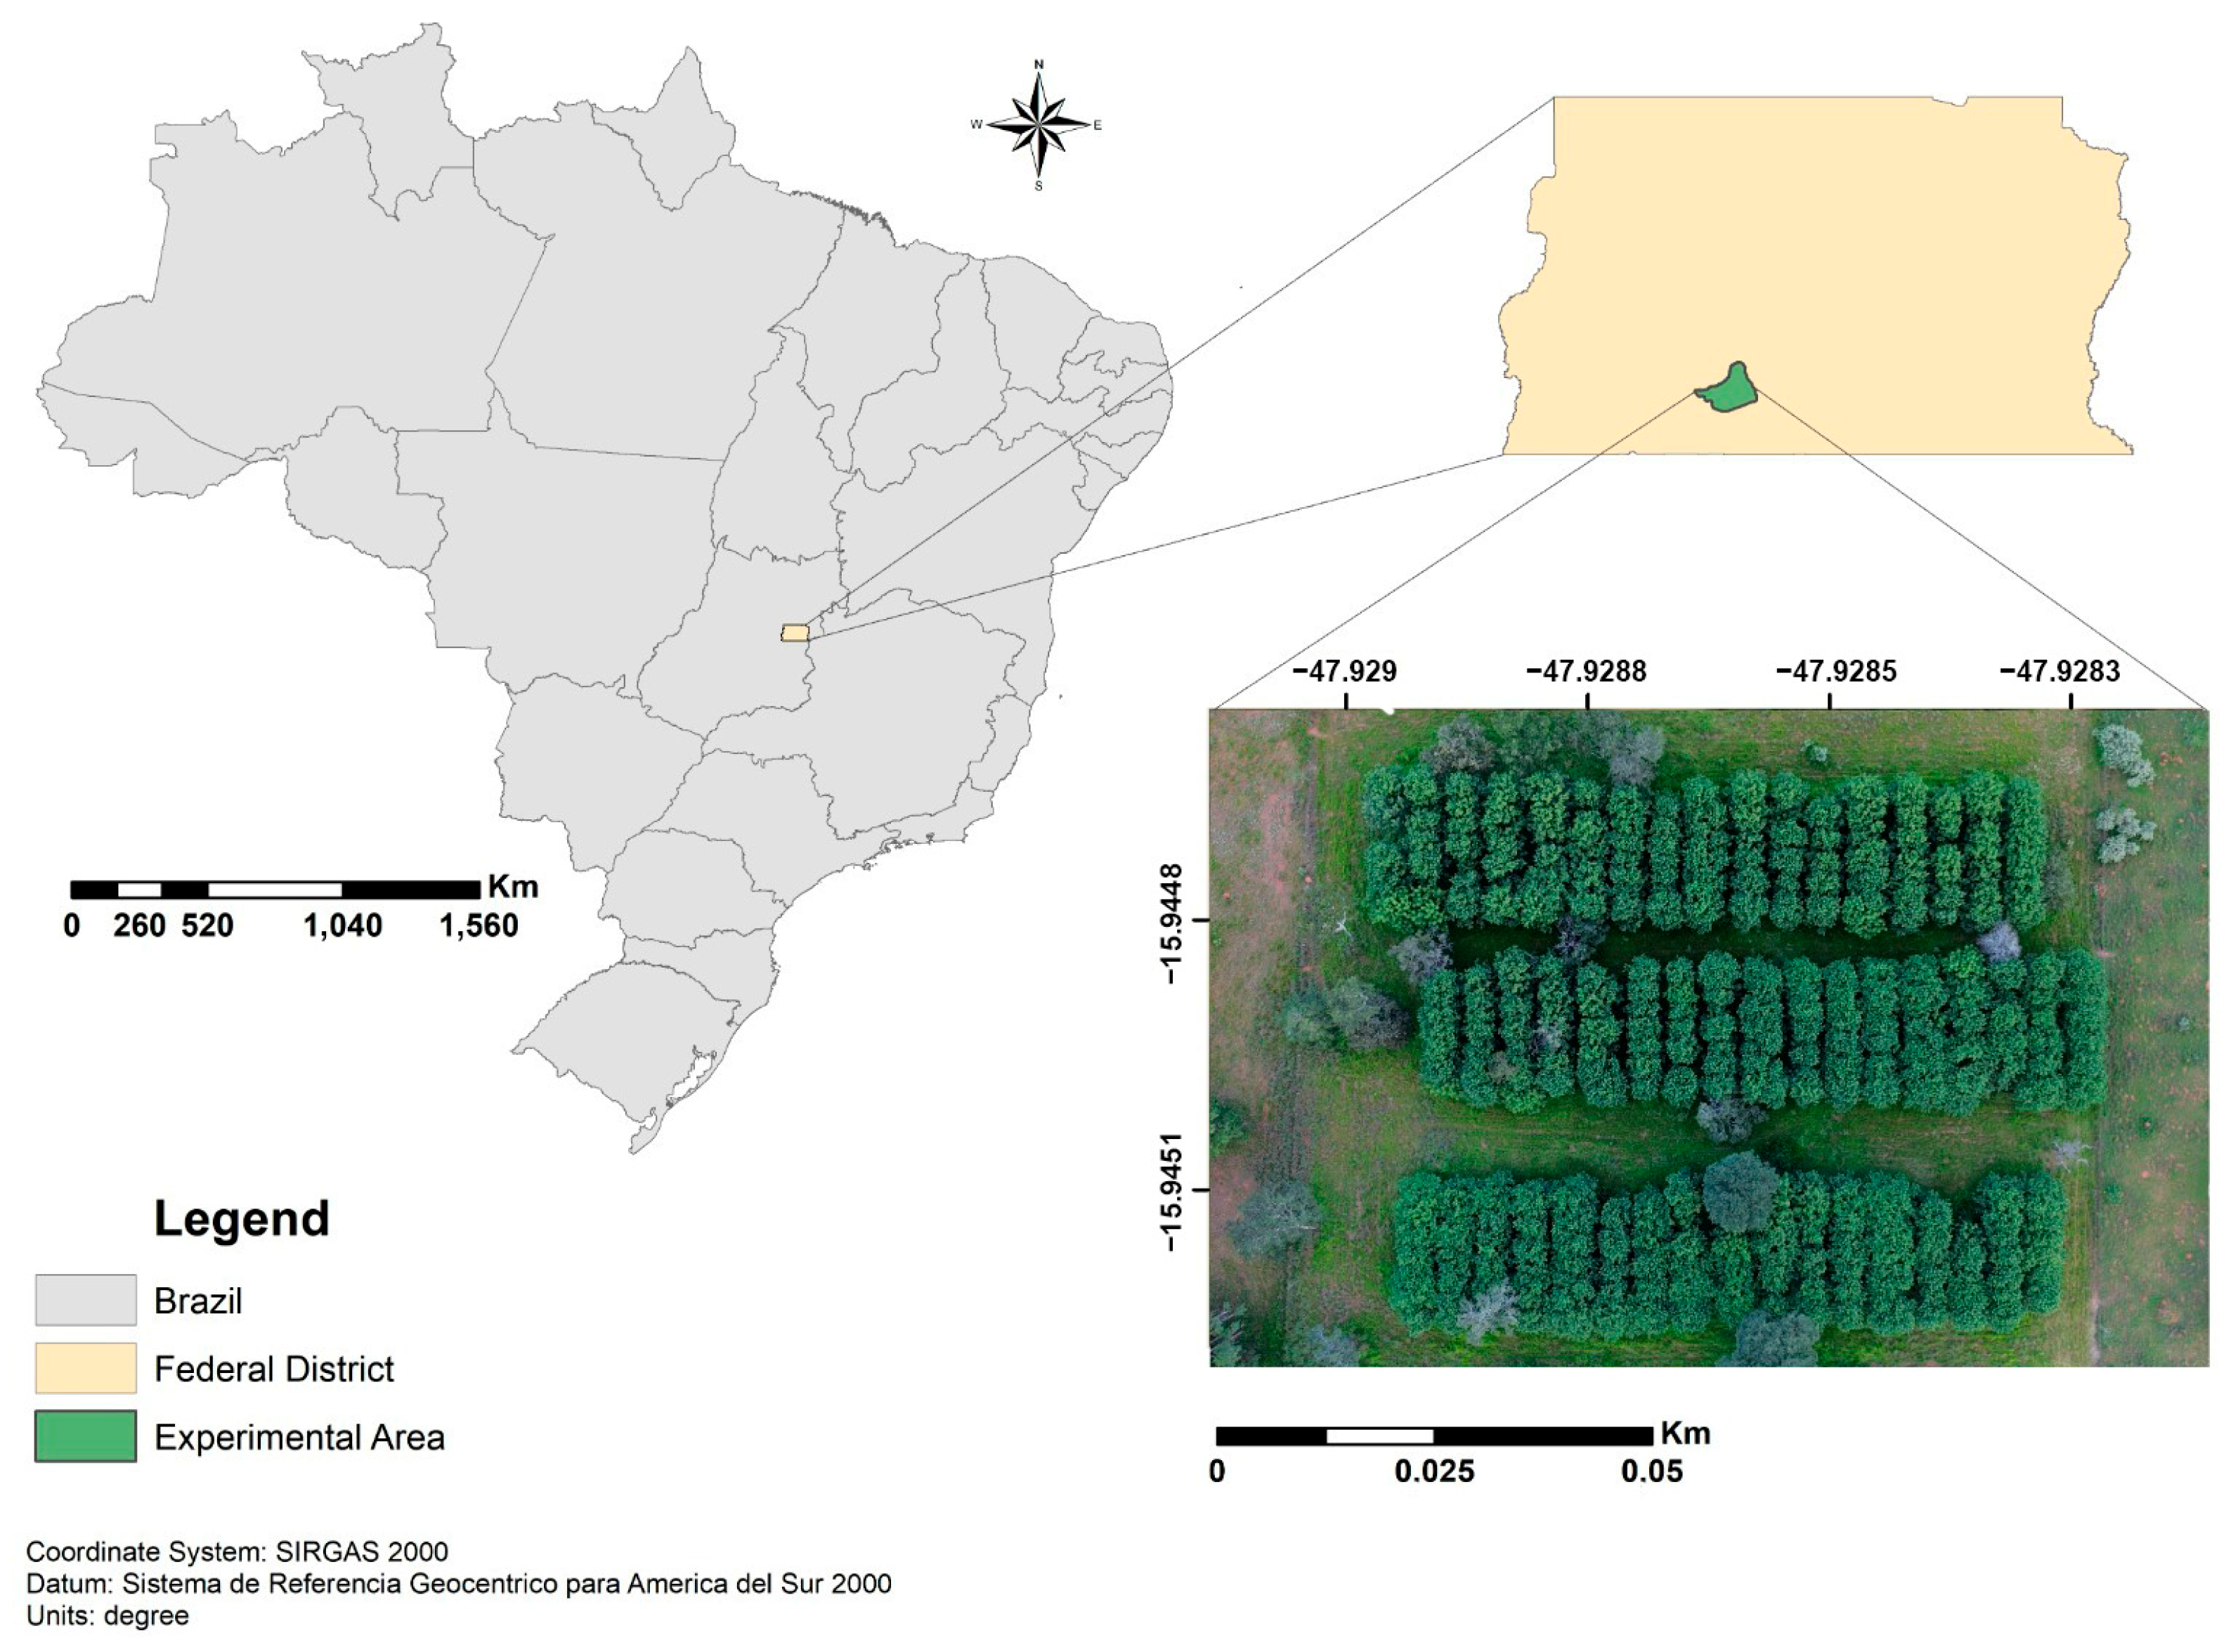
2.1. Experimental Area

The experiment was carried out at the Água Limpa Experimental Farm of the University of Brasília, Federal District, Brazil (latitude of 15°56′ S, longitude of 47°56′ W and altitude of 1090 m above mean sea level) (Figure 1). The region’s climate is classified as Humid Tropical—Cwa, according to Köppen’s classification [17], with average annual precipitation of 1439 mm (distributed between October and March) and average annual temperatures varying from 16.7 °C to 22.4 °C.
The soil in the experimental area is classified as Red Oxisol according to the Brazilian soil classification system [18] or Ferralsol Gibbsic [19]. Table 1 presents the chemical and physical attributes of the soil before the implementation of the experiment (T0) and after the last harvest (T4).

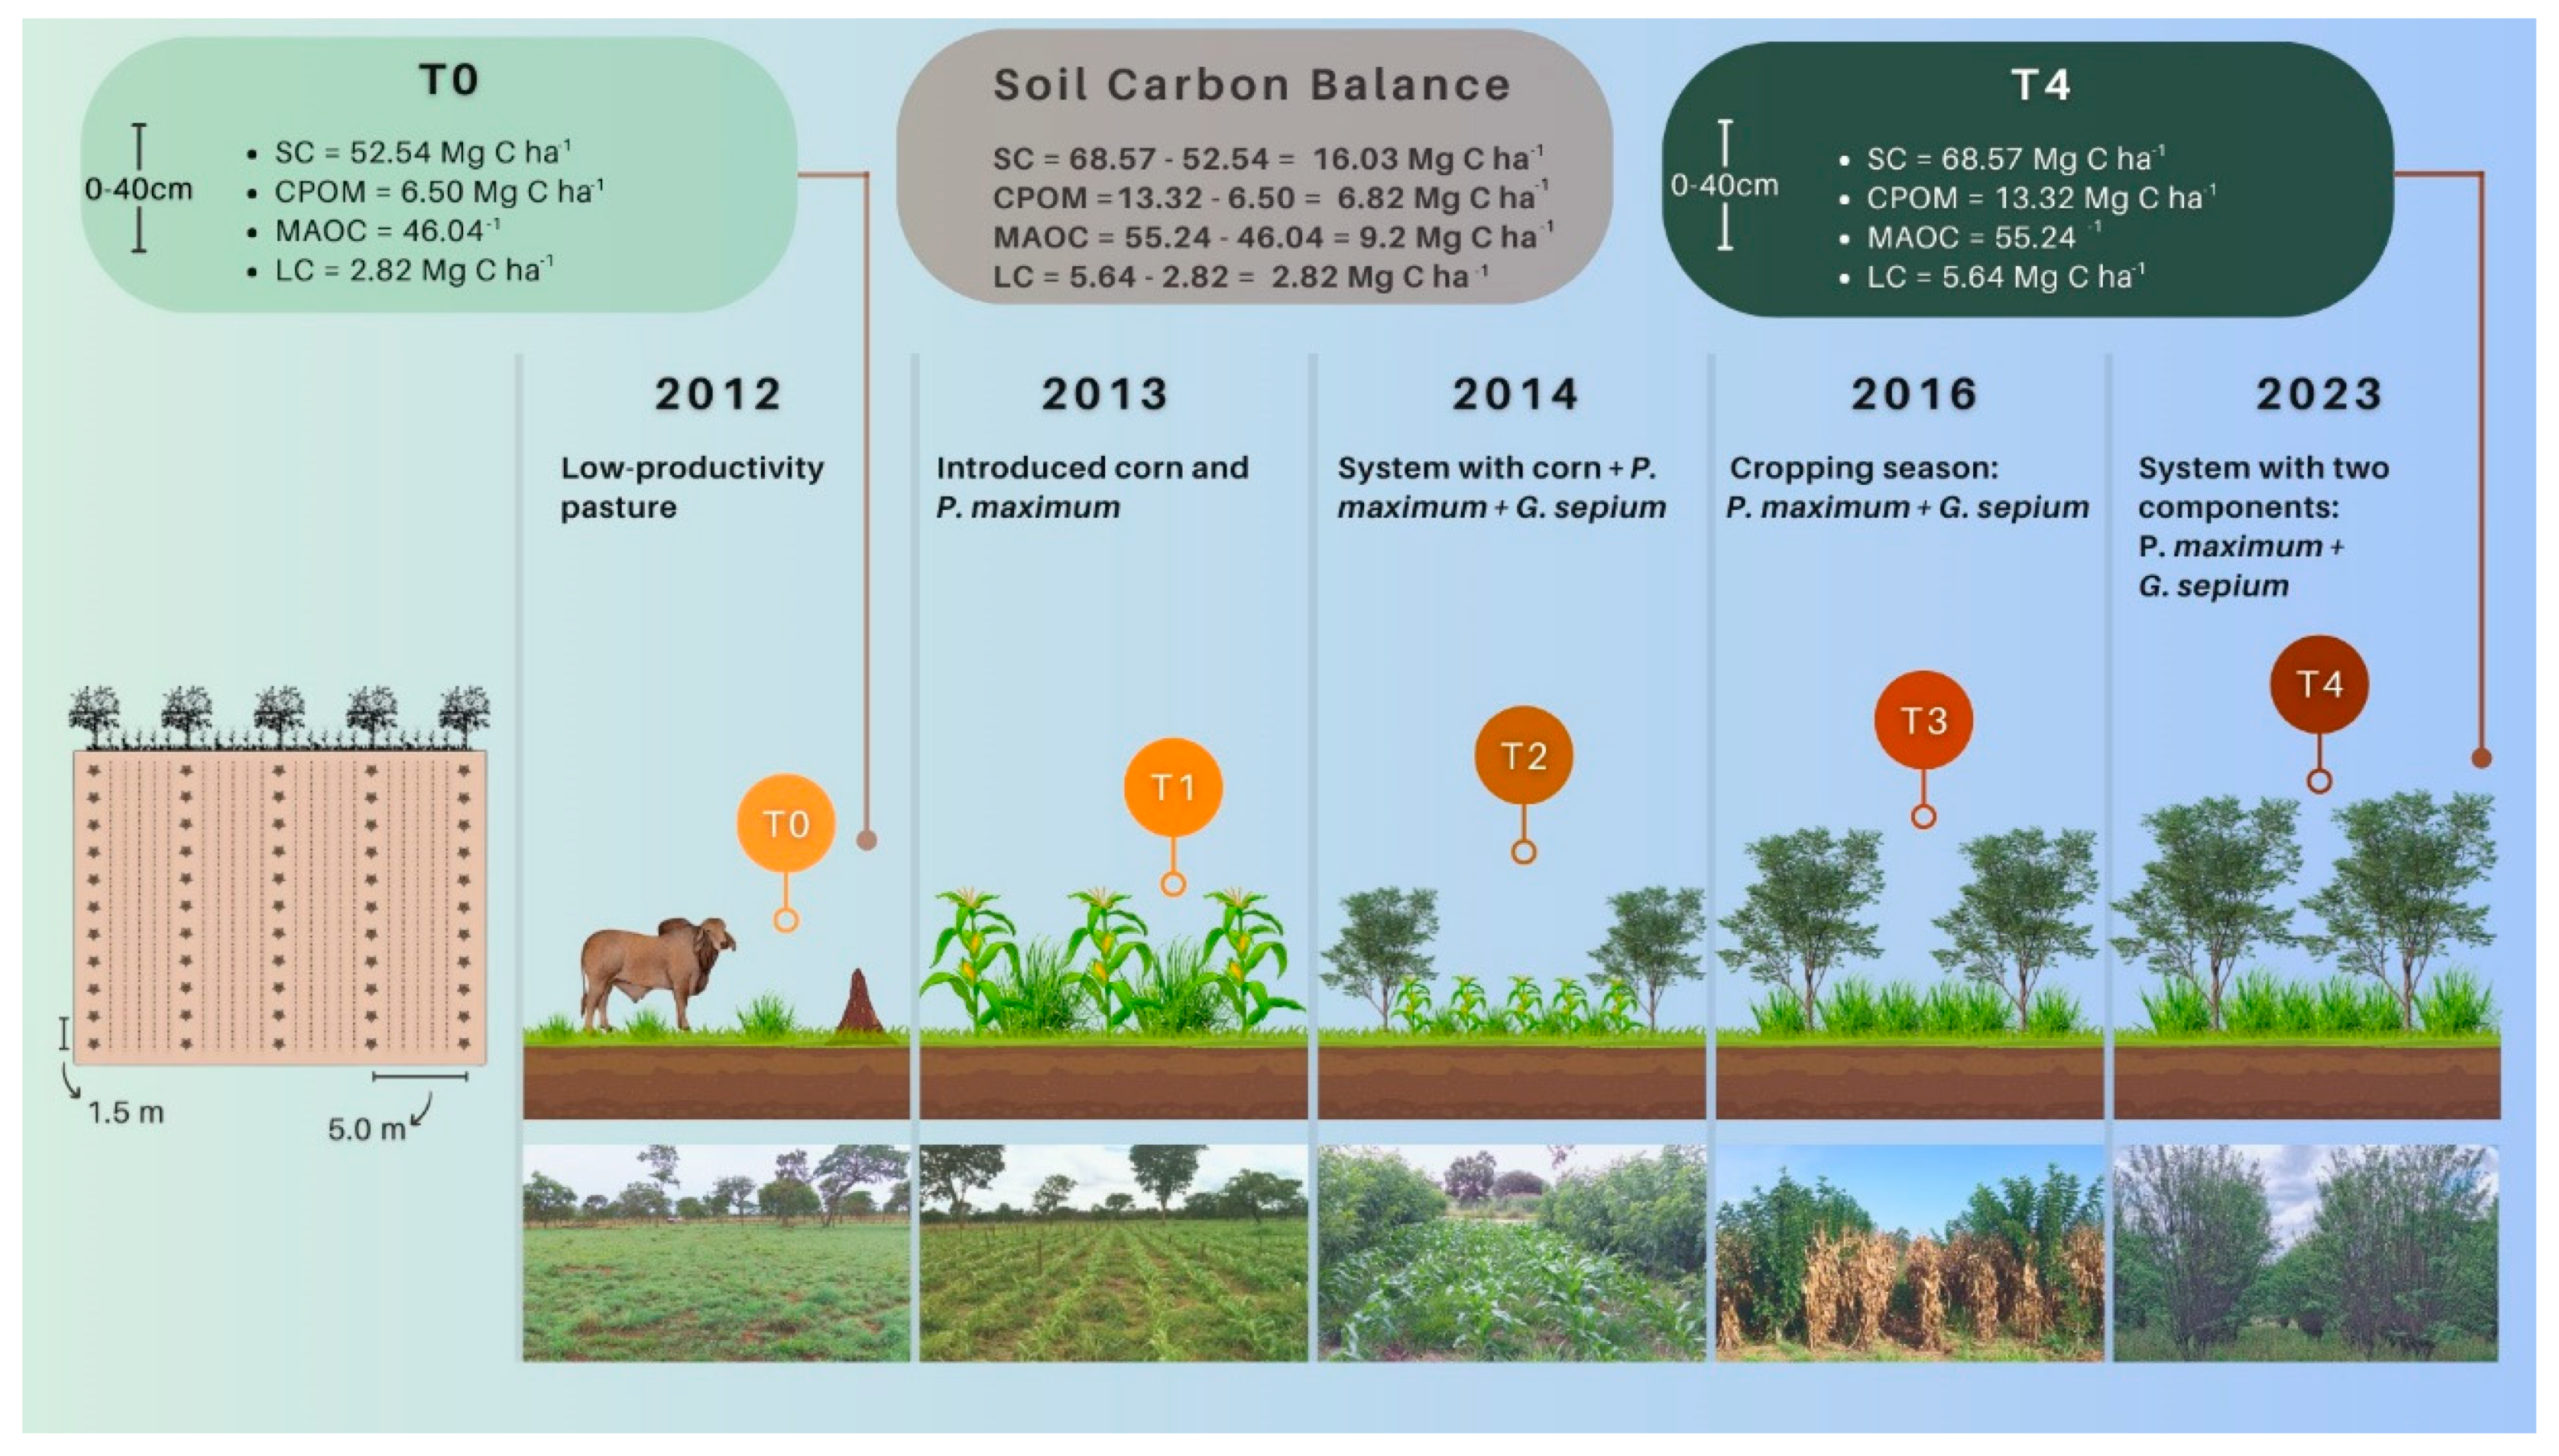
2.2. History of Conducting the Experiment

The experiment was set up in 2013 in an area characterized as a low-productivity pasture (T0). Before installing the agroforestry system, liming was carried out to increase base saturation to 50% by applying 1.5 t ha¹ of dolomitic limestone, and fertilization was carried out with the application of 87 kg ha−1 of P2O5, in addition to plowing and harrowing to the 0–20 cm layer.
In the first phase of the experiment, in January 2013, maize (hybrid AG 1051) was sown under no-tillage with rows spaced 0.9 m apart, totaling approximately 60,000 plants ha−1, which is equivalent to 5.4 plants/linear meter (T1). Maize fertilization was based on soil chemical analysis and the specific needs of the crop [20], and the following rates were applied to the maize planting furrow: 20 kg N ha−1 + 100 kg P2O5 ha−1 + 84 kg K2O ha−1. Fertilizer rates applied throughout the growing seasons are presented in Table 1. One day after planting the maize, the forage component was also planted, which was the perennial grass—Panicum maximum cv. Massai (10 kg of seeds ha−1).
In December 2014, gliricidia (Gliricidia sepium) was planted as a tree component. Gliricidia was planted in an alley cultivation arrangement with a row spacing of 5 m and 1.5 m between plants, totaling 1333 plants ha−1. This phase of the experiment was identified as T2. The three components (maize, Panicum maximum and Gliricidia sepium) were grown in an intercropping system until the third harvest of the 2015/2016 cropping season (T3). To control (but not kill) the growth of the perennial grass in the cropping seasons of 2014/2015 and 2015/2016, agricultural practices such as mowing and reduced doses of herbicide containing paraquat and/or glyphosate were used. Other than that, only manual practices were used to control weeds. The experiment was carried out under rainfed conditions without supplementary irrigation.
In order to simulate the impacts of removing the agricultural component from the integrated system, from the 2016/2017 harvest onwards, the system was conducted only with the arboreal (G. sepium) and forage (P. maximum) components. After 7 years of being conducted with only these two components, an evaluation of the system was carried out to understand how the removal of the agricultural component (maize) influences the C stock and SOM fractions. This phase was identified as T4. Table 2 summarizes the treatments, fertilization and operations carried out in the different phases of this study.

2.3. Soil Sampling

Soil samples were collected in the 0–10 cm, 10–20 and 20–40 cm layers over four harvests as follows: October 2012, when the area was under the low-productivity pasture (T0); March 2014 (T1); March 2015, at the time of full maize flowering, intercropped with P. maximum and G. sepium (T2); March 2016, intercropping maize, P. maximum and G. sepium (T3) and November 2023, with only the cultivation of G. sepium and P. maximum (T4).
Samples were collected in five plots measuring 50 m2 (10.0 m × 5.0 m) within the experimental area to ensure that soil samples were always collected nearby in all harvest seasons. Five composite samples were collected in each phase of the experiment. Each composite sample was formed from six subsamples (2 samples from the maize row and 4 samples from the maize between rows in two different locations within the delimited sample plots) that were taken from the middle of the plots (approximately 2.50 m perpendicular to the line of the trees). For samples collected at time T0 (under the low-productivity pasture), six subsamples were collected randomly in the plot to form the composite samples.

2.4. Determination of Total Organic C Content and C in Fractions of Organic Matter and Other Soil Attributes

Total organic carbon (TC) content was determined by the dry combustion method using a CHN elemental analyzer (model PE 2400, series II CHNS/O, PerkinElmer, Norwalk, CA, USA). For this, the soil samples were previously ground and passed through a sieve (<0.150 mm).
The physical granulometric fractionation of SOM was determined according to Cambardella and Elliott [21]. A 20 g soil sample was placed in a flask with 70 mL of sodium hexametaphosphate (5 g L−1) and shaken for 15 h on an orbital shaker at 150 rpm. The soil suspension was then sieved through a 53 μm mesh sieve with distilled water. The material retained on the sieve, considered particulate organic matter (>53 μm), was dried in an oven at 60 °C until constant weight. The soil sample was then ground in a porcelain mortar and passed through a 0.149 mm sieve. Carbon in particulate organic matter (CPOM) was also obtained by dry combustion using the same CHN elemental analyzer used for TC. The organic C associated with minerals (MAOC) was calculated by the difference between CT and CPOM.
Soil inert carbon (IC) was determined according to Jackson [22] with adaptations made by Jantalia et al. [23]. First, 1.0 g of soil was placed in a 100 mL glass bottle and 10 mL of hydrogen peroxide was added. The flask was then placed on a hot plate at 100 °C until boiling dry. Another volume of 5 mL of hydrogen peroxide was added to the flask (at 100 °C) and left until there was no effervescence. The flask and soil were dried in an oven at 100 °C for 12 h. After cooling, they were weighed and then ground to pass through a 0.149 mm sieve. To measure total C, an elemental analyzer was used, and the IC was calculated based on these results and the mass of the soil after peroxidation.
The C of the labile fraction of organic matter (LC) was determined by oxidation with potassium permanganate (KMnO4), following Shang [24]. Air-dried soil samples were passed through a 0.5 mm mesh sieve. A 1 g soil sample was oxidized with 25 mL of KMnO4, stirred for one hour at 60 rpm and then centrifuged for 5 min at 7.000 rpm. A 1 mL aliquot was taken from each sample and added to a 250 mL flask and distilled water was added. An aliquot was again removed from the vial and its absorbance was measured at 565 nm using a spectrophotometer (Biospectro, model SP220, São Paulo, Brazil).
To evaluate soil density and moisture, soil samples were collected in volumetric rings (100 cm3) in the 0–10 cm, 10–20 and 20–40 cm layers and at the same time interval as the soil samples for C measurement to calculate inventory C for T0, T1, T2, T3 and T4 [25].

2.5. Statistical Analyses

During the ten-year field experiment, we measured the temporal variability in the soil variables in the same experimental area during 5 phases of the agroforestry system (T0, T1, T2, T3 and T4–fixed and dependent factor). When evaluating the autocorrelation of the data using the “itsadug” package in the acr-residue (Auto- and Cross-Covariance and -Correlation Function Estimation) function in R, no dependence (or cumulative effect) between the treatments was observed. We also evaluated the Durbin–Watson test using the dwtest function in the lmtest package, and the result was close to 2, indicating no data autocorrelation. Therefore, the data were analyzed considering an incomplete randomized design with repeated measures in time for each soil layer. To evaluate the statistical differences between the depths in the variables studied in the 5 phases of the experiment (treatments), we used a generalized linear model in the software R (version 4.3.0) with post hoc comparison using the Tukey test (p < 0.05). For this, the package “lme4”- “emmeans” was used. The generalized linear model (GLM) was described in the following way: model < -glm (Variable~ Trat*Depth, data = df, family = Gamma (link = “identity “)). Sigmaplot version 10 software was used to create the graphs.

3. Results and Discussions

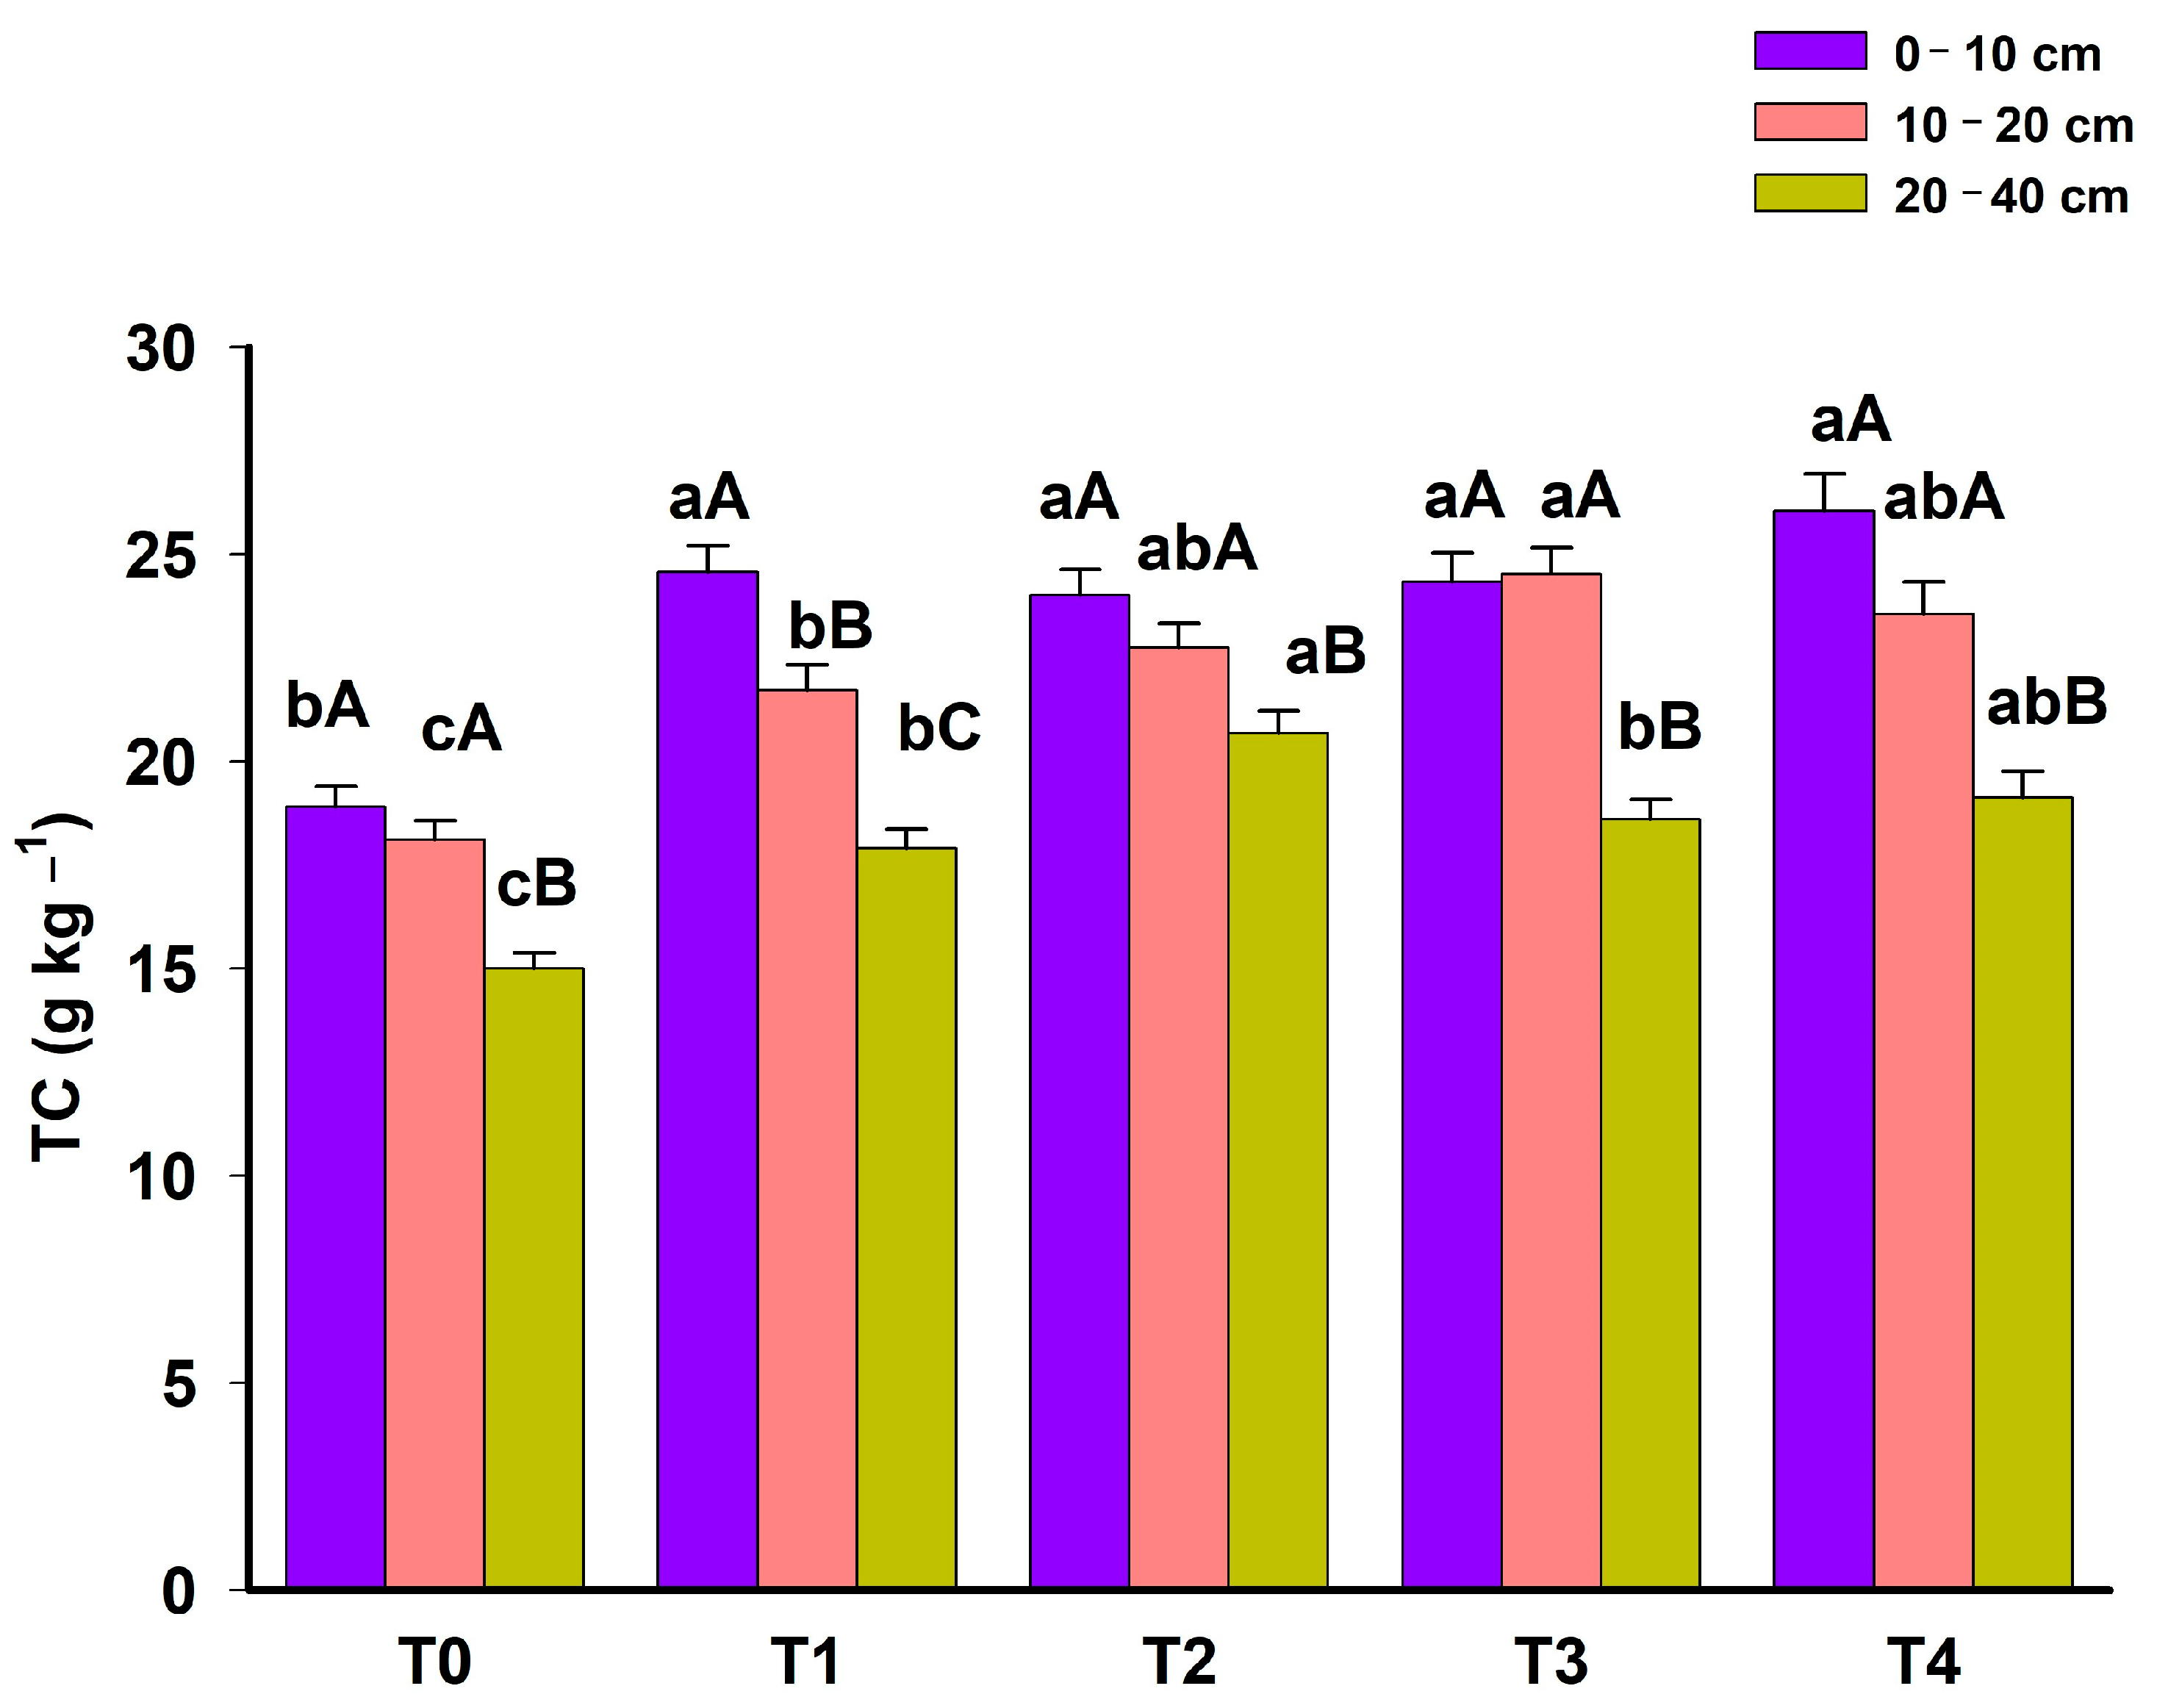
3.1. Total Organic Carbon

In general, there was a reduction in TC levels with increasing soil depth in all phases of the system (p < 0.05) (Figure 2). This TC stratification demonstrates that surface C inputs still represent the main form of C accumulation in the Cerrado soils.
Throughout the phases of the agroforestry system, TC increased at all depths evaluated (Figure 2). In the 0–10 cm layer, T0, characterized as a low-productivity pasture, had the lowest TC value (18.90 g kg−1). From the second year onwards, the TC increased, remaining constant throughout the other phases of the system.
Adopting the agroforestry system also promoted TC gains in the 10–20 cm and 20–40 cm layers. These two layers were more sensitive to express changes in TC contents in the different phases of the system. In the 10–20 cm layer, the most complete phase of the system (T4) had a higher TC content than T0 and T1 and was similar to the other phases (T2 and T3). Interestingly, the results indicate that even with the removal of maize from the system from 2016 onwards, there was no reduction in TC at any depth evaluated. The TC gains at depth 20–40 cm were greater in T2, the phase in which the arboreal component was inserted, with an increase of 5.70 g kg−1 compared with T0 (p < 0.05). This increase in TC promoted by the arboreal component remained even after the suppression of the agricultural component (maize). This maintenance of deep C stocks can be justified by lower CO2 emissions from the soil promoted by lower temperatures in systems with an arboreal component [26].
In general, the complexity of the system over time promoted a greater accumulation of C, contributing to the reduction in GHG emissions into the atmosphere. Several factors contribute to the greater storage of C in agroforestry systems, including the intense biological activity of microorganisms, root exudates, humus formation and greater decomposition of litter [12,27,28]. Soil organic carbon is the main component of C in terrestrial ecosystems and an indicator of soil quality [29].
Vegetation plays a fundamental role in the stock and distribution of C in the soil, favoring the entry of decomposing plant biomass, especially in the surface layer of the soil (0–30 cm) [26]. The higher TC values in T4, including in the 0–10 cm layer, can be attributed to the contribution of gliricidia in the system. Although maize was suppressed from the system, gliricidia maintained the C input in the soil, probably because of the large production of litter, increasing the TC not only in the deeper layers but also in the superficial layers, because of the large input of material plant generated by the above-ground biomass. An 11-year-old maize–gliricidia consortium also exhibited a notable increase in soil carbon content in the surface layers (0–20 cm), when compared with maize monoculture [30]. In another 14-year study conducted in a semi-arid region of South Africa, the intercropping of gliricidia with maize once again showcased a positive impact on soil C content [31]. These findings collectively underscore the potential of gliricidia to sequester C, particularly in the uppermost layers of the soil. The high TC value in the deepest layer (20–40 cm) can be attributed to the root system that reaches greater depths and consequently greater TC in the system. A positive point when inserting long-cycle tree components into the system is that perennial woody vegetation continually returns litter to the soil, and tree removal occurs less frequently when compared with the annual harvest of short-cycle components [15]. Other studies have also shown the efficiency of systems that use the arboreal component as strategies for accumulating higher levels of carbon in the soil [11,16,32,33].

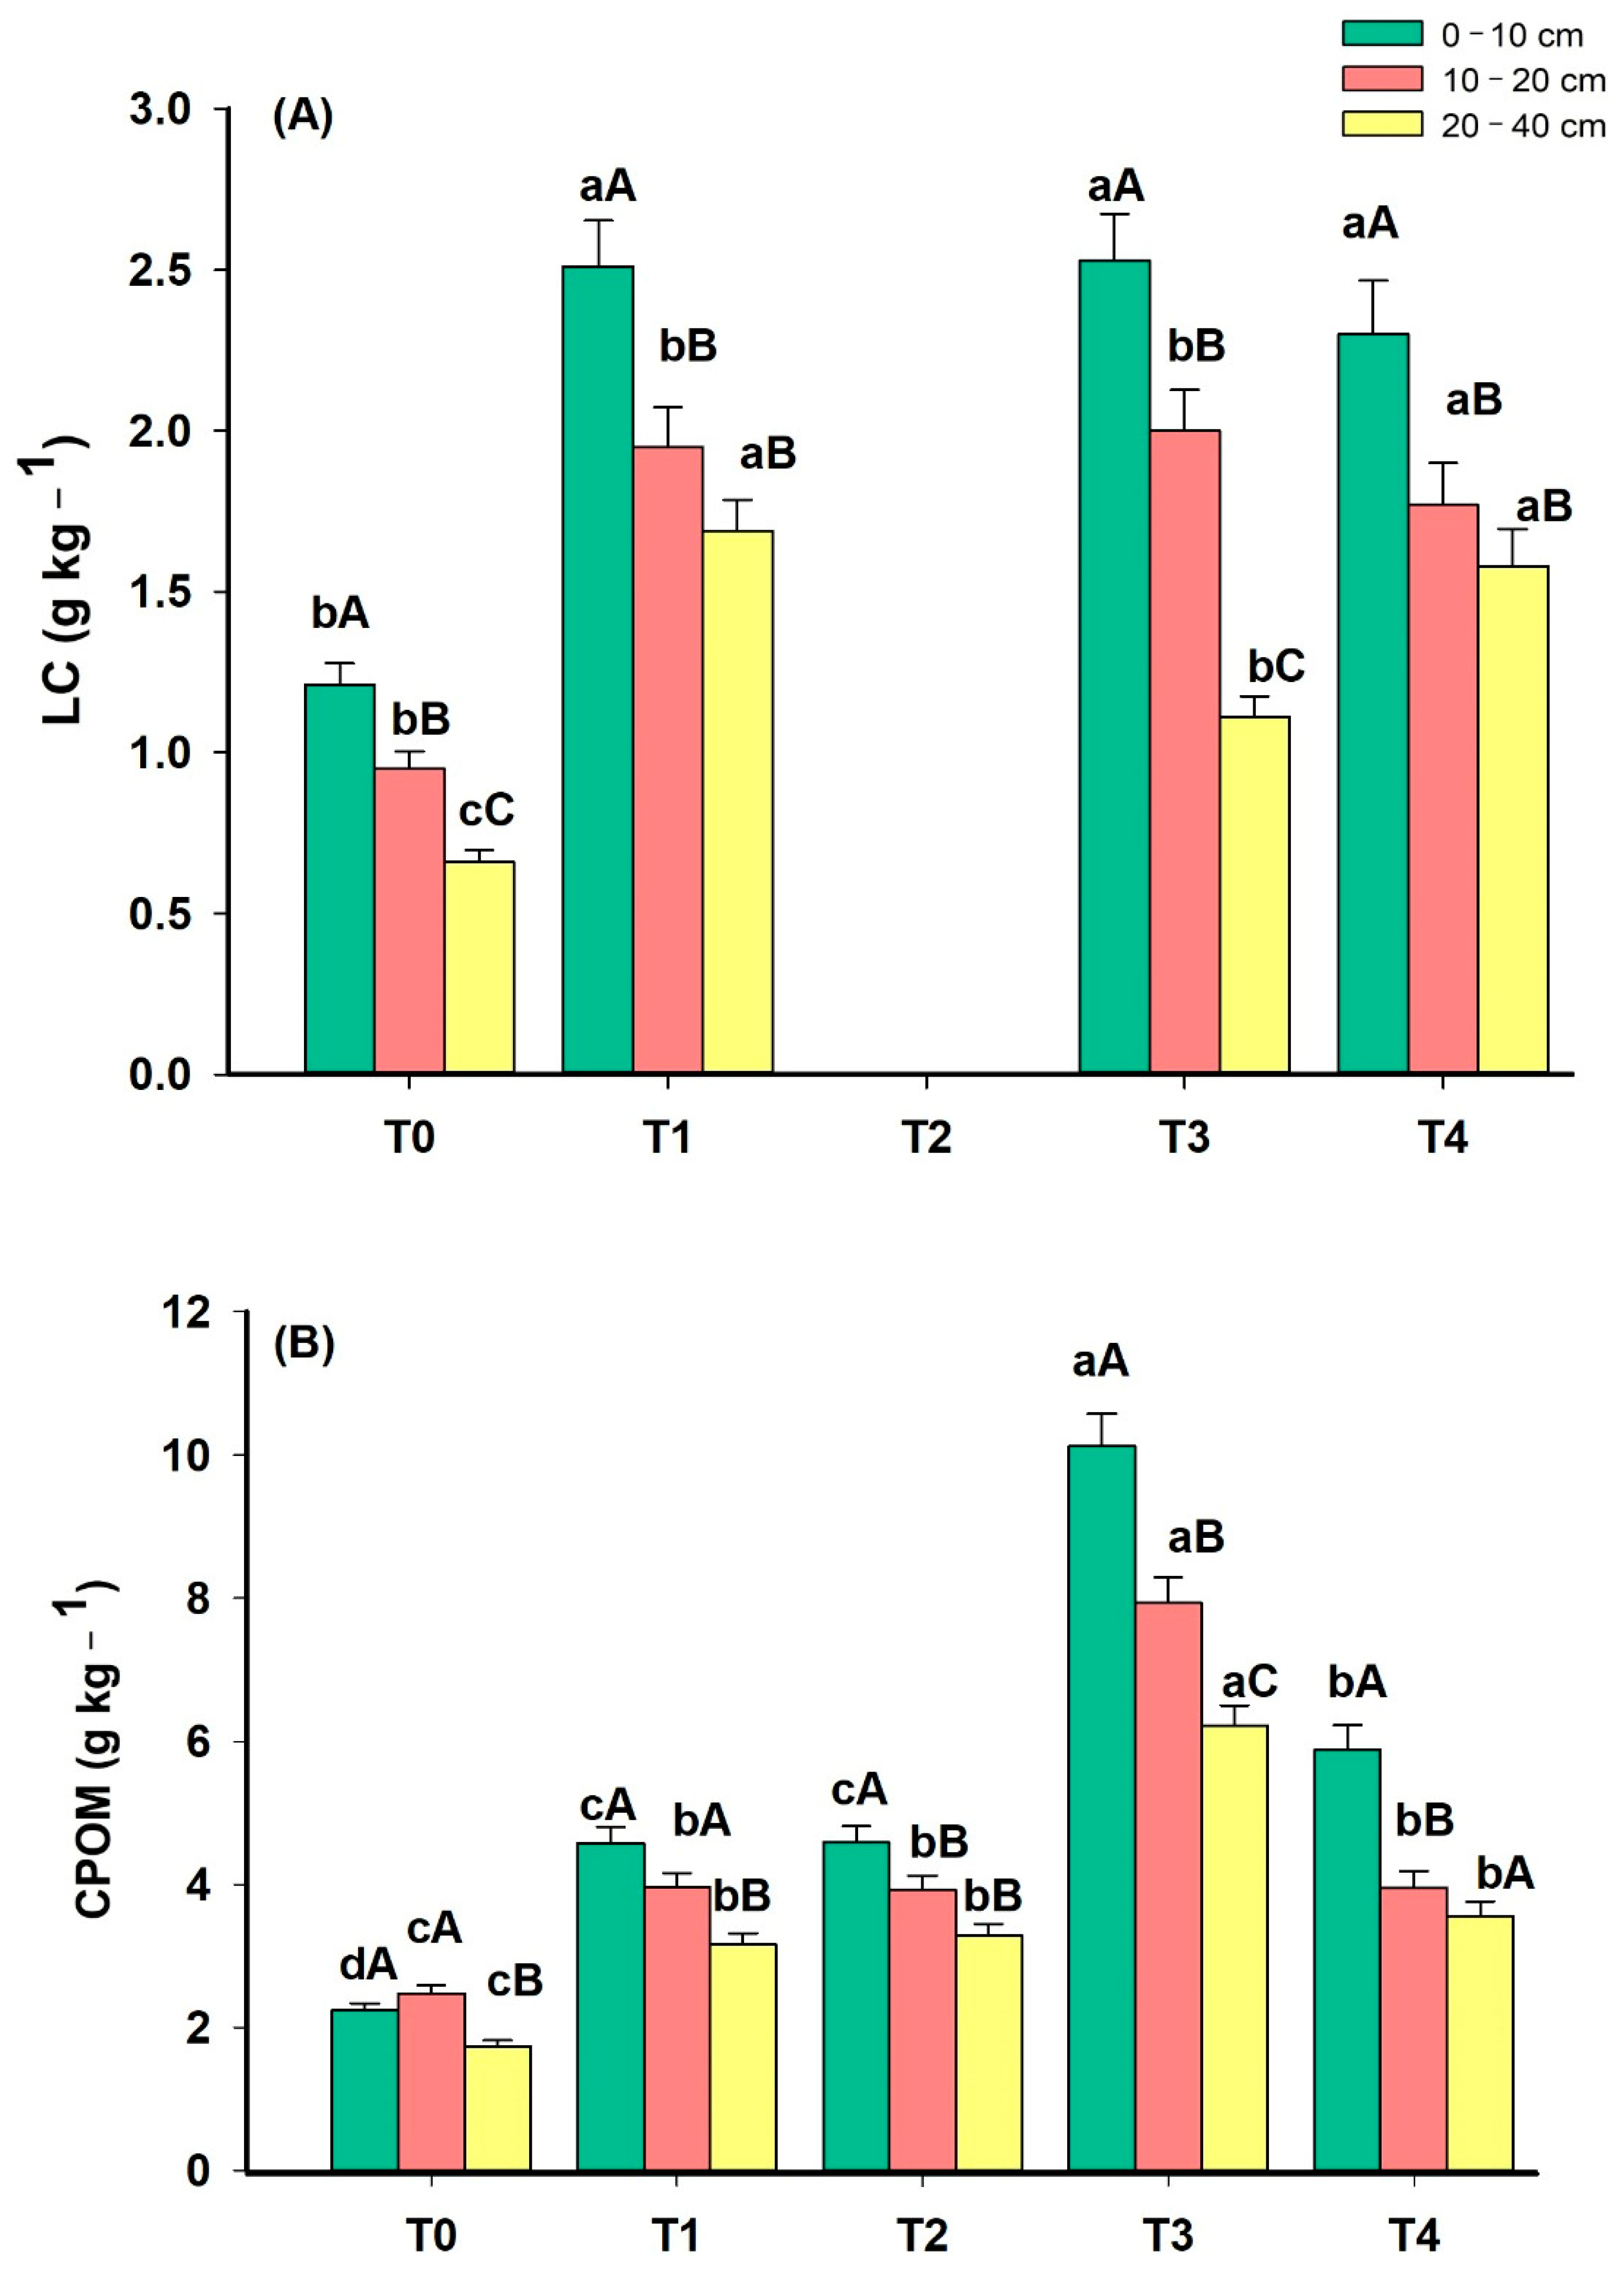
3.2. Labile Fractions of Soil Organic Matter

In general, labile fractions were more sensitive than TC to express differences between soil depths and phases of the agroforestry system (Figure 3). Except for T4, the TC drastically reduced in depth in all phases of the system. The high content of labile fractions of soil organic matter supports the biological activity of the soil and, therefore, the high level of soil fertility [34].
The LC had the following variations: 1.21–2.30 g kg−1, 0.95–2.00 g kg−1 and 0.66–1.69 g kg−1 at depths 0–10 cm, 10–20 and 20–40 cm, respectively (Figure 3A). The LC is considered the most reactive part of SOM, which makes this fraction highly sensitive to changes in the environment, in addition to playing a fundamental role in the soil microbiota and, consequently, in nutrient cycling [35]. LC levels are essential for supplying nutrients to plants through mineralization and providing energy for microbial activity, in addition to promoting the formation of aggregates and protecting SOM [36,37]. The LC increased at all depths in the phases with the greatest number of components in the system, indicating that the components contributed to a greater addition of SOM and greater LC content. Ferreira et al. [38] evaluated system under monoculture and Sorghum bicolorUrochloa ruziziensis intercropping systems and reported increased carbon stock, with the presence of more labile organic fractions with the use of a greater number of crops in the system (Intercropping of S. bicolor and U. ruziziensis). This can be attributed to the greater amount of U. ruziziensis straw since the labile fraction is directly related to the plant material recently added to the soil.
At all depths, CPOM increased from T0 to T3 (Figure 3B). The suppression of corn reduced CPOM levels in T4 compared with T3. Despite this, the CPOM in T4 was still higher than T0 and similar to T1 and T2. These results demonstrate that the removal of a component from the agroforestry system can reduce the entry of the particulate fraction of SOM, which is highly related to the quantity and quality of biomass that enters the system. CPOM consists of one of the labile fractions of organic matter, associated with the sand fraction (>53 μm) and, therefore, not protected by mineral interactions; it is commonly related to the entry of C by agricultural systems, i.e., plant residues [39]. CPOM is also highly sensitive to management practices, and changes in this fraction are generally perceived in the short term [37,40,41].
It is also possible to observe that T3 presented a high CPOM content in all layers but with greater emphasis on the 0–10 cm layer. This fact can be attributed to the maize root system, which contributed to the greater annual addition of plant residues to the soil surface, as CPOM is directly related to the plant material recently added to the soil and which is quickly decomposed by microorganisms. Rossi et al. [41] evaluated the different fractions of SOM in distinct management systems and reported that CPOM is an effective parameter in demonstrating differences in management among systems, presenting higher levels in systems with greater biomass input.
The relatively higher CPOM in the soil in phases 3 and 4 suggests the favorable condition that helps in the building up of an active carbon pool [42]. Following the findings of Ramesh et al. [42], CPOM revealed a decrease with depth; however, the increased concentration of CPOM with the evolution of the system compared to T0 (Pasture characterized as low productivity) indicated that the CPOM pool of carbon is a reflection of the root-derived product. The SOM labile fractions are characterized by easy oxidation and a high decomposition rate [43].
According to Kalambukattu et al. [44], the tannins and lignin constituents formed from the decomposition of leaf litter and the root biomass of trees in agroforestry systems can protect the C from rapid decomposition and thus preserve it in the aggregates. The recently added litter and root biomass favors rapid biological decomposition, leading to less CPOM accumulation.
Higher CPOM values were also found by Nanzer et al. [45] in the surface layer of soil in management systems with Brachiaria brizantha pasture cultivated for 30 years when compared with other systems such as no-tillage, pastures with 3 years, integrated systems with rubber trees and pineapple and planting rubber tree soil. This higher CPOM content was attributed to the greater amount of residues originating from the root system of pasture grasses in the most superficial soil layers.
The sensitivity of the particulate fraction of SOM demonstrates that this fraction can be used as a good indicator of soil quality to evaluate newly implemented management systems, in which changes in CPOM have not yet been of great magnitude.

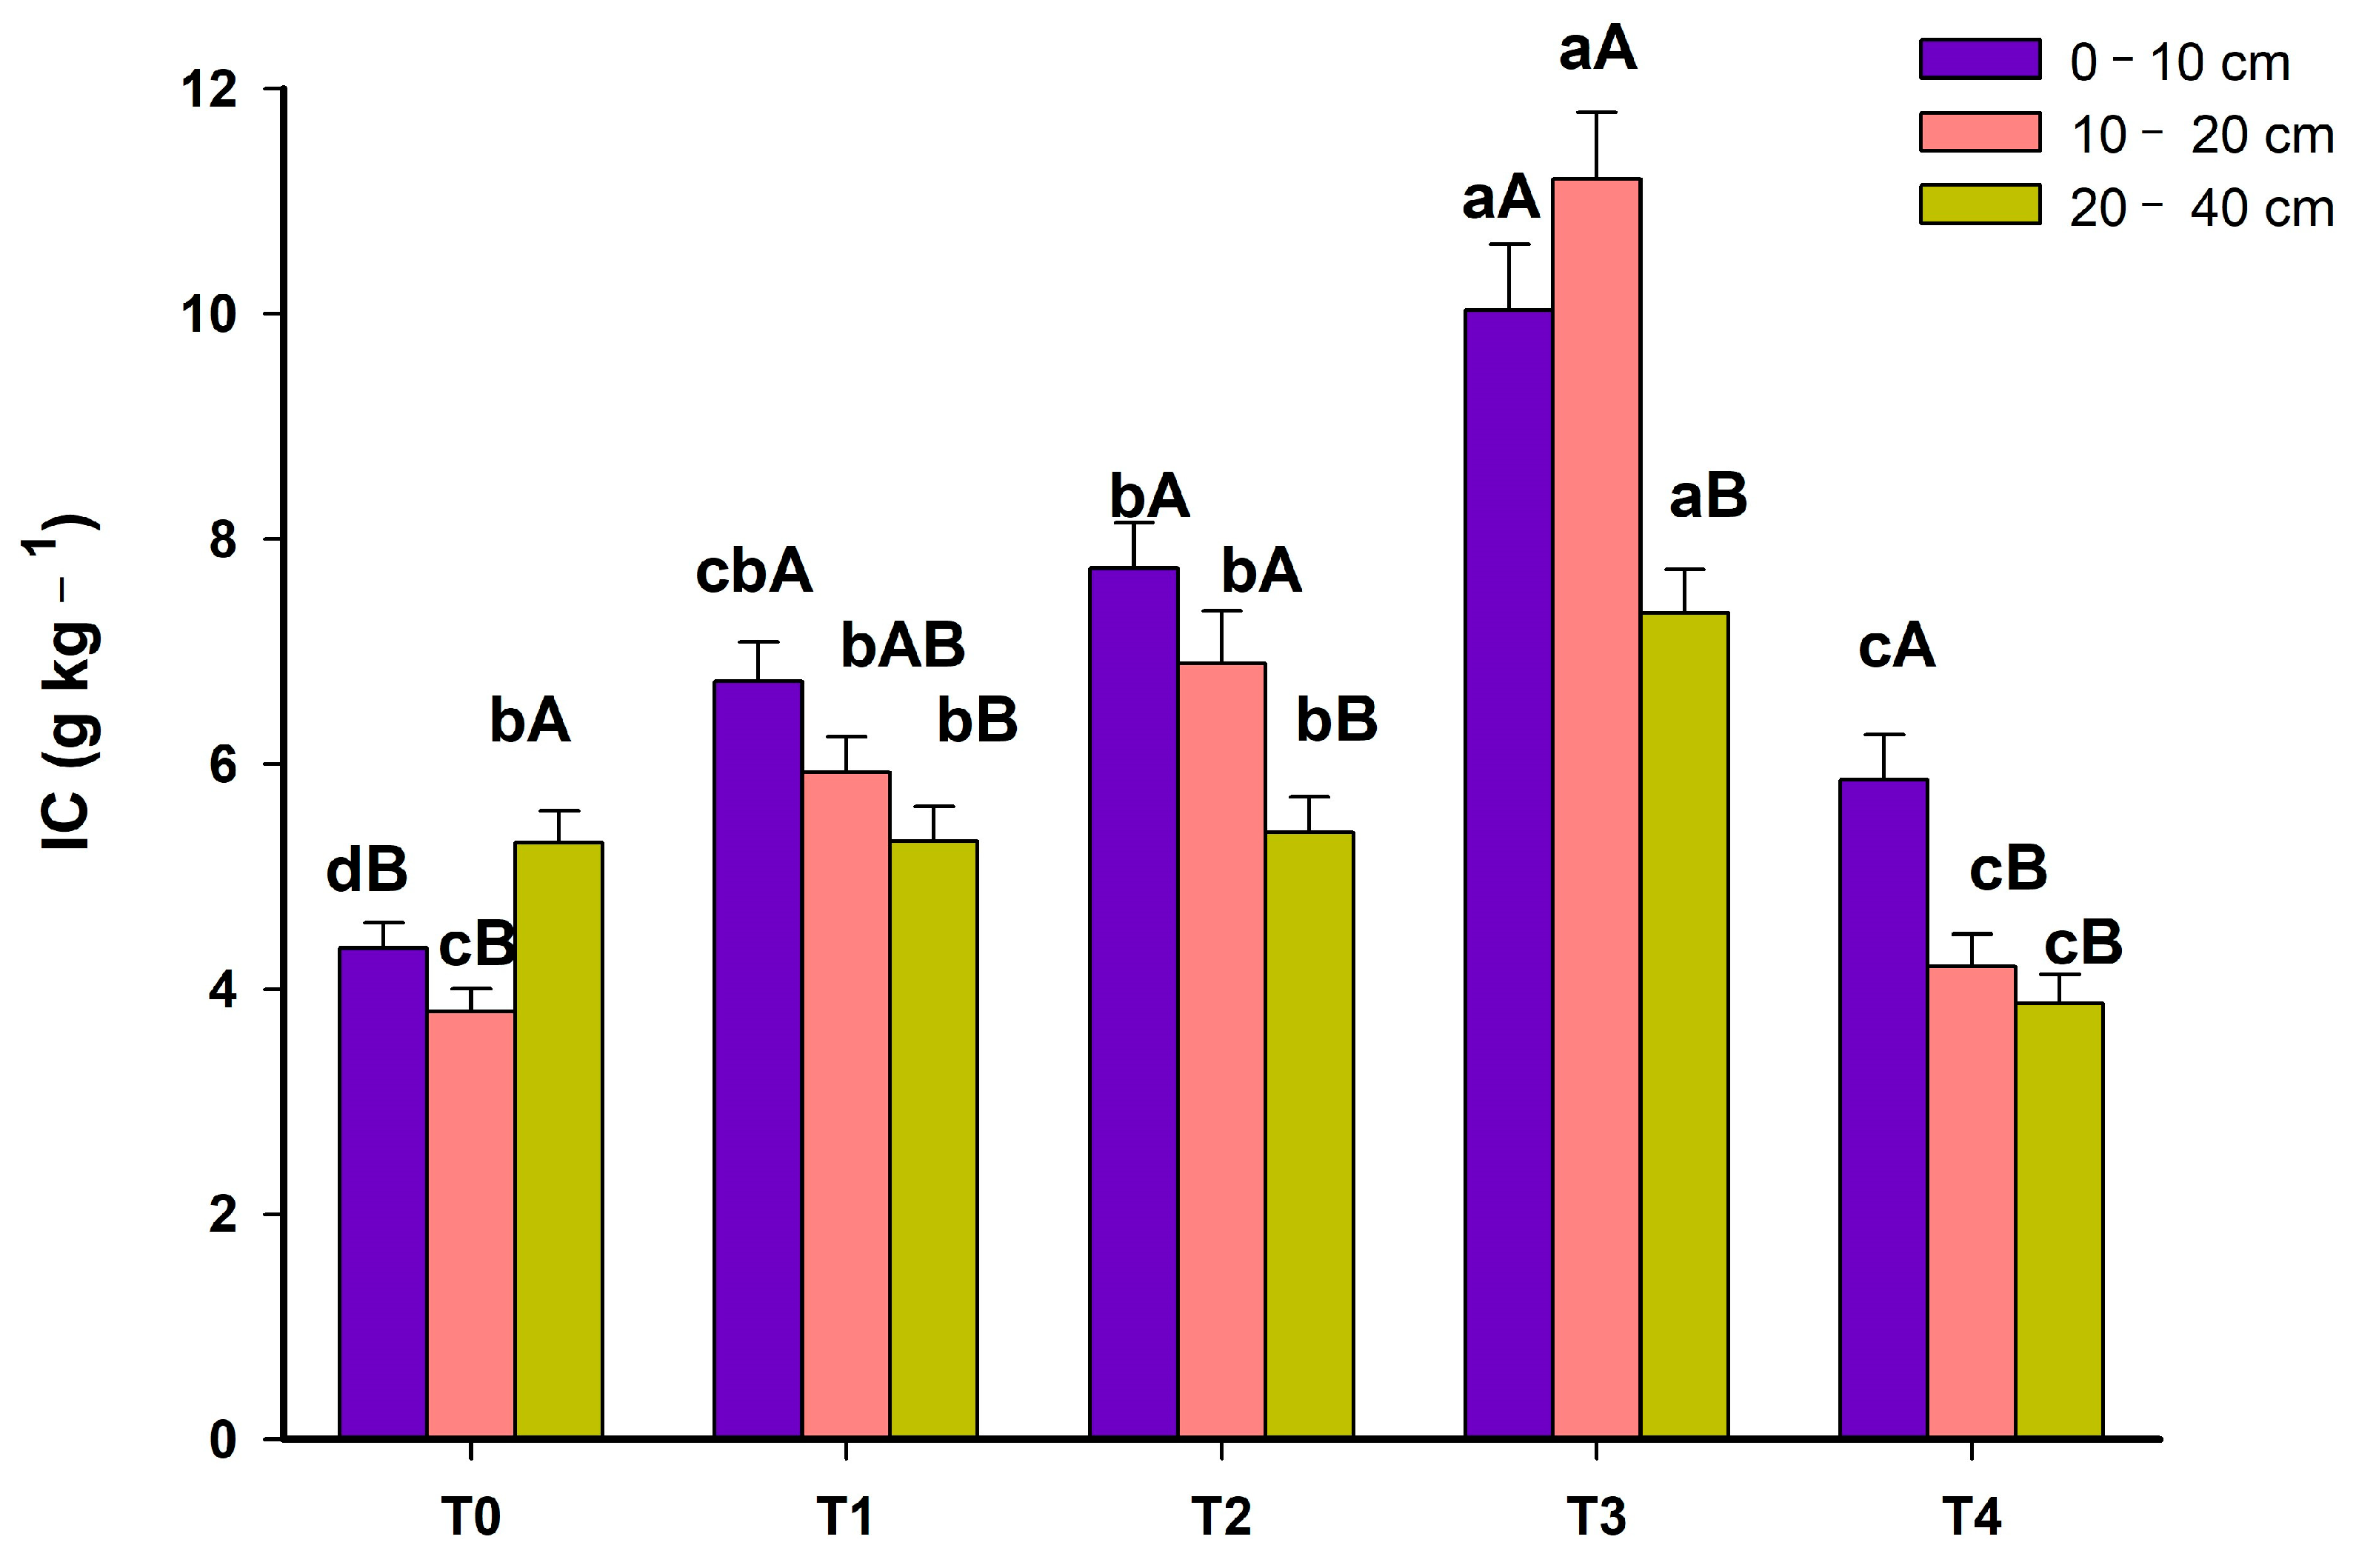
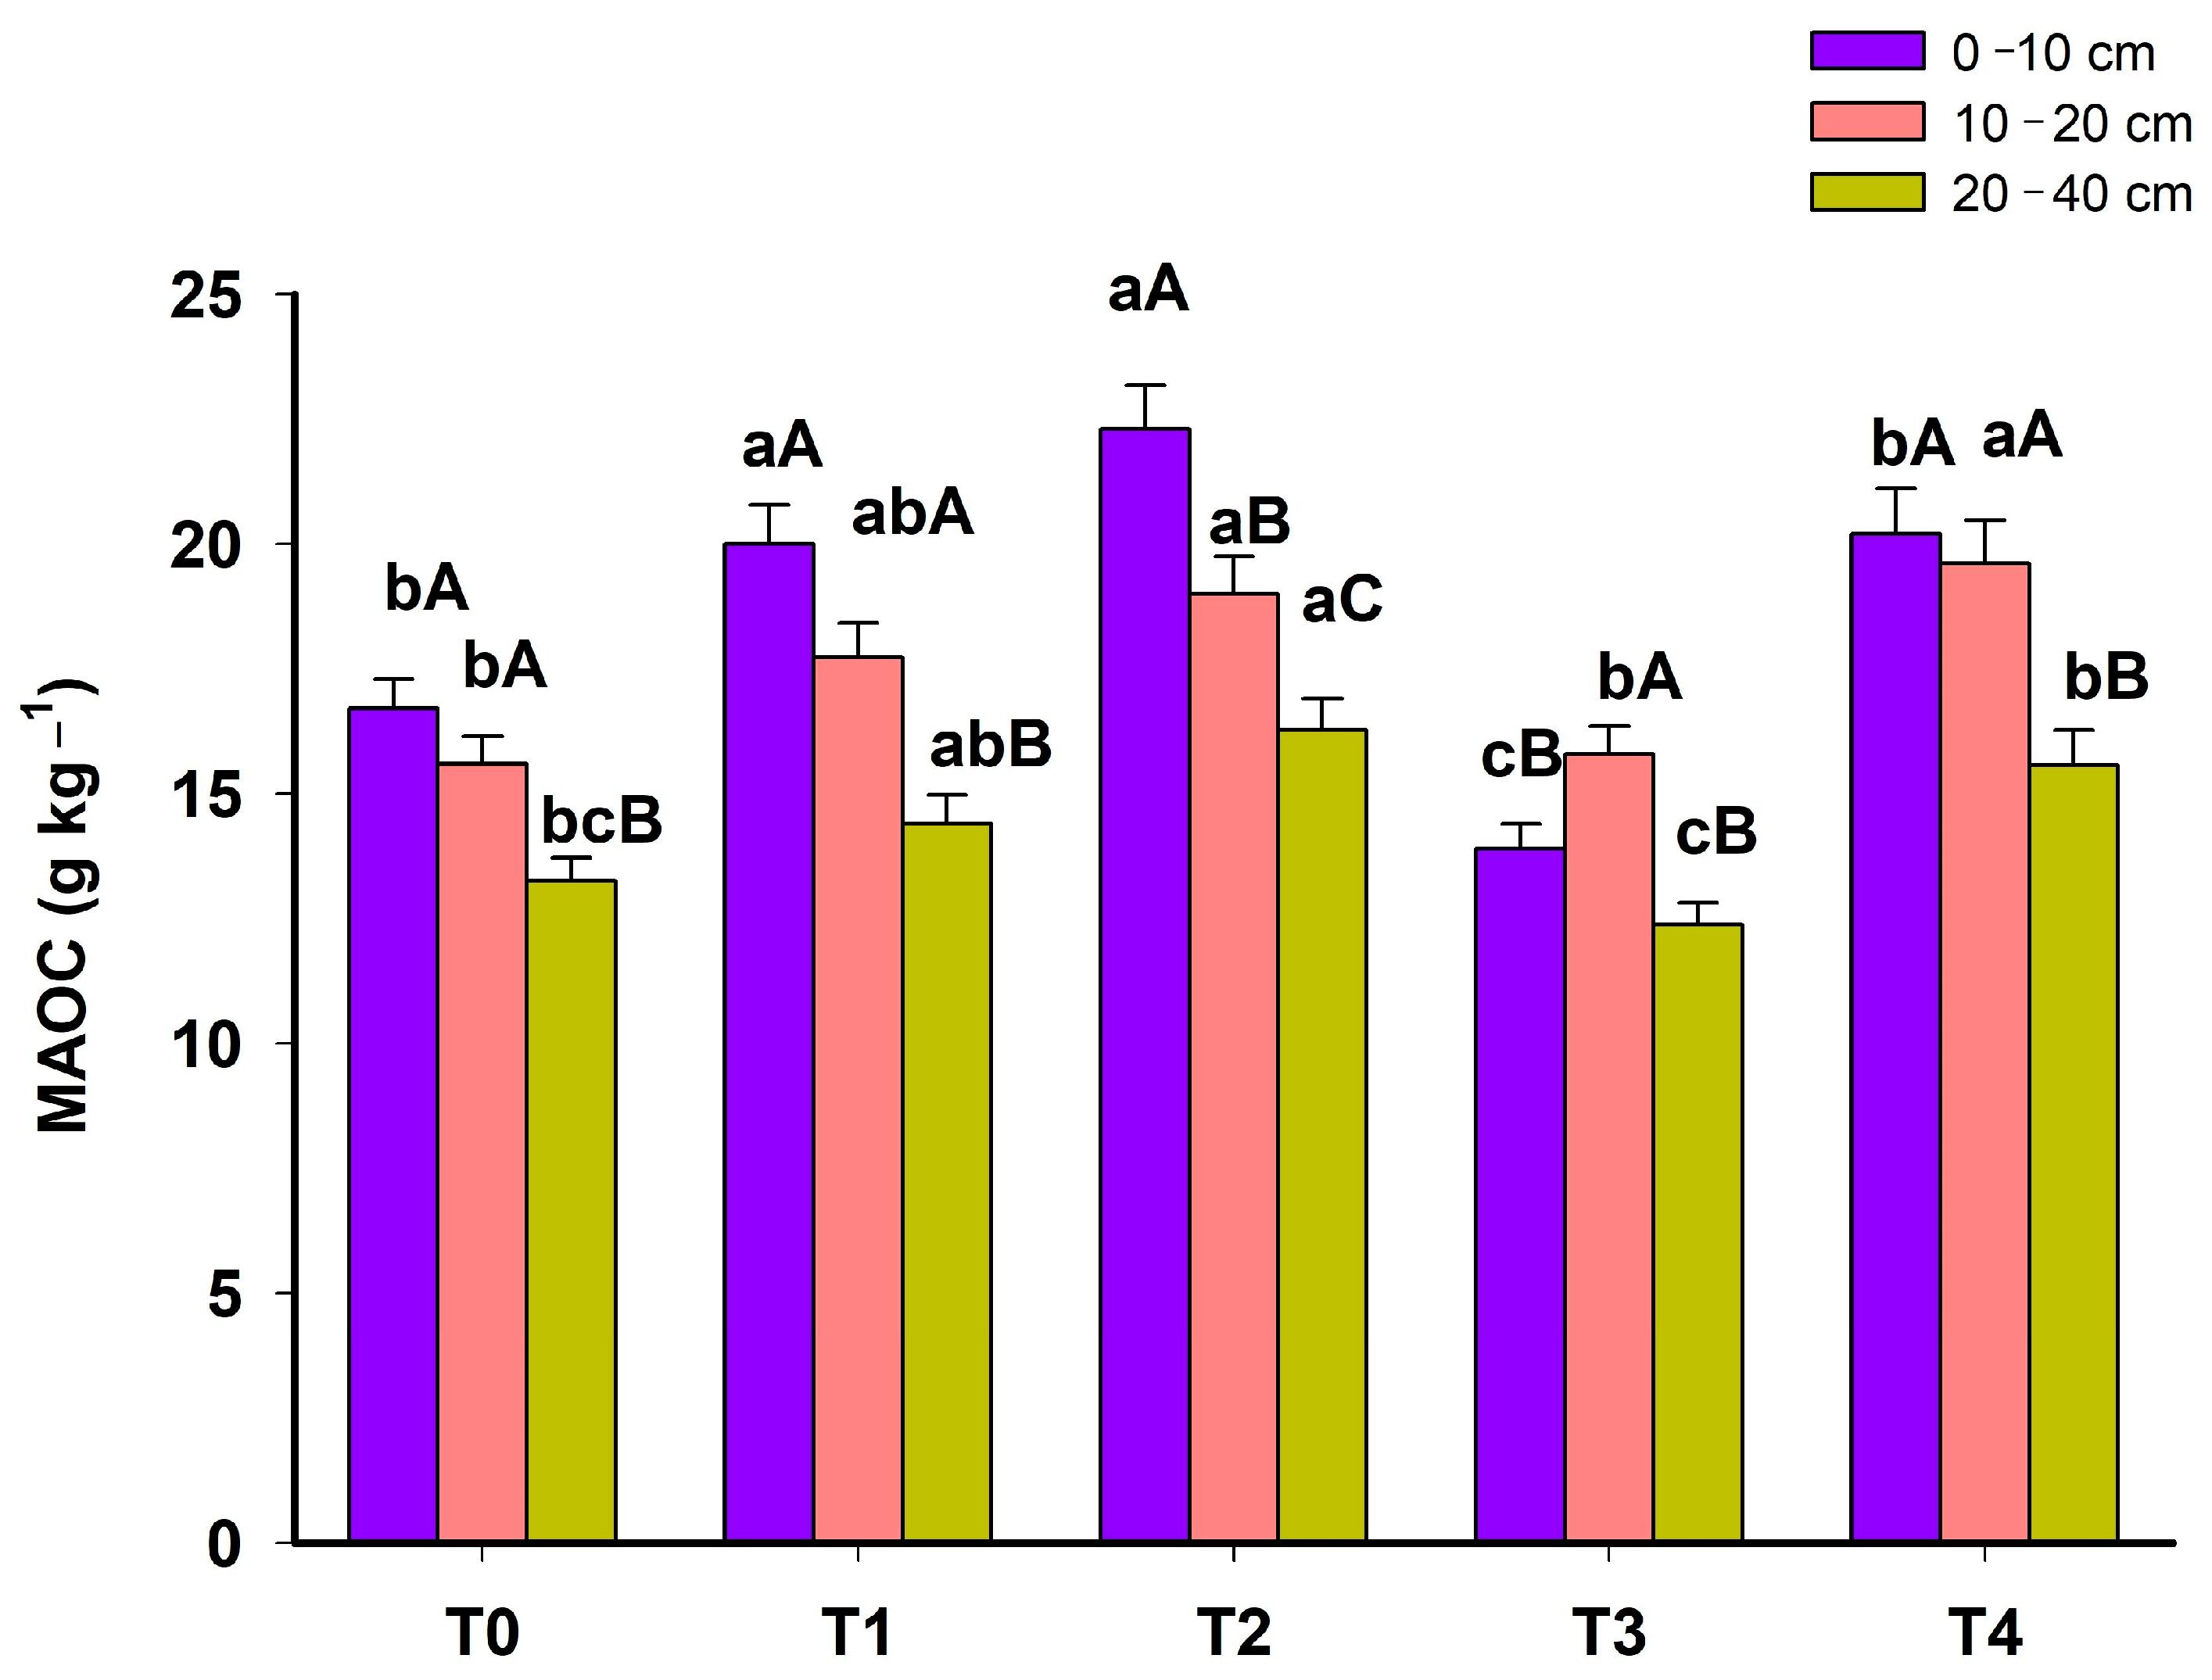
3.3. Non-Labile Fractions of Soil Organic Matter

Surprisingly, IC showed similar behavior to the labile fractions of MOS (Figure 4). The IC increased from the degraded area to T3 when the system had all components. In T4, with the removal of maize, there was a reduction in the IC content. When compared with low productivity pasture (T0), T3 added 5.67 g kg−1, 7.40 g kg−1 and 2.04 g kg−1 of IC in layers 0–10 cm, 10–20 and 20–40 cm, respectively (Figure 4). It is important to highlight that T4 was evaluated in 2023, seven years after T3, therefore without the contribution of C from maize.
The MAOC ranged from 13.90 to 20.20 g kg−1 in the 0–10 cm layer; 15.60 to 22.30 g kg−1 in the 10–20 cm layer and 12.40 to 16.90 g kg−1 in the 20–40 cm layer. When evaluating the MAOC throughout the system phases, it was noted that from T0 to T4, there was an increase over time in the 0–10 cm and 20–40 cm layers (Figure 5).
IC and MAOC are the non-labile fractions of SOM. During the 7-year interval between T3 and T4, the maize component was removed in T3, but there was no soil disturbance. This fact may have contributed to greater stabilization of organic matter in the mineral fraction. MAOC is less sensitive to short-term system management and is considered a fraction with an advanced degree of humification, being mainly composed of humic substances with an important role in stabilizing microaggregates [21,41].
When analyzing the results of CPOM (Figure 3B) and MAOC (Figure 5) in phases T3 and T4, it is observed that the values have opposite behavior. The CPOM was higher in T3 than in the other phases, while in this phase, the MAOC had lower values. In T4, there was a reduction in CPOM and an increase in MAOC. These results indicate that the maize component in T3 was probably contributing to increasing the more labile fractions of SOM. The higher CPOM of T3 is associated with the system’s ability to provide greater addition of residues to the soil surface, with a C/N and lignin/N ratio favorable to mineralization [46].
T4, composed only of the gliricidia and brachiaria components, presented a higher MAOC value, indicating slower MOS cycling with less decomposition and greater stabilization of MOS [47]. Tree roots can promote the formation of aggregates, increase microbiota activity and, consequently, increase soil C stability [48,49]. Furthermore, the grasses represented here by the brachiaria component contribute a large amount of C through the root system, resulting in the stabilization of C by increasing its content in the non-labile carbon [50].

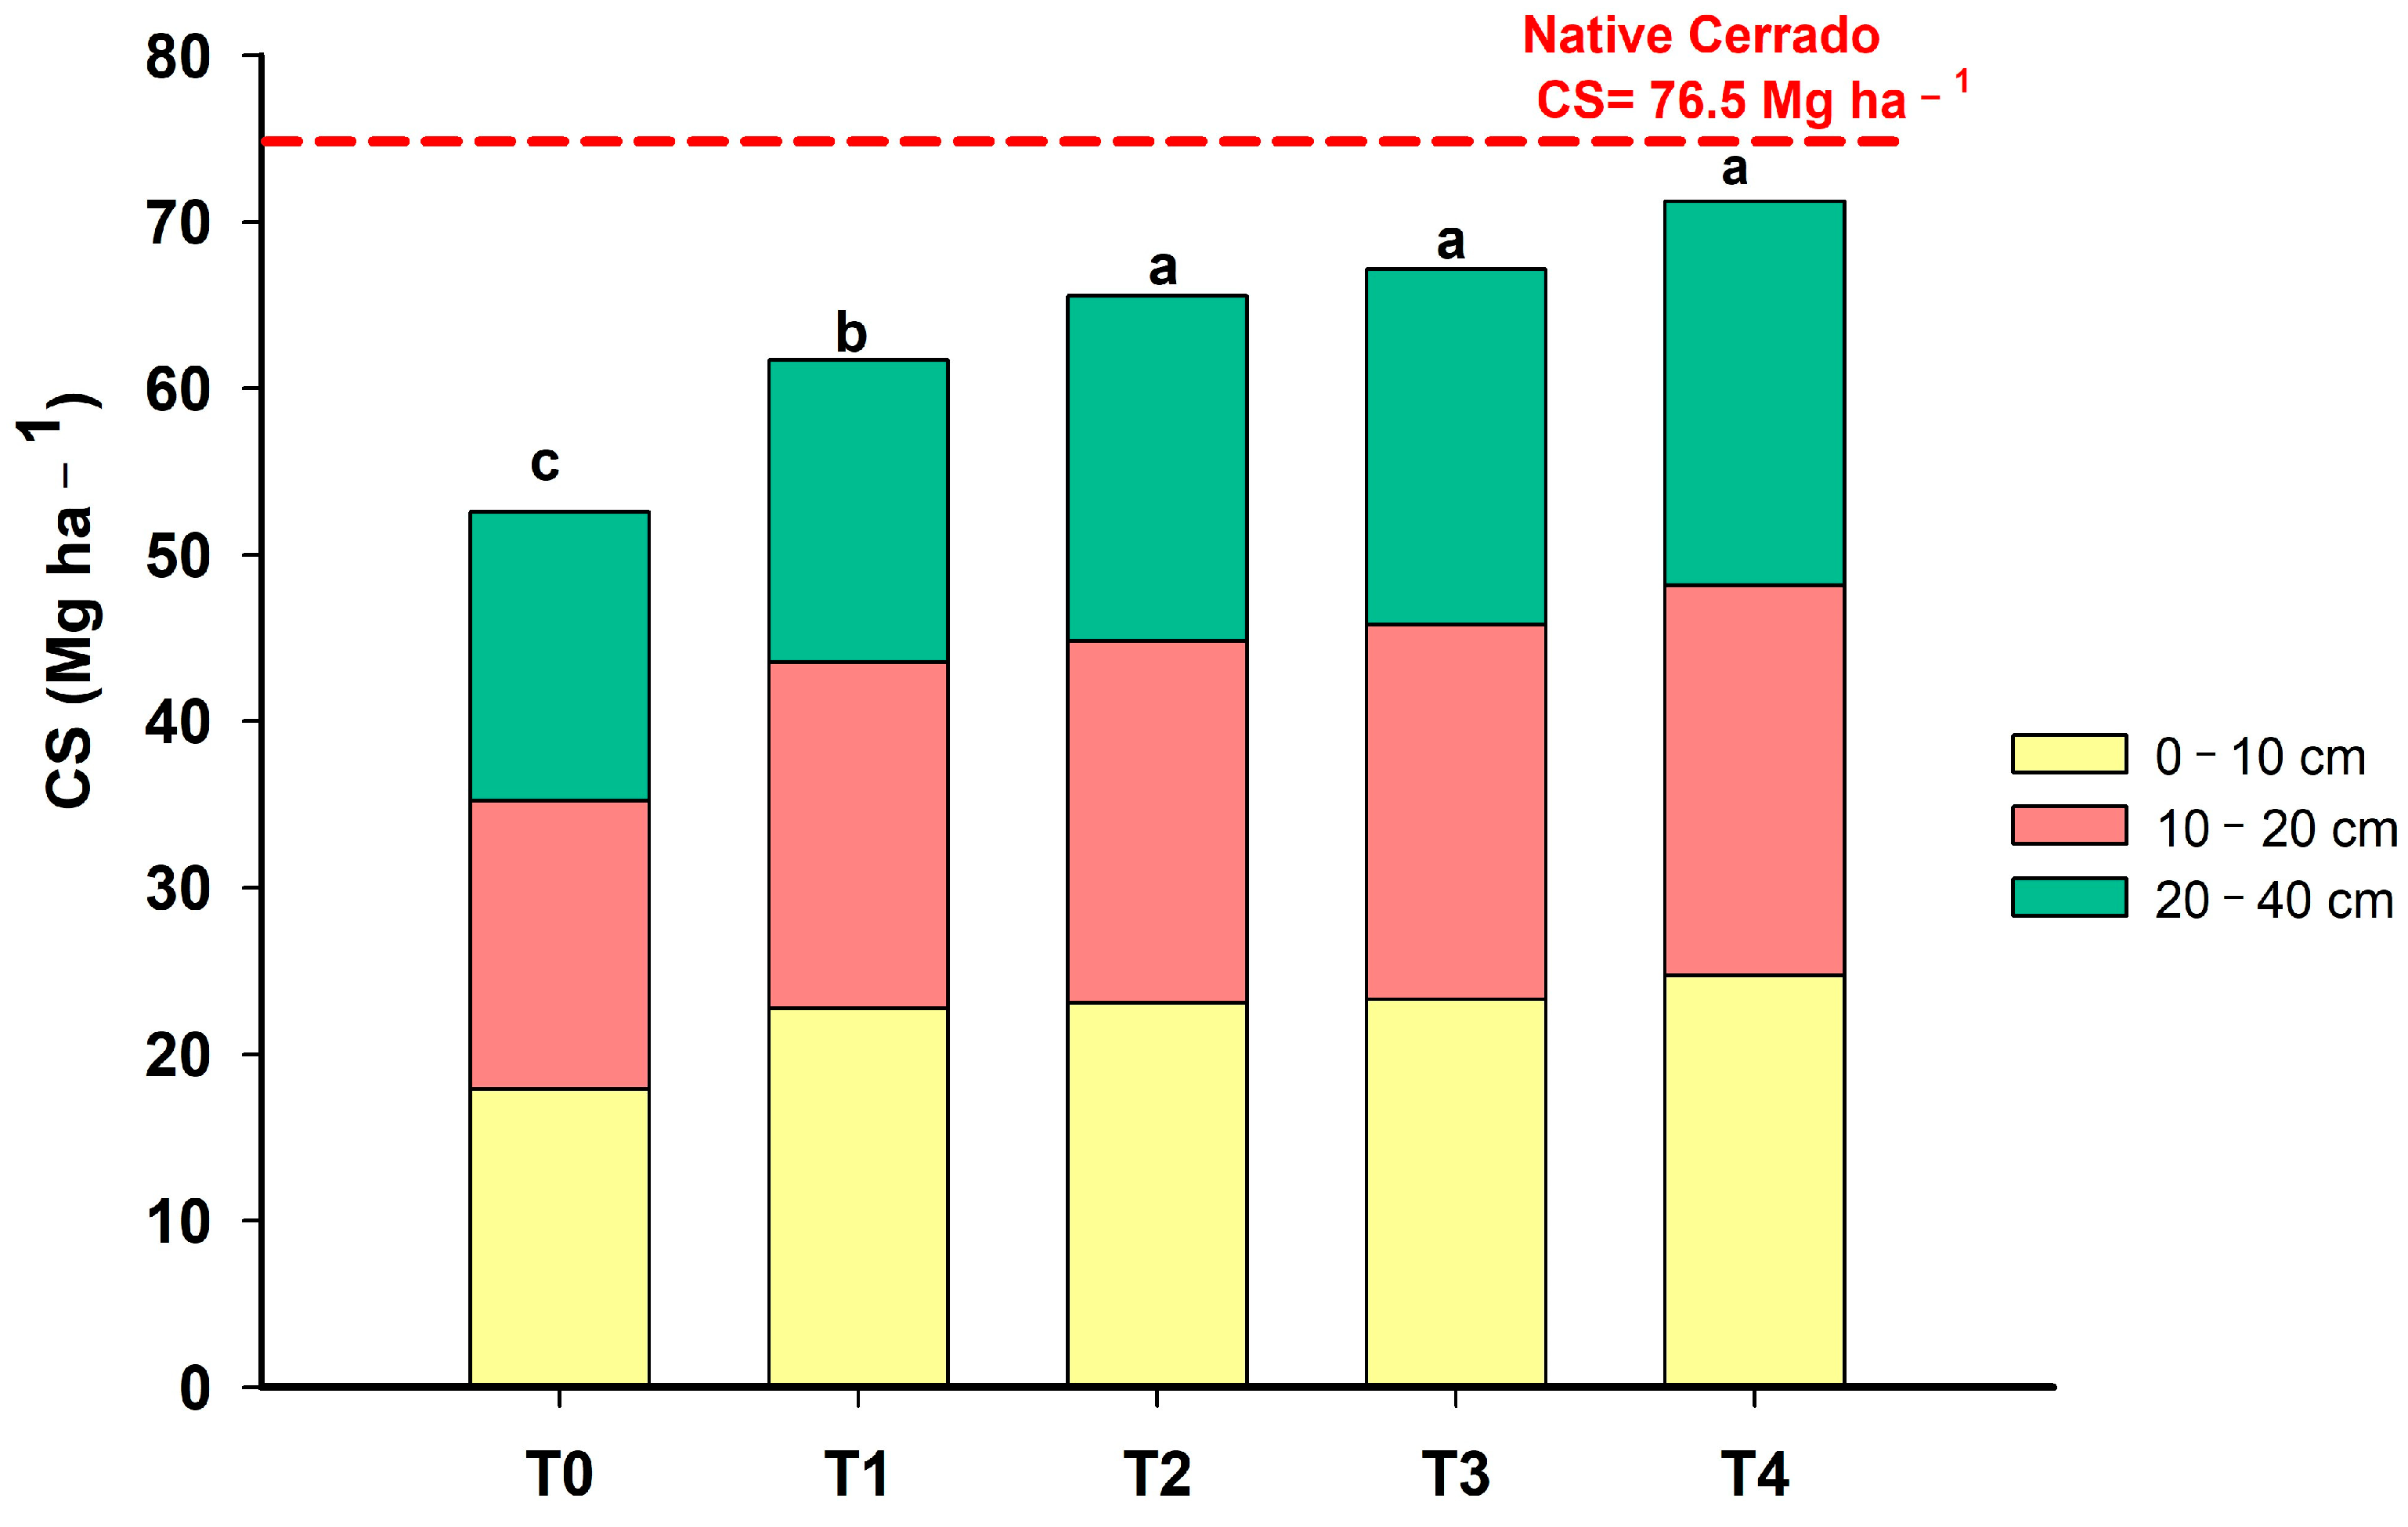
3.4. Soil Carbon Stocks and Balance

It is possible to observe that after 10 years, the balance in the C stock was positive for both the SC and the SOM fractions studied (CPOM, MAOC and LC) (Figure 6). From T0 to T4, the system obtained a gain of 16.57 Mg ha−1, 6.82 Mg ha−1, 9.2 Mg ha−1 and 2.82 Mg ha−1 for SC, CPOM, MAOC and LC, respectively. This positive balance shows the high efficiency of the agroforestry system in sequestering C in the soil.
Before implementing the experiment, the CS of the soil under degraded pasture was 52.54 Mg ha−1, and in T4, it was 68.57 Mg ha−1 (Figure 7). The C gains observed in the present study are higher than those normally promoted by conservation systems without the arboreal component in the Cerrado [51]. It is possible to observe that although there is a tendency for CS to increase at all depths, in T4, there is a greater emphasis on the 20–40 cm soil layer. This result can be attributed to the greater carbon gain from the gliricidia root system in the deeper layers of the soil.
Suárez et al. [29], after comparing the SOC stock in the different soil uses evaluated, found that pastures presented a low accumulation compared with agroforestry systems, which was attributed to the effect of timber tree species that have influenced the contribution of leaf litter [52]. Other studies have also reported that agroforestry systems with Theobroma grandiflorum associated with shade species such as Gliricidia sepium have increased carbon stocks [53,54].
Compared with the native Cerrado, the area under degraded pasture (T0) presented a loss of 23.96 Mg ha−1 of soil C. From T1 onwards, the system had already achieved C gains of 5.76 Mg ha−1 compared with T0. It can be seen that the phase of the experiment that had the greatest increase in C was from T1 to T2, which had a gain of 9.5 Mg ha−1 (Figure 7). At this stage, the system was complete with the three cultivated components (gliricidia, grass and maize). From T2 onwards, stocks remained stable. Interestingly, even with the suppression of the agricultural component, the system still maintained high carbon stocks in the soil over 7 years (from T3 to T4).
Studies carried out by Chen et al. [55] in agroforestry with Hevea brasiliensis showed significantly increased soil organic carbon (SOC) and N contents, enhancing the formation of macroaggregates compared with a rubber monoculture treatment. The authors attributed this result to constant leaf litter fall, and extensive root systems in agroforestry systems improved the C and N accumulation rates. The carbon stock can be influenced by several factors such as the biomass of leaves and roots, the soil density and texture and the litter decomposition in the profile [37]. It was observed that after almost a decade, the system in T4 with 68.57 Mg ha−1 almost recovered the original C stocks from the native Cerrado that had 76.5 Mg ha−1. Freitas et al. [16] demonstrated that the C stock was recovered after 3 years in the conversion of low-productivity pastures into agroforestry systems in the Cerrado region. On the other hand, Vergutz et al. [56] reported that the introduction of the agroforestry system only restored soil C stocks 12 years after the adoption of good management practices.
In addition to the factors already mentioned, this continuous increase in C stock can also be attributed to the specific characteristics of the system components. Studies show that species characteristics and age are factors that influence the carbon balance [57,58]. When comparing soil carbon stocks in stands with two tree species, including an Acacia legume and Eucalyptus, Zhang et al. [12] reported that both age and species showed different results, where the tree legume, Acacia, had greater carbon accumulation in the soil when compared with non-legumes represented by eucalyptus. In addition, they showed a strong correlation between C and nitrogen storage in forestry plantations.
In the present study, the tree component used, gliricidia, is also a legume, which shows that nitrogen-fixing species are efficient in increasing the C stock in the soil, probably because of the characteristics of the species, composition and quantity of litter, nutrient cycling and the speed of the decomposition rate of these materials [12,59]. The fact that the C stock remained high in T4, after 7 years without the corn component, indicates that in addition to the characteristics of the species, the age of the tree component may also have influenced the accumulation of C in the soil since at the time in which it was evaluated (T4), the gliricidia trees were at more advanced ages with high biomass production in both the aerial part and the root system, resulting in a greater amount of litter in the soil.

4. Conclusions

The results of the present study show changes in C stocks and soil organic matter fractions in the successional phases of an agroforestry system. The results confirm the first hypothesis that the agroforestry system promotes an increase in C levels in both labile and non-labile fractions of soil organic matter. Furthermore, it is possible to conclude that labile fractions are more sensitive to demonstrate soil C gains in the different phases of adopting the integrated production system. As a response to the second hypothesis, it is possible to conclude that the suppression of the agricultural component (maize) did not reduce soil C stocks. The results also indicate that after ten years of adoption, the agroforestry system presented a positive balance of total C, with gains of 16 Mg ha−1 of CT in the soil. It is concluded that the adoption of integrated production systems is an excellent alternative to increase C stocks in the soil, reducing the negative impacts of agriculture on climate change. Measurements of CO2 emissions would be essential to better estimate the C balance in an agroforestry system. Therefore, further studies should be carried out to understand the performance of agroforestry systems in the gains and losses of C to the atmosphere.

Author Contributions

Conceptualization, C.C.d.F.; methodology, J.A.d.S., C.C.d.F., A.d.D.d.S., T.R.C. and C.R.C.; formal analysis, J.A.d.S.; data curation, J.A.d.S. and C.C.d.F.; writing—original draft preparation, J.A.d.S.; writing—review and editing, A.S.d.A., G.G.L., J.A.d.S. and C.C.d.F. All authors have read and agreed to the published version of the manuscript.

Funding

This research received no external funding.

Institutional Review Board Statement

Not applicable.

Informed Consent Statement

Not applicable.

Data Availability Statement

The data presented in this study are available upon request from the corresponding author.

Acknowledgments

We acknowledge the Conselho Nacional de Desenvolvimento Científico e Tecnológico (CNPq) for the scientific productivity fellowship granted to the seventh author.

Conflicts of Interest

The authors declare no conflicts of interest.

References

  1. Ribeiro, F.P.; Gatto, A.; de Oliveira, A.D.; Pulrolnik, K.; Valadão, M.B.X.; Araújo, J.B.C.N.; de Carvalho, A.M.; Ferreira, E.A.B. Carbon Storage in Different Compartments in Eucalyptus Stands and Native Cerrado Vegetation. Plants 2023, 12, 2751. [Google Scholar] [CrossRef] [PubMed]
  2. Briedis, C.; de Moraes Sá, J.C.; Lal, R.; Tivet, F.; Franchini, J.C.; de Oliveira Ferreira, A.; da Cruz Hartman, D.; Schimiguel, R.; Bressan, P.T.; Inagaki, T.M.; et al. How Does No-till Deliver Carbon Stabilization and Saturation in Highly Weathered Soils? Catena 2018, 163, 13–23. [Google Scholar] [CrossRef]
  3. Costa, A.A.; Dias, B.d.O.; Fraga, V.d.S.; Santana, C.C.; da Silva, N. Carbon and Nitrogen Stocks in Soils under Different Forms of Use in the Cerrado. Rev. Bras. Eng. Agrícola Ambient. 2020, 24, 528–533. [Google Scholar] [CrossRef]
  4. Pereira, O.; Ferreira, L.; Pinto, F.; Baumgarten, L. Assessing Pasture Degradation in the Brazilian Cerrado Based on the Analysis of MODIS NDVI Time-Series. Remote Sens. 2018, 10, 1761. [Google Scholar] [CrossRef]
  5. Silva, T.R.; Rodrigues, S.B.; de Azevedo Bringel, J.B.; Sampaio, A.B.; Sano, E.E.; Vieira, D.L.M. Factors Affecting Savanna and Forest Regeneration in Pastures across the Cerrado. J. Environ. Manag. 2023, 330, 117185. [Google Scholar] [CrossRef] [PubMed]
  6. Kumar, S.; Bijalwan, A.; Singh, B.; Rawat, D.; Yewale, A.G.; Riyal, M.K.; Thakur, T.K. Comparison of Carbon Sequestration Potential of Quercus Leucotrichophora–Based Agroforestry Systems and Natural Forest in Central Himalaya, India. Water Air Soil Pollut. 2021, 232, 350. [Google Scholar] [CrossRef]
  7. Coser, T.R.; de Figueiredo, C.C.; Jovanovic, B.; Moreira, T.N.; Leite, G.G.; Cabral Filho, S.L.S.; Kato, E.; Malaquias, J.V.; Marchão, R.L. Short-Term Buildup of Carbon from a Low-Productivity Pastureland to an Agrisilviculture System in the Brazilian Savannah. Agric. Syst. 2018, 166, 184–195. [Google Scholar] [CrossRef]
  8. Ghale, B.; Mitra, E.; Sodhi, H.S.; Verma, A.K.; Kumar, S. Carbon Sequestration Potential of Agroforestry Systems and Its Potential in Climate Change Mitigation. Water Air Soil Pollut. 2022, 233, 228. [Google Scholar] [CrossRef]
  9. Yadav, G.S.; Kandpal, B.K.; Das, A.; Babu, S.; Mohapatra, K.P.; Devi, A.G.; Devi, H.L.; Chandra, P.; Singh, R.; Barman, K.K. Impact of 28 Year Old Agroforestry Systems on Soil Carbon Dynamics in Eastern Himalayas. J. Environ. Manag. 2021, 283, 111978. [Google Scholar] [CrossRef]
  10. de Oliveira, W.R.D.; Ramos, M.L.G.; de Carvalho, A.M.; Coser, T.R.; Silva, A.M.M.; Lacerda, M.M.; Souza, K.W.; Marchão, R.L.; Vilela, L.; Pulrolnik, K. Dynamics of Soil Microbiological Attributes under Integrated Production Systems, Continuous Pasture, and Native Cerrado. Pesqui. Agropecuária Bras. 2016, 51, 1501–1510. [Google Scholar] [CrossRef]
  11. de Souza Almeida, L.L.; Frazão, L.A.; Lessa, T.A.M.; Fernandes, L.A.; de Carvalho Veloso, Á.L.; Lana, A.M.Q.; de Souza, I.A.; Pegoraro, R.F.; Ferreira, E.A. Soil Carbon and Nitrogen Stocks and the Quality of Soil Organic Matter under Silvopastoral Systems in the Brazilian Cerrado. Soil Tillage Res. 2021, 205, 104785. [Google Scholar] [CrossRef]
  12. Zhang, H.; Duan, H.B.; Song, M.W.; Guan, D.S. The Dynamics of Carbon Accumulation in Eucalyptus and Acacia Plantations in the Pearl River Delta Region. Ann. For. Sci. 2018, 75, 40. [Google Scholar] [CrossRef]
  13. Minasny, B.; McBratney, A.B.; Malone, B.P.; Wheeler, I. Digital Mapping of Soil Carbon. In Advances in Agronomy; Academic Press: Cambridge, MA, USA, 2013; pp. 1–47. [Google Scholar]
  14. Gomes, L.C.; Faria, R.M.; de Souza, E.; Veloso, G.V.; Schaefer, C.E.G.R.; Filho, E.I.F. Modelling and Mapping Soil Organic Carbon Stocks in Brazil. Geoderma 2019, 340, 337–350. [Google Scholar] [CrossRef]
  15. Lim, S.S.; Baah-Acheamfour, M.; Choi, W.J.; Arshad, M.A.; Fatemi, F.; Banerjee, S.; Carlyle, C.N.; Bork, E.W.; Park, H.J.; Chang, S.X. Soil Organic Carbon Stocks in Three Canadian Agroforestry Systems: From Surface Organic to Deeper Mineral Soils. For. Ecol. Manag. 2018, 417, 103–109. [Google Scholar] [CrossRef]
  16. de Freitas, I.C.; Ribeiro, J.M.; Araújo, N.C.A.; Santos, M.V.; Sampaio, R.A.; Fernandes, L.A.; Azevedo, A.M.; Feigl, B.J.; Cerri, C.E.P.; Frazão, L.A. Agrosilvopastoral Systems and Well-Managed Pastures Increase Soil Carbon Stocks in the Brazilian Cerrado. Rangel. Ecol. Manag. 2020, 73, 776–785. [Google Scholar] [CrossRef]
  17. Alvares, C.A.; Stape, J.L.; Sentelhas, P.C.; de Moraes Gonçalves, J.L.; Sparovek, G. Köppen’s Climate Classification Map for Brazil. Meteorol. Z. 2013, 22, 711–728. [Google Scholar] [CrossRef] [PubMed]
  18. Santos, H.G.; Jacomine, P.K.T.; Anjos, L.H.C.; Oliveira, V.A.; Lumbreras, J.F.L.; Coelho, M.R.; Almeida, J.A.; Araújo Filho, J.C.; Oliveira, J.B.; Cunha, T. Brazilian System of Soil Classification, 5th ed.; Embrapa: Brasília, Brazil, 2018; Available online: https://www.redeilpf.org.br/arquivos/SiBCS-2018-ISBN-9788570358219-english.pdf (accessed on 2 February 2024).
  19. IUSS Working Group WRB. World Reference Base for Soil Resources. In World Soil Resources Report 103; FAO: Rome, Italy, 2006. [Google Scholar]
  20. de Sousa, D.M.G.; Lobato, E. Cerrado Correção do Solo e Adubação, 2nd ed.; Embrapa: Brasília, Brazil, 2004. [Google Scholar]
  21. Cambardella, C.A.; Elliott, E.T. Participate Soil Organic-Matter Changes across a Grassland Cultivation Sequence. Soil Sci. 1992, 56, 777–783. [Google Scholar] [CrossRef]
  22. Jackson, M.L. Soil Chemical Analysis; Prentice Hall: Englewood Cliffs, NJ, USA, 1958. [Google Scholar]
  23. Jantalia, C.P.; Resck, D.V.S.; Alves, B.J.R.; Zotarelli, L.; Urquiaga, S.; Boddey, R.M. Tillage Effect on C Stocks of a Clayey Oxisol under a Soybean-Based Crop Rotation in the Brazilian Cerrado Region. Soil Tillage Res. 2007, 95, 97–109. [Google Scholar] [CrossRef]
  24. Shang, C.; Tiessen, H. Organic matter lability in a tropical oxisol: Evidence from shifting cultivation, chemical oxidation, particle size, density, and magnetic fractionations. Soil Sci. 1997, 162, 795–805. [Google Scholar] [CrossRef]
  25. Teixeira, P.C.; Donagemma, G.K.; Fontana, A.; Teixeira, W.G. Manual de Métodos de Análise de Solo, 3rd ed.; Embrapa: Brasília, Brazil, 2017. [Google Scholar]
  26. Ottoy, S.; Van Meerbeek, K.; Sindayihebura, A.; Hermy, M.; Van Orshoven, J. Assessing Top- and Subsoil Organic Carbon Stocks of Low-Input High-Diversity Systems Using Soil and Vegetation Characteristics. Sci. Total Environ. 2017, 589, 153–164. [Google Scholar] [CrossRef]
  27. Crespo, C.M.G.; Piscoya, V.C.; Filho, R.N.d.A.; Lima, S.B.; Moraes, A.S.; de França, M.V.; Fernandes, M.M.; Filho, M.C.; Filho, R.R.G.; Cavalcante, N.L.d.L.; et al. Soil Carbon Stocks and Labile Fractions of Organic Matter under Agroforestry System in Breast of Pernambucan Altitude. Cienc. Florest. 2022, 32, 2180–2198. [Google Scholar] [CrossRef]
  28. Guillemot, J.; le Maire, G.; Munishamappa, M.; Charbonnier, F.; Vaast, P. Native Coffee Agroforestry in the Western Ghats of India Maintains Higher Carbon Storage and Tree Diversity Compared to Exotic Agroforestry. Agric. Ecosyst. Environ. 2018, 265, 461–469. [Google Scholar] [CrossRef]
  29. Suárez, J.C.; Segura, M.; Andrade, H.J. Agroforestry Systems Affect Soil Organic Carbon Stocks and Fractions in Deforested Landscapes of Amazonia. Agrofor. Syst. 2024, 1–13. [Google Scholar] [CrossRef]
  30. Maier, R.; Schack-Kirchner, H.; Nyoka, B.I.; Lang, F. Gliricidia Intercropping Supports Soil Organic Matter Stabilization at Makoka Research Station, Malawi. Geoderma Reg. 2023, 35, e00730. [Google Scholar] [CrossRef]
  31. Beedy, T.L.; Snapp, S.S.; Akinnifesi, F.K.; Sileshi, G.W. Impact of Gliricidia Sepium Intercropping on Soil Organic Matter Fractions in a Maize-Based Cropping System. Agric. Ecosyst. Environ. 2010, 138, 139–146. [Google Scholar] [CrossRef]
  32. Marçal, M.F.M.; de Souza, Z.M.; Tavares, R.L.M.; Farhate, C.V.V.; Júnior, R.E.M.; Lima, E.d.S.; Lovera, L.H. Potential Use of Quartzipisamment under Agroforestry and Silvopastoral System for Large-Scale Production in Brazil. Agronomy 2022, 12, 905. [Google Scholar] [CrossRef]
  33. Sarto, M.V.M.; Borges, W.L.B.; Sarto, J.R.W.; Rice, C.W.; Rosolem, C.A. Deep Soil Carbon Stock, Origin, and Root Interaction in a Tropical Integrated Crop–Livestock System. Agrofor. Syst. 2020, 94, 1865–1877. [Google Scholar] [CrossRef]
  34. Kopecký, M.; Peterka, J.; Kolář, L.; Konvalina, P.; Maroušek, J.; Váchalová, R.; Herout, M.; Strunecký, O.; Batt, J.; Tran, D.K. Influence of Selected Maize Cultivation Technologies on Changes in the Labile Fraction of Soil Organic Matter Sandy-Loam Cambisol Soil Structure. Soil Tillage Res. 2021, 207, 104865. [Google Scholar] [CrossRef]
  35. Cui, L.; Sun, H.; Du, X.; Feng, W.; Wang, Y.; Zhang, J.; Jiang, J. Dynamics of Labile Soil Organic Carbon during the Development of Mangrove and Salt Marsh Ecosystems. Ecol. Indic. 2021, 129, 107875. [Google Scholar] [CrossRef]
  36. Francisco da Silva, E.; Pinheiro Reis Lourente, E.; Estevão Marchetti, M.; Martins Mercante, F.; Karolina Teixeira Ferreira, A.; Carneiro Fujii, G. Frações Lábeis e Recalcitrantes Da Matéria Orgânica Solos Sob Integração Lavoura-pecuária. Pesqui. Agropecuária Bras. 2011, 46, 1321–1331. [Google Scholar] [CrossRef]
  37. Sato, J.H.; de Figueiredo, C.C.; Marchão, R.L.; de Oliveira, A.D.; Vilela, L.; Delvico, F.M.; Alves, B.J.R.; de Carvalho, A.M. Understanding the Relations between Soil Organic Matter Fractions and N2O Emissions in a Long-Term Integrated Crop–Livestock System. Eur. J. Soil Sci. 2019, 70, 1183–1196. [Google Scholar] [CrossRef]
  38. Ferreira, R.V.; Tavares, R.L.M.; de Medeiros, S.F.; da Silva, A.G.; Júnior, J.F.d.S. Carbon Stock and Organic Fractions in Soil under Monoculture and Sorghum Bicolor–Urochloa Ruziziensis Intercropping Systems. Bragantia 2020, 79, 425–433. [Google Scholar] [CrossRef]
  39. Culman, S.W.; Snapp, S.S.; Freeman, M.A.; Schipanski, M.E.; Beniston, J.; Lal, R.; Drinkwater, L.E.; Franzluebbers, A.J.; Glover, J.D.; Grandy, A.S.; et al. Permanganate Oxidizable Carbon Reflects a Processed Soil Fraction That Is Sensitive to Management. Soil Sci. Soc. Am. J. 2012, 76, 494–504. [Google Scholar] [CrossRef]
  40. Witzgall, K.; Vidal, A.; Schubert, D.I.; Höschen, C.; Schweizer, S.A.; Buegger, F.; Pouteau, V.; Chenu, C.; Mueller, C.W. Particulate Organic Matter as a Functional Soil Component for Persistent Soil Organic Carbon. Nat. Commun. 2021, 12, 4115. [Google Scholar] [CrossRef] [PubMed]
  41. Rossi, C.Q.; Pereira, M.G.; Guimarães Giácomo, S.; Betta, M.; Polidoro, J.C. Labile Fractions of Organic Matter in Cropping System with Straw of Brachiaria and Sorghum. Rev. Cienc. Agron. 2012, 43, 38–46. [Google Scholar]
  42. Ramesh, T.; Manjaiah, K.M.; Mohopatra, K.P.; Rajasekar, K.; Ngachan, S.V. Assessment of Soil Organic Carbon Stocks and Fractions under Different Agroforestry Systems in Subtropical Hill Agroecosystems of North-East India. Agrofor. Syst. 2015, 89, 677–690. [Google Scholar] [CrossRef]
  43. Wang, W.; Ingwersen, J.; Yang, G.; Wang, Z.; Alimu, A. Effects of Farmland Conversion to Orchard or Agroforestry on Soil Organic Carbon Fractions in an Arid Desert Oasis Area. Forests 2022, 13, 181. [Google Scholar] [CrossRef]
  44. Kalambukattu, J.G.; Singh, R.; Patra, A.K.; Arunkumar, K. Soil Carbon Pools and Carbon Management Index under Different Land Use Systems in the Central Himalayan Region. Acta Agric. Scand. B Soil Plant Sci. 2013, 63, 200–205. [Google Scholar] [CrossRef]
  45. Nanzer, M.C.; Ensinas, S.C.; Barbosa, G.F.; Barreta, P.G.V.; de Oliveira, T.P.; da Silva, J.R.M.; Paulino, L.A. Total Organic Carbon Stock and Granulometric Fractioning of Organic Matter in Soil Use Systems in Cerrado. Rev. Cienc. Agron. 2019, 18, 136–145. [Google Scholar] [CrossRef]
  46. Faccin, F.C.; Marchetti, M.E.; Serra, A.P.; Ensinas, S.C. Frações Granulométricas Da Matéria Orgânica Do Solo Em Consórcio de Milho Safrinha Com Capim-Marandu Sob Fontes de Nitrogênio. Pesqui. Agropecuária Bras. 2016, 51, 2000–2009. [Google Scholar] [CrossRef]
  47. Kleber, M.; Bourg, I.C.; Coward, E.K.; Hansel, C.M.; Myneni, S.C.B.; Nunan, N. Dynamic Interactions at the Mineral–Organic Matter Interface. Nat. Rev. Earth Environ. 2021, 2, 402–421. [Google Scholar] [CrossRef]
  48. Shi, L.; Feng, W.; Xu, J.; Kuzyakov, Y. Agroforestry Systems: Meta-Analysis of Soil Carbon Stocks, Sequestration Processes, and Future Potentials. Land Degrad. Dev. 2018, 29, 3886–3897. [Google Scholar] [CrossRef]
  49. Wang, B.; Su, X.; Wang, T.; Yang, T.; Xu, C.; Lin, Z.; Tian, D.; Tang, L. Spatial Heterogeneity of Total and Labile Soil Organic Carbon Pools in Poplar Agroforestry Systems. Forests 2023, 14, 1869. [Google Scholar] [CrossRef]
  50. Poirier, V.; Roumet, C.; Munson, A.D. The Root of the Matter: Linking Root Traits and Soil Organic Matter Stabilization Processes. Soil Biol. Biochem. 2018, 120, 246–259. [Google Scholar] [CrossRef]
  51. de Carvalho, A.M.; de Jesus, D.R.; de Sousa, T.R.; Ramos, M.L.G.; de Figueiredo, C.C.; de Oliveira, A.D.; Marchão, R.L.; Ribeiro, F.P.; Dantas, R.d.A.; Borges, L.d.A.B. Soil Carbon Stocks and Greenhouse Gas Mitigation of Agriculture in the Brazilian Cerrado—A Review. Plants 2023, 12, 2449. [Google Scholar] [CrossRef] [PubMed]
  52. Rodríguez, W.; Suárez, J.C.; Casanoves, F. Total Litterfall and Leaf-Litter Decomposition of Theobroma Grandiflorum under Different Agroforestry Systems in the Western Colombian Amazon. Agrofor. Syst. 2023, 97, 1541–1556. [Google Scholar] [CrossRef]
  53. Oelbermann, M.; Voroney, R.P. Carbon and Nitrogen in a Temperate Agroforestry System: Using Stable Isotopes as a Tool to Understand Soil Dynamics. Ecol. Eng. 2007, 29, 342–349. [Google Scholar] [CrossRef]
  54. Smiley, G.L.; Kroschel, J. Temporal Change in Carbon Stocks of Cocoa–Gliricidia Agroforests in Central Sulawesi, Indonesia. Agrofor. Syst. 2008, 73, 219–231. [Google Scholar] [CrossRef]
  55. Chen, C.; Liu, W.; Jiang, X.; Wu, J. Effects of Rubber-Based Agroforestry Systems on Soil Aggregation and Associated Soil Organic Carbon: Implications for Land Use. Geoderma 2017, 299, 13–24. [Google Scholar] [CrossRef]
  56. Vergutz, L.; Ferreira Novais, R.; Ribeiro da Silva, I.; Félix de Barros, N.; Novais Nunes, T. Mudanças na matéria orgânica do solo causadas pelo tempo de adoção de um sistema agrossilvopastoril com eucalipto. Rev. Bras. Cienc. Solo 2010, 34, 43–57. [Google Scholar] [CrossRef]
  57. Pinheiro, F.M.; Nair, P.K.R.; Nair, V.D.; Tonucci, R.G.; Venturin, R.P. Soil Carbon Stock and Stability under Eucalyptus-Based Silvopasture and Other Land-Use Systems in the Cerrado Biodiversity Hotspot. J. Environ. Manag. 2021, 299, 113676. [Google Scholar] [CrossRef] [PubMed]
  58. Bernal, B.; Murray, L.T.; Pearson, T.R.H. Global Carbon Dioxide Removal Rates from Forest Landscape Restoration Activities. Carbon Balance Manag. 2018, 13, 22. [Google Scholar] [CrossRef] [PubMed]
  59. Junior, M.A.L.; Fracetto, F.J.C.; da Silva Ferreira, J.; Silva, M.B.; Fracetto, G.G.M. Legume-Based Silvopastoral Systems Drive C and N Soil Stocks in a Subhumid Tropical Environment. Catena 2020, 189, 104508. [Google Scholar] [CrossRef]
Figure 1. Location map of the experimental area located at Fazenda Água Limpa, Brasilia, Federal District, Brazil.
Soilsystems 08 00044 g001
Figure 2. Soil total carbon (TC) in 5 phases (T0: November 2012; T1: March 2014; T2: March 2015; T3: March 2016; T4: June 2023) of an agroforestry system at depths 0–10 cm, 10–20 and 20–40 cm. For each depth, means with different lowercase letters present statistically significant differences between phases according to the Tukey test (p < 0.05). In each phase of the system, means with different capital letters present statistically significant differences between depths according to the Tukey test (p < 0.05).
Soilsystems 08 00044 g002
Figure 3. Labile carbon (LC) (A) and particulate carbon of organic matter (CPOM) (B) in 5 phases (T0: November 2012; T1: March 2014; T2: March 2015; T3: March 2016; T4: June 2023) of an agroforestry system at depths 0–10 cm, 10–20 and 20–40 cm. For each depth, means with different lowercase letters present statistically significant differences between phases according to the Tukey test (p < 0.05). In each phase of the system, means with different capital letters present statistically significant differences between depths according to the Tukey test (p < 0.05).
Soilsystems 08 00044 g003
Figure 4. Inert carbon (IC) in 5 phases (T0: November 2012; T1: March 2014; T2: March 2015; T3: March 2016; T4: June 2023) of an agroforestry system at depths 0–10 cm, 10–20 and 20–40 cm. For each depth, means with different lowercase letters present statistically significant differences between phases according to the Tukey test (p < 0.05). In each phase of the system, means with different capital letters present statistically significant differences between depths according to the Tukey test (p < 0.05).
Soilsystems 08 00044 g004
Figure 5. Mineral-associated organic carbon (MAOC) in 5 phases (T0: November 2012; T1: March 2014; T2: March 2015; T3: March 2016; T4: June 2023) of an agroforestry system at depths 0–10 cm, 10–20 and 20–40 cm. For each depth, means with different lowercase letters present statistically significant differences between phases according to the Tukey test (p < 0.05). In each phase of the system, means with different capital letters present significant statistical differences between depths according to the Tukey test (p < 0.05).
Soilsystems 08 00044 g005
Figure 6. Balance of total carbon stocks and fractions of SOM between the degraded pasture phase (T0) and the agroforestry system (T4).
Soilsystems 08 00044 g006
Figure 7. Soil carbon stock (CS) in 5 phases (T0: November 2012; T1: March 2014; T2: March 2015; T3: March 2016; T4: June 2023) of an agroforestry system at depths 0–10 cm, 10–20 and 20–40 cm. Means with different letters present statistically significant differences according to the Tukey test (p < 0.05).
Soilsystems 08 00044 g007
Table 1. Soil chemical and physical properties before establishing the agroforestry system (T0) and T4 at the 0–20cm layer.
TimeAvailable PpHAvailable K+Ca2+Mg2+H + AlSBVmSandSiltClay
mg dm−3(H2O)cmolc dm−3%g kg−1
T01.45.200.102.61.04.83.642.72.545360595
T42.05.060.083.30.732.664.0359.6045360595
Available P and K: extracted with Mehlich−1 (HCl 0.05 mol L−1 + H2SO4 0.0125 mol L−1); Ca and Mg: extracted with KCl 1 mol L−1; H + Al: extracted with calcium acetate buffer solution at pH 7.0; SB = sum of bases; V: base saturation; m: aluminum saturation.
Table 2. Description of treatments and soil sampling times in the different phases of the agroforestry system. T0: November 2012; T1: March 2014; T2: March 2015; T3: March 2016; T4: June 2023.
Treatment/YearDescription of System ComponentsData Collection DateFertilization a
T0Pasture characterized as low productivityOctober 2012-
T1—2013/2014Insertion of the maize and forage componentsMarch 2014Planting: 30 kg N ha−1 + 120 kg ha−1 P2O5 + 64 kg ha−1 K2O;
Top dressing: 130 kg N ha−1 + 65 kg K2O ha−1
T2—2014/2015 bInsertion of the arboreal component (G. sepium), cultivated along with maize and P. maximumMarch 2015Planting: 20 kg N ha−1 + 150 kg ha−1 P2O5 + 80 kg ha−1 K2O;
Top dressing: 140 kg N ha−1 + 60 kg K2O ha−1;
T3—2015/2016G. sepium + Maize + P. maximumMarch 2016Planting: 30 kg N ha−1 + 150 kg ha−1 P2O5 + 50 kg ha−1 K2O;
Top dressing: 150 kg N ha−1 + 90 kg K2O ha−1
T4—2022/2023 cG. sepium + P. maximum. From 2016 onwards, the system was driven only with these 2 components (tree and grass)June 2023-
a Fertilization applied to maize; b G. sepium was planted with 50 g of single superphosphate + 25 g de KCl and 10 g of FTE BR12 (1.8% boron, 0.8% copper, 2.0% manganese, 0.1% molybdenum, 3% iron and 9% zinc) by plant. c From the 2015–2016 to 2020/2023 cropping seasons, no fertilizer was applied.
Disclaimer/Publisher’s Note: The statements, opinions and data contained in all publications are solely those of the individual author(s) and contributor(s) and not of MDPI and/or the editor(s). MDPI and/or the editor(s) disclaim responsibility for any injury to people or property resulting from any ideas, methods, instructions or products referred to in the content.

