Article

Vertical Distribution of Carbon and Nitrogen in Pastures Fertilized with Broiler Litter or Mineral Fertilizer with Two Drainage Classes

by
Anish Subedi
1,
Dorcas Franklin
1,*,
Miguel Cabrera
1,
Natalia Espinoza
1,
Nandita Gaur
1,
Dee Pederson
2,
Lawton Stewart
1 and
Chad Westmoreland
1
1
Department of Crop and Soil Sciences, University of Georgia, Athens, GA 30602, USA
2
GA USDA-Natural Resources Conservation Service, Athens, GA 30601, USA
*
Author to whom correspondence should be addressed.
Soil Syst. 2024, 8(3), 85; https://doi.org/10.3390/soilsystems8030085
Submission received: 6 May 2024 / Revised: 12 July 2024 / Accepted: 14 July 2024 / Published: 25 July 2024
(This article belongs to the Special Issue Research on Soil Management and Conservation: 2nd Edition)

Abstract

:
Nitrogen cycling in pasture soils differing in drainage characteristics and fertilization legacy needs more research to determine efficient nutrient management strategies. This study compared differences in nitrate (NO3), ammonium (NH4+), inorganic N (IN = NO3 + NH4+), potentially mineralizable nitrogen (PMN), loss-on-ignition carbon (C), and soil pH in 10, 0.7 ha pastures in Eatonton, Georgia, historically fertilized with the same amount of N as either broiler litter (BL; >15 years, 6 pastures) or mineral fertilizer (Min; 4 pastures). We sampled to 90 cm (0–5, 5–10, 10–20, 20–40, 40–60, and 60–90 cm) on a 20 m grid. An analysis of variance indicated that below 5 cm BL pastures had significantly greater amounts of NO3, IN, PMN, and soil pH compared to Min pastures. Comparisons of drainage classes (well drained~WD, moderately well drained~MWD, and somewhat-poorly drained~SPD) for each BL and Min were analyzed using linear regression for C:IN, C:PMN, pH: NO3, and pH: NH4+ with all depths combined. In MWD soils, BL had 0.1 and 0.2 mg N kg−1 greater PMN and IN, respectively, for each unit increase in C. In WD soils NO3 decreased in BL by 7.4 and in Min by 12.1 mg N kg−1, while in MWD soils, this level decreased in BL by 7.8 and in Min by 4.5 mg N kg−1 for each pH unit. Five years after N fertilization stopped, BL soils have retained more inorganic N but are losing more NO3 at a greater rate in the MWD soils when all depths are considered. These losses are a combination of plant uptake, emissions, runoff and leaching. While more research is needed, these results strongly suggest the need to design N fertilization practices with drainage class and fertilization legacy in mind to improve N-use efficiency.

1. Introduction

Soil nutrient management decisions in grazing lands should account for pre-existing nutrients in the soil and their interaction with soil water depending on their drainage class to be economically and environmentally beneficial. Nitrogen (N) management decisions with either broiler litter or inorganic fertilizer may have a lasting influence on the amount and fraction of soil N which remains in the rhizosphere, and plant N availability for subsequent growing seasons. Efficient N use can result in greater sustainability. Around 43% of the applied N in broiler litter is taken up by plants and the remaining 57% of the applied N adds N to soil or is lost through leaching or gaseous emissions [1]. Broiler litter is made up of the feces of Gallus gallus domesticus and bedding material which is primarily composed of Pinus spp. L shavings [2]. In 2023, 9.16 billion broilers were produced in the USA, most of which were in the Southern Piedmont, USA and the broiler litter from this production has been commonly used to fertilize hay and grazing lands for decades [3,4]. The addition of broiler litter and plant residues to soils can elevate soil organic N in the long term, along with increased N mineralization, immobilization, turnover rates, and potential nitrification rates [5]. Adding organic matter to soil in the form of broiler litter has been reported to elevate soil pH [6], and such changes in pH could be different from changes in pastures fertilized with inorganic fertilizer. Information on field scale distribution of soil organic carbon, nitrogen, and mechanisms associated with differences due to contrasting fertilization legacies to deeper soil depths is lacking. Measuring concentrations of soil carbon as loss-on-ignition (C) along with different N fractions (NO3 and NH4+), potential nitrogen mineralization, and soil pH could provide crucial information on the fate of soil N. Most of the literature comparing fertilizer legacy of grazing lands focus on soilsamples taken from the 0 to 20 cm depths, while this study focuses on soil depth from 0 to 90 cm [7]. A deeper understanding of N-cycling differences within pasture soils is needed for better-informed fertilization practices.
According to Lin et al. (2020) [8], soil moisture influences soil temperature and energy flow through the landscape and the slope of the landscape determines the routing of water as runoff or subsurface drainage. Soil drainage class is an important consideration to better understand N cycling, as it relates to the frequency and duration of wet periods. In soil classification, at the field level, this interpretation is based on depth to redoximorphic features as indicators of seasonal high-water-table depth [9,10]. Research has shown greater losses of dissolved organic carbon (DOC) and dissolved organic nitrogen (DON) in poorly draining soils compared to freely draining soils [11]. In addition, NO3 losses have been reported to be greater from freely draining soils compared to moderately and poorly draining soils [12]. A greater residence time of soil water and a greater diffusion of dissolved organic matter into the soil solution in moderately well-drained to poorly drained soil have been reported [11]. In well-drained soils, where aluminum and iron oxides were present, a lower residence time of water in soil pores and greater protection of soil organic matter were also reported [11]. However, changes from oxic to anoxic environments within the soil profile could also result in the mineralization of organic matter with greater CO2 production mediated by Fe reduction [13]. The drainage class of soils is crucial in determining better grazing management decisions due to its influence on organic matter decomposition and N-cycling mechanisms.
Continuous grazing of pastureland, commonly practiced in the Southern Piedmont region, USA, creates a spatially heterogeneous distribution of organic matter and nutrients due to the long-term overuse of selective areas based on animal preferences [14]. Research has shown that in unfertilized grassland soils impacted with previously applied N, the translocation of NH4+-N through the soil profile is possible, but it can also be relatively immobile [15]. Soil pH has been reported as an important factor influencing nitrification in soils along with various other factors within the soil matrix including moisture, aeration, and temperature [16]. Greater amounts of cations [17,18] and anions [5] have been reported in various studies with the application of broiler litter suggesting greater anion exchange capacity (AEC) and cation exchange capacity (CEC) of soils, and suggesting potential greater binding of NH4+ and NO3 in soils fertilized with BL.
In continuously grazed pastures with different drainages and fertilization methods, we can expect a variation in the distribution of added organic matter and thus, variation in pH leading to a variation in nitrification rates. The study under discussion was designed with the objective of answering three primary questions of a common complex soil system: (1) Are NO3, NH4+, C, PMN, and IN levels different in soils to a depth of 90 cm with application of either broiler litter or mineral fertilizer? (2) Are NO3, NH4+, C, PMN, and IN levels different in soils to a depth of 90 cm with either well-drained or moderately well-drained drainage classes? (3) Are NO3, NH4+, C, PMN, IN, and pH levels related differently for the two fertilization legacies and contrasting drainage classes?

2. Materials and Methods
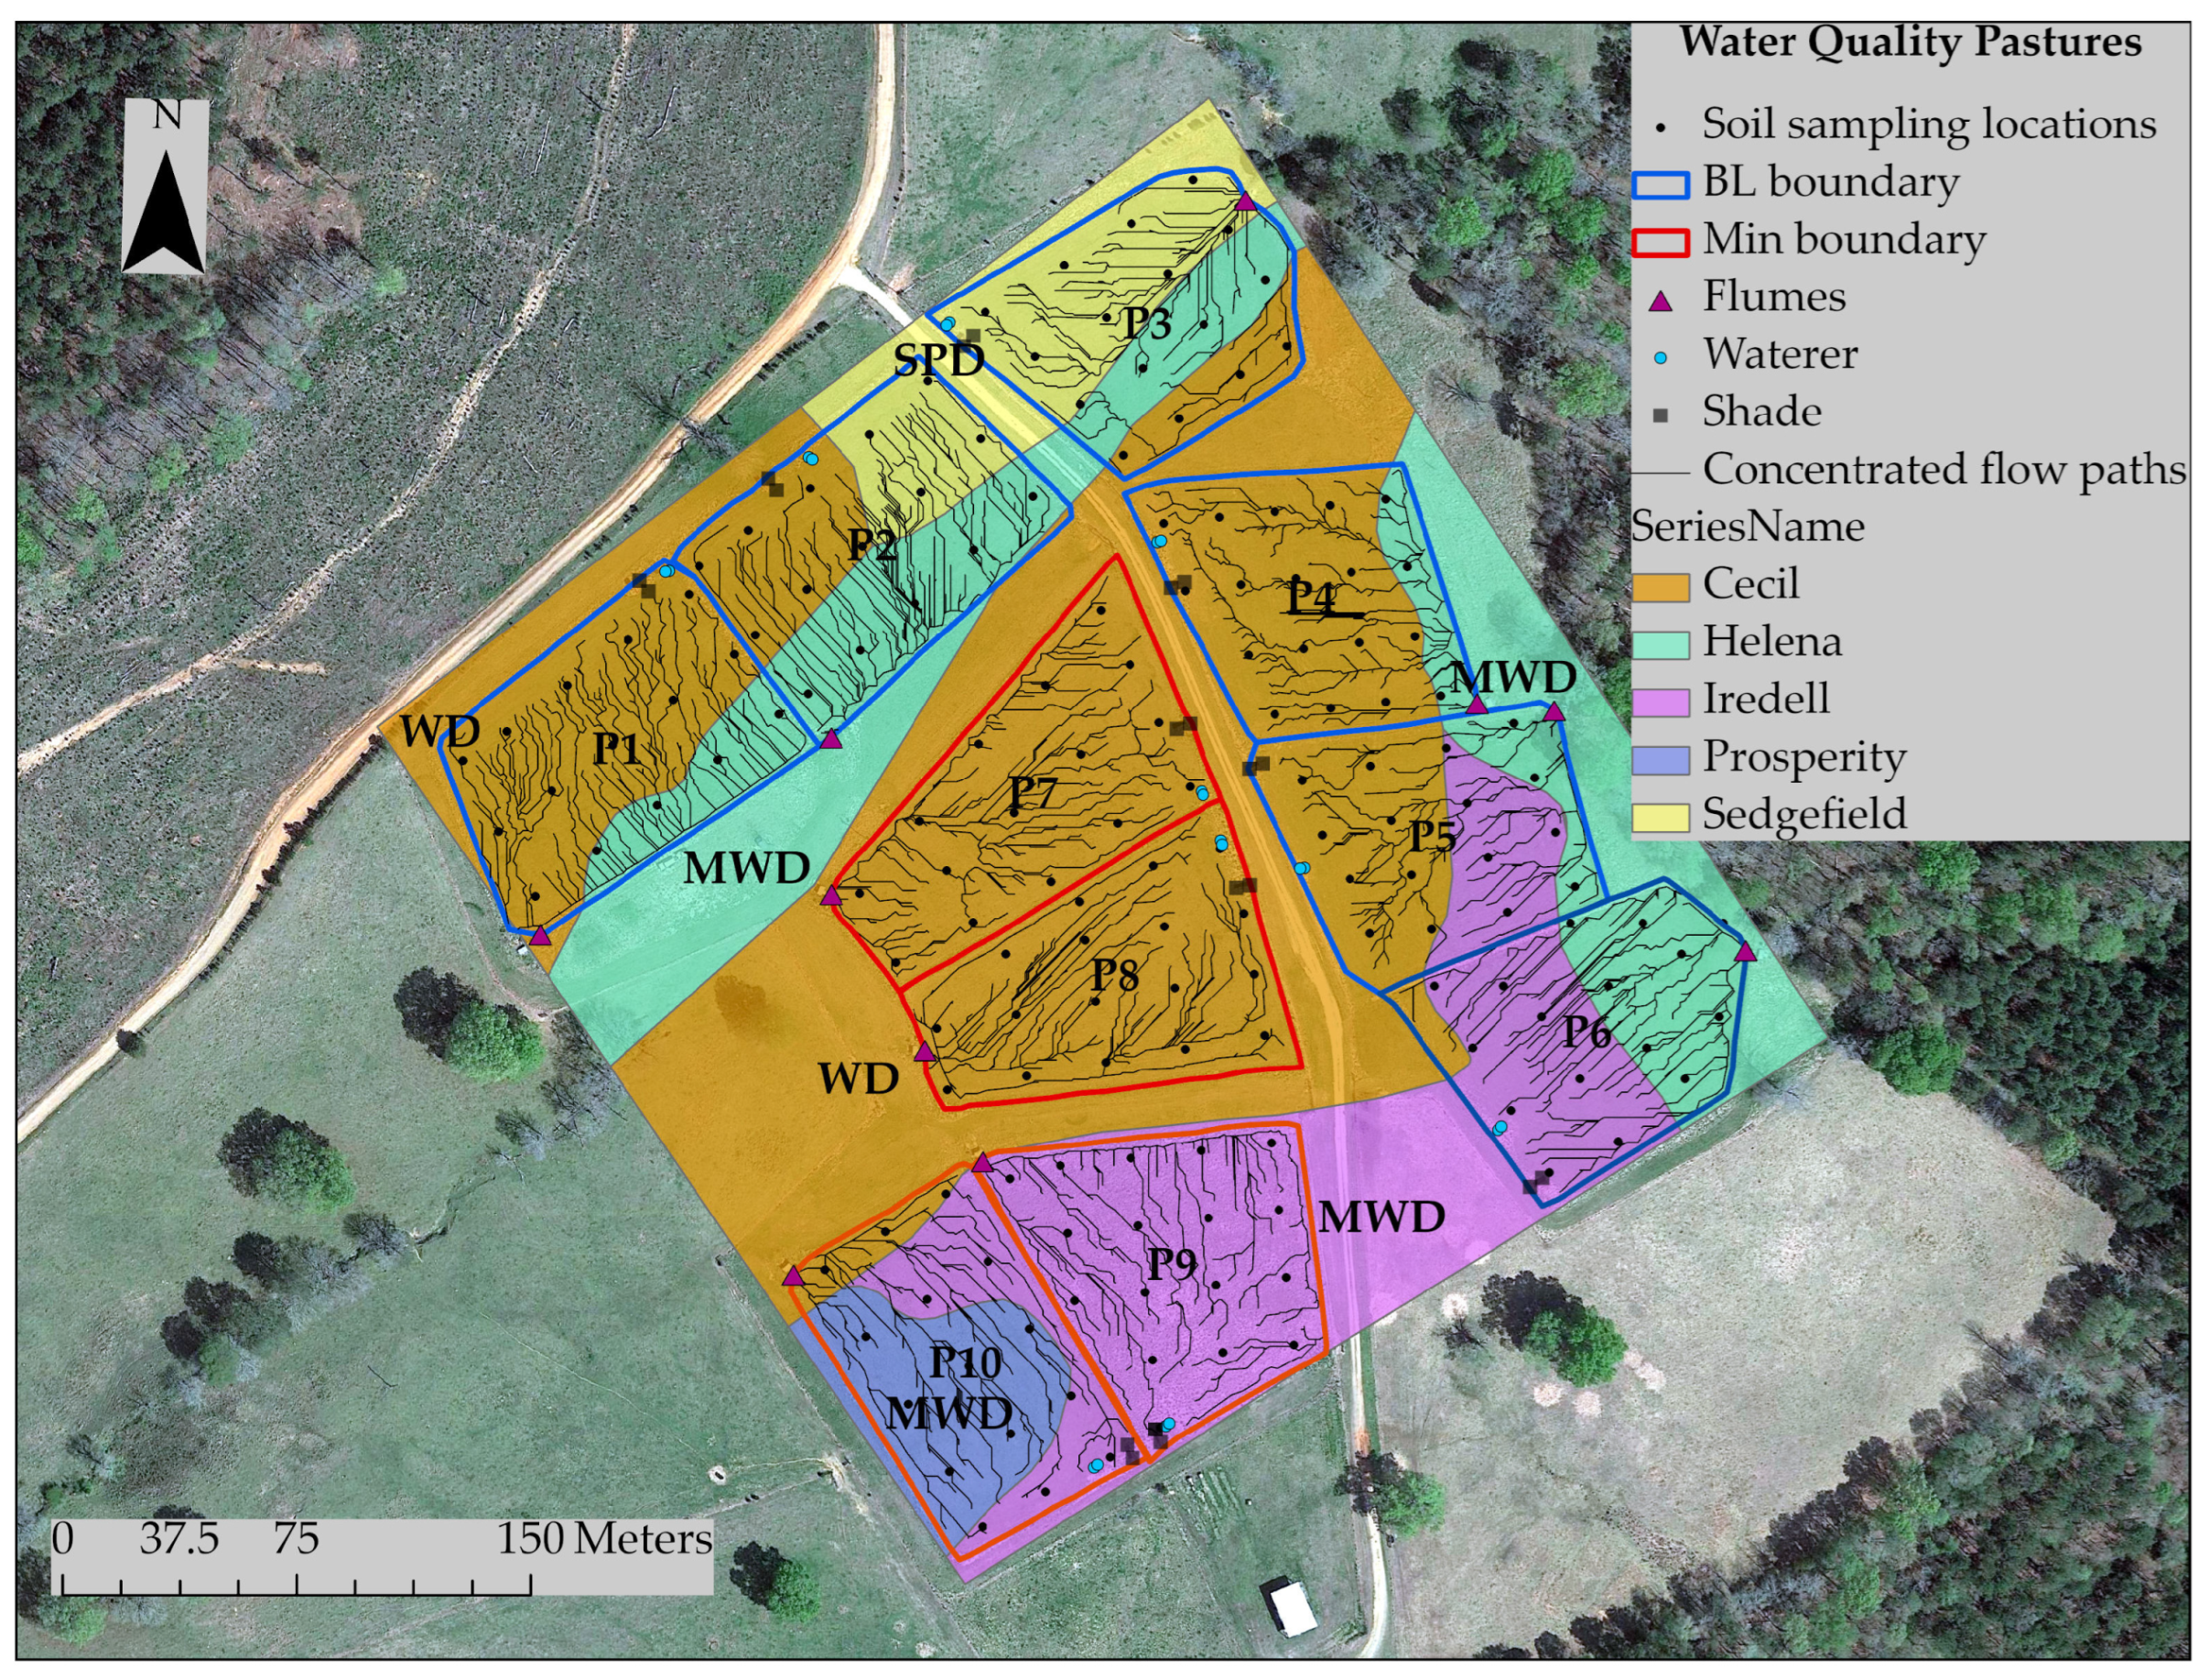
2.1. Study Site

The present study comprised ten 0.7 ha pastures at Eatonton Beef Research Unit (83.47° W 33.41° N, elevation 151–161 m) in Putnam County, Georgia. Historical (1903–2016) average annual minimum and maximum temperatures ranged from 10.5 °C to 23.7 °C and the mean annual precipitation was 1242 mm as observed from the Georgia Automated Environmental Monitoring Network, Eatonton Station, managed by the College of Agricultural and Environmental Sciences, University of Georgia.
Each pasture unit in our study, as illustrated in Figure 1, has a covered area to provide shade to the cattle (shade, dark gray square in Figure), and a waterer (light blue circles) at the top landscape position. All pastures are equipped with a flume (red triangle) at the lowest landscape position where runoff is collected during runoff events. The elevation difference in each study pasture from the top landscape around shade and waterer to the bottom of the landscape around the flume ranges from 5 to 9 m. Pastures in the study were grazed under a continuous system with two Hereford x Black Angus heifers each. Hay was fed and watering stations were located at upland locations.

2.2. Design of Experiment

The study pastures had a legacy of either broiler litter or mineral fertilizer (Urea Ammonium Nitrate, UAN) application to provide 100 kg N ha−1 twice a year, each year fertilization occurred. The broiler litter fertilized pastures (BL) included six pasture units which had been fertilized with broiler litter (P1–P6 in Figure 1) in 1995, 1996, 1999 to 2002, and 2005 to 2011. The broiler litter total N content ranged from 22.5 to 51 g TN kg−1 [19]. The mineral fertilized (Min) pastures included four pastures (P7–P10 in Figure 1) historically fertilized with urea–ammonium nitrate two times per year from 2003 and 2008 to 2011. In 2017, 2018, and 2020, all pastures were fertilized with 100 kg N·ha−1 with urea–ammonium nitrate twice per year. We hypothesized differences in soil carbon, NO3, NH4+, inorganic N (NO3 + NH4+), potentially mineralizable N (PMN), and soil pH between BL and Min legacies. Within each of the legacy pastures, the soil series varied with contrasting drainage classes (Table 1) including well drained (WD), moderately well drained (MWD), and somewhat-poorly drained (SPD). Hence, we extended our hypothesis to test for differences in NO3, NH4+, C, IN, PMN, and soil pH between BL and Min legacies under different drainage classes.

2.3. Soil Sampling and Drainage Class Determination

A 20 m grid was used to determine sampling locations (Figure 1) on study pastures. A total of 160 soil cores were collected as presented in Table 1. Soil cores were cut into sections of 0–5, 5–10, 10–20, 20–40, 40–60, and 60–90 cm and stored separately. The soil samples were then air-dried (20 °C), weighed, ground, and sifted through a 2 mm sieve.
The soil series were compiled by collecting soil type information available for study pastures in the literature and the Soil Survey Geographic Database (SSURGO). The soils identified were Cecil (fine, kaoilinitic, thermic Typic Kanhapludults; WRB-SR, Chromic-Alumic Acrisols), Iredell (fine, mixed, active, thermic Oxyaquic Vertic Hapludalfs; WRB-SR, Oxyaquic Vertic Luvisols), Sedgefield (fine, mixed, active, thermic Aquultic Hapludalfs; WRB-SR, Gleyic Luvisols), Helena, and Prosperity (fine, mixed, semiactive, thermic Aquic Hapludults; WRB-SR, Oxyaquic Acrisols) (Figure 1). We should qualify that the base saturation was not conducted on these soils and that first- and second-order soil surveys were conducted on this site which identified the soil series. We should also note that the addition of broiler litter can increase the calcium, magnesium, and potassium of soil and, as such, increase the base saturation.
According to NRCS USDA, the drainage class of soils refers to the frequency and duration of wet periods under conditions similar to those under which the soil was formed and are determined utilizing soil morphological features found at specific depths. Three drainage classes were identified in Water Quality pastures (Figure 1) and are defined in Table 2.

2.4. Analysis of Soil Samples

All analyses were carried out in sieved (<2 mm) and moisture-corrected soils [20]. A total of 2 M KCl was used to extract nitrate (NO3) and ammonium (NH4+) from 3 g of soil and a spectrophotometer (TECAN spectrophotometer; model infinite 200 pro, Tecan Group Ltd., Männedorf, Switzerland) was used to measure the concentration of NO3 [21] and NH4+ [22]. Inorganic nitrogen (IN) was calculated as the sum of NO3 and NH4+. Another batch of 3 g of soil was extracted with 2 M of KCl by heating in a water bath at 100 °C for 4 h. Potentially mineralizable nitrogen (PMN) was measured as the difference between the NH4+ measured in a hot KCl extract and a cold KCl extract. Loss-on-ignition carbon (C) was measured gravimetrically by burning off carbon from 1 g soil sample heated at 550 °C for 8 h in a muffle furnace (Thermolyne Muffle Furnace; model F6010, Thermo Fisher Scientific Inc., Asheville, NC, USA). The soil pH was determined in a 1:2 soil water solution using an Orion pH electrode (Thermofisher Scientific Inc., Asheville, NC, USA).

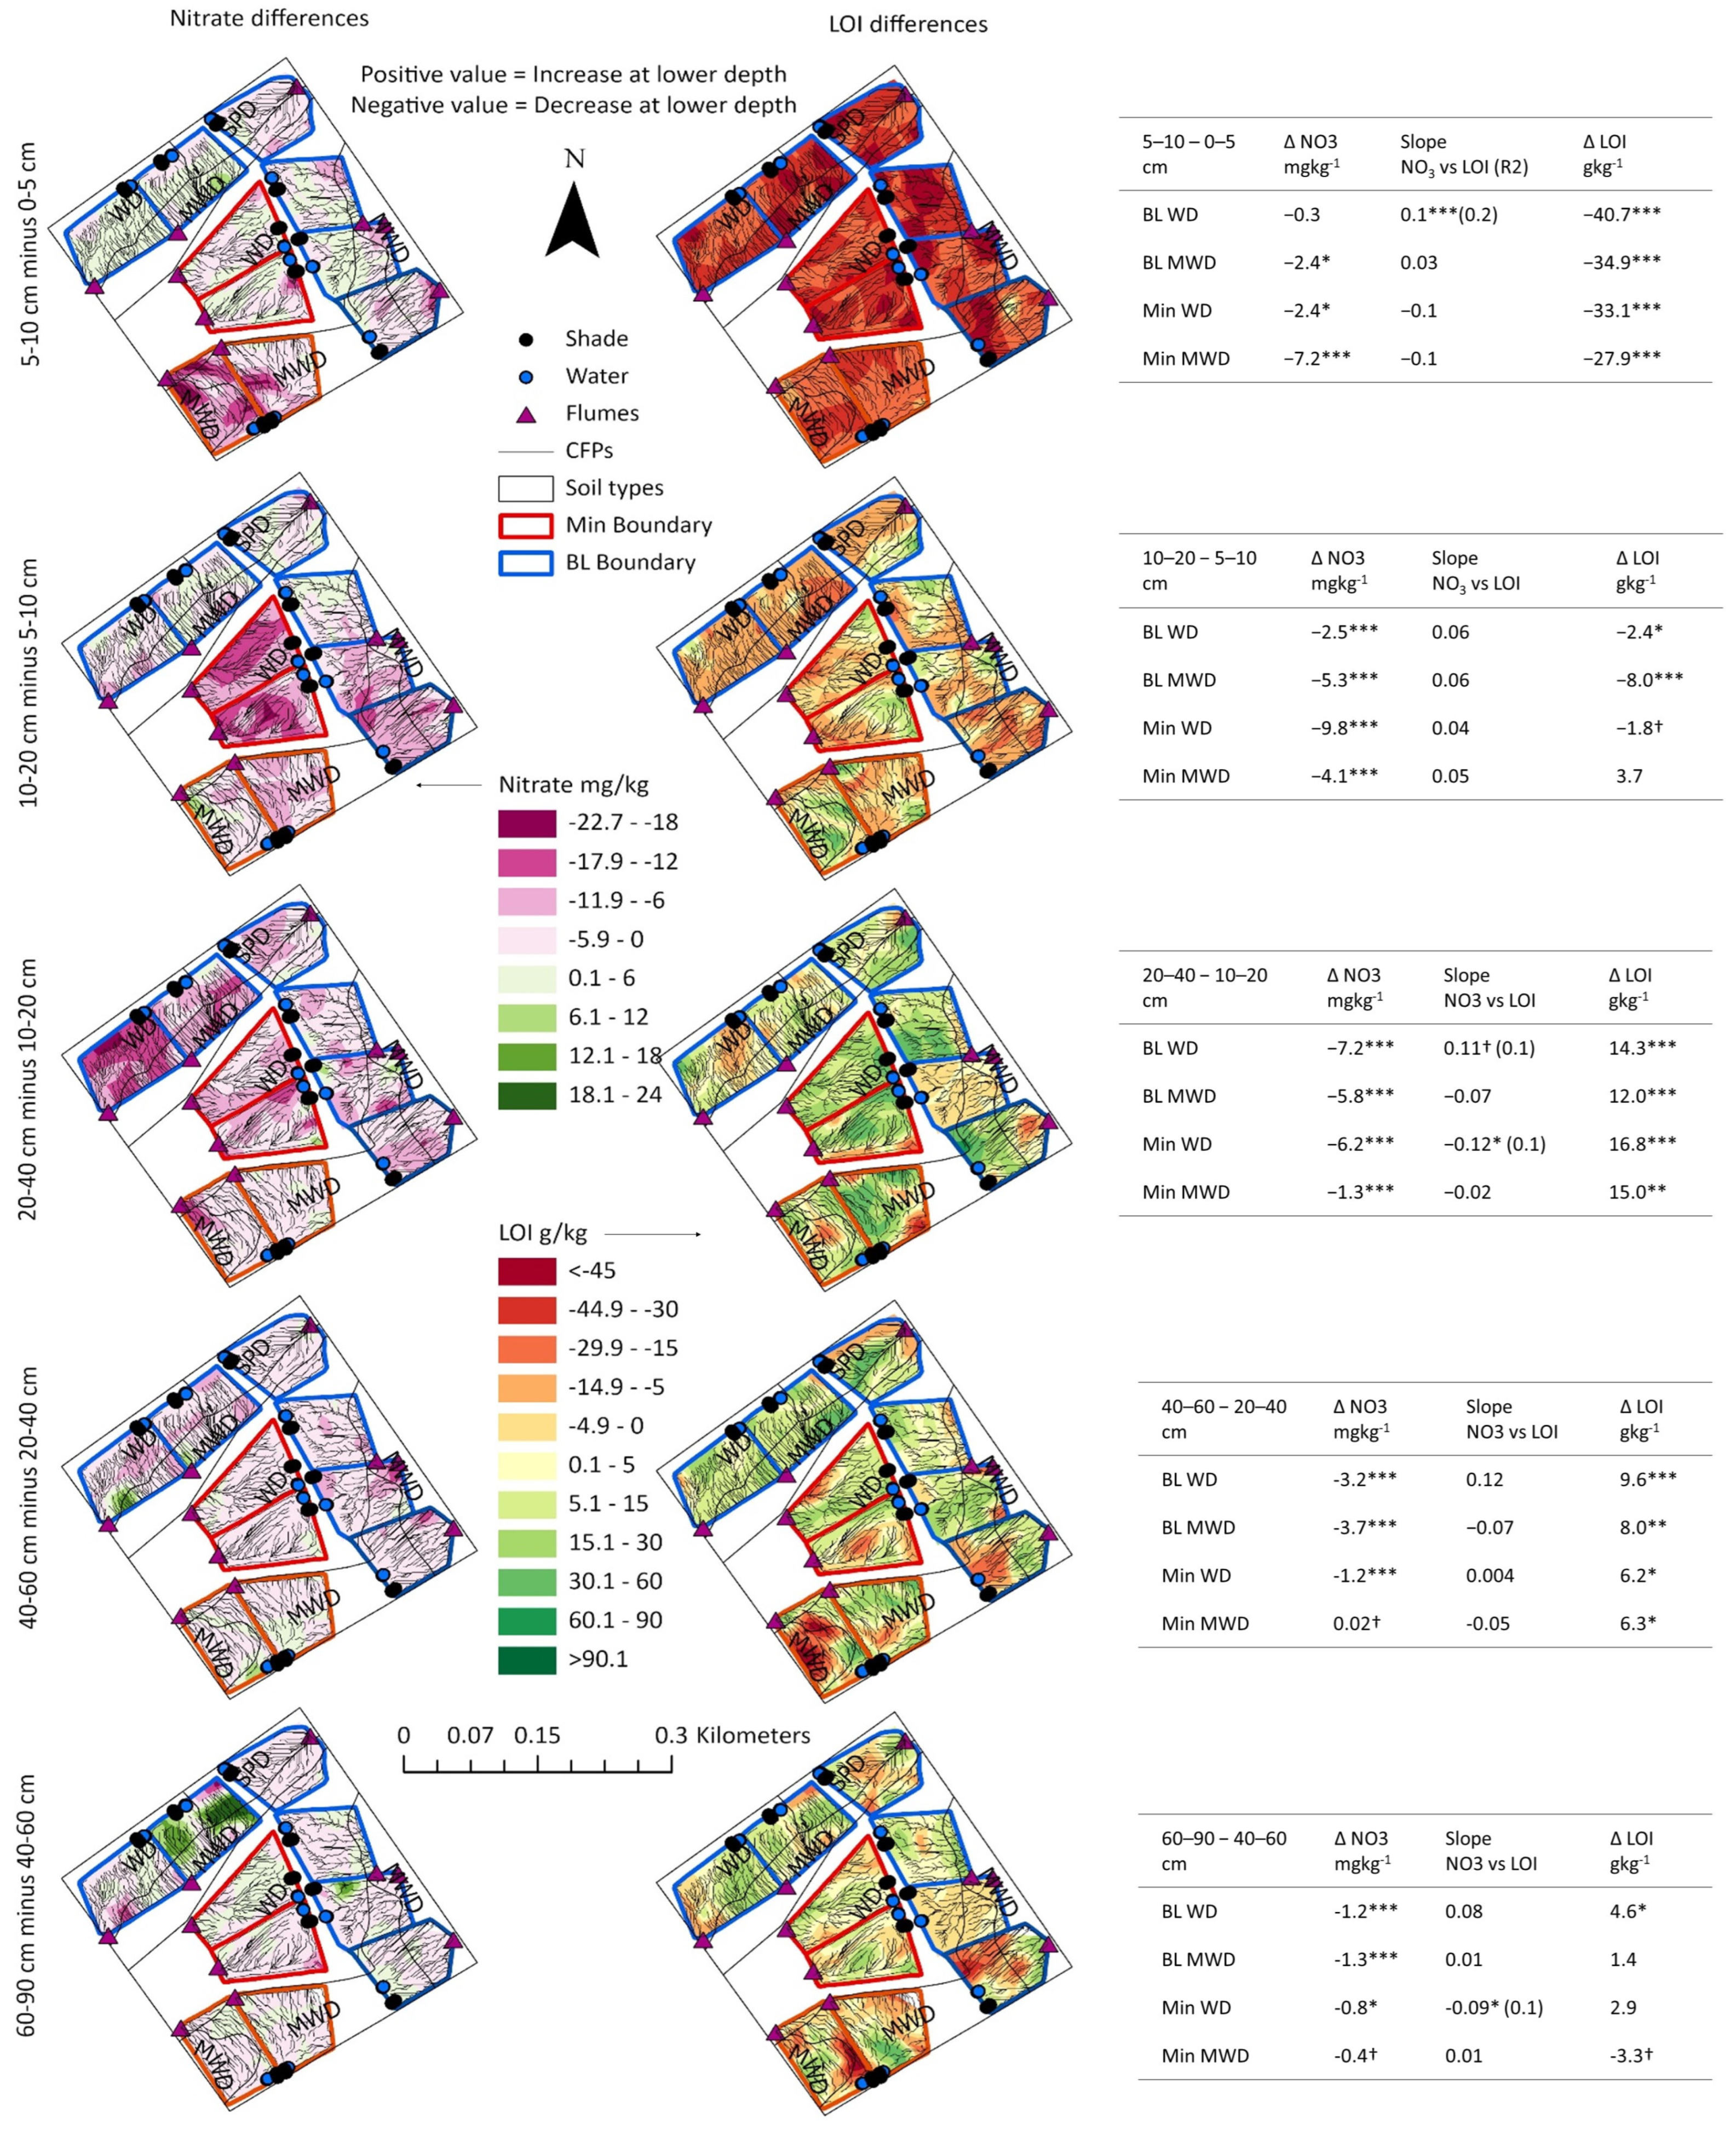
2.5. Mapping Distribution and Differences of Soil Properties

ArcGIS Pro 3.2 (ESRI, Redlands, CA, USA) was used to generate distribution maps of NO3, NH4+, C, and soil pH by interpolating the values measured at the intersection of the grids. The Create TIN tool was used to generate triangular irregular networks (TINs) for each soil property at an individual depth and then converted to raster using the TIN to Raster Tool. Using elevation data collected on a 2 m grid (+/− 0.04 cm H and 0.08 cm V), TINs were also created, and digital elevation models were created and used to derive concentrated flow paths with the continuous flow tool to generate flow direction and the flow accumulation raster. From these, the stream-as-line tool was used to generate concentrated flow paths for each plot under study (CFPs; Figure 1).
We calculated differences in NO3, NH4+, C, and soil pH by subtracting the values at the immediate depth above from the respective depth below (e.g., 10–20 cm C minus 5–10 cm C). The differences were then compared with the hypothesized difference of 0 using Wilcoxon’s signed rank test. Similarly, “difference” rasters were generated by subtracting the NO3, NH4+, C, and soil pH distribution raster of immediate depth above from the respective raster below (e.g., 10–20 cm C raster minus 5–10 cm C raster) by using the raster calculator tool in ArcGIS Pro.

2.6. Statistical Analysis

We hypothesized differences in the amounts and distribution of NO3, NH4+, C, IN, and PMN in the two contrasting BL and Min fertilization legacies. Hence, BL and Min legacy groups at each depth were compared using a one-way analysis of variance (ANOVA) and Wilcoxon’s test, which is an alternative to a two-sample t-test when data normality assumptions are not met. With inherent differences in drainage classes of soils in the study pastures, we also hypothesized differences in the amounts and distributions of NO3, NH4+, C, IN, and PMN within either BL or Min legacies and at individual depths of sampling among WD, MWD, and SPD (where applicable) drainage classes. Hence a one-way ANOVA and Wilcoxon’s test were used to test differences between BL and Min fertilization legacies within each soil drainage class and at individual sampling depths. The soil pH data were normally distributed; hence, a t-test was used to compare differences between BL and Min fertilization legacies.
Simple linear regression was used to explore and compare the slopes of regression lines between BL and Min pastures for each relationship. The significance of the interaction between fertilization legacy and the explanatory variable for each relationship denoted differences in slopes of regression lines between BL and Min pastures. Inflection points of the quadratic fits for soil pH vs. NH4+ were identified using polynomial fit to the second degree. All statistical comparisons were made at a 0.05 level of significance and in some cases, as indicated in the results, we also tested at a 0.1 level of significance. All statistical analyses were performed using the JMP software package (JMP®, Version 14. SAS Institute Inc., Cary, NC, USA, 1989–2019).

3. Results and Discussion

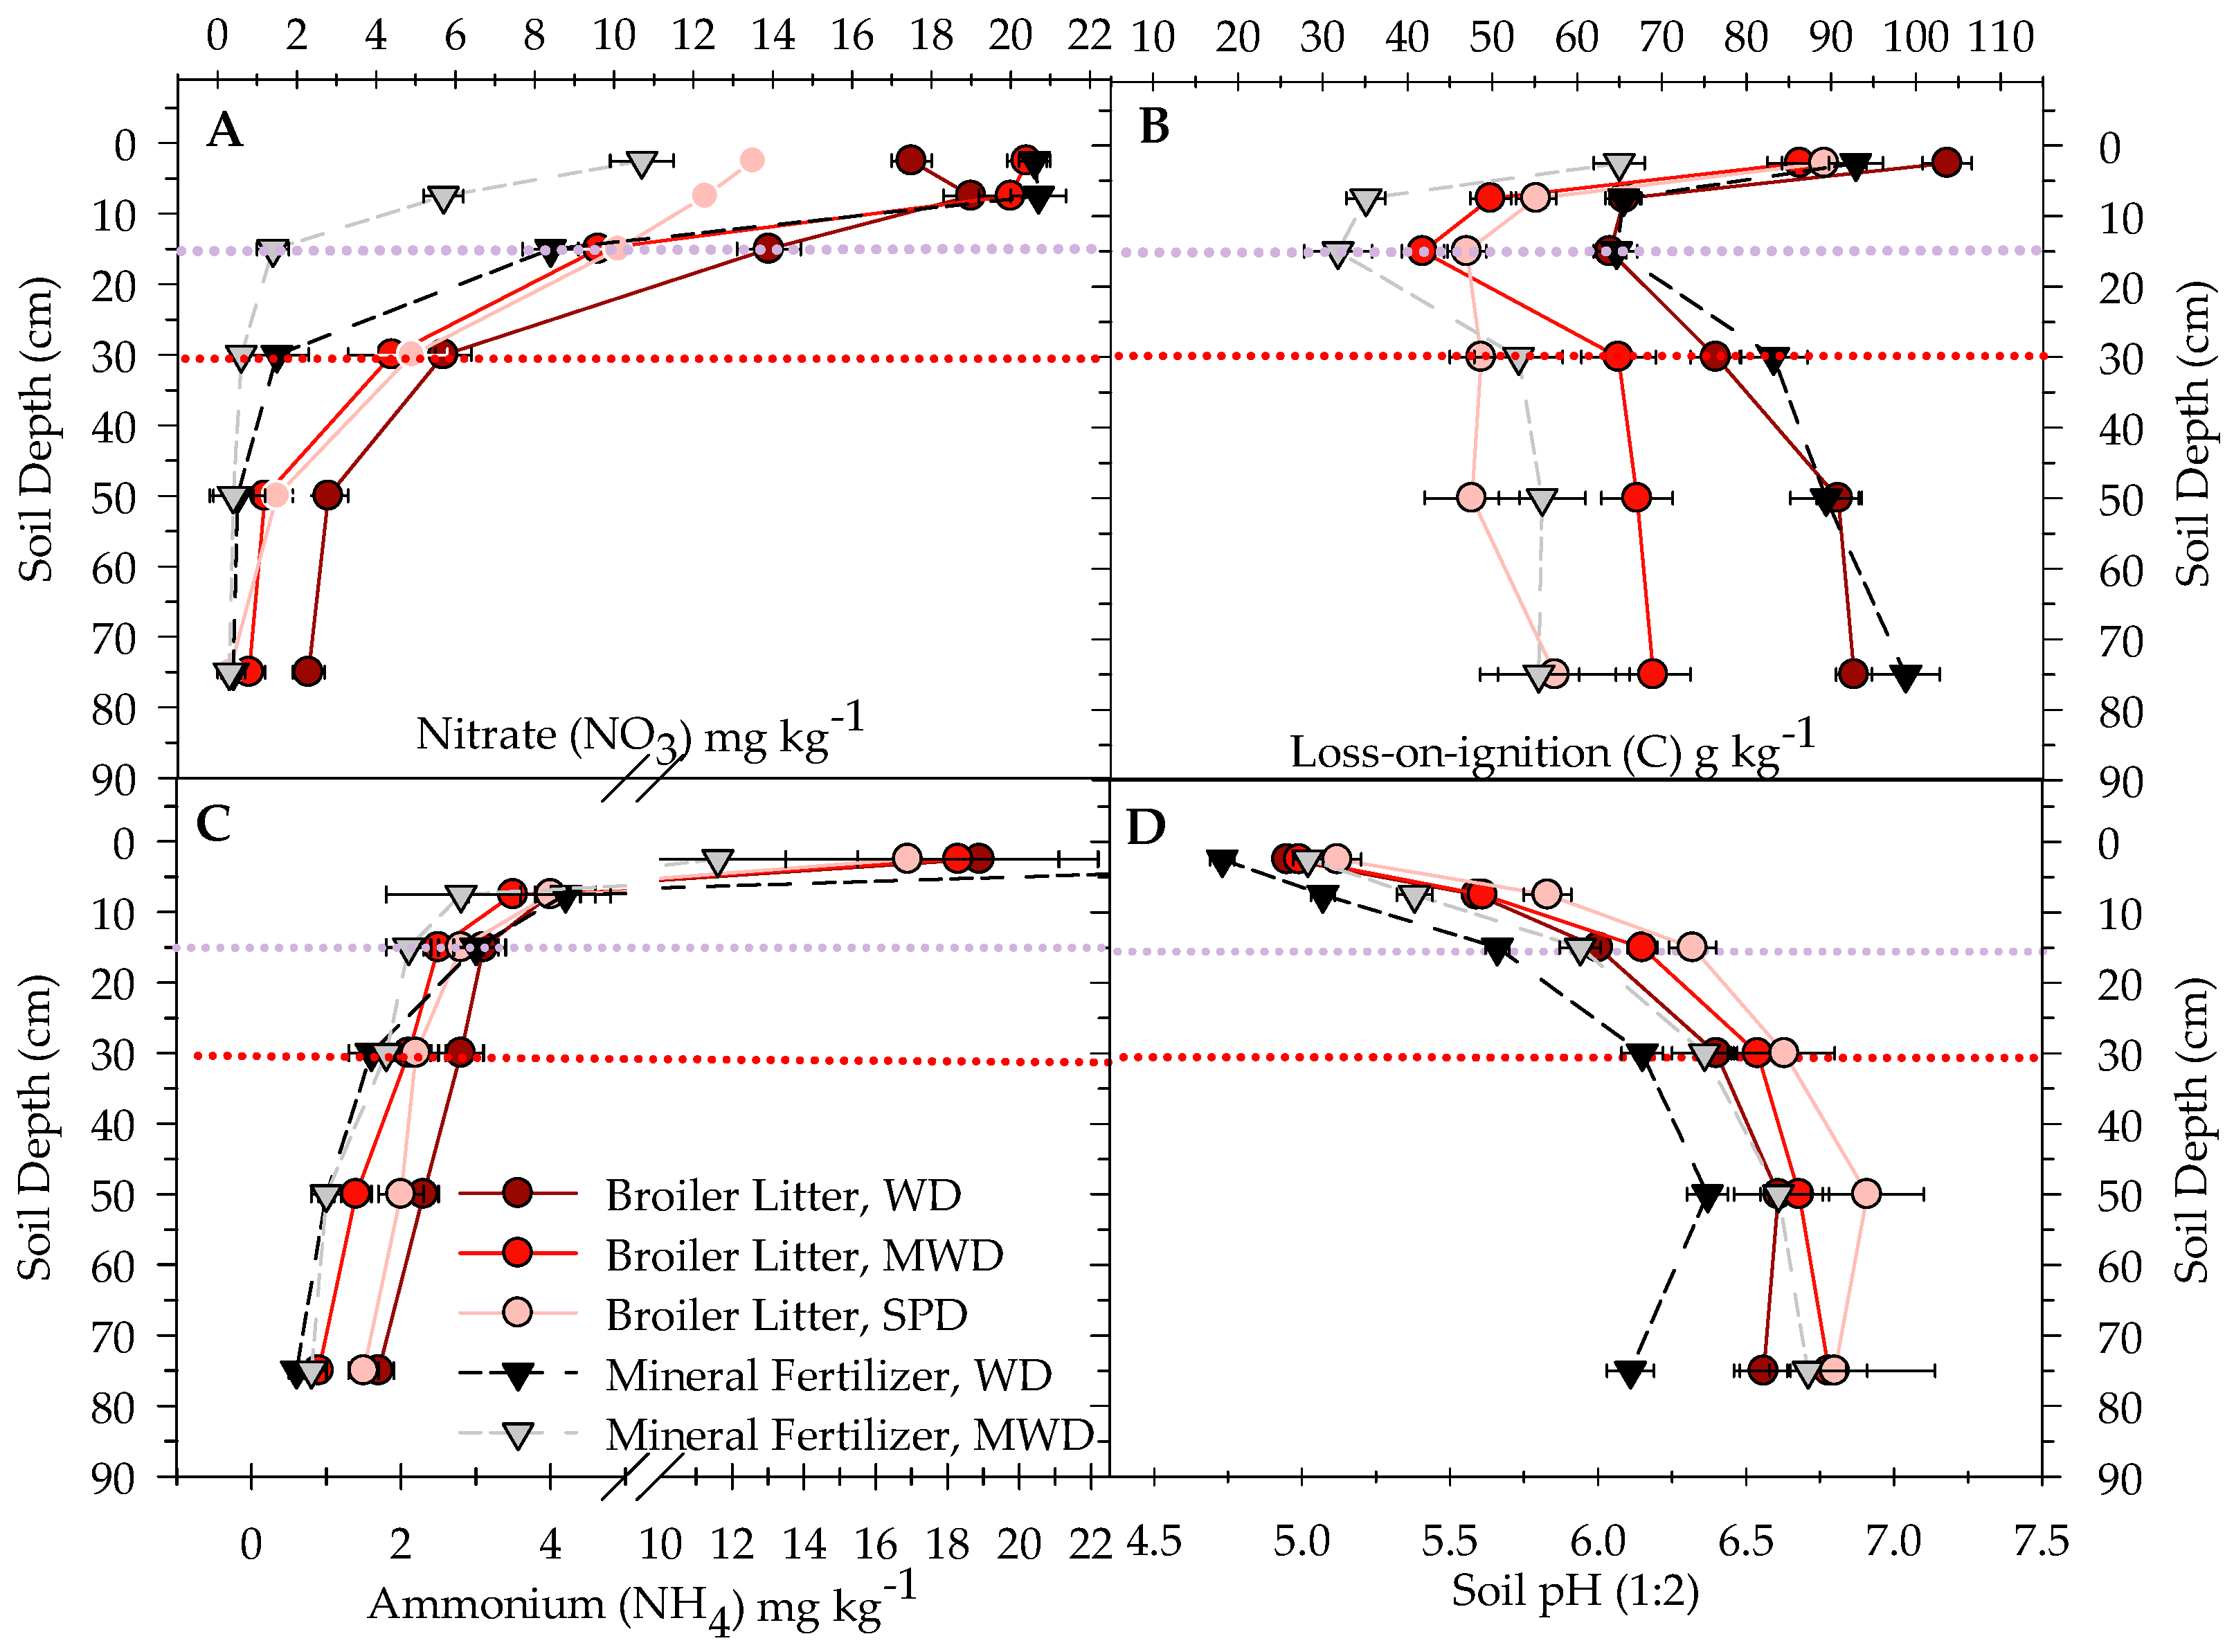
3.1. Fertilization Legacy Influence on NO3 and NH4+

We compared differences in the vertical distribution of NO3 and NH4+, to a depth of 0.9 m, between pastures historically fertilized with either BL or Min fertilization. Table 3 shows median values of NO3 and NH4+ at all depths sampled compared between BL and Min legacies. In both BL and Min pastures, NO3 and NH4+ decreased significantly with depth whereas soil pH increased with depth up to 60 cm. At the surface (0–5 cm layer), NO3 was comparable between BL and Min legacies while at all other depths (5–90 cm layers), BL pastures had significantly greater NO3. In contrast, NH4+ was significantly greater in the 0–5 cm soil layer in Min pastures than in BL pastures. While there were no significant NH4 differences from 5 cm to 20 cm depth, NH4+ was significantly greater in BL pastures than Min pastures from 20 to 90 cm depth. The soil pH was greater in BL pastures than Min pastures at all depths sampled, from 0 to 90 cm. Alfisols and Ultisols in India with no fertilization showed a slight increase in soil pH (4.95 to 5.30 and 5.20 to 5.53, respectively). In an older study conducted in pastures of the Sand Mountain Region of Northern Alabama, USA, the soil pH decreased with depth, but the soil pH was always greater down to 90 cm of depth [3]. Fourteen years later, in the same soil, the pH increased with depth with applied litter [6]. They attributed this to an increase in Ca, Mg, and Zn which are abundant in broiler litter, indicating translocation and leaching through the soil profile.

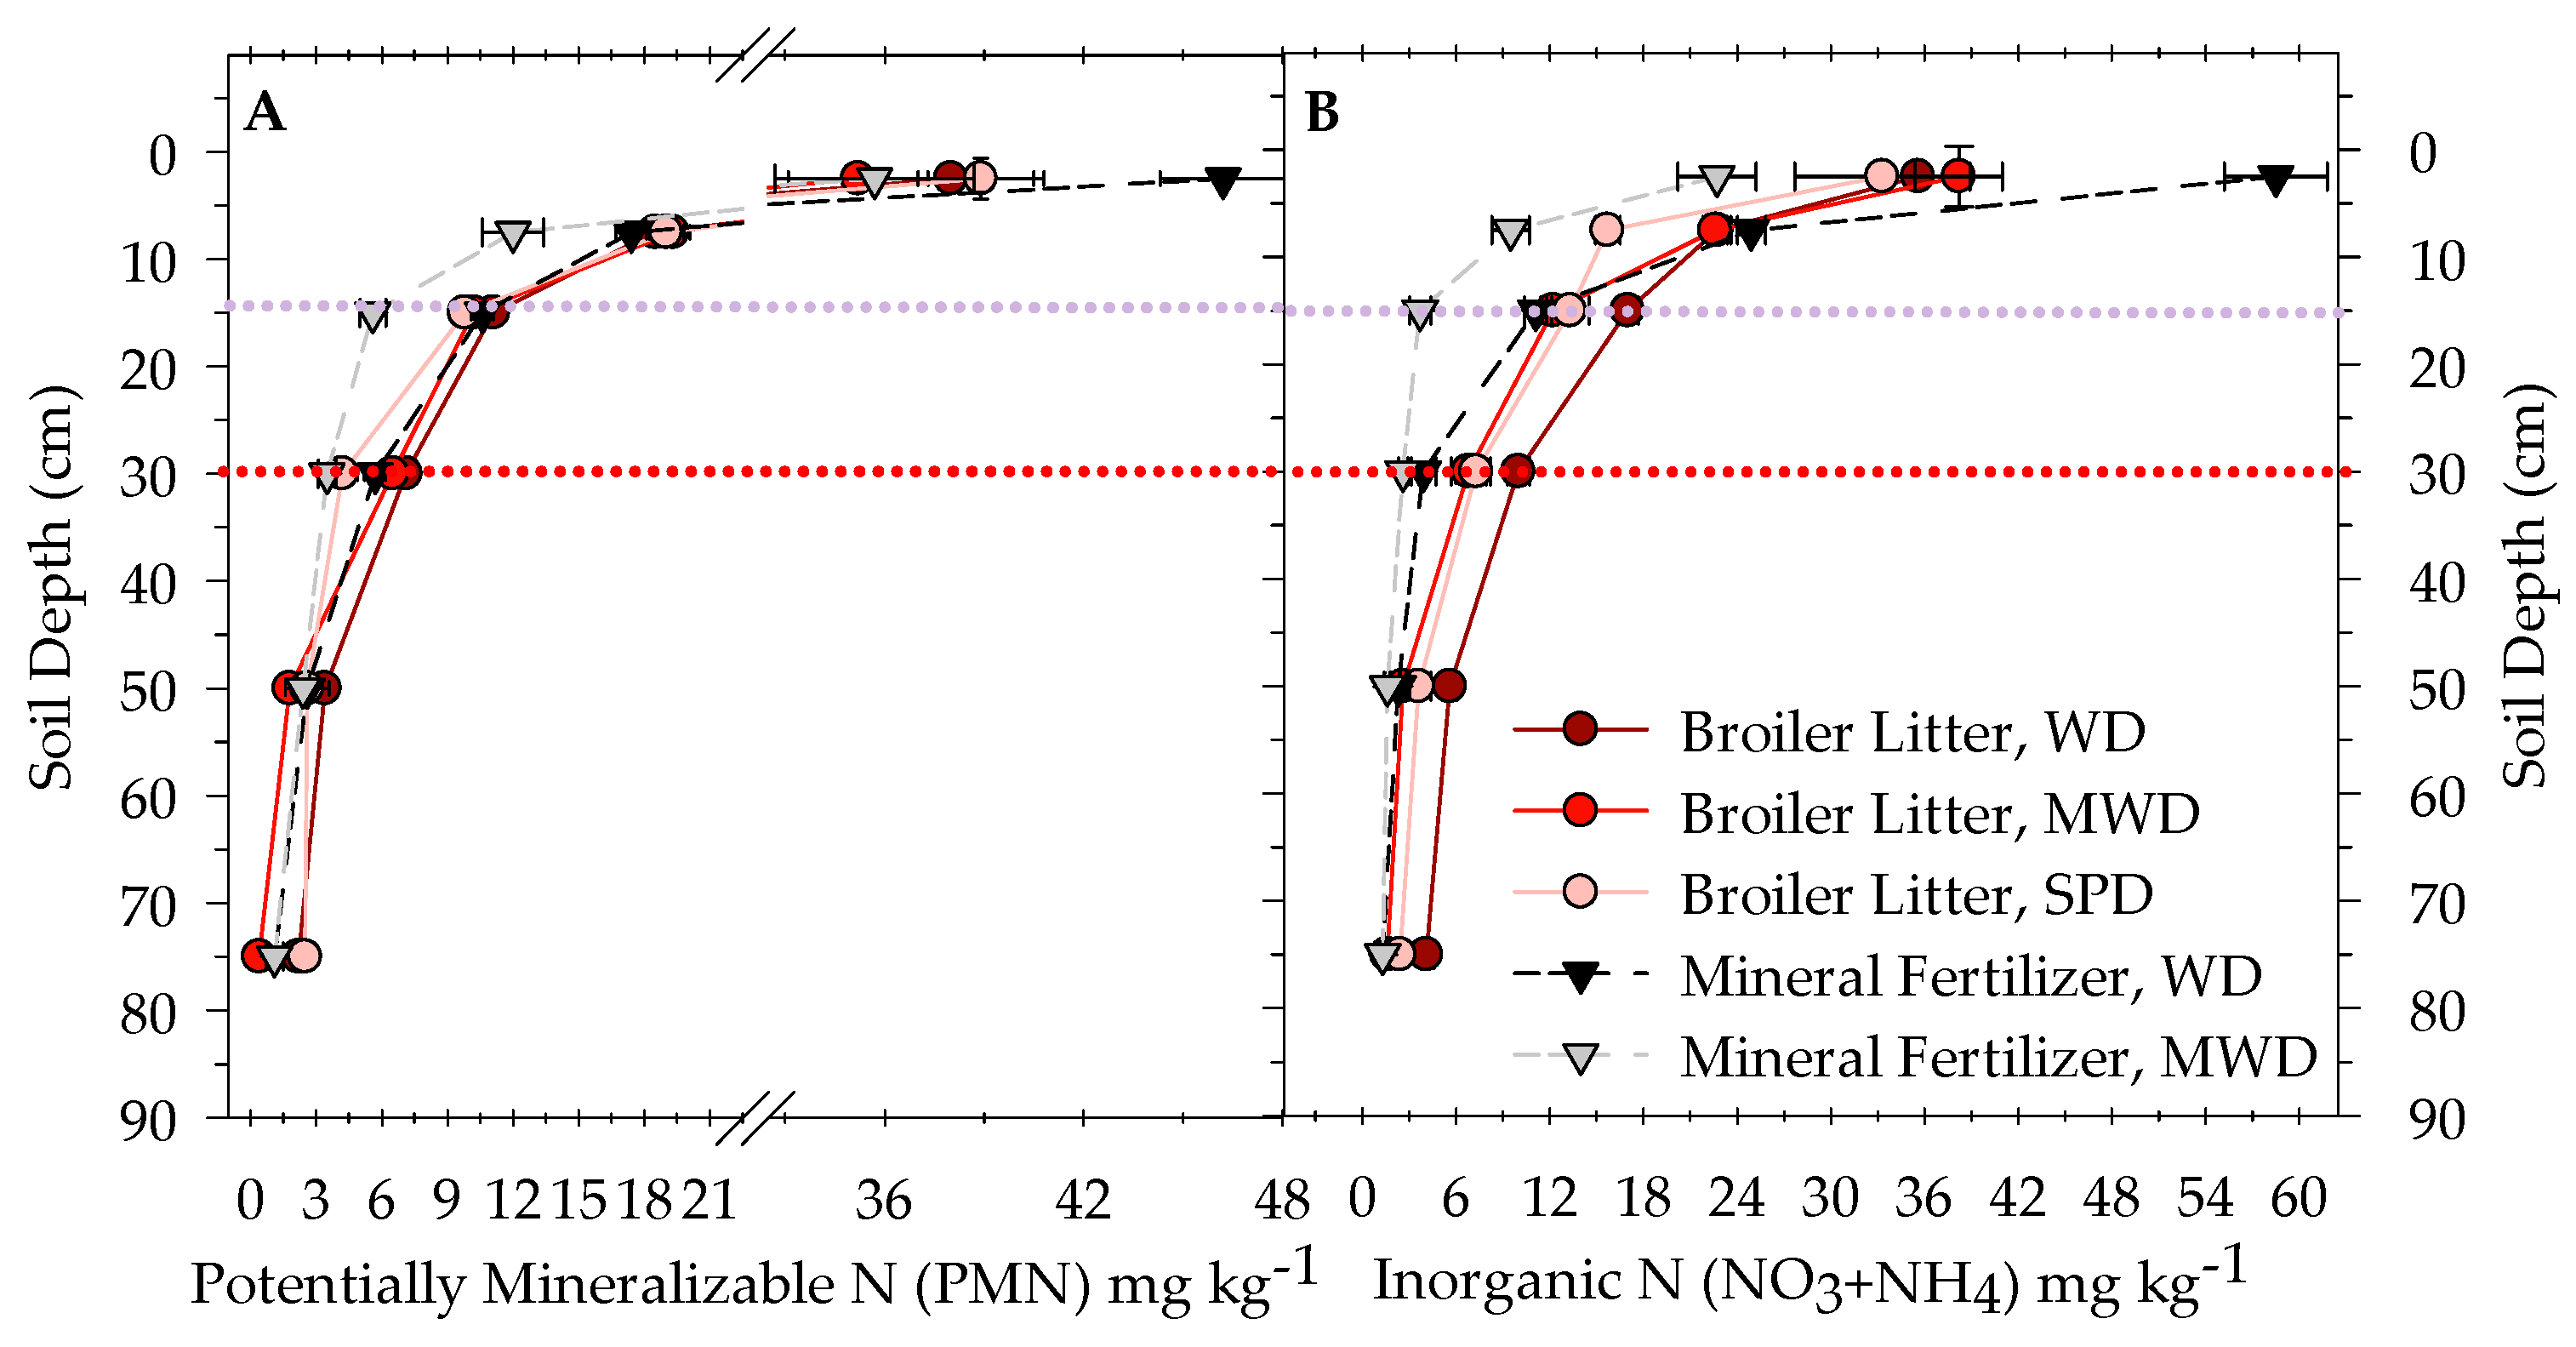
3.2. Fertilizer Legacy Influence on C, IN, and PMN

Vertical distributions of carbon, IN, and PMN were compared between BL and Min pastures to a depth of 0.9 m (Table 4). Pastures with BL had greater C than Min pastures in the top 10 cm soil layer. Elevated organic carbon in pastures was reported at depths of 15 cm [23] and 40 cm [6] in Ultisols with a long-term application of broiler litter. Broiler litter is a significant source of soil organic matter and organic N which accumulates in the soil with continued application [5]. Both fertilization legacies had comparable IN in the top 10 cm soil layer, but BL pastures had significantly greater IN than Min pastures from a soil layer of 10 to 90 cm. Min pastures had significantly greater PMN in the top 5 cm soil layer but significantly lower PMN in the 5–40 cm and 60–90 cm soil layers. Increased N-mineralization immobilization turnover rates and potential nitrification rates have been reported with the long-term application of broiler litter in Typic Hapludalfs [5]. The reasons for these increases have led to much discussion with other soil scientists from around the world. In Section 3.7 and Section 3.8, we describe some of the possible mechanisms for this retention. Section 3.3, Section 3.4, Section 3.5 and Section 3.6 contain the linkages needed to fortify the possibility of those mechanisms. Section 3.8 summarizes all the possible mechanisms.

3.3. Drainage Class Influence on NO3, NH4+, and C

The significant influence of drainage class on NO3, C, and NH4+ was observed (Figure 2). In WD soils, Min pastures had significantly greater amounts of NO3 in the top 10 cm of soil, but at all other depths, BL had greater amounts of NO3. Similarly, Min pastures had significantly greater amount of NH4+ in the top 5 cm, but at greater depths (20–90 cm), BL had greater amounts of NH4+. C was most influenced by drainage class because WD soils had greater amounts of C than all other drainage classes. The soil pH was greater in BL pastures compared to Min pastures at all depths which can greatly influence anion exchange and cation exchange depending on soil moisture [24,25]. Section 3.6 describes further the role of pH in multiple mechanisms in the retention of N.
In MWD soils, NO3 was significantly greater in BL than in Min pastures at all depths (Figure 2). NH4+ was lower at the surface (0–5 cm), and greater at a 40–60 cm soil depth in BL pastures than in Min pastures. C was greater in the top 20 cm soil layer and at the 60–90 cm soil layer in BL pastures compared to Min pastures. The soil pH at the surface was comparable between BL and Min pastures, whereas BL pastures had a significantly higher soil pH than Min pastures from 5 to 20 cm (Figure 2).

3.4. Drainage Class Influence on IN, and PMN

In WD soils, Min pastures had significantly greater PMN at the surface (0–5 cm) but significantly lower PMN in the 40–90 cm soil layer in comparison to BL pastures (Figure 3). As was the case for NO3 in WD pastures, IN was significantly greater in the soil layer of 10 to 90 cm in BL pastures. In MWD soils, BL pastures had greater PMN in the 5–40 cm soil layer.

3.5. Relationship between C, IN, and PMN

All regressions of IN and PMN on C were positive and significant (p < 0.05) in both BL and Min pastures and in both WD and MWD drainage classes (individual regressions in Figure 4). However, slopes were significantly different between fertilizer legacies in MWD and not different in WD pastures. MWD pastures fertilized with BL had 0.1 and 0.2 units greater PMN and IN, respectively, for a unit increase in C. Differences observed between drainage classes have management implications as lower mineralization of nitrogen in the MWD Min soils would require greater N input depending on the initial soil carbon. Broiler litter applied pastures had greater soil carbon and it appears that a greater amount of IN was mineralized, retained, and available for forage growth. We did find significantly greater biomass, at least 80 g m−2 more in BL pastures in 2022 and 2023 compared to Min pastures. The greater PMN observed in BL also points towards differences in management with a lower N input required in BL pastures to meet the N demand of forages.

3.6. Relationship between Soil pH and Nitrogen

The soil pH varied significantly with drainage class and decreased with increasing drainage (Figure 2A). Individual regressions of NO3 on the soil pH for BL and Min pastures in contrasting soil drainage types were significantly negative (Figure 5) inferring lower NO3 and NH4+ with the increasing pH of soil. NO3 decreased gradually with the increasing pH while NH4+ decreased dramatically, revealing different quadratic inflection points depending on fertilization legacy and drainage class combinations (Figure 5).
In WD soils, the comparison of slopes of regression lines revealed a sharper decline in NO3 with the increasing pH in Min pastures compared to BL pastures (Figure 5A). At a pH lower than 4.5 to 5.0, a greater amount of IN (NO3 + NH4+) was present in Min pastures, suggesting greater plant availability of N at lower pH values than is normally expected. This was not the case in MWD soils, the BL regression slope was steeper (−7.8 vs. −4.5, respectively) more IN was held at pH values 5.0 to 6.5 (Figure 5B,D). This raises the following question: should N fertilizer and liming recommendations be the same for grasslands with different fertilizer legacies and soil drainage classes? In MWD soils, NO3 had a stronger relationship with pH than NH4+ for both BL and MIN pastures, emphasizing the importance of pH when managing NO3 concentrations and forage quality. There were also significant differences in quadratic equation inflection points for data shown in NH4+ vs. pH, as seen in Figure 5C,D: WD-BL = −5.85 (p < 0.0001), WD-Min = −5.50 (p < 0.0001), MWD-BL = −5.92 (p < 0.0001), and MWD-Min = −5.83 (p < 0.0652). The accumulation of ammoniacal N at a pH of 4 in the upper depths (Figure 2C,D) was reported, owing to the lower nitrifying activity in such acidic conditions; however, it was also noted that acidification decreased nitrification but did not eliminate it [26]. Liming management for the two fertilization legacies may need to be different, especially with differing drainage types.
The addition of broiler litter can increase CEC [17], cations such as Ca++, K+, Mg++ [6], and soil pH to depths of 60 cm [17], suggesting increased sorption of both cations and anions in acidic soils typically low in initial N and organic matter thereby retaining both NO3 and NH4+. An increase in soil pH and an increase in negative charges in carboxylic and phenolic functional groups (ligand exchange) in soils after organic amendment could have resulted in the increased sorption of cations [18] and NH4+.

3.7. Difference in NO3 and C with Depth and Interaction of Differences

The nitrate concentration decreased with depth in all drainage classes of Min and BL pastures (Figure 2A), whereas C decreased with depth in the upper 15 cm, then tended to increase or remain stable with depth (Figure 2B). The change in NO3 and C concentrations with depth was analyzed to better understand if NO3 or C were being depleted either through emissions at the surface or leaching further into the soil, or were retained in place. The extent of change varied depending on fertilizer legacy and drainage class. An overall depletion with depth was indicated statistically, as can be seen in Figure 6; however, there were areas within each pasture that gained NO3 (green colors), and the amounts depleted varied depending on fertilization legacy and drainage class. For instance, in WD BL soils, the 0–5 to 5–10 cm losses were 1.6% of the NO3 in the 0–5 cm soil layer, while the loss from the WD Min 0–5 cm soil layer was 10.9%. Similarly, lower decreases were observed in BL compared to Min WD soils from the 5–10 cm layer to the 10–20 cm layer (BL = 15.1% and Min = 51.8%) and the 10–20 cm layer to the 20–40 cm layer (BL = 50% and Min = 67%) which indicates there was greater retention in the WD BL soil layer to a depth of 20 cm. A slightly greater depletion was observed between 20–40 cm and 40–60 cm in BL (46.3%) compared to Min (40.3%) pastures; otherwise, BL pastures (30%) showed a lower reduction between 40–60 cm and 60–90 cm compared to Min (48.7%) pastures. This is further supported by the greater NO3 in BL compared to Min soils between 10 to 90 cm of depth (Figure 2). The greater NO3 in BL compared to Min soils suggests the greater adsorption and greater anion exchange capacity (AEC) of BL compared to Min. Anion sorption was found to increase with an increased soil pH and resulted in increased NO3 retention [27,28]. AEC values of 0.67 cmol kg−1 at 20 to 60 cm depth and 1.35 cmol kg−1 at 60 to 163 cm depth in Cecil soils have been reported and were attributed to clay and Fe oxide contents in the soil profile [28]. Manganese and iron can behave similarly through biological and chemical oxidation to stabilize organic matter [29].
In WD soils, a decrease in C from the 0–5 cm layer to the 5–10 cm layer (BL = 39.3% and Min = 34.1%) and the 5–10 cm layer to the 10–20 cm layer (BL = 3.9% and Min = 2.8%) was observed, suggesting slightly greater decreases from BL compared to Min pastures. The slope of regression of NO3 difference on C difference between 0–5 cm and 5–10 cm was significant and positive (0.1) in BL pastures, suggesting a strong influence of the change in C on the change in NO3 in those near surface WD BL soil layers. At 20–40 cm depth, there was a sharp significant increase in C in comparison to the preceding layer in both BL (24.2%) and Min (27%) pastures and further significant increases were evident to 90 cm in BL and to 60 cm in Min pastures (Figure 6). When 10–20 cm and 20–40 cm soil layers are considered, the slope of regression of NO3 differences on C differences was significantly positive (0.11 mg kg−1; p < 0.1) for BL pastures, whereas it was significantly negative (−0.12 mg kg−1; p < 0.1) for Min pastures. While positive differences were observed with depth for BL compared to Min pastures between 40 and 90 cm (Figure 6), none were significant below 40 cm. The Argillic horizon in the Cecil series (soil series of our WD soils) ranged from 20 to 107 cm with clay content ranging from 35 to 60% [30]. Greater organic matter with greater soil clay content has been reported [31] and has been attributed to the chemical adsorption of organic matter to the mineral surface and physical protection due to soil aggregation [32,33]. While it is beyond the scope of this manuscript, more research is needed on the CEC/AEC ratio in these soils to discern the extent to which management influences AEC and CEC. Looking back at Figure 2, the soil pH is lower in the WD Min soils than in the WD BL soils, which may be the pH buffering capacity of BL. BL has more organic matter and has an abundance of calcium and other cations [2] suggesting that cation bridging may result in a greater number of positive charges in the soil and a greater retention of NO3 in WD BL soils. Below 30 cm, the greater amount of NO3 in WD soils compared to MWD soils (Figure 2) appeared to be driven by the greater C in WD soils. Iron oxides bind soil organic matter through several mechanisms (dissimilatory reduction, anion exchange, cation bridging, and ligand exchange). Fe compounds and Mn compounds play multiple roles in soil organic matter decomposition, destabilization, and retention (immobilized, precipitated, stabilized, bound, or protected) [13,29,34,35,36]. The decomposition of SOM or in our case C via dissimilatory reduction with either Fe or Mn (IV) is hindered in the presence of O2 and NO3. This may explain the amount of C in our WD soil, regardless of fertilizer legacy. While Cecil soil series do not often have large amounts of Mn, these soils are surrounded by mafic soils known to have Mn (Iredell) which are MWD soils.
In MWD soils, BL pastures showed less depletion of NO3 compared to Min pastures from the 0–5 cm layer to the 5–10 cm layer (BL = 12.5% and Min = 53.1%), the 5–10 cm layer to the 10–20 cm layer (BL = 31.5% and Min = 64.7%), and the 10–20 cm layer to the 20–40 cm layer (BL = 44% and Min = 55.2%). This pattern, however, flipped from the 20–40 cm layer to the 40–60 cm layer, where depletion in NO3 from BL pastures (56.4%) was observed and a gain in NO3 was noted in Min (9.3%) pastures. Significant depletions (>40%) in NO3 were evident from the 40–60 cm and the 60–90 cm layers in both BL and Min pastures. The depletion of NO3 may be due to a greater incidence of N gas emissions. A difference in the reduction/gain of NO3 with depth highlights the possibility of mechanisms of N loss varying with the draining capability of soils. While a larger draining capability can promote greater leaching of nitrate to deeper depths, it is likely that N losses due to emission dominate these pastures. Higher emissions of N2O from drainage-impeded soils compared to well-drained soils under grazed pastures have been reported in both spring and winter seasons [37]. Greater denitrification and N2O emission were reported with increasing water-filled pore space at congregation sites of cattle which were influenced by stock movements and uneven excreta-N deposition in previous years [37]. A slightly lower depletion of C from the 0–5 cm layer to the 5–10 cm soil layer was seen in BL (37.9%) compared to Min (40.2%) pastures. A decrease in C was observed from the 5–10 cm layer to the 10–20 cm layer in BL pastures (13.7%), while between the same layers, Min pastures showed a gain in C (9.5%). Below 20 cm C differences were positive, indicating an increase in C from each of the preceding sampling depths (Figure 6).

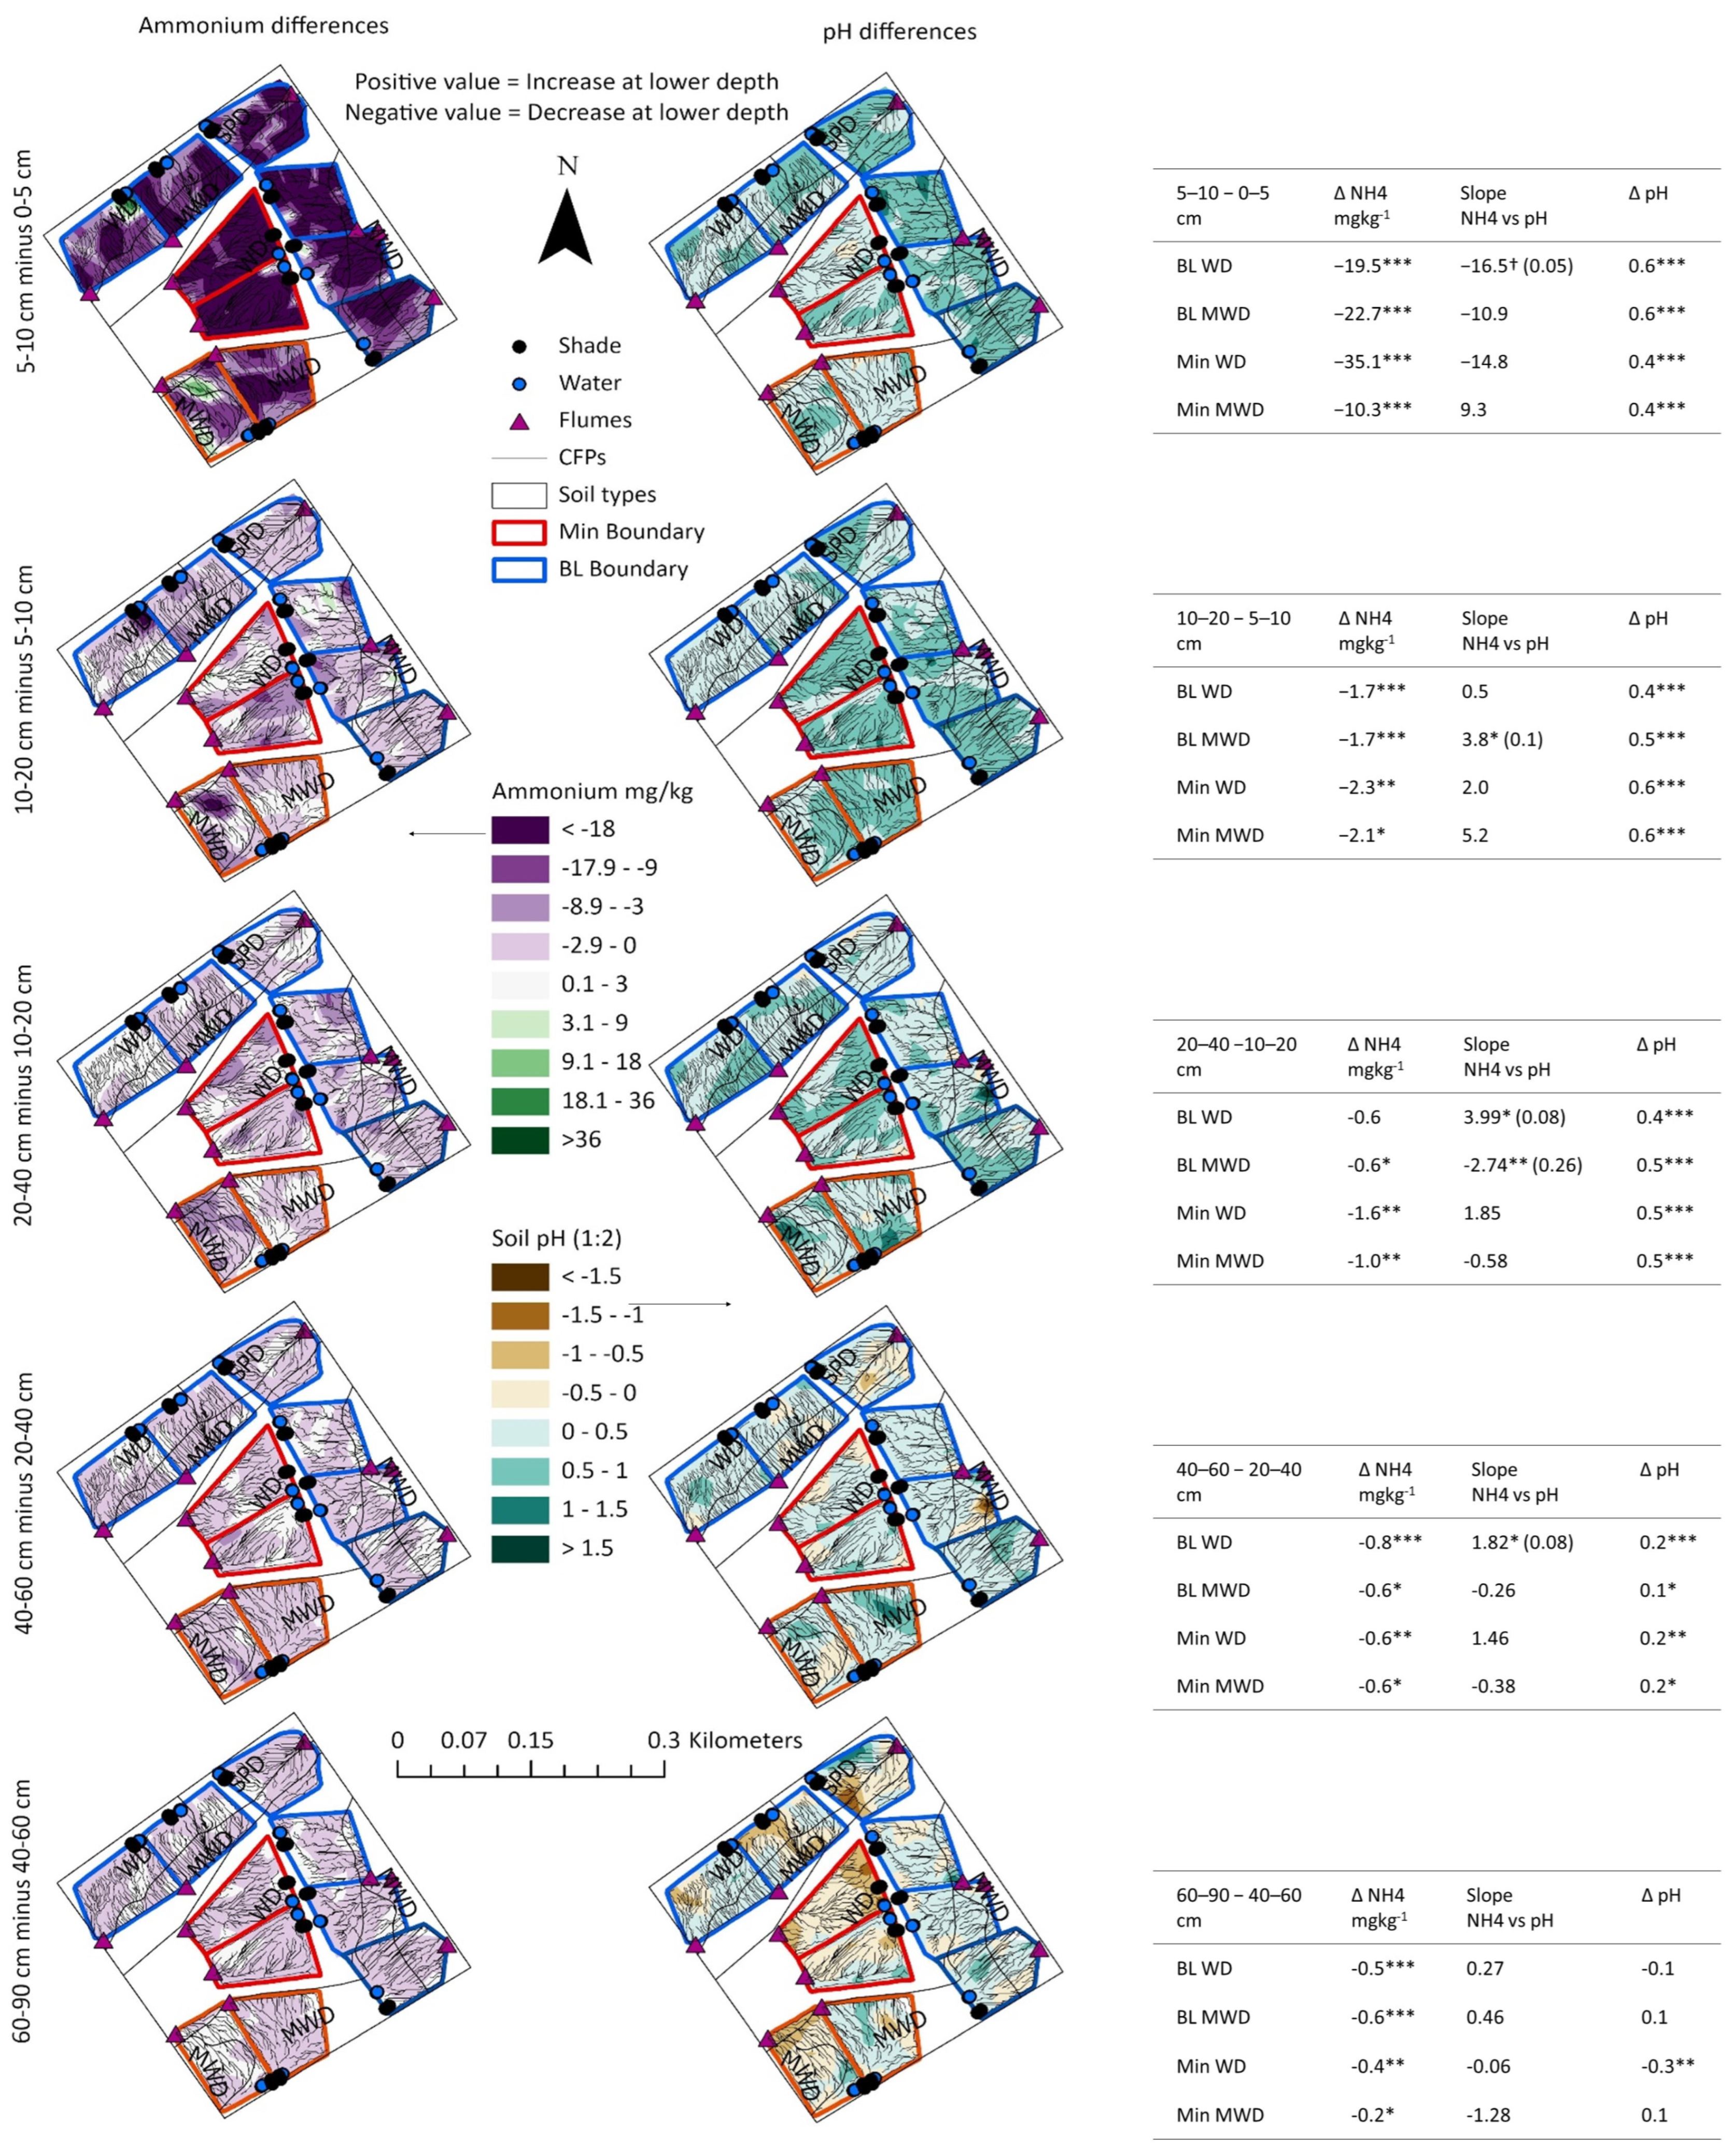
3.8. Difference in NH4+ and pH with Depth and Interaction of Differences

NH4+ differences analyzed between all depth pairs were significant and negative at p < 0.05, suggesting a decrease in NH4+ with depth, in both fertilization legacies regardless of drainage class (Figure 7). A study comparing highly weathered soils of the tropics [38] showed the greatest contribution of soil organic carbon to the total CEC in Ultisols on the surface, while clay was also a contributor to CEC in the sub-surface. Differences in NH4+ were greatest from a 0–5 cm depth to a 5–10 cm depth, suggesting significant ammonification occurring at the soil surface receiving organic matter input from plant residues and grazing animals. In WD soils, lower depletions in NH4+ were observed between all successive layers to a 90 cm soil depth in BL compared to Min pastures. In the 0–5 cm to the 5–10 cm soil layer of BL only, regression analysis of difference in pH vs difference of NH4+ showed that the change in pH had a significant (p < 0.052) negative (−16.5) relationship with change in NH4+, suggesting lower ammonification with increasing pH (Figure 7). Conversely, the slopes of regression of the relationship between pH difference and NH4+ difference in BL pastures were significant (p < 0.05) and positive for differences from 10–20 cm to 20–40 cm (3.99) and 20–40 cm to 40–60 cm (1.82). This suggests greater ammonification with a positive change in pH in BL pastures at 20–60 cm. We also observed greater NH4+ in WD BL pastures compared to WD Min pastures in 20–90 cm of depth (Figure 2).
In MWD soils, a greater depletion of NH4+ was observed from BL (83.9%) compared to Min (67.4%) pastures from the 0–5 cm soil layer to the 5–10 cm soil layer. In contrast, the 5–10 cm to 10–20 cm layer (BL = 39.6% and Min = 42.2%), 10–20 cm to 20–40 cm layer (BL = 18.9% and Min = 32.8%), and 20–40 cm to 40–60 cm layer (BL = 27.1% and Min =39.1%) BL pastures showed a lower depletion of NH4+ compared to Min pastures. Min pastures had significantly greater NH4+ at the surface compared to BL pastures (Figure 2). The relationship between pH difference and NH4+ difference was significant (p < 0.05) and positive (3.8) for the change from 5–10 cm to 10–20 cm, whereas the relationship was negative (−2.74) for the change from 10–20 cm to 20–40 cm (Figure 7) in BL pastures. The greater retention of C in BL at 40–90 cm depth compared to Min indicates a possibly greater cation exchange capacity (CEC) for the NH4+ and may also have a greater AEC for retention of NO3.

4. Conclusions

Beef cattle grazing is practiced throughout the Southern Piedmont region and nutrient efficiency relies greatly on the fertilization and liming of soil to make sure the required nutrients are available during peak forage growth. In soils (0 to 90 cm) fertilized with either broiler litter (BL) or mineral (Min) fertilizers, the NH4+, C, potentially mineralizable N (PMN), IN, and pH were predominately greater in BL pastures when only considering fertilizer legacy. Soil pH and carbon were often major driving factors for observed greater soil nitrogen. Below 5 cm, the greater amount of soil NO3 was likely a result of greater N-mineralization/immobilization turnover rates and potentially increased rates of nitrification in the BL pastures, and the subsequent retention of nitrate may have been a result of cation-bridging/anion exchange capacity facilitated by the additional cations found in broiler litter. The greater retention of NH4+ could have resulted from increased carboxylic and phenolic functional groups which favor greater amounts of negative charges in the soils and thus greater CEC. The greater availability of soil carbon along with available N and the potential of N mineralization in BL pastures indicate that if considering the amount of N available in the soil when determining N fertilization rates (amount needed − amount available = amount applied), historically, BL fertilized pastures would require less N. These differences did not hold true when comparisons were made with consideration of drainage class.
A variation in drainage classes of soils under beef cattle grazing can be expected given there are ~4 million hectares used for pastures and hay in the state of Georgia (UGA extension), and soils throughout the Southern Piedmont, USA, are similar. This study found that soil drainage class can influence soil C and N differently given differences in the availability of O2, oxidation-reduction states of metal oxides, moisture status, legacy nutrients, and temperature, as suggested in the literature. When considering fertilizer legacy and drainage class, the retention of C and N varied depending on depth. Below 30 cm, the greater amount of NO3 in well-drained (WD) soils compared to MWD soils was aided by the greater amount of C in WD soils.
In WD Min pastures, PMN was greater at the surface (0–5 cm). In WD BL pastures, PMN was greater in the 40–90 cm layers and IN and NO3 were greater in the 10–90 cm layers. In moderately well-drained (MWD) soils, NO3 was significantly greater in BL than in Min pastures at all depths and had 0.1 and 0.2 units greater PMN and IN, respectively, for a unit increase in C. This highlights the importance of including drainage classes in guiding management decisions like fertilizer application and liming to fulfill the N requirement of forages to maintain productivity. The presence of iron oxides in the well-drained soils and the presence of iron and manganese oxides in moderately well-drained soils could have resulted in the greater retention of soil carbon in well-drained soils, favoring the oxidation and precipitation of Fe-oxides and the protection of soil carbon. We have highlighted the possible roles of Fe compounds and Mn compounds in soil organic matter decomposition, destabilization, and retention. Greater retention could have been the result of the immobilization, precipitation, stabilization, or protection of organic carbon and associated organic N.
These observed significant differences in carbon and nitrogen between diverse fertilization legacies (BL and Min) and drainage classes (WD and MWD) support the need for different fertilization recommendations or nutrient management plans to take into account drainage class and fertilization legacy. As an example, greater mineralization of nitrogen in WD BL soils would require less N input depending on initial soil carbon which would result in less N applied, saving producer resources.

Author Contributions

Conceptualization, D.F.; methodology, D.F., M.C., A.S., L.S., C.W. and D.P.; validation, D.F., M.C., N.G. and D.P.; formal analysis, A.S. and D.F.; investigation, A.S., D.F. and N.E.; resources, D.F. and M.C.; data curation, A.S. and D.F.; writing—A.S.; writing—review and editing, D.F., M.C., N.G. and D.P.; visualization, A.S., D.F. and N.E.; supervision, D.F. and M.C.; project administration, D.F. and L.S.; funding acquisition, D.F. and M.C. All authors have read and agreed to the published version of the manuscript.

Funding

This research received no external funding; however, it did receive funding from the College of Agricultural and Environmental Sciences, University of Georgia.

Institutional Review Board Statement

This animal soil system study was approved by University of Georgia, Institutional Animal Care and Use Committee (IACUC AUP# A2022 07-022).

Informed Consent Statement

Not applicable.

Data Availability Statement

The data presented in this study are available on request from the corresponding author as we are seeking funding and the repository for data is uncertain.

Acknowledgments

We would like to thank the support staff at the Eatonton Beef Research Unit, University of Georgia for their help in caring, feeding, and the management of the participating heifers.

Conflicts of Interest

The authors declare no conflicts of interest.

References

  1. Marshall, S.B.; Mullen, M.D.; Cabrera, M.L.; Wesley Wood, C.; Braun, L.C.; Guertal, E.A. Nitrogen budget for fescue pastures fertilized with broiler litter in major land resource areas of the southeastern US. Nutr. Cycl. Agroecosystems 2001, 59, 75–83. [Google Scholar] [CrossRef]
  2. Ashworth, A.J.; Chastain, J.P.; Moore, P.A., Jr. Nutrient characteristics of poultry manure and litter. Anim. Manure Prod. Charact. Environ. Concerns Manag. 2020, 67, 63–87. [Google Scholar]
  3. Kingery, W.L.; Wood, C.W.; Delaney, D.P.; Williams, J.C.; Mullins, G.L. Impact of long-term land application of broiler litter on environmentally related soil properties. J. Environ. Qual. 1994, 23, 139–147. [Google Scholar] [CrossRef]
  4. United States Department of Agriculture, NASS Southern Region. Poultry—Production and Value. 2023 Summary. 2024. Available online: https://downloads.usda.library.cornell.edu/usda-esmis/files/m039k491c/b2775j31b/9k4213149/plva0424.pdf (accessed on 13 June 2024).
  5. Luxhøi, J.; Elsgaard, L.; Thomsen, I.K.; Jensen, L.S. Effects of long-term annual inputs of straw and organic manure on plant N uptake and soil N fluxes. Soil Use Manag. 2007, 23, 368–373. [Google Scholar] [CrossRef]
  6. He, Z.; Tazisong, I.A.; Senwo, Z.N.; Zhang, D. Soil properties and macro cations status impacted by long-term applied poultry litter. Commun. Soil Sci. Plant Anal. 2008, 39, 858–872. [Google Scholar] [CrossRef]
  7. Franzluebbers, A.J.; Stuedemann, J.A. Soil-profile organic carbon and total nitrogen during 12 years of pasture management in the Southern Piedmont USA. Agric. Ecosyst. Environ. 2009, 129, 28–36. [Google Scholar] [CrossRef]
  8. Lin, X.; Yu, S.; Yang, D.; Hutchins, M.G.; Ding, J.; Hong, B.; Chen, P.; Liu, X. Discriminating surface soil inorganic nitrogen cycling under various land uses in a watershed with simulations of energy balanced temperature and slope introduced moisture. J. Hydrol. 2020, 587, 124950. [Google Scholar] [CrossRef]
  9. Soil Survey Staff. Soil Survey Manual. Agricultural Handbook, No. 18; US Department of Agriculture-Soil Conservation Service, US Government Printing Office: Washington DC, USA, 1993.
  10. IUSS Working Group WRB. World Reference Base for Soil Resources 2014, Update 2015 International Soil Classification System for Naming Soils and Creating Legends for Soil Maps; World Soil Resources Reports No. 106; FAO: Rome, Italy, 2015. [Google Scholar]
  11. Ghani, A.; Müller, K.; Dodd, M.; Mackay, A. Dissolved organic matter leaching in some contrasting New Zealand pasture soils. Eur. J. Soil Sci. 2010, 61, 525–538. [Google Scholar] [CrossRef]
  12. Murphy, N.P.; Furman, A.; Moshe, S.B.; Dahlke, H.E. Comparison of reactive transport and non-equilibrium modeling approaches for the estimation of nitrate leaching under large water application events. J. Hydrol. 2024, 628, 130583. [Google Scholar] [CrossRef]
  13. Chen, C.; Hall, S.J.; Coward, E.; Thompson, A. Iron-mediated organic matter decomposition in humid soils can counteract protection. Nat. Commun. 2020, 11, 2255. [Google Scholar] [CrossRef]
  14. Teague, R.; Kreuter, U. Managing grazing to restore soil health, ecosystem function, and ecosystem services. Front. Sustain. Food Syst. 2020, 4, 534187. [Google Scholar] [CrossRef]
  15. Mian, I.A.; Riaz, M.; Cresser, M.S. The importance of ammonium mobility in nitrogen-impacted unfertilized grasslands: A critical reassessment. Environ. Pollut. 2009, 157, 1287–1293. [Google Scholar] [CrossRef] [PubMed]
  16. Sahrawat, K.L. Factors affecting nitrification in soils. Commun. Soil Sci. Plant Anal. 2008, 39, 1436–1446. [Google Scholar] [CrossRef]
  17. Steiner, C.; Teixeira, W.G.; Lehmann, J.; Nehls, T.; de Macêdo, J.L.V.; Blum, W.E.; Zech, W. Long term effects of manure, charcoal and mineral fertilization on crop production and fertility on a highly weathered Central Amazonian upland soil. Plant Soil 2007, 291, 275–290. [Google Scholar] [CrossRef]
  18. Miller, J.; Beasley, B.; Drury, C.; Larney, F.; Hao, X. Influence of long-term application of composted or stockpiled feedlot manure with straw or wood chips on soil cation exchange capacity. Compost. Sci. Util. 2016, 24, 54–60. [Google Scholar] [CrossRef]
  19. Cabrera, M.L. Personal Communication; University of Georgia: Athens, GA, USA, 2020. [Google Scholar]
  20. Burt, R. Soil Survey Laboratory Methods Manual. In Soil Survey Investigations Report No. 42, Version 4.0; Natural Resources Conservation Service, United States Department of Agriculture: Washington, DC, USA, 2004. [Google Scholar]
  21. Doane, T.A.; Horwáth, W.R. Spectrophotometric determination of nitrate with a single reagent. Anal. Lett. 2003, 36, 2713–2722. [Google Scholar] [CrossRef]
  22. Kempers, A.J.; Zweers, A. Ammonium determination in soil extracts by the salicylate method. Commun. Soil Sci. Plant Anal. 1986, 17, 715–723. [Google Scholar] [CrossRef]
  23. Fu, M.H.; Xu, X.C.; Tabatabai, M.A. Effect of pH on nitrogen mineralization in crop-residue-treated soils. Biol. Fertil. Soils 1987, 5, 115–119. [Google Scholar] [CrossRef]
  24. Donn, M.J.; Menzies, N.W. Simulated rainwater effects on anion exchange capacity and nitrate retention in Ferrosols. Soil Res. 2005, 43, 33–42. [Google Scholar] [CrossRef]
  25. Feder, F.; Oliver, R.; Rakotoarisoa, J.; Muller, B.; Scopel, E. Geochemical properties of variable charge soil explain the low nitrogen bioavailability. Commun. Soil Sci. Plant Anal. 2020, 51, 2022–2037. [Google Scholar] [CrossRef]
  26. Hingston, F.J. A review of anion adsorption. In Adsorption of Inorganics at Solid-Liquid Interfaces; Anderson, M.A., Robin, A.J., Eds.; Ann Arbor Science Publishing: Ann Arbor, MI, USA, 1981; pp. 51–90. [Google Scholar]
  27. Spark, D.L. Sorption Phenomena on Soils. In Environmental Soil Chemistry, 2nd ed.; Academic Press: San Diego, CA, USA, 2003; Volume 5, pp. 133–186. [Google Scholar]
  28. Toner, C.V., IV; Sparks, D.L.; Carski, T.H. Anion exchange chemistry of Middle Atlantic soils: Charge properties and nitrate retention kinetics. Soil Sci. Soc. Am. J. 1989, 53, 1061–1067. [Google Scholar] [CrossRef]
  29. Li, H.; Santos, F.; Butler, K.; Herndon, E. A critical review on the multiple roles of manganese in stabilizing and destabilizing soil organic matter. Environ. Sci. Technol. 2021, 55, 12136–12152. [Google Scholar] [CrossRef] [PubMed]
  30. Soil Survey Staff, Natural Resources Conservation Service, United States Department of Agriculture. Official Soil Series Descriptions. Available online: https://soilseries.sc.egov.usda.gov/OSD_Docs/C/CECIL.html (accessed on 8 February 2024).
  31. Prout, J.M.; Shepherd, K.D.; McGrath, S.P.; Kirk, G.J.; Haefele, S.M. What is a good level of soil organic matter? An index based on organic carbon to clay ratio. Eur. J. Soil Sci. 2021, 72, 2493–2503. [Google Scholar] [CrossRef]
  32. Strong, D.T.; Sale, P.W.G.; Helyar, K.R. The influence of the soil matrix on nitrogen mineralisation and nitrification. IV. Texture. Soil Res. 1999, 37, 329–344. [Google Scholar] [CrossRef]
  33. Sissoko, A.; Kpomblekou, A.K. Carbon decomposition in broiler litter-amended soils. Soil Biol. Biochem. 2010, 42, 543–550. [Google Scholar] [CrossRef]
  34. Gu, B.; Doner, H.E. Adsorption of hydroxy-Al polycations and destabilization of illite and montmorillonite suspensions. Clays Clay Miner. 1990, 38, 493–500. [Google Scholar] [CrossRef]
  35. Rasmussen, C.; Heckman, K.; Wieder, W.R.; Keiluweit, M.; Lawrence, C.R.; Berhe, A.A.; Blankinship, J.C.; Crow, S.E.; Druhan, J.L.; Hicks Pries, C.E.; et al. Beyond clay: Towards an improved set of variables for predicting soil organic matter content. Biogeochemistry 2018, 137, 297–306. [Google Scholar] [CrossRef]
  36. Johnson, K.; Purvis, G.; Lopez-Capel, E.; Peacock, C.; Gray, N.; Wagner, T.; März, C.; Bowen, L.; Ojeda, J.; Finlay, N.; et al. Towards a mechanistic understanding of carbon stabilization in manganese oxides. Nat. Commun. 2015, 6, 7628. [Google Scholar] [CrossRef]
  37. Saggar, S.; Adhikari, K.; Giltrap, D.; Luo, J.; Palmada, T.; Berben, P.; Lindsey, S.; Sprosen, M. Improving the accuracy of nitrous oxide emission factors estimated for hotspots within dairy-grazed farms. Sci. Total Environ. 2022, 806, 150608. [Google Scholar] [CrossRef]
  38. Soares, M.R.; Alleoni, L.R.F. Contribution of soil organic carbon to the ion exchange capacity of tropical soils. J. Sustain. Agric. 2008, 32, 439–462. [Google Scholar] [CrossRef]
Figure 1. Study location at Eatonton showing broiler litter (BL; blue boundaries) and mineral fertilizer (Min; red boundaries) pastures with soil sampling locations (black circles), shades (dark-gray squares), waterers (light-blue circles), concentrated-flow-paths (CFPs; black thin lines), flumes (red triangles), and soil series present. Drainage classes are labelled well drained (WD), moderately well drained (MWD), and somewhat-poorly drained (SPD).
Soilsystems 08 00085 g001
Figure 2. (A). Nitrate (NO3), (B). loss-on-ignition (C) carbon, (C). ammonium (NH4+), and (D). soil/water (1:2) pH from 0 to 90 cm of soil compared between broiler litter (BL; circles) and mineral fertilizer (Min; triangles) pastures in well-drained (WD; dark red and black), moderately well-drained (MWD; red and gray), and somewhat-poorly drained (SPD; light red) drainage classes. NH4+ in the 0–5 cm layer (35.9 mg kg−1) is not shown in Figure (C) to make NO3 and NH4+ comparison easier. The light purple dotted line at 15 cm and the red dotted line at 30 cm represent the depths at which manganese concretions and/or redoximorphic features were observed in SPD and MWD drainage classes, respectively.
Soilsystems 08 00085 g002
Figure 3. (A). Potentially mineralizable nitrogen (PMN), and (B). inorganic nitrogen (IN = NO3 + NH4) from 0 to 90 cm of soil compared between broiler litter (BL; circles) and mineral fertilizer (Min; triangles) pastures in well-drained (WD; dark red and black), moderately well-drained (MWD; red and gray), and somewhat-poorly drained (SPD; light red) drainage classes. The light purple dotted line at 15 cm and the red dotted line at 30 cm represent the depths at which manganese concretions and/or redoximorphic features were observed in SPD and MWD drainage classes, respectively. Drainage classes are labelled well drained (WD), moderately well drained (MWD), and somewhat-poorly drained (SPD).
Soilsystems 08 00085 g003
Figure 4. Regression of inorganic N (IN) and potentially mineralizable N (PMN) on loss-on-ignition C (C) compared between broiler litter (BL) and mineral (Min) fertilization legacies in well-drained (WD; (A,C)) and moderately well-drained (MWD; (B,D)) soils to a depth of 90 cm. Symbols *, **, and *** for each drainage class denote statistically different slopes of regression between BL and Min pastures at 0.05, 0.01, and 0.001 levels of significance, respectively. Drainage classes are labelled well drained (WD), moderately well drained (MWD), and somewhat-poorly drained (SPD).
Soilsystems 08 00085 g004
Figure 5. Regression of nitrate (NO3) and ammonium (NH4+) on soil pH compared between broiler litter (BL) and mineral (Min) fertilization legacies in well-drained (WD; A,C)) and moderately well-drained (MWD; B,D) soils to a depth of 90 cm. *, **, and *** for each drainage class denote statistically different slopes of regression between BL and Min pastures at 0.05, 0.01, and 0.001 levels of significance, respectively. Drainage classes are labelled well drained (WD), moderately well drained (MWD), and somewhat-poorly drained (SPD).
Soilsystems 08 00085 g005
Figure 6. Spatial distribution of differences in nitrate (NO3) and loss-on-ignition (C) carbon with depth and relationship of differences. Symbols †, *, **, and *** represent statistical significance at 0.1, 0.05, 0.01, and 0.001 levels of significance, respectively. Drainage classes are labelled well drained (WD), moderately well drained (MWD), and somewhat-poorly drained (SPD).
Soilsystems 08 00085 g006
Figure 7. Spatial distribution of differences in ammonium (NH4+) and soil pH with depth and relationship of differences. Symbols †, *, **, and *** represent statistical significance at 0.1, 0.05, 0.01, and 0.001 levels of significance, respectively. Drainage classes are labelled well drained (WD), moderately well drained (MWD), and somewhat-poorly drained (SPD).
Soilsystems 08 00085 g007
Table 1. Pasture unit acreages, fertilization legacies, and number of soil samples in drainage classes a well drained (WD), moderately well drained (MWD), and somewhat-poorly drained (SPD).
PasturesPasture Area (m2)Fertilization LegacyNumber of Samples (WD/MWD/SPD)
P17891Broiler Litter15 (11/4/0)
P27878Broiler Litter15 (6/5/4)
P37106Broiler Litter16 (4/3/9)
P47004Broiler Litter18 (15/3/0)
P57124Broiler Litter16 (8/8/0)
P67188Broiler Litter16 (0/16/0)
BL Total 96 (44/39/13)
P77800Mineral Fertilizer15 (15/0/0)
P87579Mineral Fertilizer17 (17/0/0)
P97753Mineral Fertilizer17 (0/17/0)
P107648Mineral Fertilizer15 (3/12/0)
Min Total 64 (35/29/0)
Table 2. Drainage classes with depth to water table and redoximorphic features [9] and observed depth to concretions and mottles at Water Quality pastures at Eatonton.
Drainage ClassesDepth to Water TableDepth to Redoximorphic FeaturesDepth to Concretions at WQPs
Well drainedMore than 150 cmNo redoximorphic features due to good aerationNot available at 90 cm sampling depth
Moderately well drained75 cm to 150 cm30 to 150 cmFew to common concretions at 30 cm
Somewhat-poorly drained50 cm to 75 cm15 cm to 75 cmFew to common concretions at 15 cm
Table 3. Median nitrate (NO3), ammonium (NH4), and soil pH (1:2 soil/water) in broiler litter (BL) and mineral (Min) pastures in 0.9 m soil cores.
Soil DepthBL NO3Min NO3BL NH4+Min NH4+BL Soil pHMin Soil pH
---cm------mg NO3-N kg−1 Soil------mgNH4-N kg−1 Soil------(1 Soil:2 H2O)---
0–518.4 (0.4) A1a19.0 (0.6) Aa18.3 (1.7) Ab23.7 (2.5) Aa5.0 (0.0) Ea4.8 (0.0) Fb
5–1018.1 (0.5) Aa14.5 (0.8) Bb 3.8 (0.4) Ba3.2 (0.5) Ba5.6 (0.0) Da5.2 (0.0) Eb
10–2011.8 (0.5) Ba4.5 (0.6) Cb2.8 (0.2) Ca2.4 (0.2) Ca6.1 (0.0) Ca5.8 (0.0) Db
20–405.3 (0.5) Ca1.0 (0.5) Db2.6 (0.2) Ca1.8 (0.2) Db6.5 (0.0) Ba6.3 (0.1) Cb
40–602.3 (0.4) Da0.5 (0.4) Eb2.0 (0.1) Da1.0 (0.1) Eb6.7 (0.1) Aa6.5 (0.1) Bb
60–901.4 (0.3) Ea0.4 (0.2) Eb1.2 (0.1) Ea0.8 (0.1) Fb6.7 (0.1) Aa6.4 (0.1) Ab
Range (0–90)0–33.20–34.30–87.40–108.74.3–8.14.2–7.6
1 Different upper-case letters denote significant differences (p < 0.05) between depths within broiler litter (BL) or mineral (Min) fertilized pastures. Within each depth, different lower-case letters denote significant differences (p < 0.05) between broiler litter (BL) and mineral (Min) fertilized pastures. Values in parentheses are the standard error of means.
Table 4. Median loss-on-ignition (C) carbon, inorganic N (IN = NO3 + NH4), and potentially mineralizable N (PMN) in broiler litter (BL) and mineral (Min) pastures in 0.9 m soil layer.
Soil DepthBL C Min C BL INMin INBL PMNMin PMN
---cm------g C kg−1------mg IN kg−1 Soil------mg N kg−1---
0–599.0 (2.2) A1a82.8 (2.6) Ab36.4 (1.6) Aa40.7 (2.8) Aa37.1 (1.5) Ab44.1 (1.7) Aa
5–1058.9 (1.3) Da53.8 (1.9) Cb22.0 (0.6) Ba20.7 (1.0) Ba19.1 (0.5) Ba16.3 (0.7) Bb
10–2054.9 (1.4) Ea55.8 (2.3) Ca15.4 (0.5) Ca8.5 (0.6) Cb11.0 (0.3) Ca9.0 (0.4) Cb
20–4066.1 (2.5) Ca78.5 (3.4) Ba8.7 (0.6) Da3.6 (0.5) Db6.6 (0.3) Da4.6 (0.4) Db
40–6080.8 (2.3) Ba80.2 (3.6) Ba4.5 (0.4) Ea2.0 (0.4) Eb2.7 (0.2) Ea2.4 (0.3) Ea
60–9087.3 (2.4) Ba81.9 (3.7) Ba3.2 (0.3) Fa1.3 (0.2) Fb1.6 (0.2) Fa1.1 (0.3) Fb
Range (0–90)10.3–214.715.7–166.40.4–107.80.2–137.00–127.20–89.3
1 Different upper-case letters denote significant differences (p < 0.05) between depths within broiler litter (BL) or mineral (Min) fertilized pastures. Within each depth, different lower-case letters denote significant differences (p < 0.05) between broiler litter (BL) and mineral (Min) fertilized pastures. The symbol † denotes significance at p > 0.05 and < 0.1. Values in parentheses are the standard error of means.
Disclaimer/Publisher’s Note: The statements, opinions and data contained in all publications are solely those of the individual author(s) and contributor(s) and not of MDPI and/or the editor(s). MDPI and/or the editor(s) disclaim responsibility for any injury to people or property resulting from any ideas, methods, instructions or products referred to in the content.

