Article

Cowpea (Vigna unguiculata) Water Relations, Growth, and Productivity as Affected by Salinity in Two Soils with Contrasting Mineralogies

by
Jaciane Rosa Maria de Souza
1,
Lucas Yago de Carvalho Leal
1,
Martha Katharinne Silva Souza Paulino
1,
José Alfredo Nunes
1,
Rafael Luís Silva de Medeiros
1,
Monaliza Alves dos Santos
1,
Cintia Maria Teixeira Lins
1,
Valdomiro Severino de Souza Júnior
1,
Bruce Schaffer
2 and
Edivan Rodrigues de Souza
1,*
1
Department of Agronomy, Federal Rural University of Pernambuco, Dois Irmãos, Recife 52171-900, Brazil
2
Tropical Research and Education Center, University of Florida, Homestead, FL 33031, USA
*
Author to whom correspondence should be addressed.
Soil Syst. 2025, 9(2), 36; https://doi.org/10.3390/soilsystems9020036
Submission received: 21 March 2025 / Revised: 15 April 2025 / Accepted: 17 April 2025 / Published: 21 April 2025

Abstract

:
Soil salinity affects crop growth and production, especially in arid and semi-arid regions of the world. The interactions between salt ions and soil particles vary depending on soil texture, mineralogy, and ion composition. The relationship between soil ions and particles and the effects of this interaction on crop plants remains underexplored. This study evaluated the plant water relations, growth, and yield of cowpea (Vigna unguiculata) as affected by the salinity of the irrigation water in two different soil types with varying weathering levels and contrasting mineralogies. The treatments consisted of six salinity levels based on the electrical conductivity (EC) of the irrigation water (0, 1.5, 3, 4, 5, 6.0, or 9 dS m−1) and were tested in Ultisol (well-weathered soil) and Alfisol (less-weathered soil). The experiment was conducted over 80 days with 4 repetitions. The results showed that the plant salinity tolerance, growth, and yield in response to salinity varied depending on the soil type. Irrigation with saline water exceeding an EC of 3 dS m−1 completely halted cowpea production in Ultisol, whereas in Alfisol, production ceased at an EC above 6 dS m−1. Although it accumulates more salts under saline irrigation, Alfisol promotes better cowpea growth and yield than Ultisol.

1. Introduction

Among the various types of soil degradation, salinity is considered the second most significant, surpassed only by soil erosion [1]. Soil salinity affects 833 million hectares worldwide, with 10% of these areas being used for cultivation, making it a major environmental challenge [2].
In Brazil, the northeast region has the highest incidence of salt-affected soils, primarily due to conditions that favor or accelerate soil salinization, such as irregular rainfall and high evapotranspiration rates. These factors contribute to salt accumulation, particularly in the upper soil layers. Additionally, poorly weathered soils, drainage issues, and the use of saline water for irrigation further exacerbate soil salinization [3,4].
High concentrations of soluble salts in the soil directly affect plant growth. Initially, as a rapid response to high soil salinity, osmotic pressure in the soil solution increases, reducing water absorption by plant roots. Prolonged exposure to salt stress leads to ion toxicity caused by high concentrations of Na+ and Cl in the aerial parts of the plants [5,6,7].
Plant responses to salinity depend not only on salt concentration in the soil solution, ion composition, tolerance levels, and phenological stage but also on soil characteristics such as texture and mineralogy. Crops grown in coarse-textured soils, which retain less water than fine-textured soils, are more susceptible to drought stress. Conversely, crops cultivated in fine-textured soils with high water retention capacities are more prone to physiological stress caused by specific ionic effects, resulting in significant yield declines [8].
Plants respond differently to salinity in soils with distinct mineralogical compositions. Soils with a high specific surface area and predominantly 2:1 clay minerals can increase the soil’s total water potential through the matric component, salinizing and retaining more water in the soil. The inverse occurs in plants grown in soils dominated by 1:1 minerals [9]. However, there is a dearth of information in the literature about how soil minerology affects the cultivation of commercially important crops such as cowpea under salinity stress.
Cowpea (Vigna unguiculata L.) is a leguminous species of African origin that thrives in arid and semi-arid regions. It serves as an important source of protein and carbohydrates and provides income for smallholder farmers [10]. Global production of dry cowpea seeds is about 5.4 million tons annually. The species exhibits moderate tolerance to various abiotic stresses, including salt stress, a result of physiological mechanisms that regulate stress and support plant growth and development [7,11,12]. This study aimed to evaluate the water relations, growth, and yield of cowpea plants in response to soil salinity in two different soil types with varying weathering levels and contrasting mineralogies. Understanding the effects of salinity on water relations as well as growth and development of cowpea in different soils will contribute to expanding the knowledge of its salt tolerance and aid in optimizing irrigation management with saline water.

2. Materials and Methods

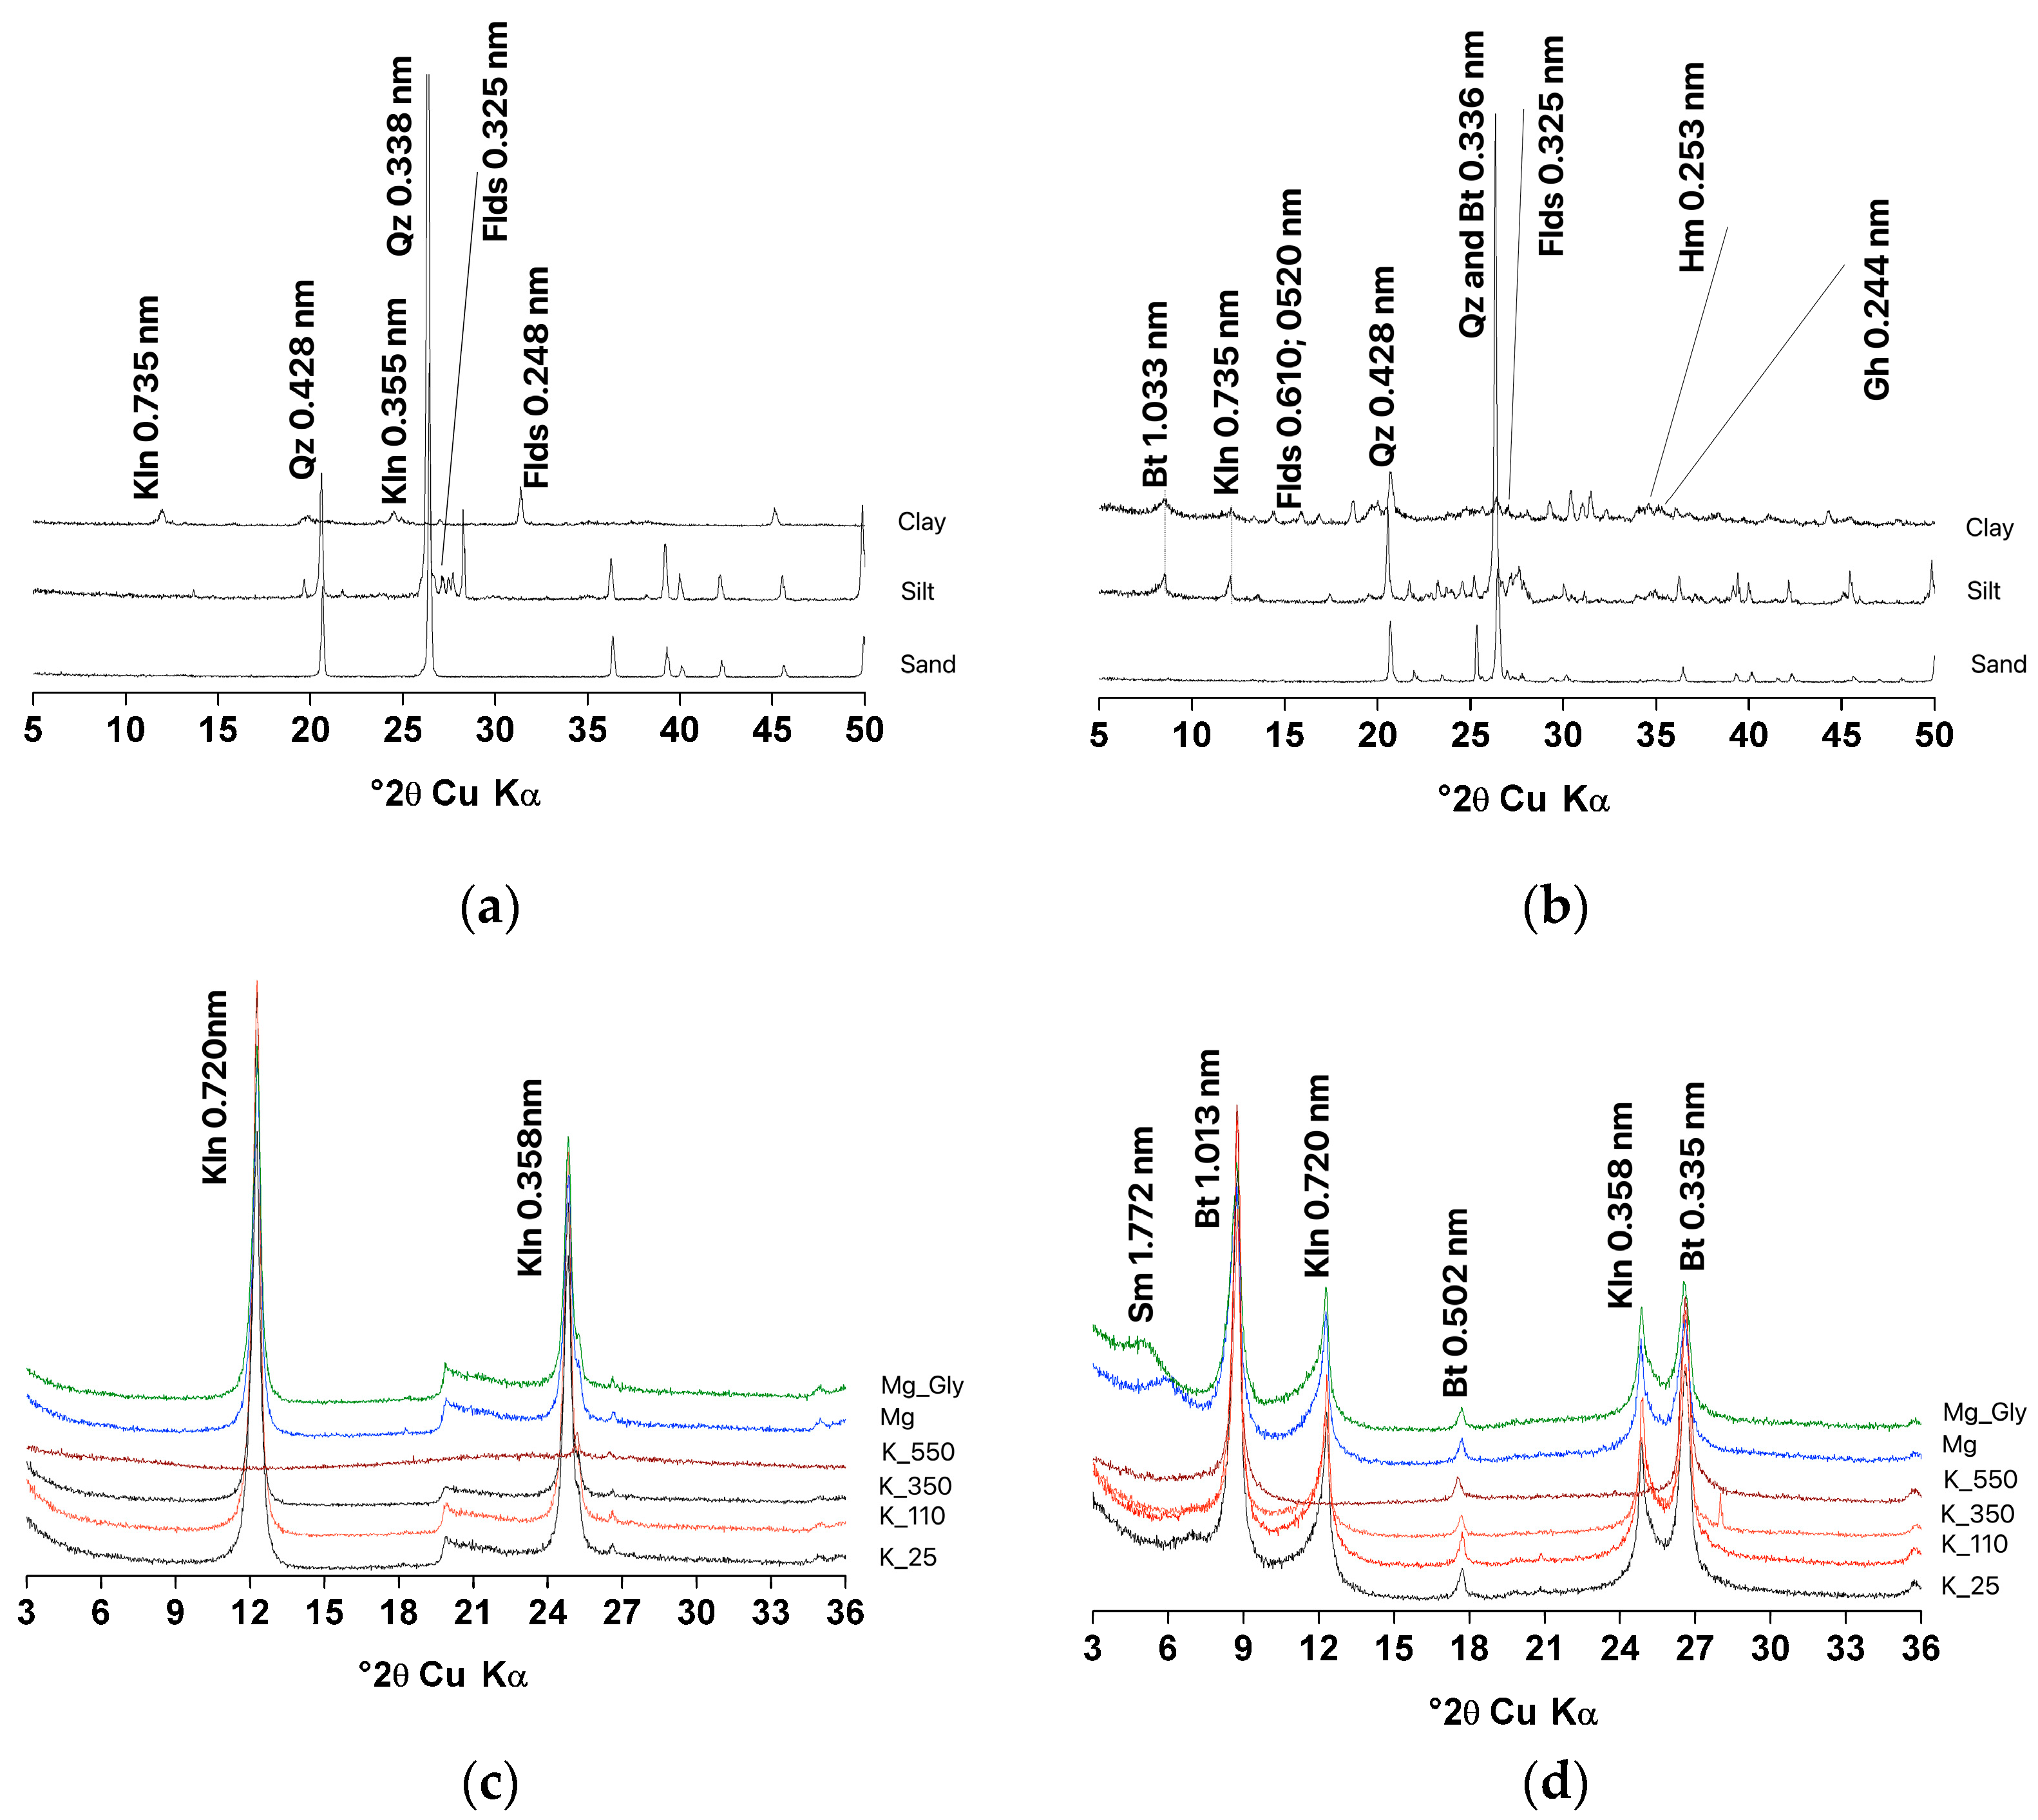
2.1. Soil Collection and Characterization

The soils used in this study were collected in the state of Pernambuco, in the municipalities of Goiana, located in the coastal region of the state, and Belém do São Francisco, in the semi-arid hinterland of Pernambuco (Figure 1).
Soil samples were collected from two soil profiles belonging to different orders and with different mineralogies and distinct weathering levels: a Ultisol and an Alfisol (Table 1).
The soil samples were air-dried, crushed, and sieved through a 4 mm mesh to maintain their microaggregation, and then stored until the experiment was set up. For chemical and physical analyses, subsamples were collected, sieved through a 4 mm mesh, and evaluated according to the methodology described by Teixeira et al. [16] (Table 2).
The mineralogical characterization of sand, silt, and clay fractions from both soils was determined using X-ray diffraction (XRD) in the form of unoriented powder, operating with Cu Kα radiation at a speed of 1° min−1 (2θ) recording a range of 5 to 50° (2θ) (Figure 2a,b). The clay fraction was separated by sedimentation, and then dried in an oven at 60 °C, ground using an agate mortar and pestle, and passed through a 100-mesh sieve. The interpretation and identification of the diffraction patterns of the minerals in the sand and clay fractions were based on diffraction peaks obtained through thermal and saturation treatments as well as interplanar spacing (d) [17,18,19] (Figure 2).
Diffraction peaks of smectite (1.772 nm), biotite (1.013 nm), and kaolinite (0.720 nm) were identified in the fine clay fraction of the Alfisol, whereas only kaolinite (0.720 nm; 0.358 nm) was detected in the fine clay fraction of the Ultisol.

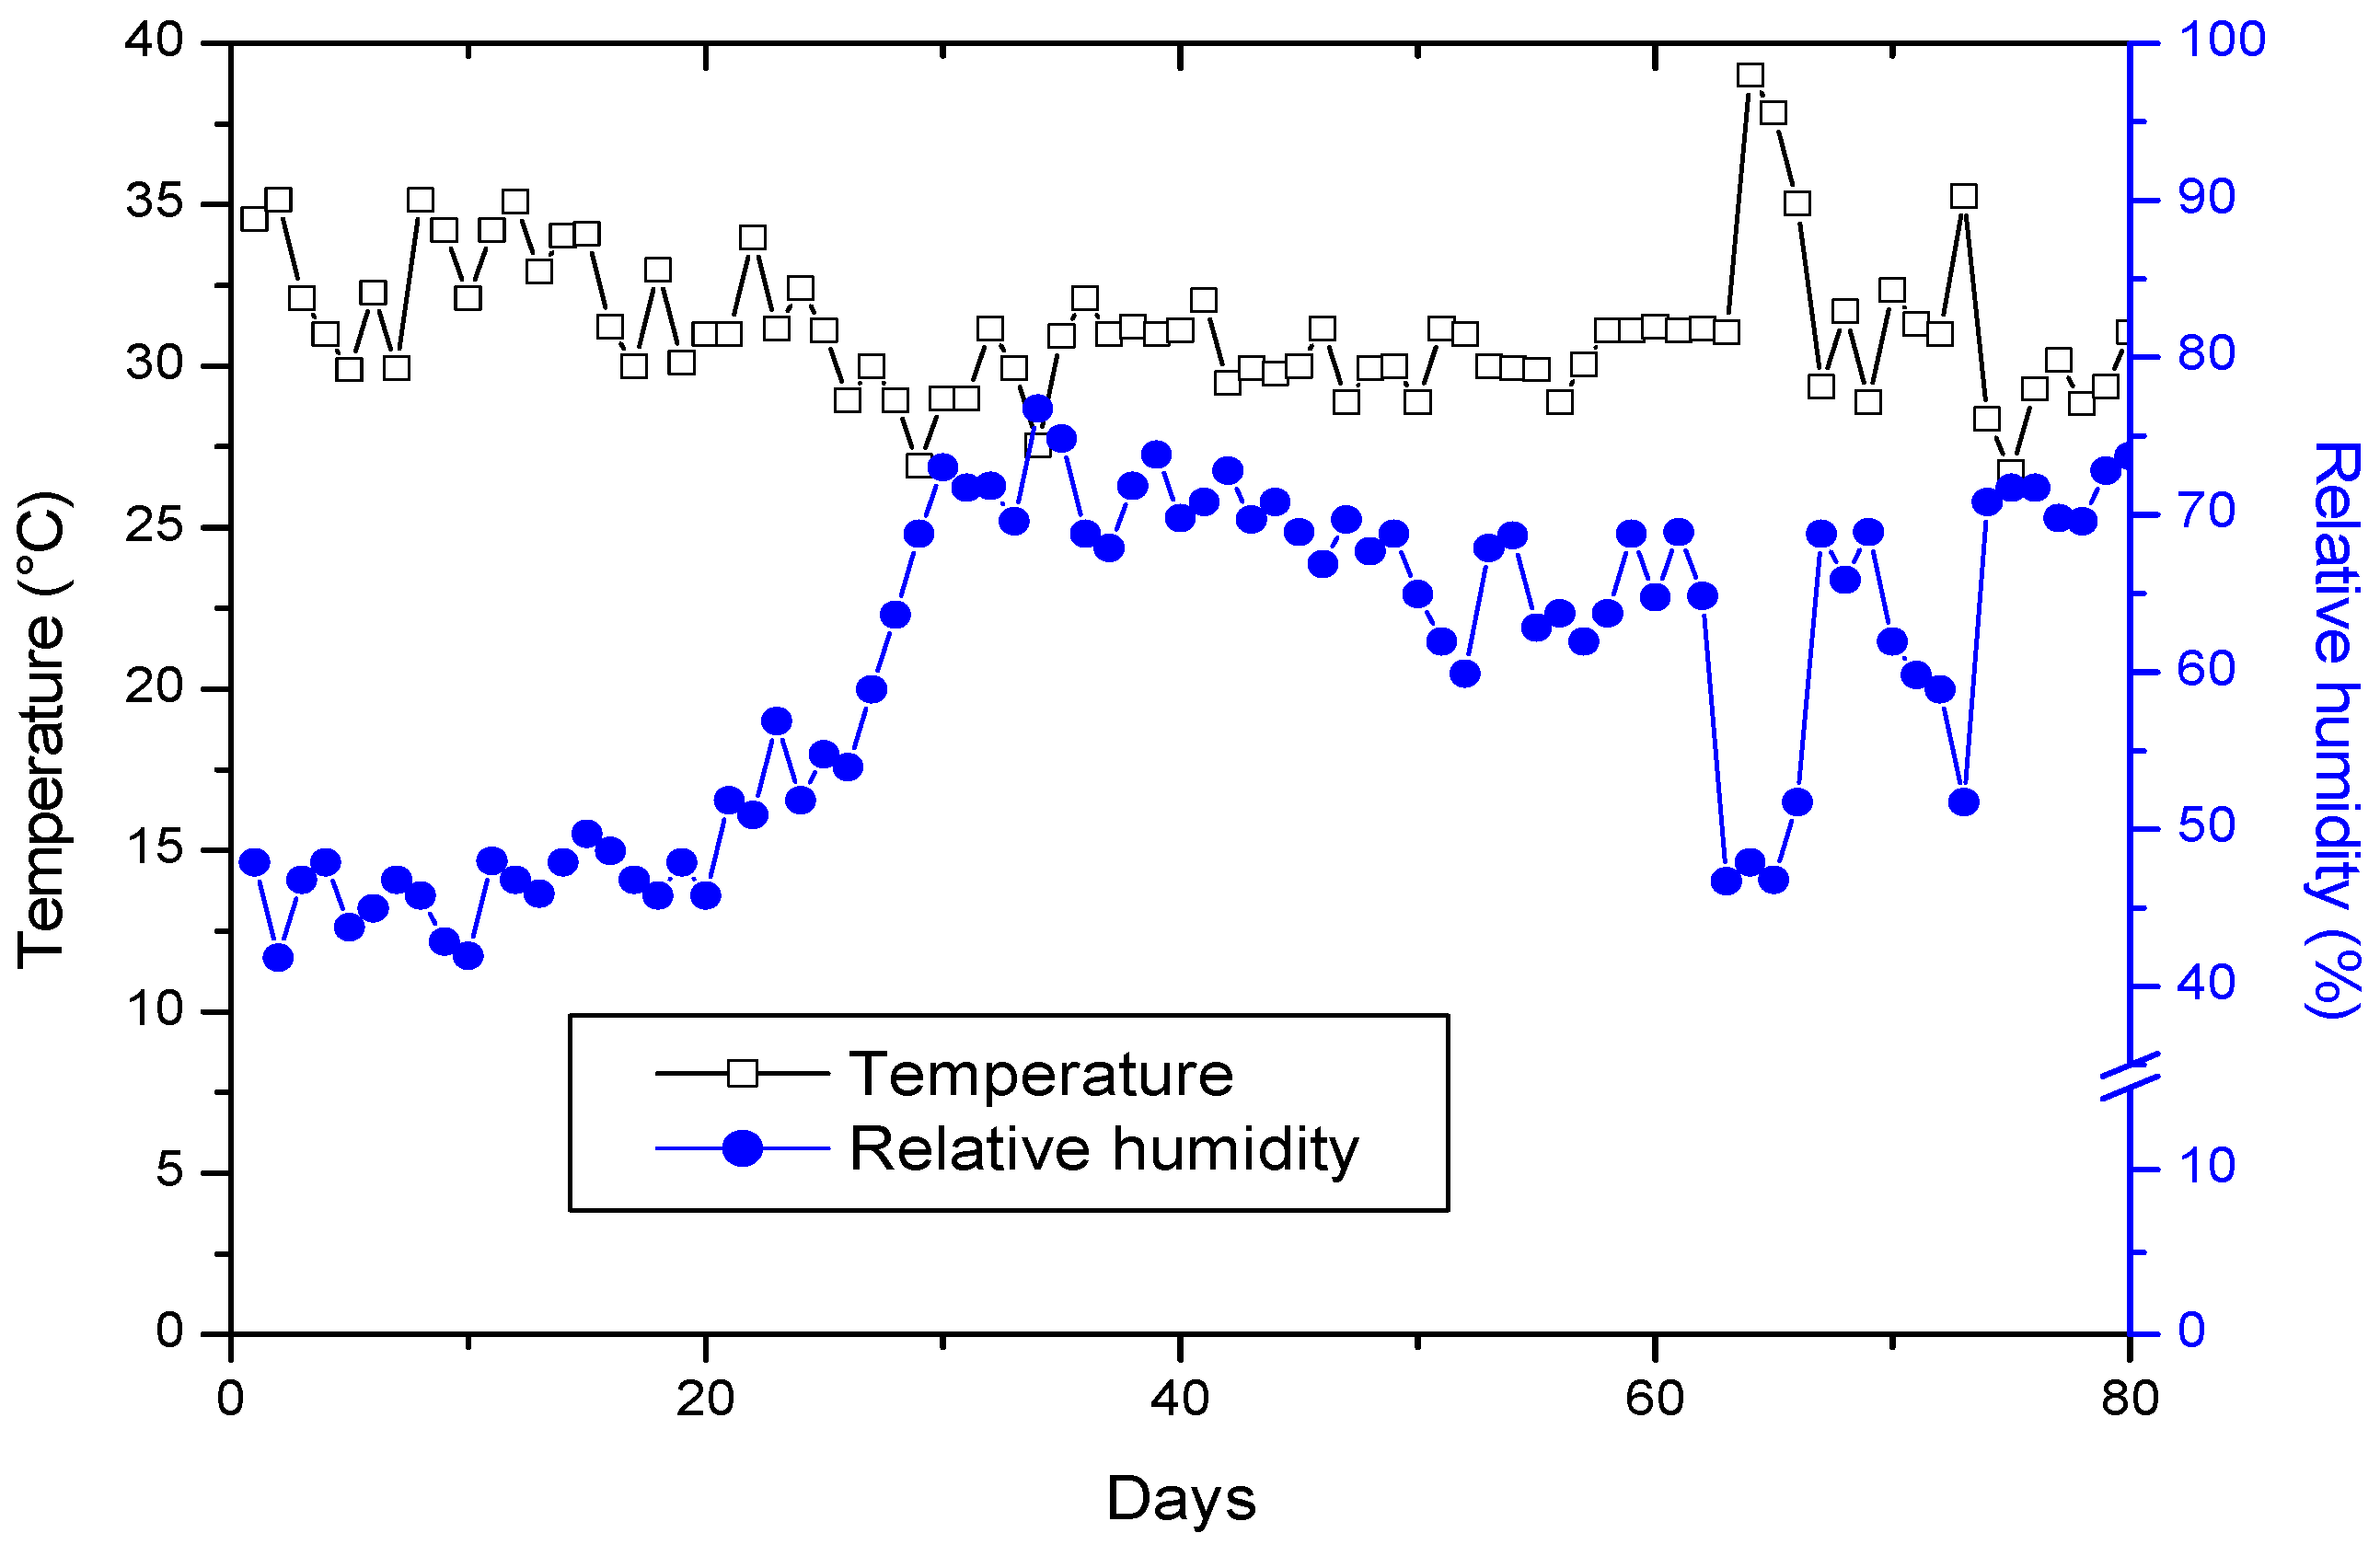
2.2. Experimental Site and Plant Material

The experiment was conducted in a greenhouse with no climate control, with an east–west orientation, exposed to natural sunlight. The greenhouse was located at the Department of Agronomy (DEPA) of the Federal Rural University of Pernambuco (UFRPE), Recife-PE, Brazil. (coordinates: 8°01′00.4″ S 34°56′40.6″ W). The region’s climate is classified as Am (tropical monsoon climate characterized by a dry season in winter) according to Köppen’s classification [13]. The average annual temperature is 25.8 °C, with an average annual rainfall of 1804 mm. Meteorological data were recorded during the 80-day experimental period, with average temperatures ranging from 27 °C to 39 °C and relative humidity levels between 42% and 77% (Figure 3).
The experimental units consisted of 15 L pots without drainage filled with one of the two soil types, Ultisol or Alfisol. The soils (Alfisol and Ultisol) were fertilized with nitrogen (urea), phosphorus (triple superphosphate), and potassium (potassium chloride), and the pH of the Ultisol was adjusted (pH = 6.5) to meet the nutritional requirements of cowpea [20] based on the evaluation of the soil’s fertility.
Once the soils were fertilized, cowpea (Vigna unguiculata) seeds were sown, with four seeds per pot. Ten days after germination and the emergence of the first leaves, all but the most vigorous and healthy plants were removed from each pot, leaving one plant per pot.

2.3. Irrigation Management

For irrigation, six saline water solutions were prepared with ECs of 0, 1.5, 3.0, 4.5, 6.0, or 9.0 dS m−1 by adding NaCl, CaCl2, and MgSO4 salts in a 7:2:1 ratio to well water from the semi-arid region [21]. Local water (average EC = 0.06 dS m−1), provided by the local supply company, was used as the 0 dS m−1 control treatment. Plants were irrigated daily with water at the respective EC levels, always in the late afternoon, considering the crop’s evapotranspiration demand to maintain the system at 70% of the maximum water retention capacity.

2.4. Plant Growth and Yield

The experiment was conducted over a period of 80 days, during which time stem diameter and plant height were measured using a digital caliper and a measuring tape, respectively. For dry biomass determination, plants were harvested, placed in paper bags, and dried in a forced-air circulation oven at 60 °C until a constant weight was reached. Yield was estimated based on the weight of the harvested pods and the plant spacing within the experiment.

2.5. Plant Water Potential (Ψw) and Leaf Osmotic Potential (Ψs)

Plant water potential (Ψw) was determined at the cowpea maturation stage, 80 days after sowing, using a Scholander pressure chamber (Model 1515D, PMS Instrument Company, Albany, OR, USA) at predawn.
For the determination of osmotic potential (Ψs), the same leaves used for water potential measurement were collected, macerated in liquid nitrogen, and ground using a mortar and pestle. The sap obtained from maceration was filtered and centrifuged at 10,000× g at 4 °C for 15 min. The osmolality analysis for Ψo determination was determined with a vapor pressure osmometer (Vapro Model 5600, EliTechGroup, Logan, UT, USA) using 10 microliters of the supernatant. The osmolality values were then converted to MPa using the van’t Hoff equation (Equation (1)) [22,23,24]:
Ψs (Mpa) = −moles of solute × R × T
where R = universal gas constant (0.008314 MPa Kg K−1mol−1); T = temperature in Kelvin.

2.6. Osmotic Adjustment (OA)

To estimate osmotic adjustment (OA), one leaf was collected from each plant and saturated with distilled water in petri dishes at 4 °C for 24 h in the dark until full turgor was reached. Subsequently, excess water was removed, and the leaves were macerated with liquid nitrogen in a porcelain mortar. The extract was then filtered and transferred to 1.5 mL centrifuge microtubes and centrifuged at 10,000× g for 15 min at 4 °C. The osmolality was determined as previously described for the Ψo evaluation. Osmotic adjustment was determined by the difference between the osmotic potential of the fully saturated control plants (Ψst10s) and the fully saturated stressed plants (Ψss100) (Equation (2)) [25]:
OAtot = Ψst100 − Ψss100
where OAtot = total osmotic adjustment, Ψst100 = osmotic potential of fully turgid control plants, and Ψss100 = osmotic potential of fully turgid stressed plants.

2.7. Electrolyte Leakage (EL)

For the analysis of electrolyte leakage (EL), leaf discs with an area of 0.5 cm2 were collected from the second fully expanded leaf from the plant apex, placed in test tubes containing 10 mL of distilled water, and kept at 25 °C for 24 h. After this period, the free conductivity (FC) was determined using a benchtop conductivity meter. Subsequently, the same samples were placed in a water bath at 90 °C for 1 h, then cooled to room temperature, and the total conductivity (TC) was measured. The percentage of electrolyte leakage (EL%) was estimated using the following equation (Equation (3)) [26]:
EL% = (FC/TC) × 100

2.8. Relative Water Content (RWC)

The relative water content (RWC) was determined at dawn 80 days after sowing by collecting five leaf discs and measuring their fresh weight (FW). The discs were then saturated with distilled water for 48 h, and their turgid weight (TW) was determined. They were then dried in an oven at 65 °C to a constant weight, and the dry weight (DW) was determined. The RWC was calculated using the following equation (Equation (4)) [27]:
RWC (%) = (FW − DW)/(TW − DW) × 100

2.9. Soil CO2 Efflux

Soil CO2 efflux was measured 80 days after sowing using potted plants with a CO2 efflux chamber connected to an infrared gas analyzer (IRGA) (Model Li-6400XT, LiCor Instruments, Lincoln, NE, USA). PVC collars were inserted into the soil at a depth of 5 cm and attached the chamber to the IRGA. The CO2 efflux from the soil was measured as μmol CO2 m−2 s−1.

2.10. Statistical Analyses

The experiment was arranged in a randomized block design (RBD) and analyzed as a 2 × 6 factorial, with 2 soil classes (Alfisol and Ultisol) and 6 levels of irrigation water EC (0, 1.5, 3.0, 4.5, 6.0, 9.0 dS m−1) with 4 replicates, totaling 48 experimental units. Data were analyzed by two-way analysis of variance (ANOVA), Scott–Knott’s mean comparison test, and regression equation adjustments.

3. Results

There was a significant interaction (p ≤ 0.05) between the soil type and EC level for all dependent variables measured.

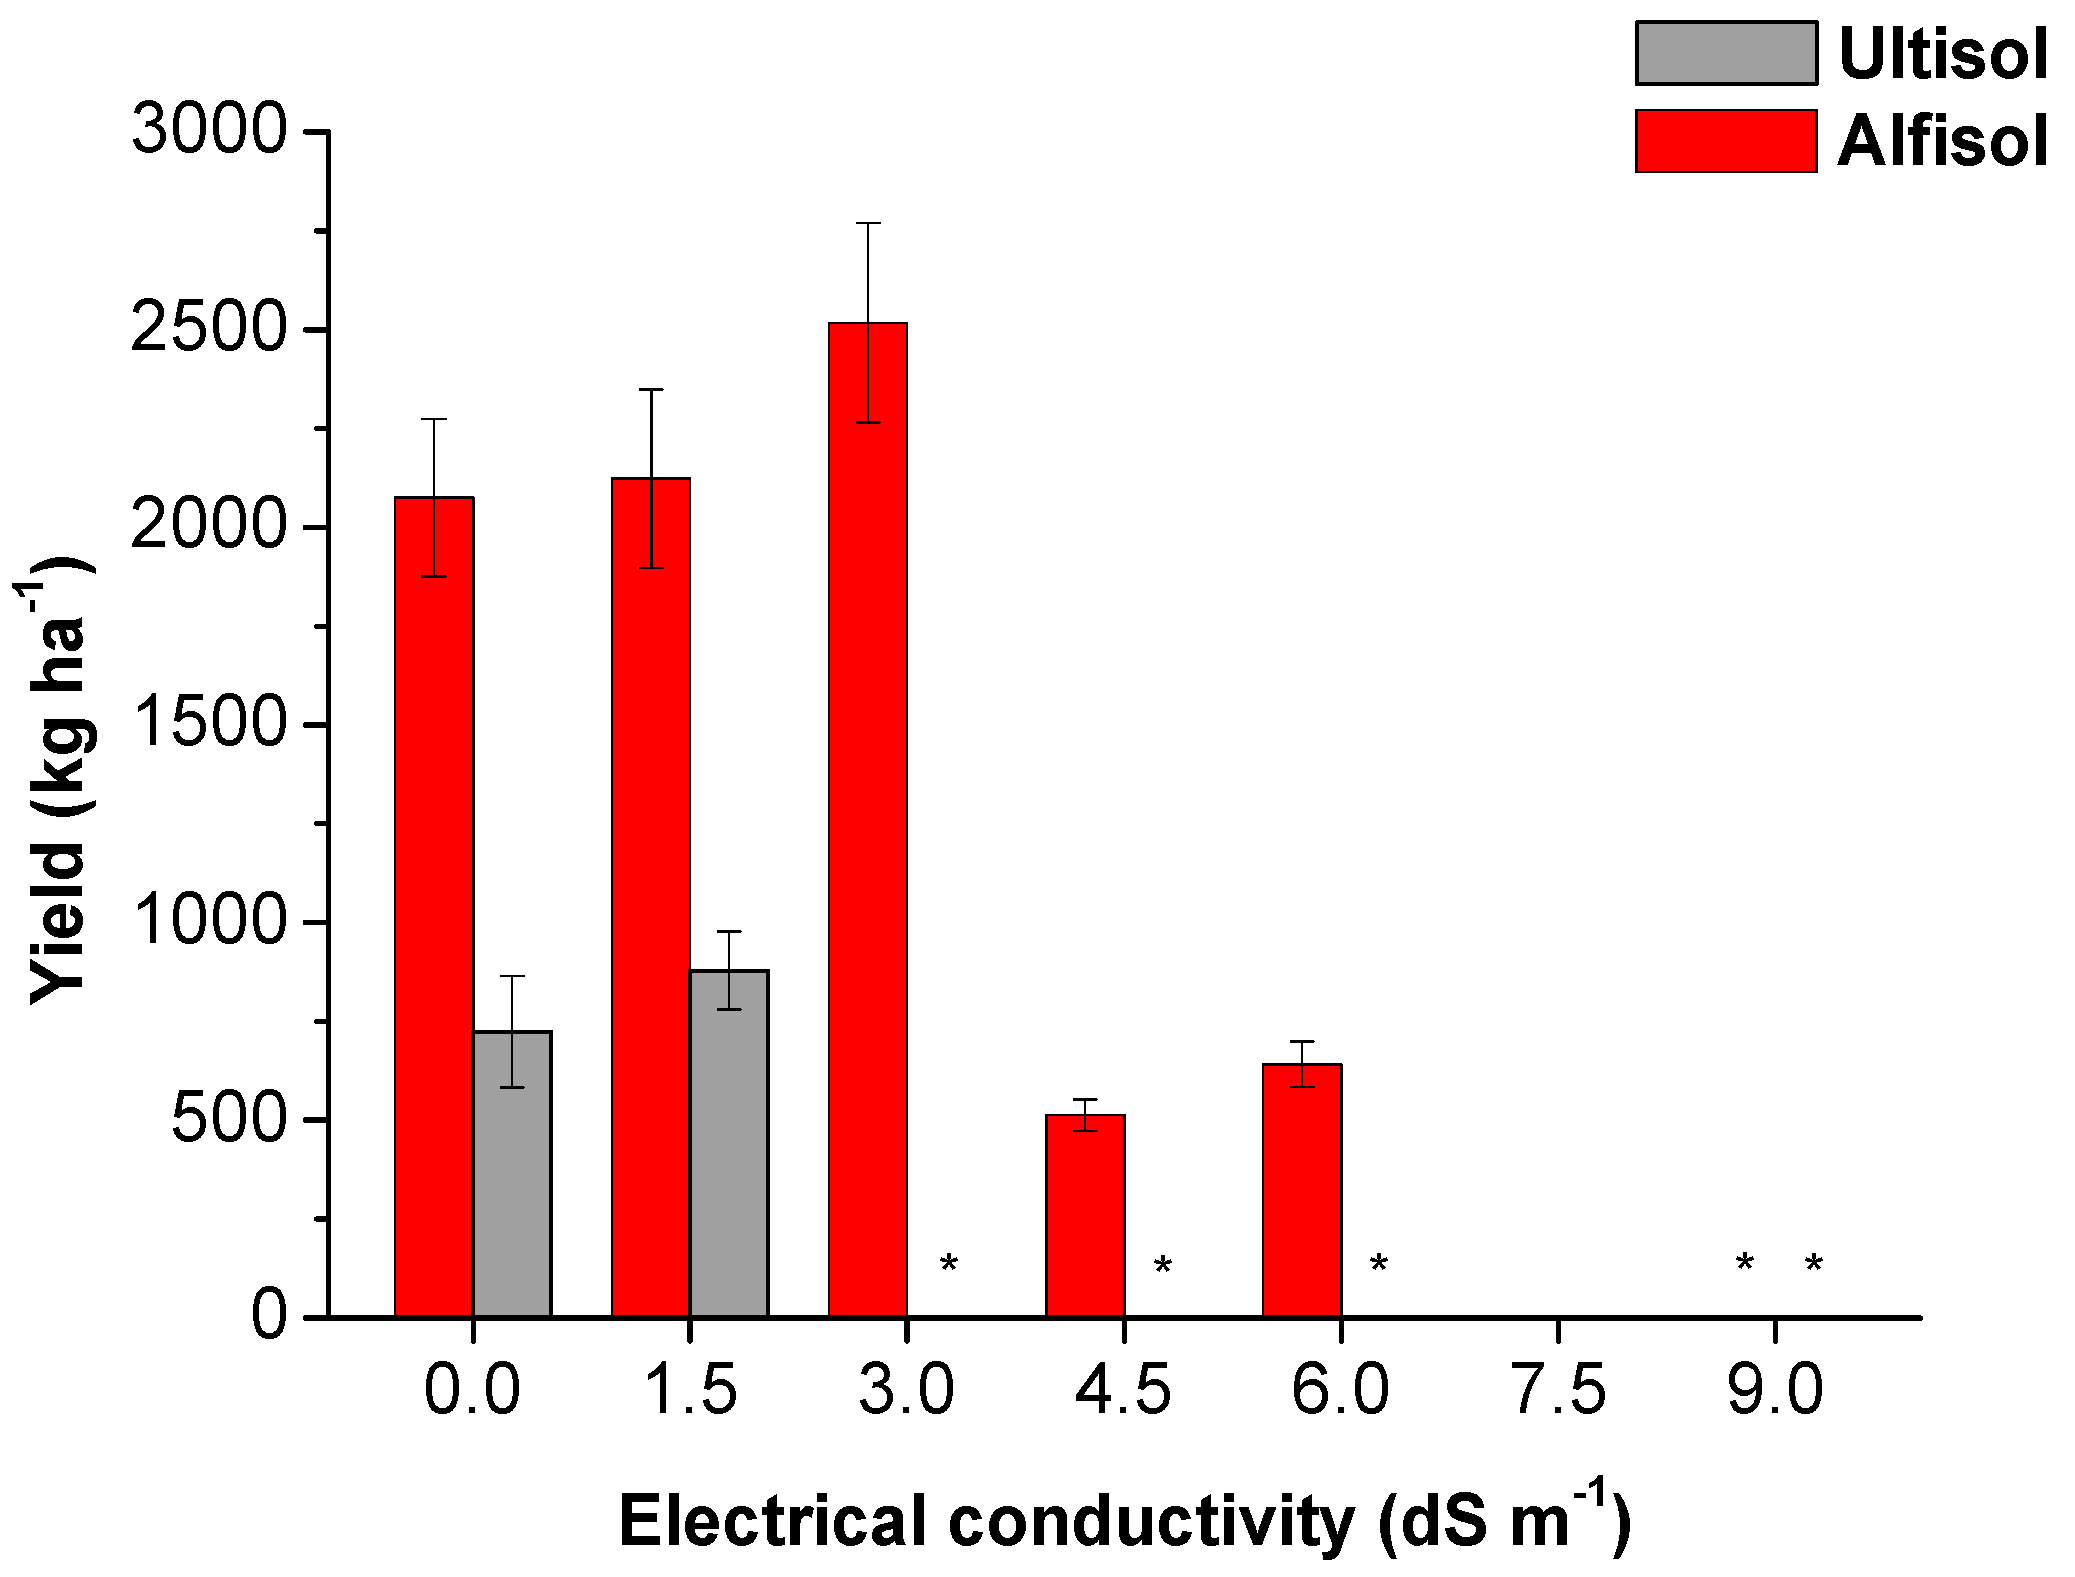
3.1. Biometrics and Produce

The dry mass of the aerial portion of the plant (DMAP) decreased significantly (p ≤ 0.01) as salt concentration increased in both soil types, with the lowest DMAP in plants grown in Ultisol (Table 3).
Plants in Alfisol had a higher DMAP at an EC of 1.5 dS m−1, differing statistically from that of plants in all other salinity treatments. Similarly, there was a significant statistical difference (p ≤ 0.01) in the dry mass of the roots (DMR) between soil types, with a higher DMR in plants grown in Alfisol than in Ultisol. The highest DMR occurred in the 0 and 1.5 dS m−1 in both soil types. In Ultisol, the DMR was lower for plants in EC 3.0 dS m−1 and above compared with the other salinity treatments (Table 3).
Despite the greater vigor of plants grown in Alfisol compared with those in Ultisol, in both soil types, plants in the control treatment (0 dS m−1) were significantly (p ≤ 0.05) taller than plants in all other salinity treatments (Table 3).
The stem diameter (SD) of plants did not differ statistically between the soil types (p ≤ 0.05) at an EC of 0 or 1.5 dS m−1. At an EC of 3.0 dS m−1 and higher, plants in Alfisol had significantly greater SDs compared with those in Ultisol (Table 3).
In Ultisol, only plants in an EC treatment of 0 or 1.5 dS m−1 produced pods, with yields lower than 1000 kg ha−1 (Figure 4). In Alfisol, productivity was twice as high as the average in the Ultisol when irrigated with saline water up to an EC of 3 dS m−1, and yield was still observed at an EC of 6 dS m−1.

3.2. Physiological Variables

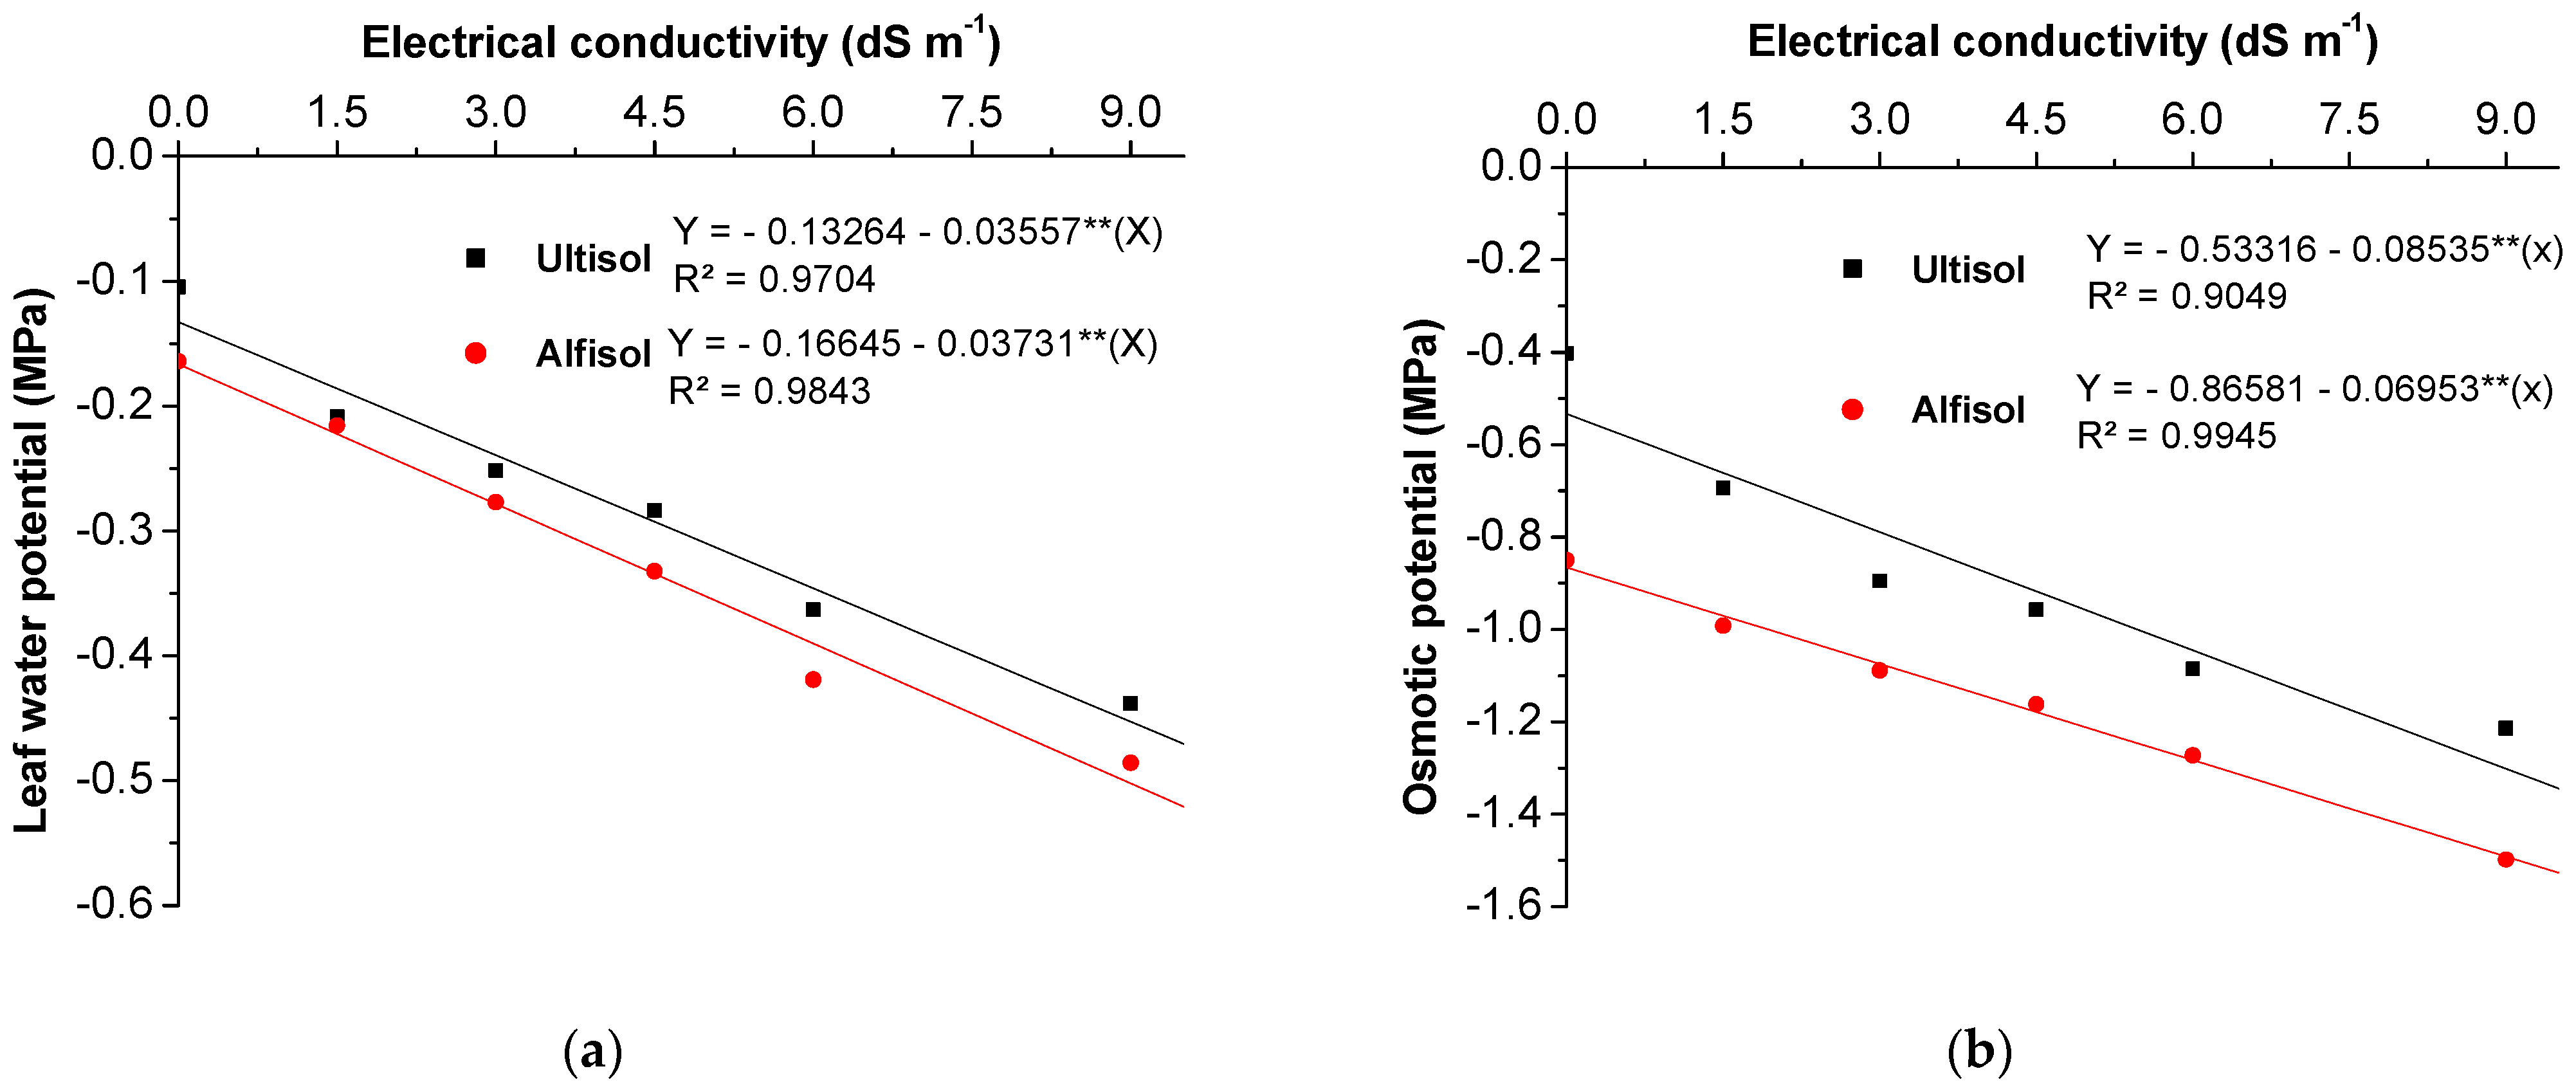
3.2.1. Water Relations

Leaf Ψw and Ψo decreased linearly with increasing EC levels. The reductions in Ψw were 29%, 45%, 55%, 62%, and 71% in Ultisol and 25%, 40%, 50%, 57%, and 67% in Alfisol at EC levels of 1.5, 3.0, 4.5, 6.0, and 9.0 dS m−1, respectively, compared with the control (0 dS m−1) (Figure 5a).
Reductions in Ψo were 19, 32, 42, 62, and 59% for Ultisol and 11, 19, 27, 33, and 42% for Alfisol at EC levels of 1.5, 3.0, 4.5, 6.0, and 9.0 dS m−1, respectively, compared with the control (0 dS m−1) (Figure 5b). Cowpea plants exhibited lower Ψw and Ψo in Alfisol than in Ultisol, indicating higher OA capacities of plants grown in Alfisol (Figure 5c).
In both soil types, there was a linear reduction in RWC with increasing EC levels, with reductions of 9, 18, 27, 35, and 53% in Ultisol and 5, 11, 16, 22, and 33% in Alfisol at EC levels of 1.5, 3.0, 4.5, 6.0, and 9.0 dS m−1, respectively, compared with the control (Figure 5d). However, plants in Alfisol had 4, 10, and 24% higher RWCs than those in the Ultisol at EC levels of 4.5, 6.0, and 9.0 dS m−1, respectively.

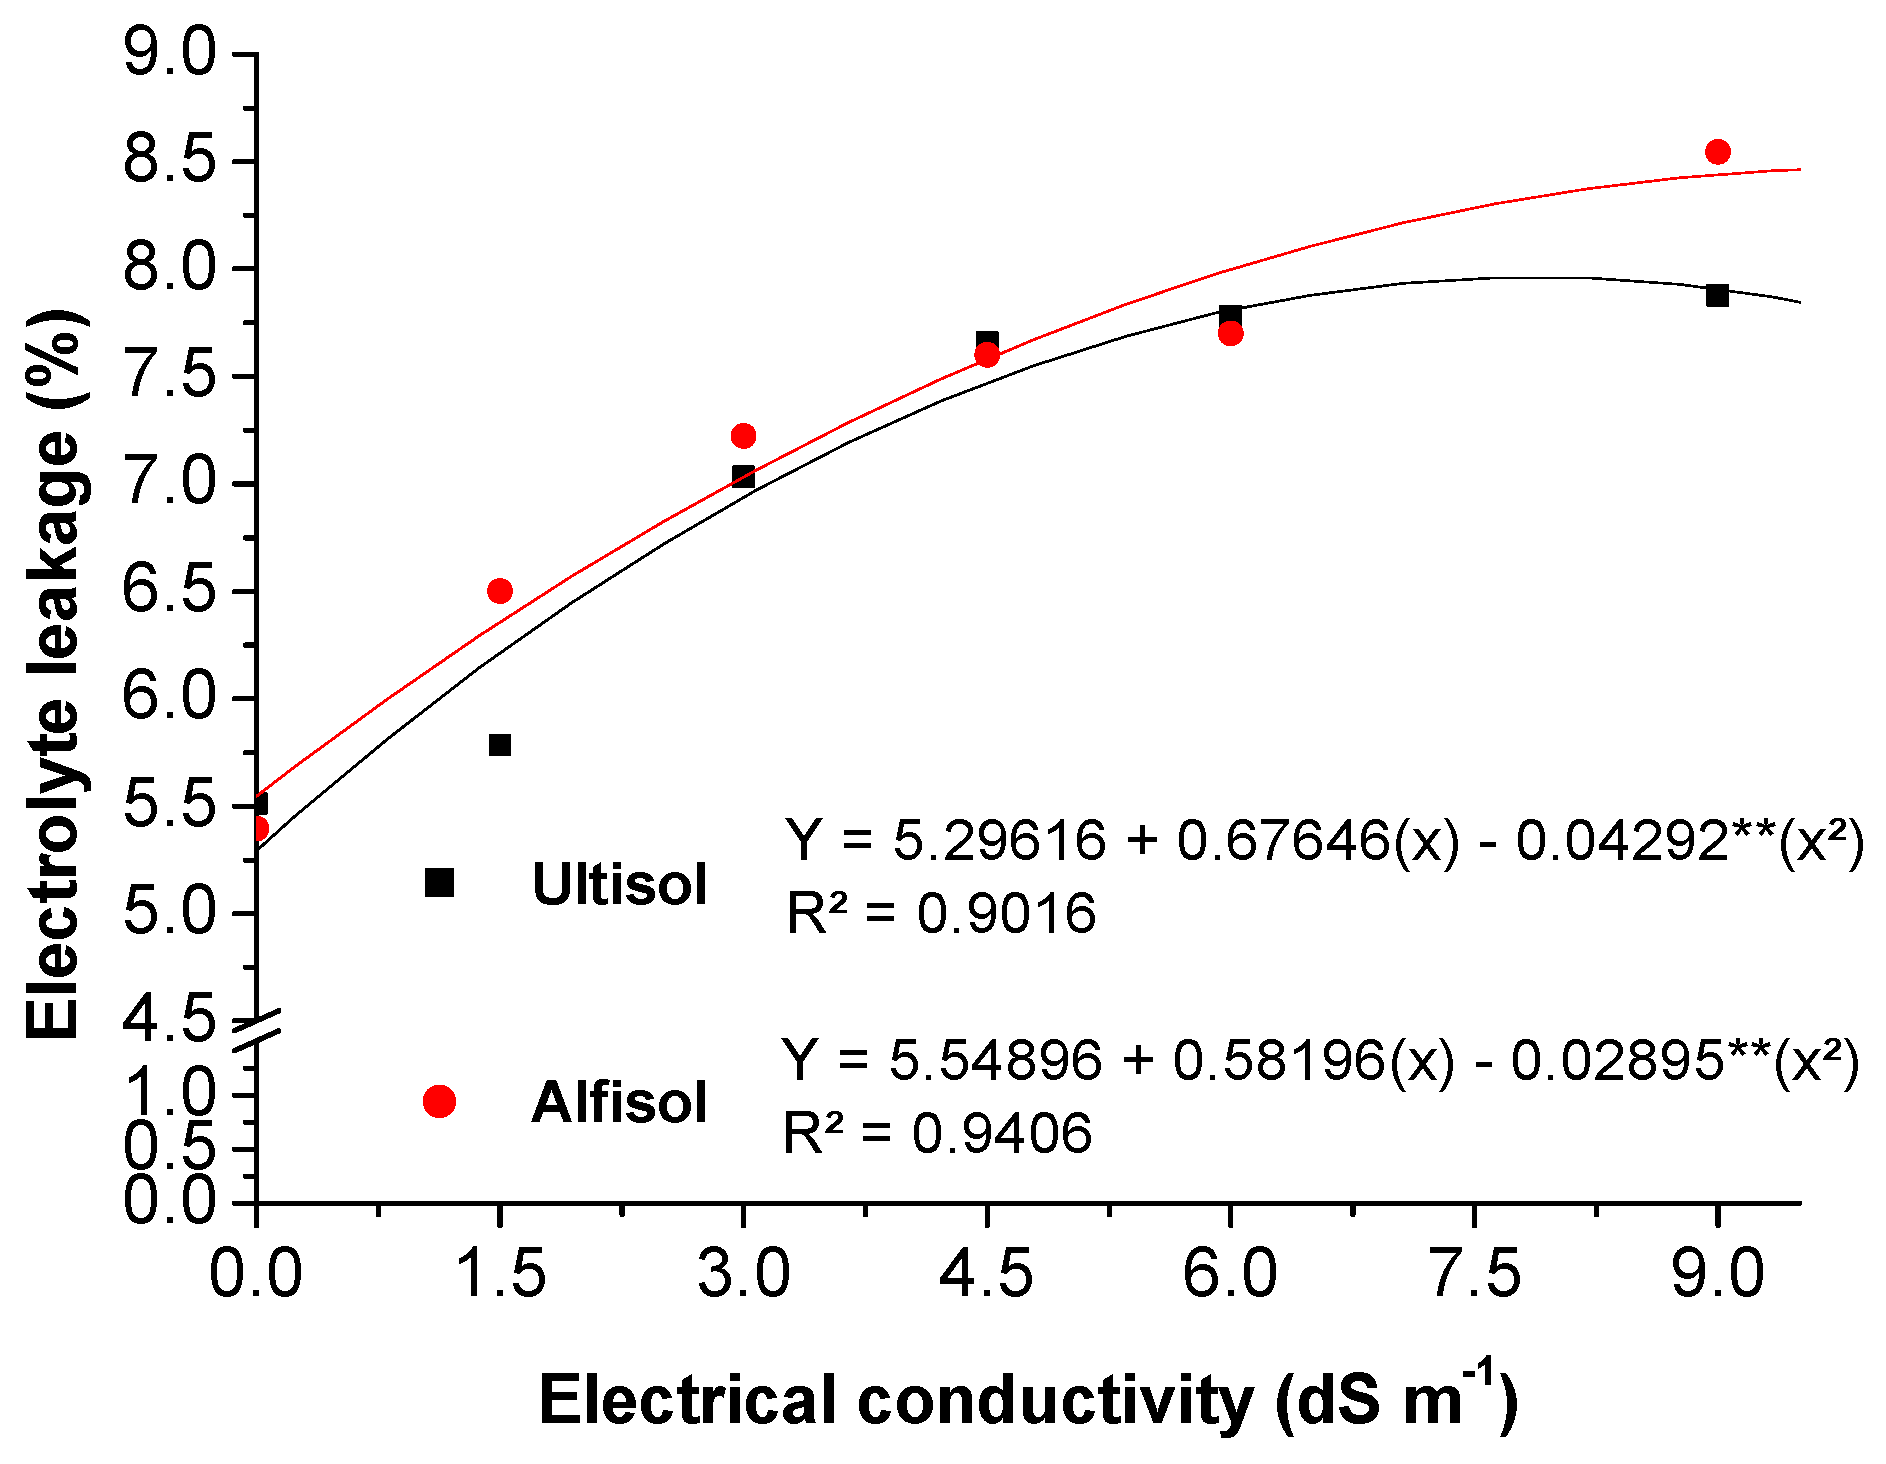
3.2.2. Electrolyte Leakage

Greater EL was observed for plants in Alfisol, with a maximum interpolated value of 8.47% at an EC of 10.05 dS m−1, approximately 6.43% higher than the maximum interpolated value observed for plants cultivated in Ultisol (7.96%) at an EC of 7.88 dS m−1 (Figure 6).
There was a linear increase in EL from plants in both soil types and no difference in EL between soil types up to an EC of 4.5 dS m−1 (Figure 6).

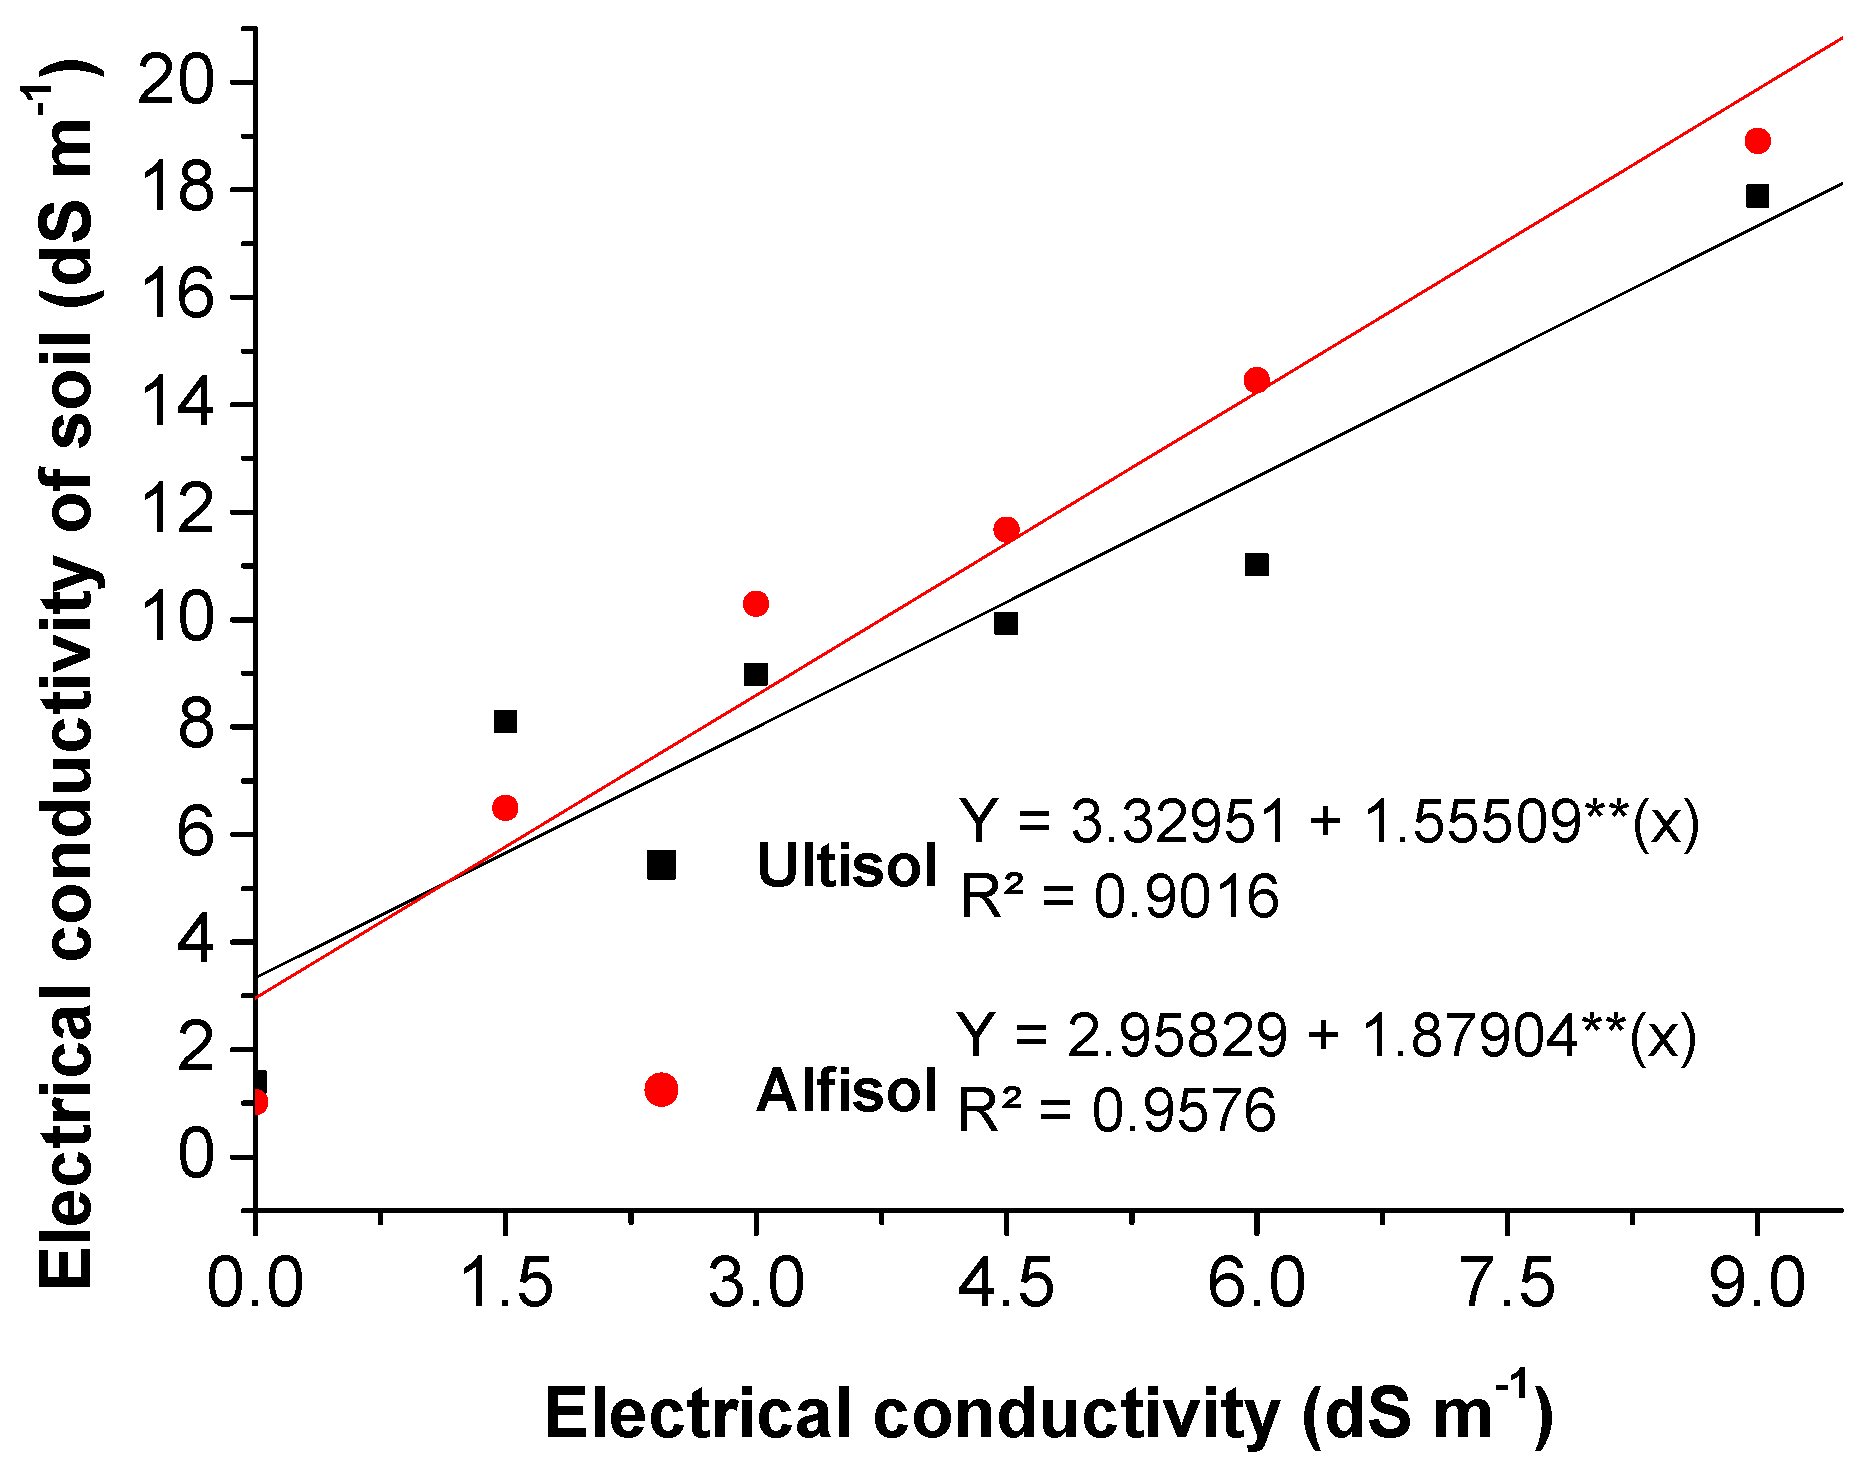
3.2.3. Final Electrical Conductivity

At the end of the experiment, the EC of the soil increased linearly with increasing EC treatment levels, with Alfisol having a 37% higher salt accumulation than Ultisol, with soil EC increases of 3.08 and 2.96 dS m−1 for per unit of EC applied via irrigation water to Alfisol and Ultisol, respectively (Figure 7).
It is important to note that Alfisol had electrical conductivity values approximately twice as high as those of the irrigation water, demonstrating a high accumulation of salts (Figure 7).

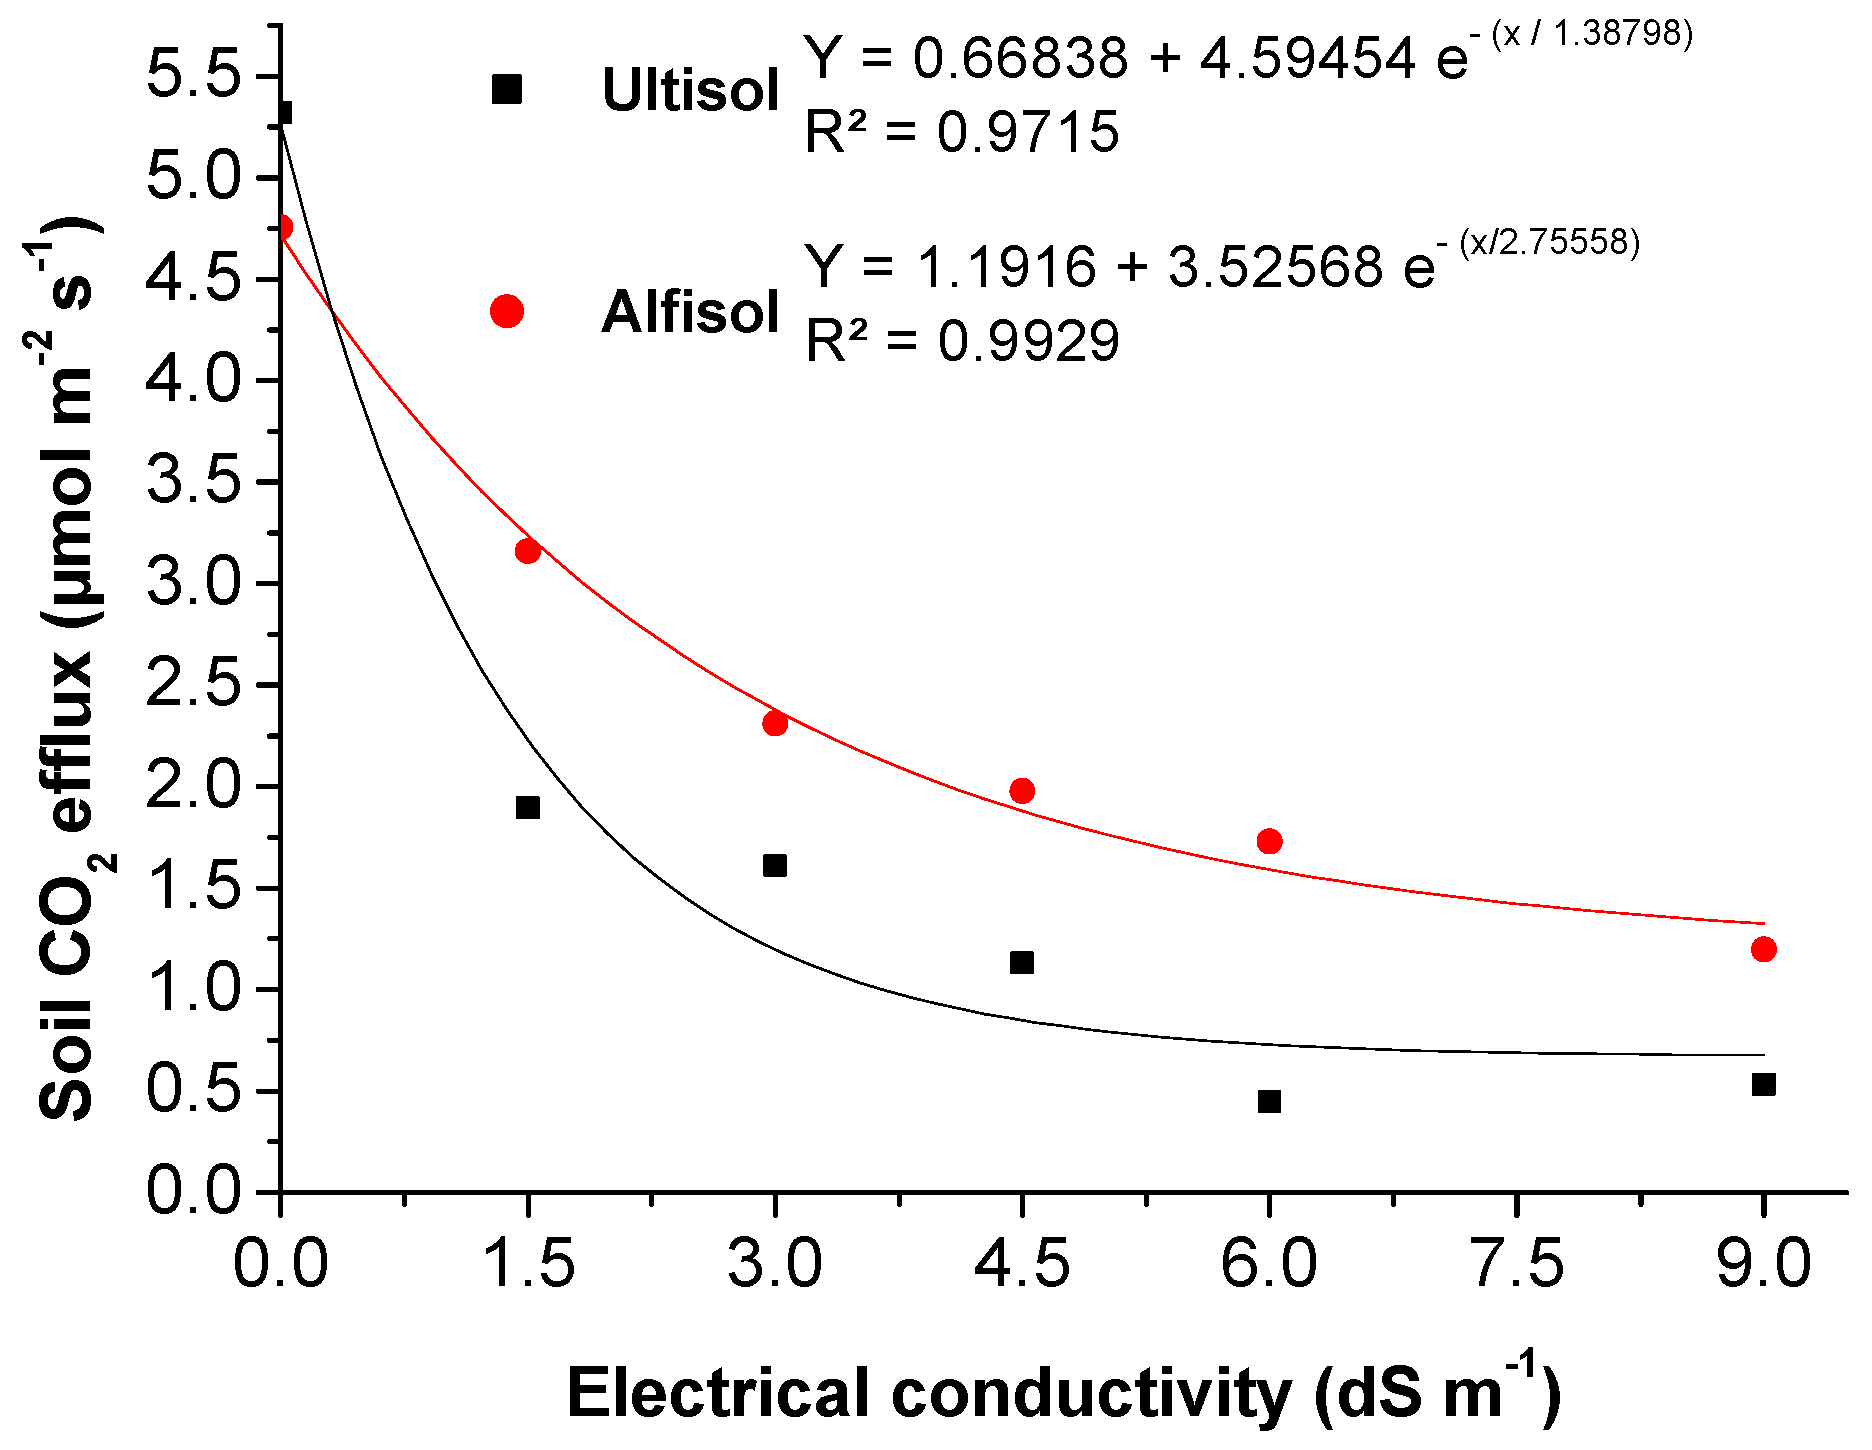
3.2.4. Soil CO2 Efflux

The soil CO2 efflux exponentially decreased as the EC of the irrigation water increased in both soil types. The Alfisol exhibited a horizontal asymptote of 1.19 μmol m−2 s−1, compared with 0.66 μmol m−2 s−1 in Ultisol, demonstrating that the stabilization of CO2 efflux in the Alfisol was 80.3% higher under high salinity conditions. Furthermore, Ultisol exhibited a higher decay rate (98.64%), as reflected by its decay constant (1.39), compared with that of Alfisol (2.76), which led to a faster tendency for Ultisol to approach its minimum value (Figure 8).

4. Discussion

Soil order can affect crop production due to a variety of factors, including the physical and chemical characteristics of the soil. Highly weathered soils have low nutrient availability, high acidity, and often, high concentrations of aluminum. These characteristics significantly decrease crop production when not properly treated chemically. Due to the characteristics common to Ultisols, they become susceptible to a series of chemical problems, including high acidity, elevated levels of aluminum, and low natural fertility [27]. One solution is the incorporation of organic compounds such as biochar and/or the application of minerals (remineralizers) such as potassium feldspar [28]. These applications promote increased productivity of the crop in weathered and acidic soils. In this study, it was observed that the different soil compositions had a significant influence on the development of the bean crop, which was a direct result of the chemical and mineralogical composition of the origin soil, as the physical characteristics of Ultisol such as density, aeration, and drainage are considered more favorable to crop development than those of Alfisol [29].
Salinity in highly weathered soils is not common and usually occurs in coastal regions [27], where Ultisols are typically found. Because these soils have a great depth but low effective cation exchange capacity (CEC), high potential acidity, and a predominantly sandy texture in the surface layers [30], sodium can become widely available, promoting accelerated toxicity and low nutrient availability [31]. In regions of low weathering, these soils have a high CEC and base saturation with low potential acidity of Alfisols, which leads to a series of changes due to salinity.
Irrigation with saline water throughout the cultivation of Vigna unguiculata affects several plant variables, including plant height, stem diameter, photosynthesis, transpiration, stomatal conductance, and consequently, productivity. However, strategies such as fertilizer management can be adopted to mitigate the harmful effects of high salinity. The efficiency of these strategies is influenced by several soil variables, including clay content and base saturation [20,32,33,34]. These variables were significantly different in the studied soils, directly influencing the plants’ response to salinity.
Bean plant dry mass production is significantly affected by soil salinity. In less weathered soils, relative biomass loss can range from 6 to 9% [35,36]. In sandy soils such as Ultisol, the variation can be more pronounced, with losses of around 14% for each unit increase in the EC of the irrigation water [33], probably due to a lower buffering capacity. This is because NaCl is more toxic to Vigna unguiculata than either Na+ or Cl separately [34]. In other words, the greater ionic homeostasis in Alfisol in relation to Na+ or Cl may have mitigated the harmful effects of the salinity.
Alfisol was conducive to the cultivation of Vigna unguiculata, even when irrigated with moderately saline water (up to an EC of 4.5 dS m−1). This productivity was largely attributed to the soil’s chemical characteristics, such as its natural content of phosphorus and potassium—essential elements for grain production in this crop [1,37,38]. Crop production values for cowpea in Ultisol observed in the present study were similar to those observed in other sandy soils without salinity problems, with average values ranging from 520 to 780 kg ha−1 [39].
The increase in soil salinity reduced root biomass, which, in turn, affected CO2 efflux in both soils studied. The correlation between reductions in root dry matter and soil respiration has been previously documented in Vigna unguiculata [40]. Furthermore, soil salinization itself contributes to changes in soil respiration, as soil microbes are quickly affected by changes in EC, reducing microbial activity and consequently affecting soil respiration. It is noteworthy that the availability of organic matter and microbial biomass are crucial for possible future soil recovery following a reduction in soil EC [41,42].
An EC value of 2 dS m−1 is considered critical for normal soil microbial activity, at which point a change in soil enzymatic activity occurs, with salinity becoming the primary limiting factor instead of organic matter [43]. This value coincides with the sharp decline in CO2 efflux from both soils, which occurred at an EC of the irrigation water of 1.5 dS m−1.
Increasing the EC of the irrigation water to 1.5 or 3.0 dS m−1 increased the EC of the saturation extract of both soils by about three-fold, rendering them saline soils [44]. Irrigation with saline water in closed systems promotes rapid salinization of the soil, which can cause soil EC to reach values more than twice that of the EC of the irrigation water, leading to soil salinization and/or sodification [45].
The soil salinity threshold for Vigna unguiculata is reported to be 4.8 dS m−1 [46]. However, in the present study, this value appeared to be affected by the soil, as crop productivity was observed up to an EC of 1.5 dS m−1 in Ultisol, but up to 6 dS m−1 in Alfisol. Thus, depending on the soil order, the crop could be classified as sensitive to salinity (Ultisol) or moderately tolerant to salinity (Alfisol) [46]. Thus, crop tolerance depends not only on the already known factors such as the intensity, duration, and source of saline stress, but also on intrinsic soil characteristics [47,48].
In clay soils, salinity can increase the number of small pores in the soil, enhancing the soil’s ability to retain water and increase its matric potential. This occurs because, in addition to the osmotic component, salinity promotes flocculation of clay, increasing the cohesion of primary particles and expanding microaggregate formation [49]. Although the Alfisol had greater salt accumulation with higher EC values of the saturation extract than the Ultisol, growth and yield of cowpeas was superior in Alfisol, indicating a better homeostatic balance.
To thrive in saline environments, Vigna unguiculata plants grown in both soils reduced their water potential to maintain their water absorption capacity. This effect is supported by the corresponding reduction in Ψo, which was more negative in plants grown in Alfisol compared with Ultisol, and the higher RWC in Alfisol, even in plants subjected to higher salt concentrations. Thus, the reduction in Ψo without effective loss of plant turgor indicates an effective OA capacity of the crop [7,50,51,52].
A greater OA of Vigna unguiculata was observed for plants in Alfisol compared with those in Ultisol, which may be due to the accumulation of proline and total soluble sugars in plants grown in Alfisol [53] as well as the selectivity and concentration of inorganic solutes such as Na+, K+, and Cl, reducing the plant’s energy expenditure and contributing to a greater OA capacity and water maintenance [12,54]. Despite the cowpea plants showing higher OA in Alfisol, higher EL values were also observed, indicating greater damage to the cell membrane as the salinity level of the irrigation water increased in this soil. This may have been due to a possible excess of toxic elements such as sodium and chlorine in the growing environment, causing a significant increase in the activity of reactive oxygen species (ROS), compromising the integrity of the cell walls.
In the present study, it was observed that despite the higher growth and productivity of cowpeas in Alfisol compared with Ultisol, the higher water requirement of plants in Alfisol and consequent irrigation with brackish water led to increased soil salinization compared with Ultisol, as evidenced by the high EL values.

5. Conclusions

A crop’s tolerance to salinity is dependent on the characteristics of the soil where it is cultivated. Irrigation with saline water at an EC above 3 dS m−1 halts the production of cowpea in Ultisol, but it becomes a limiting factor for Alfisol only at an EC above 6 dS m−1. Despite accumulating more salts when irrigated with saline water, Alfisol supports better cowpea plant growth and yield compared with Ultisol.
Irrigation with saline water negatively affects various physiological variables of the cowpea plants, which are dependent upon soil characteristics such as clay content, base saturation, and degrees of weathering. High fertility, a characteristic of Alfisols, can assist in the development of cowpea by alleviating the deleterious effects of salinity on crop growth and productivity.

Author Contributions

Conceptualization, methodology, J.R.M.d.S. and E.R.d.S.; formal analysis, investigation, data curation, J.R.M.d.S., J.A.N., R.L.S.d.M. and M.A.d.S.; writing—original draft preparation, L.Y.d.C.L. and M.K.S.S.P.; writing—review and editing, E.R.d.S., B.S., L.Y.d.C.L. and M.K.S.S.P.; supervision, project administration, E.R.d.S., V.S.d.S.J., C.M.T.L. and B.S. All authors have read and agreed to the published version of the manuscript.

Funding

This study was financed in part by the Brazilian Federal Agency for Support and Evaluation of Graduate Education (CAPES Code 001) and the National Council for Scientific and Technological Development (CNPq, funding number: 305136/2021-6).

Institutional Review Board Statement

Not applicable.

Informed Consent Statement

Not applicable.

Data Availability Statement

The data that support the findings of this study are available from the corresponding author, De Souza, E. R., upon reasonable request.

Conflicts of Interest

The authors declare no conflicts of interest.

Abbreviations

BdBulk density
CSCoarse sand
DCWDispersed clay in water
DDDispersion degree
DMAPDry mass of the aerial portion of the plant
DMRDry mass of the roots
CECEffective cation exchange capacity
ECElectrical conductivity
ELElectrolyte leakage
FSFine sand
DFFlocculation degree
FCFree conductivity
HPlant height
IRGAInfrared gas analyzer
OAOsmotic adjustment
PdParticle density
ROSReactive oxygen species
RWCRelative water content
SDStem diameter
TCTotal conductivity

References

  1. Zyada, H.G.; Ibraheim, S.K.A.; El-Saadony, F.M.; Mohaseb, M.I. Response of growth and productivity of cowpea plants to nano mixture of micronutrients under different potassium sulphate fertilizer rates. J. Bio-Agric. 2021, 1, 1–14. [Google Scholar] [CrossRef]
  2. FAO (Food and Agriculture Organization). Mapping of Salt-Affected Soils-Technical Specifications and Country Guidelines; FAO: Roma, Italy, 2020. [Google Scholar]
  3. Ribeiro, M.R.; Ribeiro Filho, M.R.; Jacomine, P.K.T. Origem e classificação dos solos afetados por sais. In Manejo da Salinidade na Agricultura: Estudos Básicos e Aplicados, 2nd ed.; Ghey, H.R., Dias, N.S., Lacerda, C.F., Gomes Filho, E., Eds.; INCTSal: Fortaleza, Brazil, 2016; pp. 9–15. [Google Scholar]
  4. Castro, F.C.; Santos, A.M.D. Salinidade do solo e risco de desertificação na região semiárida. Mercator 2020, 19, e19002. [Google Scholar] [CrossRef]
  5. Munns, R.; Tester, M. Mechanisms of salinity tolerance. Annu. Rev. Plant Biol. 2008, 59, 651–681. [Google Scholar] [CrossRef]
  6. Souza, P.J.D.O.P.D.; Ferreira, D.P.; Sousa, D.D.P.; Nunes, H.G.G.C.; Barbosa, A.V.C. Trocas gasosas do feijão-caupi cultivado no Nordeste Paraense em resposta à deficiência hídrica forçada durante a fase reprodutiva. Rev. Bras. Meteorol. 2020, 35, 13–22. [Google Scholar] [CrossRef]
  7. Melo, H.F.D.; Souza, E.R.D.; Dourado, P.R.M.; Lins, C.M.T.; Santos, H.R.B.; Monteiro, D.R.; Paulino, M.K.S.S.; de Almeida, B.G.; Santos, M.A.D. Comparison of water and osmotic potentials on Vigna unguiculata stress response. Rev. Bras. Cienc. Solo 2020, 44, e0200070. [Google Scholar] [CrossRef]
  8. Butcher, K.; Wick, A.F.; DeSutter, T.; Chatterjee, A.; Harmon, J. Corn and soybean yield response to salinity influenced by soil texture. Agron. J. 2018, 110, 1243–1253. [Google Scholar] [CrossRef]
  9. Rodrigues, R.A.S. Ciência do Solo: Morfologia e Gênese; Editora e Distribuidora Educacional S.A.: Londrina, Brazil, 2018; p. 264. [Google Scholar]
  10. Gomes, A.M.F.; Draper, D.; Nhantumbo, N.; Massinga, R.; Ramalho, J.C.; Marques, I.; Ribeiro-Barros, A.I. Diversity of cowpea [Vigna unguiculata (L.) walp] landraces in Mozambique: New opportunities for crop improvement and future breeding programs. Agronomy 2021, 11, 991. [Google Scholar] [CrossRef]
  11. Goufo, P.; Moutinho-Pereira, J.M.; Jorge, T.F.; Correia, C.M.; Oliveira, M.R.; Rosa, E.A.; António, C.; Trindade, H. Cowpea (Vigna unguiculata L. Walp.) metabolomics: Osmoprotection as a physiological strategy for drought stress resistance and improved yield. Front. Plant Sci. 2017, 8, e00586. [Google Scholar] [CrossRef]
  12. Dourado, P.R.M.; de Souza, E.R.; Lins, C.M.T.; de Melo, H.F.; Santos, H.R.B.; Monteiro, D.R.; Paulino, M.K.S.S.; de Carvalho Leal, L.Y. Osmotic adjustment in cowpea plants: Interference of methods for estimating osmotic potential at full turgor. Plant Physiol. Biochem. 2019, 145, 114–119. [Google Scholar] [CrossRef]
  13. Köppen, W. Climatologia: Con un Estudio de los Climas de la Tierra; Fondo de Cultura Econômica: Ciudad de México, Mexico, 1948; p. 479. [Google Scholar]
  14. INMET. Instituto Nacional de Meteorologia. Clima. Available online: https://clima.inmet.gov.br/ (accessed on 14 March 2025).
  15. APAC. Agência Pernambucana de Águas e Clima. Precipitação. Available online: https://www.apac.pe.gov.br/ (accessed on 14 March 2025).
  16. Teixeira, P.C.; Donagemma, G.K.; Fontana, A.; Teixeira, W.G. Manual de Métodos de Análise de Solo, 3rd ed.; Embapa: Brasília, Brazil, 2017; p. 574. [Google Scholar]
  17. Jackson, M.L. Specific surface determinations for soil. In Soil Chemical Analysis: Advanced Course, 2nd ed.; United Book Prints: New Delhi, India, 2014; pp. 305–360. [Google Scholar]
  18. Brown, G.; Brindley, G.W. X-ray Diffraction Procedures for Clay Mineral Identification. In Crystal Structures of Clay Minerals and their X-Ray Identification: The Mineralogical Society of Great Britain and Ireland; Brindley, G.W., Brown, G., Eds.; Mineralogical Society: London, UK, 1980; Volume 5, pp. 305–360. [Google Scholar] [CrossRef]
  19. Moore, D.M.; Reynolds, R.C. X-Ray Diffraction and Identification and Analysis of Clay Minerals; Oxford University Press: Oxford, UK, 1989; p. 352. [Google Scholar]
  20. Ribeiro, F.E.; Del Peloso, M.J.; Barbosa, F.R.; Gonzaga, A.D.O.; De Oliveira, L.F.C. Recomendações Técnicas Para o Cultivo do Feijoeiro-Comum (Phaseolus vulgaris L.) nas Regiões Norte e Nordeste do Brasil. Circular Técnico 89. EMBRAPA, 2011. 61p. Available online: https://www.infoteca.cnptia.embrapa.br/infoteca/bitstream/doc/916406/1/CIRCTECNICA89.pdf (accessed on 14 March 2025).
  21. Oliveira, F.M.D.; Farias, S.A.; Ceballos, B.S.D.; Azevedo, C.A.D.; Gheyi, H.R.; Oliveira, A.K.D. Diagnóstico de qualidade das águas da microbacia do riacho Angico, para fins de irrigação. Rev. Bras. Eng. Agric. Amb. 2005, 9, 221–225. [Google Scholar] [CrossRef]
  22. Kirkham, M.B. Principles of Soil and Plant Water Relations, 1st ed.; Elsevier Academic Press Publications: Amsterdã, The Netherlands, 2004; p. 520. [Google Scholar] [CrossRef]
  23. Hillel, D. Soil in the Environment: Crucible of Terrestrial Life, 1st ed.; Elsevier Academic Press Publications: Burlington, VT, USA, 2007; p. 320. [Google Scholar] [CrossRef]
  24. Souza, E.R.; Freire, M.B.G.S.; Cunha, K.P.V.; Nascimento, C.W.A.; Ruiz, H.A.; Lins, C.T. Biomass, anatomical changes and osmotic potential in Atriplex nummularia Lindl. cultivated in sodic saline soil under water stress. Environ. Exp. Bot. 2012, 82, 20–27. [Google Scholar] [CrossRef]
  25. Blum, A. Osmotic adjustment and growth of barley genotypes under drought stress. Crop Sci. 1989, 29, 230–233. [Google Scholar] [CrossRef]
  26. Vasquez-Tello, A.; Zuily-Fodil, Y.; Thi, A.P.; da Silva, J.V. Electrolyte and Pi leakages and soluble sugar content as physiological tests for screening resistance to water stress in Phaseolus and Vigna species. J. Exp. Bot. 1990, 41, 827–832. [Google Scholar] [CrossRef]
  27. Szogi, A.A.; Padilla, J.T.; Shumaker, P.D. Effect of soil pH and mineralogy on the sorption and desorption of phosphite and phosphate in Ultisol of the Southeastern Coastal Plain. Soil Sci. Soc. Am. J. 2024, 88, 1248–1258. [Google Scholar] [CrossRef]
  28. Doaa, M.; Ashmawi, A.E. Effect of Feldspar, compost and biochar on cultivating Cowpea (Vigna unguiculata ssp. unguiculata) plant and soil sandy clay loam properties. Asian Soil Res. J. 2022, 6, 42–57. [Google Scholar] [CrossRef]
  29. USDA—Soil Survey Staff. Soil Taxononmy—A Basic System of Soil Classification for Making and Interpreting Soil Survey, 2nd ed.; USDA: Washington, DC, USA, 1999; p. 871.
  30. Bekele, D.; Birhan, M. The characteristics, distribution and management of Alfisols. Int. J. Res. Stud. Agric. Sci. 2021, 7, 1–6. [Google Scholar] [CrossRef]
  31. Xie, R.; Han, P.; Wang, X.; Li, B.; He, B.; Ma, F.; Bai, X. Effects of Pore Fluids and Sand Particles on Electrochemical Characteristics of Sandy Soil Containing Soluble Sodium Salt. Int. J. Electrochem. Sci. 2020, 15, 3543–3562. [Google Scholar] [CrossRef]
  32. Sheta, M.H.; Abd El-Wahed, A.H.; Elshaer, M.A.; Bayomy, H.M.; Ozaybi, N.A.; Abd-Elraheem, M.A.; El-Sheshtawy, A.-N.A.; El-Serafy, R.S.; Moustafa, M.M.I. Green synthesis of zinc and iron nanoparticles using Psidium guajava leaf extract stimulates cowpea growth, yield, and tolerance to saline water irrigation. Horticulturae 2024, 10, 915. [Google Scholar] [CrossRef]
  33. Sá, F.V.D.S.; Silva, I.E.D.; Ferreira, M.; Lima, Y.B.D.; Paiva, E.P.D.; Gheyi, H.R. Phosphorus doses alter the ionic homeostasis of cowpea irrigated with saline water. Rev. Bras. Eng. Agric. Amb. 2021, 25, 372–379. [Google Scholar] [CrossRef]
  34. Le, L.T.T.; Kotula, L.; Siddique, K.H.; Colmer, T.D. Na+ and/or Cl toxicities determine salt sensitivity in soybean (Glycine max (L.) Merr.), mungbean (Vigna radiata (L.) R. Wilczek), cowpea (Vigna unguiculata (L.) Walp.), and common Bean (Phaseolus vulgaris L.). Int. J. Mol. Sci. 2021, 22, 1909. [Google Scholar] [CrossRef]
  35. Wests, D.W.; Francois, L.E. Effects of salinity on germination, growth and yield of cowpea. Irrig. Sci. 1982, 3, 169–175. [Google Scholar] [CrossRef]
  36. Coelho, J.B.M.; Barros, M.F.C.; Bezerra Neto, E.; Correa, M.M. Hydric behaviour and growth of cowpea cultivated in salinized soils. Rev. Bras. Eng. Agric. Amb. 2013, 17, 379–385. [Google Scholar] [CrossRef]
  37. Aryal, A.; Devkota, A.K.; Aryal, K.; Mahato, M. Effect of different levels of phosphorus on growth and yield of cowpea varieties in Dang, Nepal. J. Agric. Nat. Resour. 2021, 4, 62–78. [Google Scholar] [CrossRef]
  38. Faye, A.; Obour, A.K.; Akplo, T.M.; Stewart, Z.P.; Min, D.; Prasad, P.V.; Assefa, Y. Dual-purpose cowpea grain and fodder yield response to variety, nitrogen-phosphorus-potassium fertilizer, and environment. Agrosyst. Geosci. Environ. 2024, 7, e20459. [Google Scholar] [CrossRef]
  39. Emmanuel, O.C.; Akintola, O.A.; Tetteh, F.M.; Babalola, O.O. Combined application of inoculant, phosphorus and potassium enhances cowpea yield in savanna soils. Agronomy 2020, 11, 15. [Google Scholar] [CrossRef]
  40. Oliveira, W.J.D.; Souza, E.R.D.; Cunha, J.C.; Silva, Ê.F.D.F.E.; Veloso, V.D.L. Leaf gas exchange in cowpea and CO2 efflux in soil irrigated with saline water. Rev. Bras. Eng. Agric. Amb. 2017, 21, 32–37. [Google Scholar] [CrossRef]
  41. Behera, P.; Mahapatra, S.; Mohapatra, M.; Kim, J.Y.; Adhya, T.K.; Raina, V.; Suar, M.; Pattnaik, A.K.; Rastogi, G. Salinity and macrophyte drive the biogeography of the sedimentary bacterial communities in a brackish water tropical coastal lagoon. Sci. Total Environ. 2017, 595, 472–485. [Google Scholar] [CrossRef] [PubMed]
  42. Yan, N.; Marschner, P. Response of soil respiration and microbial biomass to changing EC in saline soils. Soil Biol. Biochem. 2013, 65, 322–328. [Google Scholar] [CrossRef]
  43. Dong, Y.; Chen, R.; Petropoulos, E.; Yu, B.; Zhang, J.; Lin, X.; Gao, M.; Feng, Y. Interactive effects of salinity and SOM on the ecoenzymatic activities across coastal soils subjected to a saline gradient. Geoderma 2022, 406, e115519. [Google Scholar] [CrossRef]
  44. Richards, L.A. Diagnosis and Improvement of Saline Alkali Soils, 1st ed.; US Department of Agriculture, United States of America: Washington, DC, USA, 1954; p. 166.
  45. Leal, L.Y.C.; de Souza, E.R.; Júnior, J.A.S.; Dos Santos, M.A. Comparison of soil and hydroponic cultivation systems for spinach irrigated with brackish water. Sci. Hortic. 2020, 274, e109616. [Google Scholar] [CrossRef]
  46. Ayers, R.S.; Westcot, D.W. Water Quality for Agriculture, 1st ed.; Food and Agriculture Organization of the United Nations: Rome, Italy, 1985. [Google Scholar]
  47. Maas, E.V.; Hoffman, G.J. Crop salt tolerance—Current assessment. J. Irrig. Drain. Div. 1977, 103, 115–134. [Google Scholar] [CrossRef]
  48. Maas, E.V.; Poss, J.A. Salt sensitivity of cowpea at various growth stages. Irrig. Sci. 1989, 10, 313–320. [Google Scholar] [CrossRef]
  49. Zhang, X.; Zuo, Y.; Wang, T.; Han, Q. Salinity Effects on Soil Structure and Hydraulic Properties: Implications for Pedotransfer Functions in Coastal Areas. Land 2024, 13, 2077. [Google Scholar] [CrossRef]
  50. Dos Santos, O.D.O.; Mendes, K.; Martins, S.V.C.; Batista-Silva, W.; Dos Santos, M.A.; De Figueirôa, J.M.; De Souza, E.R.; Pompelli, M.F. Physiological parameters and plasticity as key factors to understand pioneer and late successional species in the Atlantic Rainforest. Acta Physiol. Plant. 2019, 41, 1–18. [Google Scholar] [CrossRef]
  51. Melo, H.F.; de Souza, E.R.; de Almeida, B.G.; Mulas, M. Water potential in soil and Atriplex nummularia (phytoremediator halophyte) under drought and salt stresses. Int. J. Phytore Mediat. 2018, 20, 249–255. [Google Scholar] [CrossRef]
  52. Manaf, H.H.; Zayed, M.S. Productivity of cowpea as affected by salt stress in presence of endomycorrhizae and Pseudomonas fluorescens. Ann. Agric. Sci. 2015, 60, 219–226. [Google Scholar] [CrossRef]
  53. Coelho, J.B.M.; Barros, M.F.C.; Bezerra Neto, E.; Souza, E.R. Physiological permanent wilting point and osmotic potential of cowpea grown in saline soils. Rev. Bras. Eng. Agric. Amb. 2014, 18, 708–713. [Google Scholar] [CrossRef]
  54. Iwuagwu, M.O.; Ogbonnaya, C.I.; Onyike, N.B. Physiological response of cowpea Vigna unguiculata to drought: The osmotic adjustment resistance strategy. Acad. J. Sci. 2017, 7, 329–344. [Google Scholar]
Figure 1. Location of the collected soil profiles: Ultisol in the municipality of Goiana-PE and Alfisol in the municipality of Belém do São Francisco-PE.
Soilsystems 09 00036 g001
Figure 2. X-ray diffraction of the sand, silt, and clay fractions analyzed as unoriented powder from horizon b of (a) Ultisol and (b) Alfisol and the clay of (c) Ultisol and (d) Alfisol.
Soilsystems 09 00036 g002
Figure 3. Temperature and relative humidity in the greenhouse during the 80-day experiment.
Soilsystems 09 00036 g003
Figure 4. Yield of Vigna unguiculata cultivated in Ultisol or Alfisol under different electrical conductivity levels for 80 days. An asterisk indicates that the plants in the Ultisol did not produce pods.
Soilsystems 09 00036 g004
Figure 5. Water status of Vigna unguiculata cultivated in Ultisol and Alfisol under different levels of electrical conductivity for more than 80 days: (a) leaf water potential, (b) osmotic potential, (c) osmotic adjustment, and (d) relative water content.
Soilsystems 09 00036 g005aSoilsystems 09 00036 g005b
Figure 6. Electrolyte leakage from Vigna unguiculata cultivated in Ultisol or Alfisol under different electrical conductivity levels for 80 days.
Soilsystems 09 00036 g006
Figure 7. Electrical conductivity of Ultisol and Alfisol after 80 days of cultivation of Vigna unguiculata irrigated with water at different electrical conductivity levels.
Soilsystems 09 00036 g007
Figure 8. Soil CO2 efflux from Ultisol and Alfisol after 80 days of cultivation of Vigna unguiculata irrigated with water at different electrical conductivity levels.
Soilsystems 09 00036 g008
Table 1. Geographic coordinates, altitude, average annual precipitation, average annual temperature, climate, and vegetation of the areas where soil was collected for this study [13,14,15].
SoilsMunicipalityLocalization
(GPS)
Altitude (m)Precipitation (mm)Temperature
(°C)
Climate
(Köppen–Geiger)
UltisolGoiana7.64° S, 34.96° W1393823 a 28Aw
AlfisolBelém do São
Francisco
8.74° S,
38.85° W
30543222 a 31BSh
Aw—tropical with dry winter; BSh—hot, semi-arid climate.
Table 2. Chemical and physical attributes of the collected soils.
AttributesUltisolAlfisol
pH (H2O 1:2.5)4.506.70
EC (dS m−1)0.40.8
H + Al (cmolc dm−3)3.520.66
Ca (cmolc dm−3)0.805.0
Mg (cmolc dm−3)0.602.30
Al (cmolc dm−3)0.430.00
Na (cmolc dm−3)0.050.21
K (cmolc dm−3)0.030.35
P (mg dm−3)0.006.00
CEC (cmolc dm−3 pH 7)5.008.52
Bd (g cm−3)1.241.87
Pd (g cm−3)2.552.56
CS (g Kg−1)428220
FS (g Kg−1)236170
Silt (g Kg−1)156250
Clay (g Kg−1)180360
DCW (%)4564
FD (%)7573
DD (%)2526
pH = potential of hydrogen, EC = electrical conductivity, H + Al = potential acidity. Exchangeable cations: calcium (Ca), magnesium (Mg), aluminum (Al), sodium (Na), and potassium (K). Bd = bulk density, Pd = particle density, CEC = cation exchange capacity, CS = coarse sand, FS = fine sand, DCW = dispersed clay in water, FD = flocculation degree, DD = dispersion degree.
Table 3. Mean concentrations and standard deviations of growth variables of Vigna unguiculata cultivated in Ultisol or Alfisol. Means followed by the same letter (uppercase for electrical conductivity (EC) level and lowercase for soil type) did not differ according to the Scott–Knott test (p ≤ 0.05).
EC (dS m−1)DMAP (g)DMR (g)H (cm)SD (cm)
04.00 Ab ± 0.87 1.21 Ab ± 0.15 101.65 Ab ± 8.235.05 Aa ± 0.34
1.51.91 Bb ± 0.32 1.23 Ab ± 0.20 85.50 Bb ± 16.665.66 Aa ± 1.33
Ultisol3.01.04 Cb ± 0.34 0.51 Bb ± 0.10 75.32 Bb ± 20.544.60 Ab ± 0.87
4.50.14 Db ± 0.04 0.42 Bb ± 0.09 51.75 Cb ± 16.903.86 Bb ± 0.14
6.00.14 Db ± 0.07 0.29 Bb ± 0.03 35.00 Db ± 2.163.90 Bb ± 0.54
9.0* 0.12 Bb ± 0.02 33.00 Db ± 0.813.41 Bb ± 0.02
05.36 Ba ± 0.492.95 Aa ± 0.54119.00 Aa ± 9.015.75 Aa ± 0.23
1.56.17 Aa ± 0.64 2.69 Aa ± 0.51 103.00 Ba ±17.526.47 Aa ± 0.30
3.05.38 Ba ± 1.312.02 Ba ± 0.25102.50 Ba ± 26.686.41 Aa ± 1.02
Alfisol4.54.23 Ca ± 0.931.82 Ba ± 0.3895.50 Ba ± 13.305.99 Aa ± 0.20
6.04.65 Ca ± 0.711.90 Ba ± 0.2196.00 Ba ± 23.305.79 Aa ± 1.33
9.04.03 Ca ± 1.001.54 Ca ± 0.3563.25 Ca ± 15.526.70 Aa ± 1.24
DMAP = Dry mass of the aerial portion of the plant, DMR = dry mass of the roots, H = plant height, SD = stem diameter. * no data.
Disclaimer/Publisher’s Note: The statements, opinions and data contained in all publications are solely those of the individual author(s) and contributor(s) and not of MDPI and/or the editor(s). MDPI and/or the editor(s) disclaim responsibility for any injury to people or property resulting from any ideas, methods, instructions or products referred to in the content.

