Abstract
Climate change has become a global nightmare, and the awareness of the causes of carbon emissions has resulted in rigorous studies. These studies linked the increase in global warming with booming economic growth. Since global warming has become more apparent, researchers have explored ways to decouple economic activities from carbon growth. Economic and carbon growth must be decoupled to achieve a low-carbon economy to support the carbon-growth plan or emission-reduction strategy. The world is transitioning toward a carbon-neutral and green ecosystem, so finding ways to decouple carbon emissions from economic activities is an exciting topic to explore. This study reviews current information on the importance of decoupling energy from economic growth innovative techniques that thoroughly examine the challenges and constraints of low-carbon energy systems. In order to examine the detrimental effects of carbon emissions on ecosystems and the ways in which economic expansion contributes to carbon footprints, more than three hundred research papers were gathered using several search engines, including Elsevier and Google Scholar. This review revealed that decarbonization and dematerialization had been achieved without declining global economic growth. It also provides information on energy use and economic activities leading to global carbon emissions and alternative solutions to the global challenge of climate change. The decoupling methods commonly used to determine the impact of energy decarbonization on economic growth are explored. All the results suggest that economic growth is a primary mover of global carbon emission increase and must be separated to achieve a carbon environment.
1. Introduction
Global warming caused by greenhouse gas emissions (GHG) has led to the loss of lives and infrastructures worldwide. This unfortunate incident has become a disturbing problem facing the global community. Fossil fuel consumption has been identified as the primary source of greenhouse gas emissions [1,2]. In 2012, the carbon dioxide generated by GHGs and released into the atmosphere was 47,599 million tons (MtCO2), increasing to about three times in the past six decades. In 1960, it was 9385.8 million tons and drastically increased to 36,138.3 in 2014, with a compound growth of 2.6% [3,4]. The increase in gas emissions shown in has contributed to global warming, ravaging the world. Economic growth is identified as the principal mover of climate change and reducing the consequence of CE. Delinking economic growth from environmental harm is essential. The United Nations Environmental Protection Agency defines “Decoupling” as the process where economic growth is decoupled from GHG emissions, according to [5]. Similarly, according to Organization for Economic Cooperation and Development (OECD), decoupling helps reduce economic advances’ effect on the environment [6].
Correspondingly, Juknys [7] confirmed that the decoupling initiation aimed to detach economic growth from resource usage, which may reduce carbon discharge with the evolution toward a low-carbon energy system. However, this process requires joint participation and effort from other countries to succeed. The shift from fossil fuels and coal to renewable energy is still a big issue in South Africa and globally. For instance, the conflict between Russia and Ukraine shows that several countries still depend on fossil fuels [6]. The global world should focus and invest more in renewable energy initiatives to overcome global emissions. There is a need for scholars to pay more attention to this challenge and propose viable solutions.
Furthermore, Africa has not only redirected resources toward building and establishing a low-carbon economy, but Europe and other countries are doing the same [5] and projected and committed to carbon neutrality by 2050 [8,9]. However, extreme weather conditions such as heat waves, drought, floods, heavy rain, and landslides from climate change ravage the world’s nations, including the Europeans. The ravaging consequences of the rapidly changing climate, such as ocean acidification, rising sea levels, and biodiversity damage, need quick solutions. Countries focus on helping the world transition toward low-carbon systems for a sustainable future. South Africa, for example, in its transition toward carbon neutrality, presented the Bioeconomy Strategy, its strategy that plans to make South Africa green by 2050 [5,6,7,8,9].
Furthermore 2002, the Organization for Economic Cooperation and Development (OECD) proposed a decoupling theory to separate economic growth from environmental pressure [9,10]. Moreover, the literature on decoupling has expanded to include environmental pressure sources, including energy usage, soot, SO2, and wastewater [11,12,13,14,15]. Researchers worldwide have been exploring ways to decouple economic growth (DEG) from carbon emissions (CE) since the consequences of global warming have become more evident.
1.1. Definitions and Aims of Decoupling
According to the United Nations Environment Programme (UNEP) [5], “decoupling” means decoupling economic growth from environmental degradation and reducing resources used to generate economic growth. Decoupling aims to ensure a rapidly growing economy, as defined in both definitions. Growth and emissions need to be decoupled to achieve low-carbon global development. The literature on carbon dioxide emissions CDE revealed that even if CE is reduced further and stricter policies are established before 2030, fossil fuels would still emit 850 to 1150 Gt of CO2 from 2016 to 2100 [16]. Despite many empirical studies analyzing the relationship between CE and economic growth (EG), the exploration has yet to demonstrate uniformity regarding this relationship’s possible channels, key drivers, and levels (states). For example, recent studies have demonstrated a decoupling between CDE and EG [17,18,19]. However, a study by Hilmi et al. [20] and Jiborn et al. [21] found no evidence of decoupling.
Moreover, “decoupling” happens once the growth rate of GHG emissions is less than or stable relative to the growth rate of economic factors (e.g., GDP). In 2016, over 170 countries endorsed the Paris Agreement, limiting temperature increases by less than 2 degrees Celsius over the next century [22]. The United Nations Framework Convention on Climate Change (UNFCCC) requires members to reduce their carbon emissions immediately [23]. 2015, China identified the highest CDE emitted globally and quantified 750 million tons between 2019 and 2020 [24]. This CDE makes China a central point for reducing global carbon dioxide emissions [24].
1.2. Adverse Impact of Carbon Emission on Environment and the Way Out
Several studies have pointed to China as one of the principal carbon emitters globally, drawing international attention [25,26]. Studies have also shown that climate change negatively impacts human health, well-being, and livelihood [27,28,29]. Despite unprecedented growth and development of the world’s economy since 2000 and emissions from different sources shown in Figure 1, carbon dioxide emissions have also increased, leading to increased temperature-related record-breaking rates [30].
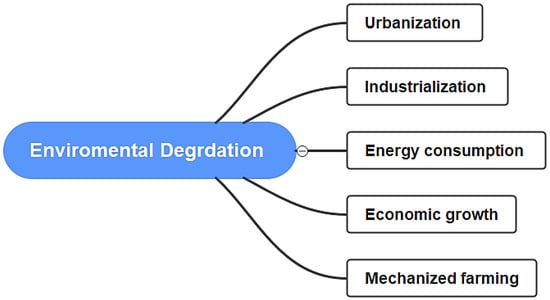
Figure 1.
The sources of carbon emission and their adverse impacts on the environment.
Even if emissions are reduced to levels consistent with representative concentration pathway 2.6 (RCP 2.6), extreme temperatures may still occur in the coming decades [30]. Therefore, completely decoupling of economic growth from carbon emissions is a viable way to reduce extreme temperatures resulting in global warming. This present study reviews recent literature that focuses on decoupling economic growth from carbon emissions and analyzes the root cause of climate change, which has become a global monster. Using search engines like Google Scholar and Elsevier, more than three hundred research articles were reviewed to determine the detrimental effects of carbon emissions on ecosystems and how economic expansion adds to carbon footprints. It also provides valid information on the overviews of decoupling techniques and strategies implemented to reduce the consequence of climate change and factors limiting decoupling activities, climate economics, policy implications, decarbonization, dematerialization, and information on techniques available to tackle these challenges were discussed.
2. Overview of Decoupling Techniques
According to Zhang [31], Von Weizsacker first proposed decoupling in 1989 to capture the coincident interplay between EG and environmental damage. Knowing this, he studied the dependence on emitting carbon dioxide emissions to boost China’s economy, attempting to apply the decoupling concept to the environmental sphere. Decoupling indicators, namely, absolute and relative decoupling, were introduced by the Organization for Economic Cooperation and Development (OECD) into its decoupling model to clarify the decoupling concept [10].
2.1. Decoupling Methods for Separating Energy Use from Economic Growth
Juknys [32] distinguished primary decoupling from environmental pollution and secondary decoupling from natural resource consumption, whereas dual decoupling occurs when primary and secondary decoupling coincide. Currently, three decoupling methods are commonly explored to examine the fundamental association between energy use and the degradation of the environment due to energy use. One of these methods is the Taipo decoupling technique, which outlines three types: primary, secondary, and doubled decoupling, as shown in Figure 2 [32,33].
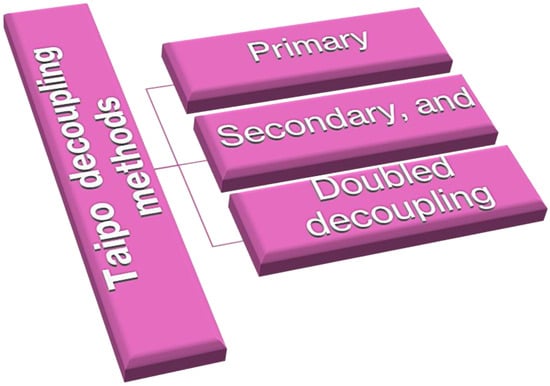
Figure 2.
Classifying taipo decoupling technique commonly used for decoupling of carbon emission and economic growth.
Primary decoupling is defined as decoupling the use of natural resources from EG. Secondary decoupling is defined as decoupling the consumption of natural resources from environmental pollution. Double decoupling materializes when primary and secondary decoupling coincides. Based on decoupling elasticity, this model was classified into eight types. Decoupling includes strong, weak, and expansive decoupling; expansive and recessive couplings; and strong, weak, and recessive.
2.2. Theoretical Foundations for Decoupling Economic Growth and Carbon Emissions
2.2.1. Kuznets Curve
The Kuznets curve is one of the most important theoretical foundations for decoupling economic growth and carbon emission, commonly explored for coupling and decoupling economic growth and pollutants. It is used to define how economic growth relates to environmental quality [34,35,36,37,38]. Wang, Yang, and Rongrong [35] explored the traditional environmental Kuznets curve (EKC) to investigate the influence of urbanization on the coupling of economic growth and environmental quality. They developed threshold panel models using 56 countries’ data, setting economic growth as explanatory variables and carbon emission as the explained variable. This study confirmed that economic growth strongly influences the increase in carbon emissions during low-income inequality as this income severely increases the complexity of economic growth and carbon emission decoupling. This implies that income inequality significantly increases carbon emissions, and an income distribution policy was suggested to regulate excessive income inequality. They analyzed the decoupling influence of the impact of trade on carbon emissions and which circumstance trade can decouple carbon emission using the combination of Tapio and the decoupling threshold model for 124 countries selected globally between 2000 and 2018. A weak relationship between economic growth, carbon emission, and trade openness was observed and suggested that countries of different income groups must benefit from fairer free trade before carbon neutralization [38].
Erdogan, Okumus, and Guzel [34] used EKC to examine the impact of renewable and non-renewable energy, economic growth, oil price, energy consumption, and trade openness on carbon emission in 25 OECD countries from 1990 to 2014. First- and second-generation estimation techniques, which are dynamic ordinary least squares (DOLS) and fully modified ordinary least squares (FMOLS), were adopted to provide comparative panel data shreds of evidence. The EKC hypothesis is confirmed valid in OECD countries, but the augmented mean group (AMG), the second-generation estimator, revealed that the EKC hypothesis is invalid. At the same time, the augmented mean group estimator offers stronger results under sectional dependence than DOLS. They also discovered that trade openness and carbon emissions are unrelated [37].
2.2.2. Tapio Model
The introduction of the Tapio model and its uses have become increasingly common in environmental science [39,40]. Many scholars have used this model to investigate the affiliation between resource consumption and carbon dioxide emissions [41,42,43,44,45,46]. The scientific evaluation mechanisms of Tapio’s model, such as the elastic analysis method and the decoupling index model (OECD’s model), increase their application, leading to the wide use of scientific evaluation mechanisms [47]. Tapio [33] used the decoupling elasticity concept of Juknys to develop a decoupling indicator used by the European transport industry by identifying three categories of complement: coupling, decoupling, and negative decoupling. After this, eight reasonable possibilities were particularized for distinguishing between decoupling states: recessive coupling; expansive coupling; weak negative decoupling; strong negative decoupling; expansive negative decoupling; and weak, strong, and expansive decoupling. These methods are widely acknowledged and used to examine EG, EC, or environmental concerns [48].
Furthermore, Freitas and Kaneko adopted this method [49] to analyze the relationship between Spanish EG and EC. They were similarly used to study the decoupling of Brazil’s EG from 2004 to 2009 regarding CO2 emissions related to energy. Zhang and Wang [50] also used this method to analyze the decoupling between energy-related CO2 emissions and GDP in Jiangsu Province (China) from 1995 to 2009. An experimental study by Jiang et al. [50] determined whether six major industries in China are decoupled from EG and CO2 emissions using the same model. Wang et al. [51] used three decoupling models to explore the decoupling between the world economy and CE: the IGTX decoupling model, the Tapio decoupling elastic model, and the OECD decoupling factor model. Based on the comparative analysis, it was concluded that the Tapio model was more precise and was not time-bound. Wang et al. [51] used it to create a model to decouple water resources from the environment. Research into the relationship between China’s urban water resources environment and the economic development of regional cities was conducted in the three developed cities of Beijing, Shanghai, and Guangzhou [50].
Zhang and Bai [52] investigated the decoupling relationship between populated energy consumption and income levels using the Tapio decoupling model and showed a significantly decreased decoupling index since 2000. A study by Wang et al. [53] utilized the Generalized Divisia Index method and the enhanced Tapio model to evaluate the drivers of CE in the Chinese transport sector and the elasticity decoupling between EG and CE.
2.2.3. Log Mean Divisia Index (LMDI)
According to Zhang et al. [54], the Log Mean Divisia Index (LMDI) theory identifies the profound reason behind the decoupling status. Diakoulaki and Mandaraka [55] created a decoupling indicator for each country, based on a sophisticated Laspeyres decomposition model, to evaluate the effectiveness of the efforts commenced in each country. The LMDI method was the most effective method of studying influencing factors in Ang’s [56] review of all decomposition techniques.
Another decoupling pointer was developed by Zhang and Wang [57] using the LMDI method to analyze the electricity consumption decoupling from China’s EG. In the environmental literature, the Kaya identity and the decoupling index were proposed by Tapio [33], and the LMDI was proposed by Ang [56]. These identified indexes analyze the decoupling energy consumption trajectory per capita and year of household income. The Tapio decoupling index and the LMDI decomposition approach shown in Figure 3 are employed to study the relationship between EG and CO2 emissions and decompose total CO2 emissions into predetermined factors to determine the Kaya identity. The rapidly changing climate pattern across the globe is considered a result of environmental changes caused by China [58]. Siping et al. [59] studied the decoupling of economic output and pollutant discharge fees for China’s Yunnan province by applying the Tapio decoupling elasticity.
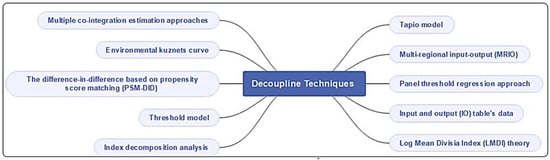
Figure 3.
The decoupling technique used for separating economic growth from carbon emissions.
Overall, the Yunnan province showed strong decoupling, while weak and expensive negative decoupling was pragmatic in some years. Jiang et al. [60] combined the Tapio model with the environmental Kuznets curve (EKC) model to examine the CO2 emissions of China’s Guangdong province from 1995 to 2014. Wang et al. [61] examined the decoupling status of individual sectors in China and the United States and the driving forces of CO2 emissions by employing the Tapio and LMDI modeling methods. In this regard, this review provides current information on the importance of decoupling energy from economic growth. It examined the techniques and factors limiting decoupling activities to achieve low-carbon energy systems. It also analyzes the limitations of the impact of economic and policy implications of climate change. It also investigates recent research and innovation and the challenges and constraints in using low-carbon energy systems. This study proved that the development of low-carbon energy sectors is critical to achieving the decoupling of economic growth from carbon emissions. The low-carbon energy system could be achieved by reducing the carbon intensity of energy and energy intensity of gross domestic product (GDP), which may eventually reduce the impact of energy decarbonization on economic growth. Moreover, this new insight provides a better understanding of the decoupling between economic growth and carbon mission, which might contribute to carbon footprint-reduction pathways.
3. Factors Limiting/Contributing to Decoupling Activities
Several factors restrict decoupling, including the carbon coefficient, the economic structure effect, the labor force input effect, and the investment effect. In addition, Xie et al. [62] employed the Tapio and LMDI models to investigate the influences prompting the decoupling of CO2 emissions from the gross domestic product (GDP) in China’s power industry, concluding that economic scale and electrification were two significant deterrents. Li and Qin [63] reported that between 2015 and 2030, China’s CO2 emissions would decouple from its economic development significantly. Many scholars have analyzed the Tapio decoupling model to quantify the contributions of solid factors influencing decoupling [64]. It was determined that income, carbon intensity, population, and energy structure contributed to decoupling CE from China and the U.S. economy. However, most of the outcomes of these studies are just in black and white but not implemented. Implementing these findings may have helped reduce CE.
To investigate the decoupling between Liaoning’s energy consumption and GDP, Dong et al. [65] considered five decoupling indicator factors: the energy mix, labor, economic activity, energy intensity, and investment. Zhao et al. [66] used these factors to assess the impact of specific sectors on decoupling China’s economy from CE. Also, to measure the variables that impact decoupling, certain scholars have sought to determine the effectiveness of environmental policies [67,68,69,70,71] and premeditated the decoupling effort indices of CE from the economy for each province. They analyzed the effectiveness of energy efficiency implementations, energy structure changes, and other procedures aimed at decoupling achievement. Having calculated the current decoupling effort index and evaluating the contributions of energy intensity, energy structure, and population to the decoupling efforts, Román et al. [12] decided that the current decoupling dealings were meticulous. Nonetheless, additional effort was required. Jiang [70] determined the decoupling effort index measures the influence of energy-conservation and emission-reduction measures on the decoupling of China’s construction industry carbon emissions.
3.1. Protectionism
Protectionism is another limitation to decoupling activities, becoming the primary hesitation accompanying the global economy, energy, and the environment. The restriction implemented by public health emergency international concern and different countries to curb the spread of COVID-19 adversely affected international trade. Consequently, this isolationism induced challenges to carbon footprint reduction in both developed and developing countries. Wang and Zhang [71] investigated the impact of trade openness on separating carbon emissions from economic growth after recognizing and increasing awareness of protectionism. The crucial need for implementing economic growth and carbon emission decoupling by the intended nationally determined contributions (INDCs) was one of the motivations for this study. They explored the influence of protectionism on the disconnect economic growth from carbon emission, considering data available for 182 countries between 1990 and 2015. This study’s outcome shows that trade openness benefits only high- and upper-middle-income countries, as a decrease in carbon emission is seen in countries of these categories. In contracts, trade openness adversely affects low-income countries as their carbon emission drastically increases with trade openness. A targeted policy to regulate countries’ income with trade openness is advised. This study corresponds with Wang, Yang, and Rongrong’s [34] study, stressing the creation and implementation of targeted policies to regulate countries’ income.
3.2. Effect of Energy Transiting on Energy Uses and Economic Growth
The impact of energy transiting on energy uses and economic growth must be considered for achieving decoupling activities—the question of whether energy transition encourages economic growth and CE must be answered. Wang and Wang [72] answered this question by investigating how energy transition influences CE and economic growth at national and global scales using a decoupling index model and decomposition approach. This combined approach detected the decoupling state and the factor that drives the global decoupling process. One hundred eighty-six countries considered between 1990 and 2014 were categorized into three classes, lower middle income (LMI), upper middle income (UMI), and high income (HI). The Hi experienced initial realization of desirable strong decoupling, but UMI and LMI decoupling states were not yet realized, and LMI showed no clear improvement trend.
4. Climate Economics and Policy Implications
First, individuals need basic information about climate change and its implications. Climate change mitigation will benefit those motivated to engage in appropriate activities [73,74,75]. Given this, regular media communication is necessary, regardless of media sequences of consideration [76], for keeping the effect of climate change on the public’s mind. In the U.K.‘s climate change policies [66,77,78,79], little attention is given to behavioral change, primarily directed toward individuals reducing their energy use by giving information and providing economic incentives and subsidies. In late 2009, the European Commission established strategic policy targets (20-20-20) for 2020. This policy target was reviewed in the Climate and Energy Policy 2030 document in October 2014. The European Commission published an update to its energy policy framework for 2020 to 2030 titled “Clean Energy for All Europeans” in November 2016. Regulation (E.U.) 2018/842 [80] has been published on binding annual greenhouse gas emissions reductions by the Member States from 2021 to 2030. The European Union’s introduction of successive new emission-reduction targets proposes a need to evaluate how current E.U. energy policies have impacted the decoupling of emissions from economic growth [81,82].
4.1. Emission Scenarios and Options for Greenhouse Gas Emission Reduction
The IPCC reported scenarios representing alternative visions of how the future may unfold and represent a suitable means for scrutinizing how driving forces may impact future emissions outcomes and evaluating the reservations surrounding them. Their responsibilities include analyzing climate change and assessing impacts, climate modeling, mitigation, and adaptation. Ongoing evaluation and comparison of long-term emission scenarios, such as frequently updated scenario database, must be established [83]; (1) capacity building should be performed, particularly in developing countries, modeling tools, and emission scenarios [84]; (2) future scenario analyses should be performed using multiple storylines and models [85]; (3) the development of innovative research actions should be performed to assess impending developments in critical GHG powerful drive in greater detail at the subregional, regional, and sectoral levels, allowing more specific emissions scenarios and mitigation option linkages [86]; (4) enhanced specification and data for and integration of the non-CO2 GHG and non-energy sectors should be targeted, such as land-use change, model inter-comparison, and forestry, to advance situations and scrutinize [87]; (5) integrating particulates, hydrogen, or aerosol nitrate precursor emissions into models and progressions, such as a response from climate change on emissions, may meaningfully impact situation analysis and results.
Developing further gridded emissions for scenarios could enhance regional assessment [88]; (6) this can be performed along with priorities to assess strategies addressing multiple national, regional, or global issues [89]; (7) China seems to be taking a comparable emission pathway to the global one. China’s 1.5 C scenario motivation primarily emphasizes the subsequent influences, as opposed to the 2 C scenario analysis: this includes a significantly sophisticated stake of electricity consumption in end-use sectors such as transportation, construction, and industry, and by or before 2050, zero or negative emissions from the power generation sector. Generally, most emission scenarios that target 1.5 °C by 2100 exceed those shown in Figure 4, meaning the net carbon budget will be 400 Gt CO2. The number of CO2 emissions previously going to zero depends on the harmful emissions following zero. Global CO2 emissions may reach zero in 2050 and 2060 if the current Shared Socio-Economic Pathways (SSPs) with the subsection designated for Coupled Model Intercomparison Project Phase 6 (CMIP6) are well followed and implemented [90].

Figure 4.
The 1.5 °C scenario map under different levels of energy—GDP decoupling, RE speed, and NETs [89].
According to the SSPs, CD-LINKS, and ADVANCE study, the global carbon budget should range from 800 to 900 Gt with harmful emissions of 400 to 500 Gt [90,91,92]. In both countries, the power sector is the most substantial source of GHG emissions. By 2050, the fossil-fuel-dominated power sector will account for over half of all GHG. Growth in income and an increase in electrification rates are expected to drive a rise in power demand in both countries in the future [93,94,95]. Researchers have noted that renewable energy (RE) technologies may be critical in reducing GHG to stabilize at 450 ppm CO2 equivalent attentiveness by 2100 [96]. In absolute terms, India and China are projected to become the largest energy consumers by 2030, as predicted by the International Energy Agency 2017 [97]. Consequently, both countries must reduce their emissions substantially to accomplish the 450 ppm CO2-Equiv concentration stabilization target, but decisive extenuation actions could also hinder these countries’ EG.
4.2. Costs of Greenhouse Gas Emission Reduction
As a standard unit of measurement, emissions, costs, and profits are often expressed as dollars per metric ton and costs beyond business as usual to 2030, as shown in Figure 5. A general cost of carbon, as a comparison, is an estimate of the net current value of monetized social compensations after emissions of more CO2; according to the US government, the social cost of carbon for a ton of emissions in 2017 was approximately USD 46 in 2017 dollars [96] (1). Approximately nine kilograms of CO2 is produced by burning one gallon of gasoline, so a social cost of carbon of USD 46 per metric ton corresponds to USD 0.41 per gallon (2). The estimates are based on the leveled cost of electricity published by the US Energy Information Administration (2018). The energy cost per megawatt-hour is calculated by combining discounted capital, operating, and maintenance expenses based on the typical generator utilization rate.

Figure 5.
The McKinsey marginal abatement cost curve (Mckinsely 2009).
These estimates are comparable to those in the private sector [97]. As a result of these estimates, natural gas combined cycles, onshore wind, utility-scale solar photovoltaics, and natural gas with carbon seizure and storage are the least expensive technologies that can be used to reduce emissions relative to coal. This reduction with some land use rules is relatively low because a randomized controlled experiment conducted by [98] identified that forest conservation costs in Uganda considerably reduced deforestation at the cost of USD 1/ton.
Consequently, low-cost, zero-carbon, fossil fuel substitutions are essential for decreasing GHGE in the future. Therefore, investment or intervention costs must comprise face value, cost, and spillovers, which may reduce emissions costs soon. Several alternative cost measures have been reported to be aimed at reducing this cost, including, but not limited to (1) the carbon tax required for measuring the marginal cost of reducing emissions for each ton of emission reduced; (2) the marginal cost of reducing emissions combined with all reductions known as the total direct cost; (3) a reduction in the GDP, which is a measure of the total amount of goods and services produced by the economy, and as such may also take into account the influence of CE decreases on technology and capital accumulation; as well as (4) compensated income variation, which is the amount that consumers would require to be compensated for to have the same utility level as they would have with the emissions-reduction program.
5. Policy Instruments for Greenhouse Gas Emission Reduction
In Austria, several policy instruments are in place or are currently being discussed to simplify accomplishing these policy goals. A policy instrument premeditated to reduce GHG emissions directly is anticipated to be cost-effective if it allows efficient distribution of reduction efforts between market contributors and knowhows. However, in this scenario, cost-effectiveness concerning fossil fuel replacement may still be low since reducing GHG emissions does not necessarily correspond to substituting fossil fuels [99]. A policy instrument’s cost-effectiveness relates to the costs of achieving its objectives and is strongly influenced by the accessibility of bioenergy technologies in energy-consuming industries. Environmental policy instruments used to change polluters’ behavior impact the choice of technical measures, the outcome, and the cost of abatement and transactions related to those policies. Some policies may have adverse environmental consequences, such as subsidies tied to production.
5.1. Impacts of and Adaptation to Climate Change
There is an increasing necessity to adapt to climate change across human and natural systems, despite global efforts to reduce emissions, such as those arising from the Paris Agreement. This reduction can involve various short- to long-term adjustments in socio-ecological systems, influenced by interacting non-climatic factors to moderate damage or take advantage of opportunities that may arise from climate change’s actual or anticipated impact [100]. The concept of adaptation cannot be easily reduced to theoretical or computational rules [101]. This is due to objective and subjective uncertainties associated with climate change impacts, vulnerability, and an adapting factor’s options [102].
Additionally, adaptation is limited by real-world constraints such as resource availability and human and institutional capacity. It can be complicated by organisms’ spontaneous and natural responses to changing conditions [103]. Multiple systems are included in adaptation initiatives, such as the environment, coasts, agriculture, water, health, and urban areas. As far as effective adaptation is concerned, there is little consensus. Despite several frequently proposed plans, for this reason, implementation has been a great challenge. Moreover, adaptation efforts are frequently hampered by competing or conflicting priorities for action, prohibitive policies, insufficient resources, and uncertainty about future developments [104]. Various factors influence adaptation efforts, including power dynamics, politics, motivation, funding, and cultural values.
Depending on the creativity setting, it may produce different results in a different community. Lastly, it is sometimes challenging to differentiate climate adaptation from other related activities, including but not limited to dropping risks associated with environmental disasters or alleviating poverty, thus complicating the acknowledgment process. For example, the IPCC claims that the addition of climate adaptation into sustainable development strategies may lead to win–win scenarios [105].
5.2. Economic Impacts of Climate and the Social Cost of Carbon
The probable impacts of climate change are typically measured using a neoclassical welfare economics standpoint [106]. Several experts were mobilized to evaluate the impact of global warming in 2001. Their evaluation revealed that this measurable phenomenon would affect weather patterns and probably worsen under the effect of human doings [107]. The growing understanding of this phenomenon resulted in an empirical study of the economy to mitigate risks that could affect human well-being and habitation. Their study shows that the SCC concept is essential for analyzing economic development and executing climate policies [108]. It was also defined as the economic cost associated with an incremental unit of CO2 emissions [109].
The Interagency Working Group (IWG) of the U.S. federal government initially used SCC to monetarize the external cost of CE and evaluate climate and energy strategies in 2010 [110]. Several methodologies have been used to approximate SCC by dividing it into two alternative approaches with high uncertainty: the cost–benefit scrutiny and the marginal cost technique. Integrated assessment models (IAMs), including the dynamic integrated climate-economy model (DICE); policy analysis of the greenhouse effect model (PAGE); and Framework for Uncertainty, Negotiation, and Distribution Model (FUND), have been updated through the probability density purpose and other trivial revisions’ incorporation [111]. Following reference emission scenario 1, the SCC displayed the future cost consequent to global climate change associated with one extra ton of CO2 emitted per year. Due to CO2′s long atmospheric lifetime, these effects are aggregated and bargain-basement over a century [112]. Putting the outcome of this study into concentration and scrutinizing it further may help to create policies aimed at reducing future cost consequences, which will invariably lower the amount of CO2 emitted per year. Achieving this requires proper implementation of these policies with close monitoring.
5.3. Optimal Climate Policy and the Social Discount Rate
To set an optimal carbon price, its social (welfare) costs should be equivalent to the present consumption rate of the revolution in the discounted utility of consumption per unit of additional emissions. Discount rates decline under hesitation and over time [113]. According to Giglio et al., 2015, discount rates for prospects around 100 years are 2.6%. The optimal tax is 126 dollars/tCO2e for a high discount rate: an eight-fold upsurge over the 16 dollars/tCO2e reference point. The increasing probability of at least one sloping point achieved in 2100 was 11 percent, compared to 46 percent for a tax of 16 USD/tCO2e [114]. A discount rate decrease may increase the optimum to about 460 USD/tCO2e.
The social discount rate (SDR) renovates future costs and benefits into existing units of account, called “present values”, for evaluating public policy, programs, and projects. These reflect how time values evolve with time horizons and can be used to compare alternative courses of action with various time outlines of costs and benefits. As a result, social discounting is essential in determining whether government action is cost-effective [115]. According to the approach taken in the general appraisal, SDRs represent the expected state of the world in which net benefits will accumulate in the future, as well as the risks allied with future income advance [116], societal favorites for the intertemporal trade-offs associated with the investment [117], and alternatives available in the economy because of public investment [118].
Discount rates are directly related to uncertainty topics: as with any other interest rate, the discount rate is determined by the inherent risk of the transaction under consideration, whether it is equity (investment financed by the investor’s capital), debt (an investment financed by third parties), etc. This is a function of the stakeholders’ perceived risk (and their desire to safeguard against unfavorable future events) under a given macroeconomic and regulatory environment [45]. In contrast, high discount rates oppose policies that reduce greenhouse gas emissions by improving building energy efficiency [119]. Additionally, it is suggested that benchmark discount rates used in life-cycle assessments of energy supply facilities be lowered so that project options intended to reduce consumption and emissions do not fall under the radar [120]. Sustainable energies are generated using solar, wind, inverter, and batteries. These devices are currently expensive and need benchmark discount rates to be affordable for masses use. The massive adaptation of sustainable energy may reduce the consumption of energy generated from carbon emission facilities.
6. The Possibility of Decarbonization and Dematerialization without Global Economic Growth Decline
A decrease in CE is attributed to energy efficiency gains and substantial progress in decarbonizing the energy sector, following the expectations found in the academic literature concerning dropping carbon intensity [121]. As a result of a global carbon price placing the global economy on a 2 °C warming path, decarbonization is motivated by altering price relationships for diverse energy technologies. Deep Decarbonization Pathways (DDPs) are critical in filling the climate policy dialogue gaps since they provide additional detail on the requirement for reducing emissions following 28 °C. The DDPs contain detailed plans for deep decarbonization activities by sector and overtime as a condition for remaining within the carbon budget. Many technologies and machinery contributing to CO2 emissions—such as industrial boilers, power plants, heavy-duty vehicles, industrial boilers, agricultural sectors, transportation, and buildings—have elongated operational lives over the remaining time between now and 2050 [122]. DDPs must serve as a public reference point for nations to guarantee that changes in the energy sector and other decarbonization efforts (e.g., land use) support long-term goals, such as environmental protection, energy access, public health, employment opportunities, public health, etc.
According to recent studies, using just energy sectors and direct emissions alone might flop to achieve profound greenhouse gas reductions unless it is supplemented by policies targeting materials’ usage and their associated embodied emissions directly [123,124,125,126,127]. The use of materials and their embodied emissions is significant from two perspectives. In the first instance, the increase in material consumption is expressively higher than energy consumption, according to the International Resource Panel (IRP) [128]. Interestingly, while the report indicates that material extraction grew 3.4 times between 1970 and 2017, fossil energy extraction grew 2.5 times during that time. Therefore, material use per capita rose from 7.4 tons in 1970 to 12.2 tons in 2017 [129].
Because of such excess material use, a 120% increase in climate-related emissions was observed between 1995 and 2015, with their portion reaching 25% of total global greenhouse gas emissions [130,131]. Secondly, the current emission-reduction efforts focus primarily on reducing direct emissions originating from point sources of energy combustion. Even though materials currently represent almost half of the carbon footprint of significant value chains and most heavy industries utilize materials, there is a projection that embodied emissions are projected to rise further if the situation is not addressed [131]. Accordingly, material efficiency should receive more attention in production because it represents a substantial proportion of energy consumption and associated emissions intimately linked to transportation, processing, and material extraction [38,132].
Going by the energy and climate strategy, reducing material consumption through leveraging material efficiencies could help in expanding the scope of coverage of emissions as well as assist in addressing the issue of outsourcing carbon emissions, which is where countries reduce their emissions by importing or shifting production overseas [38,123,131]. In this case, absolute decoupling is required, which could be achieved by aiming at growing the countries or regional economy with a reduced use of natural resources and greenhouse emissions [133]. Haberl et al. [134] systematically evaluated resource uses, GDP, and greenhouse gas emission evidence. This study suggested strict enforcement of absolute reduction targets using appropriate strategies could be a viable way to decouple natural resource uses, GDP, and greenhouse gas emissions from economic growth [135]. United Nations SDGs identified dematerialization as one of the primary sustainable development strategies. This strategy was challenging despite having goals such as reducing environmental adversity and total material consumption to preserve and increase the quality and services rendered to the public. Despite efforts and policies created and implemented at national and regional levels, absolute global dematerialization is yet to be achieved.
Consequently, Aktaş [136] summarized dematerialization, the existing techniques used, and how it affects development by providing information on current difficulties experienced based on past attempts, which gives more precise information that could guide future policies and studies. This study pinpointed more constant factors challenging implemented policies aimed at achieving dematerialization. This factor includes but is not limited to economic recession, the product lifetime, and the effectiveness of decoupling on national and regional levels. Furthermore, matching solutions and studies for future implementation are also provided.
According to Aktaş [136], economic conditions must be considered when developing a policy aimed at dematerialization evaluation if policies are made during the recession to prevent most of the considerable profits in complete material control or reduction, which could be used to meet public services and needs. A service-oriented model is a potential technique for providing lasting solutions to national or cities’ absolute material reduction. Additionally, product evaluation should be performed individually and not in generalizing lifespan, and this method often has better effectiveness on national than regional policies. Considering this solution or suggestions would give headways when developing policies or conducting studies on dematerialization in the future. The strategies aimed at decarbonization require power generation from renewable sources, building energy transmission from renewables-generated power, and encouraging appliance production using low voltage, which may reduce energy usage.
7. Decarbonization Strategies
7.1. Building Transmission Renewable Energy
The most efficient set of a fast-increasing fleet, wind- and solar-generating facilities have fully benefited from natural wind and solar resources. These facilities involve considerable assets in new transmission amenities. Incumbent transmission system workers and controllers must expand the capacity between existing transmission networks, called interconnectors. It is necessary to remove the barriers to escalating transmission capacity across heritage transmission networks so inter-system and inter-regional transmission facilities can be operated efficiently, planned, constructed, and financed [85].
7.2. Developing Grid-Integration Strategies to Match Loads to Variable Renewable Energy
To reduce dependence on fossil fuels, decentralizing the electricity sector is a significant step in spreading renewable energy sources [55]. There are several ways in which variable renewable energy (VRE) differs from conventional generation, and it must be integrated with power systems to achieve the decarbonization target [113]. There is an increasing trend toward integrating renewable energy bases, such as solar and wind power, into different sectors of the economy. In this setting, the coupling between the power and heat sectors is gaining more attention among policymakers and researchers. It is often considered promising to link the power and heat sectors to sector coupling strategies and other flexibility options because the costs of generating heat from electricity and storing heat are relatively low [137]. However, several factors must be considered to integrate the grid. It is vital to equilibrium variable wind and solar resources, as well as to consider how all power system components, at supply and demand sides, could be integrated to guarantee dependability (“keep the lights on”) and reduce costs [100]. Designing electricity markets to facilitate grid integration while ensuring they function most efficiently is also essential.
Additionally, transmission grids should be planned and strengthened to balance the geographical patterns for renewable energy resources and power demand. Finally, there is the issue of enhancing grid integration and flexibility at the distribution level by transforming how distribution systems are planned and operated in terms of grid flexibility, which is the responsibility of a grid to changes in supply and demand from multiple sources. In addition to growing the incorporation of renewable energy into the electric grid, the ambiguity of electricity generation by different sources poses a challenge to grid operations. It negatively impacts grid stability (IEA, 2016b). Nevertheless, technological solutions have been developed to address the technical complications associated with assimilating significant amounts of renewable energy, and grid operational variations are required to increase grid flexibility. Sayed et al. [138] suggested that adopting electric vehicles is a viable way to reduce attacks on power grids, which will protect the future grid. This suggestion has exponentially increased electric vehicles on the road, which correspondingly increased the sale of electric vehicles globally. Its sales were over 3.2 million in 2020 and increased to 6.6 million in 2021. According to the IEA 2022, almost 14 million electric vehicles were sold in 2023.
7.3. Protecting and Expanding Policies That Encourage Renewable Growth
According to economists, carbon pricing is a cost-efficient approach to decarbonizing energy systems [121]. Moreover, some evidence proves that essential research subventions might be part of an ideal policy [139]. Most economists consider sponsoring the deployment of low-carbon technologies to be a costly second-best policy [139,140]. Through systematic change and lifecycle-based efficiency of socio-technical systems, environmental policies and business tactics have steadily moved away from cleaner production, which prevents pollution. According to the discourse analysis of environmental policy [141,142], this section describes the SCP policy domain through a few decades using the phases of SCPs 1.0, 2.0, and 3.0.
Climate change impacts were addressed through the Paris Agreement (PA) implemented in December 2015. This plan aims to keep the global temperature below 2 degrees Celsius above pre-industrial levels this century and to chase efforts to reduce the increase even further to 1.5 degrees Celsius. Achieving the PA’s long-term goal led to arguing that de facto zero emissions of GHGs and decarbonization should be achieved in the 21st century [69]. A multi-decade and even centuries-long process of climate change has occurred due to the increase in greenhouse gas emissions since the Industrial Revolution.
Current emissions will have long-term impacts, mainly if critical thresholds are crossed by the climate system [103]. For a credible policy response to be implemented, costs must be borne now so that future consequences will not be as severe [104]. The short-term nature of this challenge is hindered by political systems oriented toward political cycles and short-term economics [30,31]. In battles over interests, ideas, and identities, shifting arrays of social, economic, and political actors pursue impact policy rejoinders. Policymakers are plagued by uncertainty regarding climate policy [38]. A climate change crisis does not affect the future of the climate system or people but is about the factors driving emissions growth and influencing policy.
7.4. Capitalizing on the Renewable Energy Sector
Providing the lowest-cost options for reducing CO2 emissions is achievable with the incorporation of states and the effective use of market-based carbon-trading programs. A practical and proven method of controlling a program involves auctioning emission allowances to prevent dividend profits among fossil fuel-based electricity generators and permitting states to generate revenues for residents’ benefit [143]. Several studies have indicated that institutional investors’ main motivations for investing in renewable energy are stable long-term cash flows and portfolio diversification, with low sustainability and ethical standards among their priorities [144,145]. Financing costs must be lowered due to the up-front nature of the investments compared to conservative energy sources to expand the use of renewable energy.
New-generation investment activities can be encouraged through access to public capital markets, and secondary markets can be developed [146]. Securities investment funds specializing in energy investments will emerge as capital markets develop. Some governments have established research and development subsidies to improve corporate financial performance. Various studies have shown that subsidizing renewable energy has reduced profitability for Chinese companies, causing their stocks to be more volatile [147,148,149].
7.5. The Relationship between Decarbonizing the Electricity Grid and the Transportation Sector
According to Europe 2020′s communication [141], the European Union in 1990 aimed to reduce CO2 emissions, increase renewable energy, and improve energy efficiency by 20% by 2020. As outlined in the 2011 Transport White Paper [142], GHG emissions from the transportation sector are expected to be reduced by 20% by 2030 (reference year: 2008) and 60% by 2050 (reference year: 1990). The EC has outlined two targets for 2030 in its 2014 climate-energy package communication: a 40% greenhouse gas emissions reduction over 1990 and a 27% portion of renewable energy in European Union energy consumption by 2030. The most significant contribution to the transport sector’s 10% renewable energy share is expected from liquid biofuels in road transport.
One of the most prevalent propulsion systems in the EU’s transportation sector is the steps to decarbonize the transport sector’s combustion engines. According to Gerbaulet et al. [149], investment decisions significantly impact the decarbonization of the power sector. However, the results indicate that petroleum-based fuels will be economically infeasible around 2025, and the 2040s will phase out coal and natural gas. Most studies [150,151,152] focus on decarbonizing the power sector and analyzing the economic scenarios. Based on sector-wise emission data, the power sector is the most significant contributor to emissions in the EU alone (electricity and heat energy). Still, industry, transport, residential, and agriculture collectively contribute more than the energy sector alone (2.2 times the carbon equivalent of the power sector in 2016). Electricity plays a crucial part in decarbonizing the road transport sector, according to Broghan et al. Electricity will account for 37% of road transport fuel, power-to-x fuels will account for 27%, and additional electricity will account for 1200 TWh by 2050 [140].
8. Biobased Fuel for Marine, Aviation, and Long-Distance Freight to Achieve Low-Carbon Emission
The competition in the energy sector for the use of biomass resources may favor their application, including but not limited to road freight, aviation, maritime, power, and industrial applications. Even though these factors are considered, advanced, low-carbon biofuels may be essential for the next few decades as a bridge between fossil-powered structures for road freight and the upcoming infrastructures required for ultra-low and zero-emission energy movers like hydrogen and electricity. There are well-established alleyways for decarbonizing power generation [2], light-duty transportation [3], and domestic heating/cooling [4]. However, reducing emissions from heavy agriculture, industrial machinery, and heavy transport (aviation, railways, buses, trucks, and maritime shipping) is more complicated. GHG emissions from transport (including aviation) in the EU account for 27% of all emissions and are higher than in 1990 [131].
Despite car emissions contributing 43.9% of total emissions, heavy-duty transport is responsible for 46.2% [132]. Substitute fuels and powertrains are needed to accomplish the profound decarbonization of heavy-duty transport. The transportation industry [135], the shipping industry [135], and the aviation industry [136] are all dependent on fossil fuels. Fuel alternatives to combustion engines can be divided into two broad groupings: those that rely on prevailing combustion engine technology and infrastructure and equipment that use fuel cells or batteries to power electric motors. A biofuel [137] can be a liquid or gaseous electrofuel [138]; hydrogen or electricity can also be used as these fuels.
8.1. Interconnection of Building Energy Efficiency and Electric Vehicles
Due to decreased fossil fuel availability and environmental concerns, wind and solar energy are extensively employed to produce electric energy [126,127]. In addition, some literature has provided information on EV charging stations that explored wind energy to provide electric power to charge EVs. However, these works have been simulation-based [25,26]. The latest IPCC climate change report shows that the transport sector produces 13% of global GHG emissions. Incorporating electric vehicles (EVs) and renewable energies and improving energy conversion efficiencies have reportedly improved energy security [133]. These could be accomplished through good planning and the harmonious construction of EVCS with urban planning or power grid planning, especially with the inclusion of renewable energy [131]. Based on operating cost, construction cost, and geographic information, an objective function was developed that reflected the challenge of comprehensively locating and sizing electric vehicle charging stations [132].
Sadeghi et al. developed a Mixed-Integer Non-Linear (MINLP) model to determine the optimum placement and size of fast charging stations, including station development costs, EV efficiency losses, and power line losses [132]. Commercial buildings and road transportation sectors have been paying increasing attention to intelligent buildings and electric vehicles (EVs) due to concerns about energy efficiency, fossil fuel dependency, and environmental impact. The definition of an intelligent building is a structure that utilizes automated approaches to automate the operation of the building. This includes lighting, heating, air conditioning, ventilation, security, and other systems. EV charging stations could be designed to integrate renewable energy resources with vehicle-to-grid (V2G) resources while optimizing EV charging schedules to alleviate excessive power grid loads.
8.2. Carbon Emissions, Energy Use, and Economic Activity
Several studies have looked at the relationship between economic growth (EG), energy consumption, and CO2 emissions at a population level, resulting in mixed empirical conclusions [153,154,155,156,157,158,159,160,161,162,163,164,165,166,167,168,169]. Seeing the growing effects of climate change, numerous researchers have examined the empirical relationships between CO2 emissions, energy consumption, and EG [96,97,98,99]. The relationship between CE, energy consumption, and EG at the aggregated level has been characterized as complex by some researchers. This complexity is due to the different causal effects of different energy sources.
Wolde-Rufael and Menyah, Ziramba, and Nain et al. [158,159,160] investigated the relationship between CEs, energy consumption, and EG at the accumulated and sectoral levels. They concluded that increased CO2 emissions resulted in higher electricity consumption. Energy consumption maintained a consistent long-run connection with CO2, according to Ang [161], which validated the environmental Kuznets curve (EKC) hypothesis.
Additionally, Ang [162] noted similar results for Malaysia, Shahbaz et al. [163] found similar results for Pakistan, and Kanjilal [164] reported similar results for India. In contrast, Ghosh [166] found no long-term link between India’s energy consumption and CO2 emissions. Due to this, the EKC hypothesis for that country could not be authenticated. A study that examined the Commonwealth of Independent States concluded that fossil fuel usage and EG are both associated with CO2 emissions in the rapid route but are eventually linked in the long term. Concerning West African countries, Olarinde and Martins [167] used a Fixed Effects Panel Regression Model to examine the linkage of carbon dioxide emissions with EG systematically. They concluded that, in the long run, the connection between income and carbon dioxide emissions is N-shaped, and the EKC hypothesis is not valid. Shuaibu and Oyinlola [168] established that the relationship between carbon dioxide emissions and EG is not causal due to structural shifts in Nigeria by relying upon the Zivot and Andrews unit root test and the Gregory and Hansen cointegration tests.
Analyzing the relationship between CO2 emissions and EG can take a linear form of U-shaped, inverted U-shaped, or another form of Warner [169]. However, a few studies established the EKC hypothesis with a reversed U-shaped relationship [170,171,172,173], suggesting that economic growth can improve the environment through reduced emissions. Holtz-Eakin and Selden [174] state that the rising curve is monotonic. Contrarily, others report a non-monotonic relationship [175,176]. Furthermore, Shafik [177] determined an N-shaped curve between CO2 emission and GDP per capita. At the same time, Ozturk and Acaravci [178] conclude that there is no causal relationship between these two factors.
According to Ang [162], there is an inverted U-shaped relationship between CO2 emissions and output in France, which indicates that EKC is feasible. In his study, he observed that output was positively correlated with CO2 emissions and energy consumption in the long run. Energy consumption and economic growth were negatively correlated in the short run. Therefore, Soytas et al. [179] concluded that income has an insignificant effect on CO2 emissions in the long run, whereas energy consumption does. ased on Autoregressive Distributed Lag (ARDL) bound testing approaches, Acaravci and Ozturk [178] found that Germany, Portugal, Denmark, Iceland, Greece, Switzerland, and Italy cointegrate relationships between CO2 emissions, energy consumption, and real income. Only Denmark and Italy were found to have satisfied the EKC. Ang, Zhang, and Cheng [158,164,180] found that GDP is causally connected to energy consumption in Malaysia and China.
Ghosh’s [165] study showed a bidirectional causal relationship between CE and EG in India in the short term and a unidirectional causal connection between EG and energy supply. Menyah and Rafael’s [158] study on South Africa found unidirectional causality between energy consumption, pollutant emissions, EG, CO2 emissions, and energy consumption. In addition, Lotfalipour et al. [181] found a unidirectional causality between energy consumption and carbon dioxide emissions in Iran. Saboori et al. [182] analyzed the causal relationship between CO2, energy consumption, and economic growth in OECD countries. The results indicated that CO2 is a bidirectional indicator of economic growth. In some studies, EG and CO2 emissions are linear [183,184,185].
Moreover, many other studies [158,168] discovered that the relationship between CO2 emissions and the economy’s growth does not exhibit a U-shaped pattern; the relationship, instead, resembles an N-shape. As an additional point of interest, Al-mulali et al. [186,187] examined the long-run bi-directional relationship between energy consumption, CO2 emissions, and economic growth in the Caribbean and Latin American countries. Onafowora et al. [188] examined the long-term and temporal dynamics of EG, population density, energy consumption, CO2 emissions, and trade openness in Mexico, Brazil, China, South Korea, Egypt, Nigeria, Japan, and South Africa. Using data from Malaysia, Lau et al. [189] examined the cointegration relationship between CO2, exports, EG, and institutional quality and found a positive correlation between institutional quality and CO2. Many other studies on decoupling energy consumption are presented in Table 1.

Table 1.
Synopsis of current research for decoupling of energy consumption.
9. Pathways to a Low-Carbon Energy Sector
To decrease global average temperatures to ≤2 °C in the century ahead, we must limit cumulative global emissions to 600 to 1100 gigatons of carbon dioxide per year [197]. Comparatively, GHG emissions are approximately 50 GtCO2 annually, of which approximately two-thirds are produced from burning fossil fuels [198]. As of 2013, fossil fuel reserves have approximately 3000 GtCO2 of carbon contents [199]. According to a study conducted in 2014, low-carbon power grid revolutions may prove expensive, challenging, and cost-effective. However, extenuation measures like decentralized modern energy access expansion, fuel switching, and fossil fuel subsidy reform are feasible and affordable [200].
The near future is expected to see these countries significantly contribute to climate change and be significantly affected [201,202]. However, fossil fuels as an energy source may not be necessary for economic growth [203]. In this context, some research investigating low-carbon energy transitions remains largely hypothetical [204]. Ideally, as we move to low-carbon energy supply and service provision, radical changes in technology, user practices, business strategies, institutions, and user practices are needed; therefore, this will pose challenges to the governance when engaging different actors as well as dealing with the temptations and obstructions they face [205,206,207].
Numerous energy–economy models have been developed and explored for different emissions path simulations. Several of these models were examined in the Intergovernmental Panel on Climate Change’s 5th assessment report [207]. Furthermore, several model comparison exercises run under standardized assumptions and with corresponding climate outcomes [207,208]. In presenting transition pathways, Foxon et al. [209] describe a multi-level method for analyzing socio-technical systems transitions like coevolutionary frameworks and energy systems for analyzing low-carbon transitions [210,211,212,213]. Many countries and organizations have already begun accelerating the shift to a low-carbon economy. For example, Nordic nations plan to be fossil-free by 2050 [214].
They promote energy transition as part of the European Union’s (E.U.’s) European Regional Development Fund (ERDF) program for Baden-Württemberg 2014–2020. As a result, the energy transition has been extended beyond borders [81]. In facilitating the global energy transition, the International Energy Agency (IEA) developed the Clean Energy Transitions Programme (CETP) [214]. The study by Foxon [209] compared factors contributing to the Chinese and German energy transition (an innovator of the energy transition). It has been asserted by La Viña et al. [213] that energy transition can address the trilemma of energy sustainability, equity, and security in the Philippines. In its annual 2018 [214] report, IEA, stated that energy transition could improve energy security, a robust energy system, and a thriving economy [215]. Their research investigated how culture impedes the transition to a low-carbon economy.
According to Wang, and Li [192], there is a link between energy transition and changes in political systems. Additionally, they explained that technology was essential in achieving energy transition. A study by Bayulgen [216] examined the political and economic drivers of the United States’ energy transition. It was confirmed that economic growth and carbon emissions were directly related to the energy transition. Li and Wang [196] examing emissions of 30 China provinces’ transport sector and confirmed that carbon emissions increase with a corresponding growth in urbanization. Their study suggested creating more effective policies to curb carbon emissions in this sector, which should be monitored rigorously. Nevertheless, few studies have investigated pathways’ contribution to the low-carbon energy sector. Therefore, the global focus should scrutinize the sectors generating high emissions to understand their impact and provide information that could help develop curbing policies.
9.1. Reducing the Carbon Intensity of Energy
Energy emissions decrease significantly faster than other sectors [167,217]. Currently, clean and renewable energy is receiving a lot of consideration. It is considered one of the most effective ways to decrease CE and reach a low-carbon development [218,219]. Le Qu et al. [220] recently asserted that substituting renewable energy for fossil fuel consumption would reduce carbon emissions. Several studies [221,222] have deliberated on openings and challenges associated with the transition toward a greener future. In their study, shifting from fossil fuel-based to renewable-based industries was encouraged. The Intergovernmental Panel on Climate Change (IPCC) confirmed the availability of 2.5% renewable potential by 2050, which can supply 80% of global energy consumption. It is important to note that the fuel choice determines the carbon intensity. Exacting the balance between types of fossil fuels and renewable energies, including nuclear power, is needed. Fossil fuels generate approximately 80 percent of global energy. Several studies suggested that energy generation from biofuel from biomass and agricultural wastes may be a viable way of reducing CE and reliance on fossil fuel-based energy [223,224].
About 30 percent of global energy consumption comes from oil and coal, while just over 20 percent comes from natural gas [225,226]. Most of the remaining energy is produced using biomass and nuclear power. Renewable energy sources like solar P.V., thermal, and wind are widely increasing but coming from a small base, according to IEA 2013. Based on Calvin et al.‘s [207] findings, solid fuels in residential energy use decrease dramatically as urbanization increases. Organizations, economists, and policymakers have recently focused on the energy transition, attempting to accelerate the swing from a carbon-intensive to a low-carbon or zero-carbon energy system [227,228].
Generally, the energy transition has many advantages, including improving international relations, promoting economic development, alleviating global warming, etc. [227]. With the decreasing emission levels in the power sector, low-carbon fuels like gas can be substituted for high-carbon fuels, including coal, and carbon-free energy sources can be employed. The implications of this are most evident in coal. The development of coal-fired power is a reliable structure of all energy decarbonization circumstances [229,230]. Globally, people have concluded that we should reduce carbon emissions to combat global warming [231,232]. The world economy increased at an average annual rate of 2.14% in the last six decades. This growth makes it impossible to lower economic advances to reduce carbon emissions. Several decoupling theories have been developed to deal with the economic growth paradox and environmental degradation [233]. It is easy to use and provides real-time information about CE and EG’s relationship [234].
9.2. Energy Intensity of GDP Reduction
The amount of energy consumed per unit of GPD, known as energy intensity, is used to measure the energy efficiency of a country [235]. Reducing energy intensity can be a viable method for decreasing energy consumption and CE globally. Due to an enhancement in energy use machinery in substantial economies (the United States and China), global energy intensity has experienced a gradual decrease from 7.3 MJ/USD (constant purchasing power parity (PPP) in 1995 to 5.0 MJ/USD (constant 2011 PPP) in 2017, which represents a 1.4% fall on average annually. The decrease in energy intensity has, however, slowed down in recent years. The International Energy Agency confirmed that the global energy intensity decreased by 1.2% in 2018—roughly half the average level since 2010 [236].
At the same time, renewable energy has been growing around the world. Within the global energy consumption structure, the quantity of modern renewables has risen between 7.1 and 10.5% from 1995 to 2017, representing a 0.23% increase rate in the past ten years. The Chinese government targeted to reduce emissions intensity by 40 to 45% between the years 2005 and 2020 [237], which resulted in industrial modernization in the 1990s. China has recorded rapid increases in energy efficiency since the 1990s, resulting in approximately a 6% decrease in energy intensity annually [237]. Although progress in the early 2000s was very modest, from 2005 to 2013, the reduction rate was robust, averaging 3.8 percent yearly. According to the International Energy Agency [238], China’s energy intensity is around 50% greater than the USA’s when measured at purchasing power parity.
Some countries have witnessed a vast increase in renewable energy, including New Zealand, Greece, and others. However, an increase in energy intensity rather than a decrease was observed. Greece and New Zealand increased their share of modern renewable energy by 5.0% and 1.9%, while an increase in energy intensity of 2.8% and 9.1% were obtained. It is fundamental to understand that the energy intensity of an economy, and its projection over time, is determined primarily by the economy’s structure and the efficiency of its technologies. In both cases, progress can be achieved through development, but in the latter case, targeted interventions can help speed things up [239,240]. An ongoing debate concerns how noticed energy efficiency levels lag the potential, i.e., there may be a gap in energy efficiency.
Economic studies tend to be skeptical [241], whereas engineering studies frequently identify significant energy savings. Studies undertaken in South Africa have demonstrated the potential to save significant amounts of energy in diverse industrial sectors such as wood, steel, mining, iron products, and chemicals [242,243]. By 2050, the International Institute for Energy Analysis estimates a heating and cooling energy demand decrease of about 46% [244]. Most residential energy efficiency measures are related to the energy consumption of middle- and high-income households, such as more energy-saving lighting bulbs and appliances [245]. Low-income households can save energy due to the thermal efficiency of their homes [246,247]. These measures are usually intended to alleviate poverty rather than save energy.
As a result of efficiency improvements, most households increase their coziness level rather than reduce their energy bills. It is, therefore, evident that lower prices result in a rebound effect, leading to higher consumption [248]. The Chinese government has taken steady steps toward energy intensity reduction since the 1980s, primarily responding to severe energy deficiencies. China has lately emphasized reducing energy intensity as a central element in mitigating climate change [148,249,250]. Various countries and periods can have different energy intensities of GDP [251,252]. Many studies have examined the variances in energy intensity between countries and the evolution of those variances over time. Many studies, such as [253,254], examine a shift in the energy intensity between the Organization for Economic Cooperation and Development (OECD) countries. The deviations from the mean were analyzed by [255]. Alcántara and Duro [253] utilized the Theil index based on GDP and observed the share each country contributes to global production.
10. The Influence of Energy Decarbonization on Economic Growth
Among the biggest challenges facing economies are decarbonization (eradicating carbon dioxide emissions caused by their harmful effects on the environment) and enhancing energy transmission efficiency (using energy efficiency means achieving the same effects under the same circumstances while using a smaller amount of energy). Macroeconomic stabilization is necessary to achieve decarbonization (DCO2) and energy efficiency (EN) [256,257].
Stabilizing macroeconomic conditions is an essential objective of state intervention in the economy. Combining economic indicators, political conditions, and the country’s position on international markets’ effectiveness determines macroeconomic stability [258,259]. A balanced economy impacts citizens’ quality of life and contributes to environmental awareness and education [260,261]. Most research emphasizes that economic growth, globalization, and urbanization are associated with increased carbon dioxide emissions [262,263]. As of now, it is unclear what impact macroeconomic stabilization will have on decarbonization. Decarbonization aims to reduce carbon dioxide emissions to the atmosphere, which is vital to halting global warming [264,265].
Decarbonization can occur in several ways, such as through energy efficiency, delayed carbon capture, diversified energy sources and storage, and low nuclear power. The most significant challenge is applying an economic growth model considering social and environmental goals [266,267]. For the Korean economy to decarbonize effectively, several drivers should be addressed, not just the expansion of low-carbon technologies. Korea’s energy needs solely rely on fossil fuels in the predictable future. Concentrating large shares of GDP on a limited energy-intensive industry is not only environmentally damaging [268], but it can also increase the economy’s vulnerability, which implies supporting a low-carbon economy by strengthening the service sector [269,270].
According to the “Deep Decarbonization Pathways Project”, the process of low-carbon transformation requires three central pillars [263]. Firstly, there needs to be a low-carbon transition to electricity supply; secondly, there needs to be the electrification of energy-consuming activities that currently burn fossil fuels directly, such as transport, heating, and industrial processes; and thirdly, there needs to be increased energy efficiency, a significant factor in decarbonization’s cost-effectiveness.
Additionally, deep decarbonization can also lead to economic growth in developed economies. Efficient and rapid DCO2 is vital for environmental strategy in many economically developed countries, helping them focus on EN on an enormous scale and switching to zero-emission energy production [264,265,266,267]. A low-carbon or zero-carbon electricity supply is likely to primarily depend on renewable energy sources in most nations—mainly hydro, wind, and solar power—although nuclear energy may also be significant, and storage for coal, carbon capture, and gas-fired power plants might be necessary as well [268]. Also, developed countries must consider and adopt deep decarbonization as a prerequisite for long-term economic growth [257,269,270]. In growing and developing countries, whose industries depend on coal power, the situation may differ (sustaining macroeconomic stability may intensify carbon dioxide emissions). Therefore, it is essential to invest in new green technologies and eco-friendly solutions (thereby generating additional costs) [271].
The concept of deep decarbonization entails reducing energy-related CO2 emissions. Biomass is fundamental to developing a solid decarbonizing energy system in the future. As a result, a biomass pathway in Sichuan has been anticipated to appraise the effects of bioenergy. However, how to apply the biogenic carbon neutrality principle throughout its lifetime has raised some controversial questions among academics [272,273] and poses a challenge to implementing CO2 emissions. Social and environmental objectives must be considered more broadly for economic growth (or macroeconomic stabilization). Stabilizing the macroeconomic environment should lessen CE to the atmosphere over the long term. Stabilizing macroeconomic conditions can improve research, development, and environmental awareness [163,274,275]. Decarbonization requires additional expenditures, energy balance shifts, and environmentally friendly technologies [276,277]. In contrast, decarbonization is likely to progress the country’s trade balance (due to a decrease in fossil fuel imports). There are numerous benefits to a low-carbon economy, such as increased investments, increased quality of life, and decreased environmental degradation [278,279].
11. Low-Carbon Energy Systems
Several studies focus on low-energy systems due to the increase in carbon emissions. Researchers suggested using renewable energy to replace fossil fuels for a low-energy system with several benefits [156,157,280,281,282,283,284]. Clean and renewable energy is considered one of the most effective ways to decrease CE and reach low-carbon development [156,157]. Stringent policies toward carbon emissions have also been proposed [155,156]. Implementing these policies promises to increase the quality of life and reduce environmental pollution.
11.1. New Developments
Implementing technologies through marketing alone may not result in building a low-carbon innovation system. Therefore, effective innovation systems include strategic policy interventions, a commitment to ban fossil fuels, and the active contribution of people experiencing poverty [234,285,286,287,288]. Undoubtedly, the world is responsible for transitioning to a reduced amount of carbon-intensive and more just energy system. Given the critical role of energy in enhancing human capabilities and opportunities, a range of safe, clean, affordable, and reliable energy services must be made available (lighting, heating, cooling, etc.). A low-carbon energy transition requires various reception, mobilization, and authorization processes.
Lacey-Barnacle [240] examined the role of intermediate organizations in the civic energy sector and showed in what way they serve as a conduit between local low-carbon energy initiatives and deprived societies, assist community groups in being aware of funding opportunities, and, where possible, promote a local emphasis on the low-carbon transitions economic benefits. Preliminary with the first point, the energy transition has enhanced energy flows closely related to “production” and “consumption,” actions coordinated via the energy market. Moreover, technological advances have been made to extract, transform, and utilize energy. Additionally, changes have occurred regarding rules modifiable the socio-political role of energy systems, for example, revolutionizing a country, enhancing freedom, or decreasing poverty [289].
In 2008, the European Commission launched the Citizens’ Energy Forum. An exploration of the consumer standpoint in the new era of the merchandizing energy market was intended. The citizens’ forum, which took place in 2018 at the European Commission [290], was devoted to presenting innovative solutions for consumer engagement and business models interrelated to the retail energy market. A growing number of renewable energy projects are being proposed around the globe, which has contributed to public skepticism regarding this development’s siting decisions, often resulting in intense public debates and conflicts. Bartiaux et al. [288] analyzed household energy consumption patterns in Belgium to demonstrate the consequences of the lack of capability to envision alternative shifts to low-carbon energy systems.
In recent work, Willand and Horne [289] analyzed one example of a retrofit intervention to uncover recognized and veiled susceptibilities and the experienced distribution and technical energy impartiality in the existing experience of older and delicate householders in a low-income area near Melbourne, Australia. In their study, Castan Broto et al. [290] developed a fuller understanding of the British and Dutch public debates on intelligent grid structures by exploring the values and concepts underpinning these debates. It is expected that advancing energy effectiveness and reductions in energy use will be responsible for greater than half of the reductions in the world’s CO2 emissions over future decades. For example, to slow global temperature increases to below 2 °C at a reasonable probability (66%) within the next 35 years, an over 70% fall in global energy-related carbon emissions must be ensured by 2020. For example, this would require a yearly tripling of energy efficiency improvements, retrofitting all existing buildings, ensuring 95% of electricity is generated from low-carbon sources by 2050, and moving almost entirely to electric vehicles [291].
As of 2011, carbon dioxide concentrations in the atmosphere have increased from 280 shares per million (ppm) before the Industrial Revolution to 391 parts per million (ppm). As of 2014, the concentration was above 400 parts per million. It is, therefore, a matter of global concern that carbon emissions are continuously rising [193]. China has adopted revolutionary measures to encourage energy production and consumption. These include imposing an annual limit on encouraging energy conservation, total energy consumption, renewable energy sources, and supporting the development of new energy sources. Furthermore, the Chinese government has declared its intention to realize the peak of CO2 emissions by 2030, aiming to reach the peak early by trying to strengthen the share of non-fossil energy in primary energy consumption to about 20% by 2030, as indicated in the China-U.S. speech on climate change published in 2014 [292].
As outlined in China’s intended nationally determined contributions (INDCs) in 2015 [293], China’s new commitment to reduce emissions intensity by 60% to 65% per year from 2005 to 2030 was recently released. In fulfilling the U.N.’s Sustainable Development Goals, SDG7 highlights the importance of inexpensive and green energy. A sustainable energy transition calls for launching a new era of the energy model, requiring an updated energy blend and revision of the regulatory framework [294]. Industrialized nations rely heavily on oil and gas for most of their energy needs, making adopting local renewable or low-carbon energy models challenging. Tilos, with over 50% renewable energy consumption, located southeast of the Aegean Sea, Greece, demonstrates how local-scale energy storage can be seamlessly integrated into a fully operational M.G. Kos Island presently supplied oil-based generated electricity through an undersea cable to Tilos Island.
Developing clean and low-carbon energy has succeeded and is expected to progress rapidly. China put several policy frameworks and institutional mechanisms in place to motivate the production of natural gas and non-fossil fuels. It is estimated that China consumed 180 billion m3 of natural gas in 2014, increasing from 34.1 billion m3 in 2004, making China the third-largest consumer of natural gas globally. Moreover, non-fossil energy consumption has increased from 4.0% in 1980 to 11.2% in 2014 [295]. According to the China Electricity Council [296], in 2014, there were 301.8, 19.9, 95.7, and 26.5 GW of installed capacity for hydropower, nuclear power, and wind power, respectively, which is 1.4, 1.8, 3.2, and 102.0 times higher than the amount in 2010 [297]. Nathaniel et al. [196] claimed that more importance had been added to energy security by prioritizing generating energy from low-carbon sources such as renewables and nuclear energy. The G7 currently harnesses these techniques for generating power. However, with a slight improvement in the environmental quality in most of these countries, the positive effect of the process is not yet attained.
Similarly, Sweden’s government aims to generate 100% electricity from renewable sources by 2040. However, they currently generate 41% of their annual electricity from nuclear power for low-carbon power generation and transition, but with decommissioning aniticipated in future decades due to economic and aging factors. High investment, radiation risk, and social acceptability depict uncertainty in generating electricity through nuclear sources in European countries [100,101,102,103,104]. Nathaniel et al.‘s study suggested renewably sourced electricity production as an alternative route and advised additional investments into the transmission, which may benefit Sweden and other European countries’ economies through increased profit from the power tariff [196].
11.2. Challenges and Constraints
To achieve sustainable low-carbon energy systems and increase access to affordable and equitable innovations, a subtle understanding of concerns regarding social justice is necessary. A different approach is needed to produce affordable and clean energy access for everyone around the globe. Similarly, climate change must be addressed by reducing fossil fuel usage. As articulated within Sustainable Development Goals 1, 7, and 13, both challenges require social justice deliberation regarding access to resources and technologies. Generally, energy systems both generate and consume energy. These components are extracting resources, producing them, converting them, distributing, delivering, using energy, and providing energy services [298]. Political institutions and processes face unprecedented challenges in low-carbon futures, particularly in the energy sector.
Furthermore, developing new and pioneering governance approaches is necessary [299]. Renewable energy sources face several challenges: low resource availability, limited resource access, limited resource location, insecurity of supply, sustainability, and affordability [300]. As a result of the increasing electricity demand, the consumption of fossil fuels has increased, thereby contributing to the growth of greenhouse gas emissions and, consequently, global warming [291].
A further barrier to effective transition is that efforts to promote more sustainable, resilient, and equitable energy disrupt economic, political, and institutional relationships. As a result, power and political issues are now at the heart of sustainable innovation in the energy sector [301]. Energy access and controlling greenhouse gas emissions are crucial to achieving a sustainable energy future [302]. Since over two-thirds of greenhouse gas emissions are attributed to energy production and consumption and over eighty percent of CO2 emissions are from power plants, countries that wish to meet the Paris climate objectives must develop measures and strategies to reduce emissions from power plants and other energy-based activities. Developing countries should address their challenges individually and collectively by implementing suitable and effective energy policy measures [303].
A significant obstacle to the development of low-carbon energy is inefficient energy use. According to the World Bank [304], in 2013, China had an estimated 8.7% share of global GDP but consumed 22.6% of the world’s total energy [305], with energy consumption per GDP being more than four times that of developed countries and more than two times that of the world average. Despite the waste of energy resources and ensuing increased emissions, the inefficiency of the energy system has also contributed to extensive development of the energy system, hindering innovation regarding a low-carbon energy system and renovation of an existing system [306]. The lack of institutional mechanisms and market reforms is one of the main obstacles to low-carbon energy development.
Energy markets are characterized by cured profit distribution patterns that can result in administrative monopolies, market monopolies, and disorderly competition, which act to hamper improvements in technological and environmental standards [307]. Considering the government’s continued dominance of energy pricing, an improvement is necessary for the existing energy-pricing mechanism. This is because market prices become distorted, hampering the development of low-carbon energy technologies such as wind, solar, small hydro, and distributed generation [308]. As a result of abandoning wind, solar, hydro, and nuclear energy in recent years, coal power has maintained a high level of operation. Transforming a coal-based high-carbon energy structure is a considerable challenge in developing a low-carbon energy system. Energy demands are rigid, and extensive development pathways increase reliance on high-carbon resources [308].
12. Future Projections/Aspects
Based on these findings, decoupling techniques have limitations. Most studies are centered around Tapio and IDA (index decomposition techniques). Developing countries develop faster. Therefore, reducing emissions in those countries is more complicated. The E.U.’s energy policy has noted this obstacle that permits countries with a low per capita GDP to increase GHG emissions. Global and climate change are humanity’s most significant sustainability challenges, with oil, coal, and natural gas accounting for 61.3% of global electricity generation in 2020. Sustainable energy reduces fossil fuel dependence while growing renewable energy sources to reduce GHG emissions.
The application of evolution procedures and strategies to decouple economic growth should be guided by more research into technologies and measures details. Considering these findings, this review recommends that impending studies generate more data on the industrial structure to examine the factors affecting CE in a broader context. Hence, the studies discussed in this paper confirm that climate economics and policy implications are fundamental for decoupling EG from CE. Further demonstrates that a transition to low-carbon energy systems is still becoming a norm, as developing countries are still far behind in attaining the target. The strategies toward decarbonization require power generation from renewable sources, encouraging the use of electric cars, and appliance production using low voltages, which may reduce energy usage. Adopting these strategies worldwide may help in achieving a low-carbon planet. Therefore, more studies and implementation of policies aiming at a low-carbon planet must be prioritized globally.
13. Conclusions
This study reviews recent literature that focuses on decoupling economic growth from carbon emissions, the root cause of climate change, which has become a monster, taking life and destroying properties globally. It reviews decoupling techniques and factors limiting decoupling activities, climate economics, policy implications, dematerialization, and decarbonization, which are vital instruments in achieving carbon emission reductions. Studies have confirmed that economic growth is the principal mover of climate change. This study provides information on current challenges, what to consider for future dematerialization policy development, and the techniques available to tackle these challenges. It also discussed several decoupling techniques, such as carbon capture using Tapio’s model scientific evaluation mechanisms to analyze the effect of delinking economic growth and gas emission. It discovered the consequences of climate change and economic growth and suggested the disconnection of carbon generated from energy generation, material production processes (dematerialization), logistics, and industrialization. This implies that completely decoupling economic growth from carbon emissions is a viable way to reduce extreme temperatures resulting in global warming. This reduction can be achieved through a global focus on scrutinizing high-emission-generating sectors to understand their impact and provide information for developing carbon emission-curbing policies.
Similarly, decarbonate and dematerialization policies and other created policies should be implemented while considering economic conditions, product lifespan features, and which policies will work at national and regional levels. More studies on policy development should be conducted and implemented to achieve absolute material reduction. The economic situation should be considered before creating a decoupling policy, and generating electricity from renewable sources should be encouraged. Furthermore, studying the product lifespan and analyzing national and regional challenges using UN SDG goals before developing policies may lead to the absolute decoupling of the world’s aim to achieve a low-carbon system. The decoupling of power from economic growth needs more investment to enhance electricity generation from renewable sources, as generating power from nuclear is expensive. The rigorous change in recent research to evaluate the challenges and constraints of low-carbon energy systems should be encouraged, as this will provide innovative strategies (new developments) and suggestive plans for reducing the carbon emission rate. This review suggests global policies aiming at energy intensity reduction, macroeconomic stabilization, replacing fossil fuel plant systems with renewable energy-based plants, and electric car usage should be implemented to create a carbon-free environment.
Furthermore, global society sensitization to climate change and its implications is necessary and must be encouraged to achieve a zero-carbon planet. A subtle understanding of social justice is necessary to achieve sustainable low-carbon energy systems and increase access to affordable and equitable innovations. Therefore, it must be enforced. Additional implementation and monitoring of climate economics and policy implications must be encouraged and taken seriously to reduce climate change and its impact.
Author Contributions
All authors contributed to the review article. J.M. and O.J.G. wrote the literature study and the article’s first draft, and all authors reviewed, revised, and made relevant contributions and suggestions for the submitted manuscript. All authors have read and agreed to the published version of the manuscript.
Funding
This research received no external funding.
Institutional Review Board Statement
Not applicable.
Informed Consent Statement
All the authors give consent for the publication of this manuscript.
Data Availability Statement
Not applicable.
Acknowledgments
The authors would like to acknowledge the support from the Durban University of Technology, where this study was conducted.
Conflicts of Interest
The authors declare that they have no known competing financial interests or personal relationships that could have influenced the work reported in this paper.
Nomenclature
| GHG | Greenhouse gas emissions. |
| GDP | Gross domestic product. |
| CE | Carbon emission. |
| OECD | Organization for Economic Cooperation and Development. |
| DEG | Decouple economic growth. |
| UNEP | United Nations Environment Programme. |
| EG | Economic growth. |
| UNFCCC | United Nations Framework Convention on Climate Change. |
| CDE | Carbon dioxide emissions. |
| EKC | Environmental Kuznets curve. |
| DOLS | Dynamic ordinary least squares. |
| FMOLS | Fully modified ordinary least squares. |
| MINLP | Mixed-Integer Non-Linear model. |
| AMG | Augmented mean group. |
| LMDI | Log Mean Divisia Index. |
| IDA | Index decomposition. |
| INDCs | Nationally determined contributions. |
| EU | European Union. |
| IPCC | Intergovernmental Panel on Climate Change. |
| CMIP6 | Model Intercomparison Project Phase 6. |
| SSPs | Shared Socio-Economic Pathways. |
| RE | Renewable energy. |
| USA | United States of America. |
| IWG | Interagency Working Group. |
| IAMs | Integrated assessment models. |
| DICE | Dynamic integrated climate–economy model. |
| PAGE | Policy analysis of the greenhouse effect model. |
| FUND | Framework for Uncertainty, Negotiation, and Distribution Model. |
| SDRs | Special Drawing Rights. |
| DDPs | Deep Decarbonization Pathways. |
| IRP | International Resource Panel. |
| SDGs | Sustainable Development Goals. |
| VRE | Variable renewable energy. |
| PA | Paris Agreement. |
| EVs | Electric vehicles. |
| EVCS | Electric vehicle charging station. |
| V2G | Vehicle-to-grid. |
| ERDF | European Regional Development Fund. |
| IEA | International Energy Agency. |
| CETP | Clean Energy Transitions Programme. |
| PV | Photovoltaics. |
| PPP | Purchasing power parity. |
| EN | Energy efficiency. |
| DCO2 | Decarbonization of Carbon Monoxide. |
| INDCs | Intended nationally determined contributions. |
| IDA | Index decomposition techniques. |
References
- Majeed, M.T.; Mumtaz, S. Happiness and environmental degradation: A global analysis. Pak. J. Commer. Soc. Sci. 2017, 11, 753–772. [Google Scholar]
- Leal, P.A.; Marques, A.C.; Fuinhas, J.A. Decoupling economic growth from GHG emissions: Decomposition analysis by sectoral factors for Australia. Econ. Anal. Policy 2018, 62, 12–26. [Google Scholar] [CrossRef]
- USAID. Greenhouse Gas Emissions in Pakistan; USAID: Islamabad, Pakistan, 2016.
- Shuai, C.; Chen, X.; Wu, Y.; Zhang, Y.; Tan, Y. A three-step strategy for decoupling economic growth from carbon emission: Empirical evidences from 133 countries. Sci. Total. Environ. 2018, 646, 524–543. [Google Scholar] [CrossRef] [PubMed]
- UNEP. Decoupling Natural Resource Use and Environmental Impacts Fromeconomic Growth; A Report of theWorking Group on Decoupling to the International Resource Panel; United Nations Environment Programme: Nairobi, Kenya, 2011. [Google Scholar]
- OECD. Sustainable Development: Indicators to Measure Decoupling of Environmental Pressure from Economic Growth; OECD: Paris, France, 2002. [Google Scholar]
- Juknys, R.E. Indicators to measure decoupling of environmental pressure from economic growth. Sustain. Dev. 2002, 4, 4–9. [Google Scholar]
- Gielen, D.; Durrant, P.; Wagner, N. China: Decoupling GDP Growth from Rising Emissions. Available online: https://energypost.eu/china-decoupling-gdp-growth-from-rising-emissions/ (accessed on 23 October 2023).
- Chen, B.; Yang, Q.; Li, J.; Chen, G. Decoupling analysis on energy consumption, embodied GHG emissions and economic growth—The case study of Macao. Renew. Sust. Energy Rev. 2017, 67, 662–672. [Google Scholar] [CrossRef]
- OECD. OECD Environmental Strategy for the First Decade of the 21st Century; OECD: Paris, France, 2002. [Google Scholar]
- Csereklyei, Z.; Stern, D.I. Global energy use: Decoupling or convergence? Energy Econ. 2015, 51, 633–641. [Google Scholar] [CrossRef]
- Guevara, Z.; Domingos, T. Three-level decoupling of energy use in Portugal 1995–2010. Energy Policy 2017, 108, 134–142. [Google Scholar] [CrossRef]
- Román-Collado, R.; Cansino, J.M.; Botia, C. How far is Colombia from decoupling? Two-level decomposition analysis of energy consumption changes. Energy 2018, 148, 687–700. [Google Scholar] [CrossRef]
- Yu, Y.; Chen, D.; Zhu, B.; Hu, S. Eco-efficiency trends in China, 1978–2010:Decoupling environmental pressure from economic growth. Ecol. Indic. 2013, 24, 177–184. [Google Scholar] [CrossRef]
- Yu, Y.; Zhou, L.; Zhou, W.; Ren, H.; Kharrazi, A.; Ma, T.; Zhu, B. Decoupling environmental pressure fromeconomic growth on city level: The Case Study of Chongqing in China. Ecol. Indic. 2017, 75, 27–35. [Google Scholar] [CrossRef]
- Luderer, G.; Vrontisi, Z.; Bertram, C.; Edelenbosch, O.Y.; Pietzcker, R.C.; Rogelj, J.; De Boer, H.S.; Drouet, L.; Emmerling, J.; Fricko, O.; et al. Residual fossil CO2 emissions in 1.5–2 °C pathways. Nat. Clim. Change 2018, 8, 626–633. [Google Scholar] [CrossRef]
- Mikayilov, J.I.; Hasanov, F.J.; Galeotti, M. Decoupling of CO2 emissions and GDP: A time-varying cointegration approach. Ecol. Indic. 2018, 95, 615–628. [Google Scholar] [CrossRef]
- Piłatowska, M.; Włodarczyk, A. Decoupling Economic Growth from Carbon Dioxide Emissions in the E.U. Countries. Montenegrin J. Econ. 2018, 14, 7–26. [Google Scholar] [CrossRef]
- Schröder, E.; Storm, S. Economic Growth and Carbon Emissions: The Road to ‘Hothouse Earth’ is Paved with Good Intentions; Delft University of Technology: Delft, The Netherlands, 2018; Volume 20, Issue No. 2. [Google Scholar]
- Hilmi, N.; Acar, S.; Safa, A.; Bonnemaison, G. Decoupling Economic Growth and CO2 Emissions in the MENA: Can It Really Happen? Proc. Middle East Econ. Assoc. 2018, 20. [Google Scholar]
- Jiborn, M.; Kander, A.; Kulionis, V.; Nielsen, H.; Moran, D.D. Decoupling or delusion? Measuring emissions displacement in foreign trade. Glob. Environ. Change 2018, 49, 27–34. [Google Scholar] [CrossRef]
- UNFCCC. Aggregate Effect of the Intended Nationally Determined Contributions: An Update. 2016. Available online: https://unfccc.int/resource/docs/2016/cop22/eng/02.pdf (accessed on 16 October 2023).
- UNFCCC. The Paris Agreement. 2016. Available online: https://unfccc.int/process-and-meetings/the-paris-agreement (accessed on 23 July 2023).
- Shan, Y.; Guan, D.; Zheng, H.; Ou, J.; Li, Y.; Meng, J.; Mi, Z.; Liu, Z.; Zhang, Q. China CO2 emission accounts 1997–2015. Sci. Data 2018, 5, 170201. [Google Scholar] [CrossRef] [PubMed]
- Liu, N.; Ma, Z.; Kang, J. A regional analysis of carbon intensities of electricity generation in China. Energy Econ. 2017, 67, 268–277. [Google Scholar] [CrossRef]
- Yang, L.; Yang, Y.; Zhang, X.; Tang, K. Whether China’s industrial sectors make efforts to reduce CO2 emissions from production?-A decomposed decoupling analysis. Energy 2018, 160, 796–809. [Google Scholar] [CrossRef]
- Montgomery, H. Preventing the progression of climate change: One drug or polypill? Biofuel Res. J. 2017, 4, 536. [Google Scholar] [CrossRef]
- Watts, N.; Amann, M.; Arnell, N.; Ayeb-Karlsson, S.; Belesova, K.; Berry, H.; Bouley, T.; Boykoff, M.; Byass, P.; Cai, W.; et al. The 2018 report of the Lancet Countdown on health and climate change: Shaping the health of nations for centuries to come. Lancet 2018, 392, 2479–2514. [Google Scholar] [CrossRef] [PubMed]
- Watts, N.; Amann, M.; Ayeb-Karlsson, S.; Belesova, K.; Bouley, T.; Boykoff, M.; Byass, P.; Cai, W.; Campbell-Lendrum, D.; Chambers, J.; et al. The Lancet Countdown on health and climate change: From 25 years of inaction to a global transformation for public health. Lancet 2018, 391, 581–630. [Google Scholar] [CrossRef] [PubMed]
- Diffenbaugh, N.S.; Singh, D.; Mankin, J.S.; Horton, D.E.; Swain, D.L.; Touma, D.; Charland, A.; Liu, Y.; Haugen, M.; Tsiang, M.; et al. Quantifying the influence of global warming on unprecedented extreme climate events. Proc. Natl. Acad. Sci. USA 2017, 114, 4881–4886. [Google Scholar] [CrossRef] [PubMed]
- Zhang, Z. Decoupling China’s Carbon Emissions Increase from Economic Growth: An Economic Analysis and Policy Implications. World Dev. 2000, 28, 739–752. [Google Scholar] [CrossRef]
- Juknys, R. Transition period in Lithuania e do we move to sustainability? Environ. Res. Eng. Manag. 2003, 4, 4–9. [Google Scholar]
- Tapio, P. Towards a theory of decoupling: Degrees of decoupling in the E.U. and the case of road traffic in Finland between 1970 and 2001. Transp. Policy 2005, 12, 137–151. [Google Scholar] [CrossRef]
- Erdogan, S.; Okumus, I.; Guzel, A.E. Revisiting the Environmental Kuznets Curve hypothesis in OECD countries: The role of renewable, non-renewable energy, and oil prices. Environ. Sci. Pollut. Res. 2020, 27, 23655–23663. [Google Scholar] [CrossRef] [PubMed]
- Wang, Q.; Yang, T.; Li, R. Does income inequality reshape the environmental Kuznets curve (EKC) hypothesis? A nonlinear panel data analysis. Environ. Res. 2022, 216, 114575. [Google Scholar] [CrossRef] [PubMed]
- Wang, Q.; Wang, X.; Li, R. Does urbanization redefine the environmental Kuznets curve? An empirical analysis of 134 Countries. Sustain. Cities Soc. 2022, 76, 103382. [Google Scholar] [CrossRef]
- Wang, Q.; Wang, L.; Li, R. Trade protectionism jeopardizes carbon neutrality—Decoupling and breakpoints roles of trade openness. Sustain. Prod. Consum. 2023, 35, 201–215. [Google Scholar] [CrossRef]
- Climent, F.; Pardo, A. Decoupling factors on the energyting the changing composition of U+. Energy Policy 2007, 35, 522–528. [Google Scholar] [CrossRef]
- Correa, L.I.B.; Steinberger, J.K. A framework for decoupling human need satisfaction from energy use. Ecol. Econ. 2017, 141, 43–52. [Google Scholar] [CrossRef]
- Luken, R.A.; Piras, S. A critical overview of industrial energy decoupling programs in six developing countries in Asia. Energy Policy 2011, 39, 3869–3872. [Google Scholar] [CrossRef]
- Sorrell, S.; Lehtonen, M.; Stapleton, L.; Pujol, J.; Champion, T. Decoupling of road freight energy use from economic growth in the United Kingdom. Energy Policy 2012, 41, 84–97. [Google Scholar] [CrossRef]
- Enevoldsen, M.K.; Ryelund, A.V.; Andersen, M.S. Decoupling of industrial energy consumption and CO2-emissions in energy-intensive industries in Scandinavia. Energy Econ. 2007, 29, 665–692. [Google Scholar] [CrossRef]
- Moreau, V.; Vuille, F. Decoupling energy use and economic growth: Counter evidence from structural effects and embodied energy in trade. Appl. Energy 2018, 215, 54–62. [Google Scholar] [CrossRef]
- Schandl, H.; Hatfield-Dodds, S.; Wiedmann, T.; Geschke, A.; Cai, Y.; West, J.; Newth, D.; Baynes, T.; Lenzen, M.; Owen, A. Decoupling global environmental pressure and economic growth: Scenarios for energy use, materials use and carbon emissions. J. Clean. Prod. 2016, 132, 45–56. [Google Scholar] [CrossRef]
- Wang, Q.; Jiang, X.-T.; Li, R. Comparative decoupling analysis of energy-related carbon emission from electric output of electricity sector in Shandong Province, China. Energy 2017, 127, 78–88. [Google Scholar] [CrossRef]
- Wang, Y.; Zhou, Y.; Zhu, L.; Zhang, F.; Zhang, Y. Influencing Factors and Decoupling Elasticity of China’s Transportation Carbon Emissions. Energies 2018, 11, 1157. [Google Scholar] [CrossRef]
- Zhang, S.; Wang, J.; Zheng, W. Decomposition Analysis of Energy-Related CO2 Emissions and Decoupling Status in China’s Logistics Industry. Sustainability 2018, 10, 1340. [Google Scholar] [CrossRef]
- Freitas, L.C.; Kaneko, S. Decomposing the decoupling of CO2 emissions and economic growth in Brazil. Ecol. Econ. 2011, 70, 1459–1469. [Google Scholar] [CrossRef]
- Zhang, M.; Wang, W.W. Decouple indicators on the CO2 emission-economic growth linkage: The Jiangsu Province case. Ecol. Indic. 2013, 32, 239–244. [Google Scholar] [CrossRef]
- Jiang, R.; Zhou, Y.; Li, R. Moving to a Low-Carbon Economy in China: Decoupling and Decomposition Analysis of Emission and Economy from a Sector Perspective. Sustainability 2018, 10, 3251. [Google Scholar] [CrossRef]
- Wang, T.; Riti, J.S.; Shu, Y. Decoupling emissions of greenhouse gas, urbanization, energy and income: Analysis from the economy of China. Environ. Sci. Pollut. Res. 2018, 25, 19845–19858. [Google Scholar] [CrossRef] [PubMed]
- Zhang, M.; Bai, C. Exploring the influencing factors and decoupling state of residential energy consumption in Shandong. J. Clean. Prod. 2018, 194, 253–262. [Google Scholar] [CrossRef]
- Wang, Q.; Jiang, R.; Li, R. Decoupling analysis of economic growth from water use in City: A case study of Beijing, Shanghai, and Guangzhou of China. Sustain. Cities Soc. 2018, 41, 86–94. [Google Scholar] [CrossRef]
- Zhang, M.; Song, Y.; Su, B.; Sun, X. Decomposing the decoupling indicator between the economic growth and energy consumption in China. Energy Effic. 2015, 8, 1231–1239. [Google Scholar] [CrossRef]
- Diakoulaki, D.; Mandaraka, M. Decomposition analysis for assessing the progress in decoupling industrial growth from CO2 emissions in the E.U. manufacturing sector. Energy Econ. 2007, 29, 636–664. [Google Scholar] [CrossRef]
- Ang, B.W. The LMDI approach to decomposition analysis: A practical guide. Energy Policy 2005, 33, 867–871. [Google Scholar] [CrossRef]
- Zhang, M.; Wang, W.W. Decoupling analysis of electricity consumption from economic growth in China. J. Energy S. Afr. 2013, 24, 57–66. [Google Scholar] [CrossRef]
- You, Q.; Kang, S.; Aguilar, E.; Pepin, N.; Flugel, W.A.; Yan, Y.; Xu, Y.; Zhang, Y.; Huang, J. Changes in daily climate extremes in China and their connection to the large-scale atmospheric circulation during 1961–2003. Clim. Dyn. 2011, 36, 2399–2417. [Google Scholar] [CrossRef]
- Siping, J.; Wendai, L.; Liu, M.; Xiangjun, Y.; Hongjuan, Y.; Yongming, C.; Haiyun, C.; Hayat, T.; Alsaedi, A.; Ahmad, B. Decoupling environmental pressures from economic growth based on emissions monetization: Case in Yunnan, China. J. Clean. Prod. 2019, 208, 1563–1576. [Google Scholar] [CrossRef]
- Jiang, J.J.; Ye, B.; Zhou, N.; Zhang, X.L. Decoupling analysis and environmental Kuznets curve modelling of provincial-level CO2 emissions and economic growth in China: A case study. J. Clean. Prod. 2019, 212, 1242–1255. [Google Scholar] [CrossRef]
- Wang, Q.; Su, M.; Li, R. Toward to economic growth without emission growth: The role of urbanization and industrialization in China and India. J. Clean. Prod. 2018, 205, 499–511. [Google Scholar] [CrossRef]
- Xie, P.; Gao, S.; Sun, F. An analysis of the decoupling relationship between CO2 emission in power industry and GDP in China based on LMDI method. J. Clean. Prod. 2019, 211, 598–606. [Google Scholar] [CrossRef]
- Li, H.; Qin, Q. Challenges for China’s carbon emissions peaking in 2030: A decomposition and decoupling analysis. J. Clean. Prod. 2019, 207, 857–865. [Google Scholar] [CrossRef]
- Wang, Q.; Jiang, R. Is China’s economic growth decoupled from carbon emissions? J. Clean. Prod. 2019, 225, 1194–1208. [Google Scholar] [CrossRef]
- Dong, B.; Zhang, M.; Mu, H.; Su, X. Study on decoupling analysis between energy consumption and economic growth in Liaoning Province. Energy Policy 2016, 97, 414–420. [Google Scholar] [CrossRef]
- Zhao, X.; Zhang, X.; Li, N.; Shao, S.; Geng, Y. Decoupling economic growth from carbon dioxide emissions in China: A sectoral factor decomposition analysis. J. Clean. Prod. 2017, 142, 3500–3516. [Google Scholar] [CrossRef]
- Lu, Q.; Yang, H.; Huang, X.; Chuai, X.; Wu, C. Multi-sectoral decomposition in decoupling industrial growth from carbon emissions in the developed Jiangsu Province, China. Energy 2015, 82, 414–425. [Google Scholar] [CrossRef]
- Madaleno, M.; Moutinho, V. Effects decomposition: Separation of carbon emissions decoupling and decoupling effort in aggregated EU-15. Environ. Dev. Sustain. 2018, 20, 181–198. [Google Scholar] [CrossRef]
- Zhang, Y.-J.; Da, Y.-B. The decomposition of energy-related carbon emission and its decoupling with economic growth in China. Renew. Sustain. Energy Rev. 2015, 41, 1255–1266. [Google Scholar] [CrossRef]
- Jiang, R.; Li, R. Decomposition and Decoupling Analysis of Life-Cycle Carbon Emission in China’s Building Sector. Sustainability 2017, 9, 793. [Google Scholar] [CrossRef]
- Wang, Q.; Zhang, F. The effects of trade openness on decoupling carbon emissions from economic growth—Evidence from 182 countries. J. Clean. Prod. 2020, 279, 123838. [Google Scholar] [CrossRef] [PubMed]
- Wang, Q.; Wang, S. Is energy transition promoting the decoupling economic growth from emission growth? Evidence from the 186 countries. J. Clean. Prod. 2020, 260, 120768. [Google Scholar] [CrossRef]
- Kempton, W. How the public views climate change. Environment 1997, 39, 12–21. [Google Scholar] [CrossRef]
- Stamm, K.R.; Clark, F.; Eblacas, P.R. Mass communication and public understanding of environmental problems: The case of global warming. Public Underst. Sci. 2000, 9, 219–237. [Google Scholar] [CrossRef]
- Bostrom, A.; Morgan, M.G.; Fischhoff, B.; Read, D. What Do People Know About Global Climate Change? 1. Mental Models. Risk Anal. 1994, 14, 959–970. [Google Scholar] [CrossRef]
- Moser, S.C.; Dilling, L. Making climate hot: Communicating the urgency and challenge of global climate change. Environment 2004, 46, 32–46. [Google Scholar]
- DoE. Climate Change: The U.K. Programme; HMSO: London, UK, 1994. [Google Scholar]
- DETR. Climate Change: The U.K. Programme; HMSO: London, UK, 2000. [Google Scholar]
- His Majesty’s Government. Climate Change: The U.K. Programme 2006; HMSO: London, UK, 2006.
- EU Commission. Regulation (E.U.) 2018/842 of the European Parliament and of the Council of 30 May 2018 on Binding Annual Greenhouse Gas Emission Reductions by Member States from 2021 to 2030 Contributing to Climate Action to Meet Commitments under the Paris Agreement and amending Regulation (EU) No 525/2013. Available online: https://eur-lex.europa.eu/eli/reg/2018/842/oj (accessed on 11 June 2023).
- Purcel, A.-A. New insights into the environmental Kuznets curve hypothesis in developing and transition economies: A literature survey. Environ. Econ. Policy Stud. 2020, 22, 585–631. [Google Scholar] [CrossRef]
- Conde, C.; Estrada, F.; Martínez, B.; Sánchez, O.; Gay, C. Regional climate change scenarios for México. Atmósfera 2011, 24, 125–140. [Google Scholar]
- Ruosteenoja, K.; Carter, T.R.; Jylhä, K.; Tuomenvirta, H. Future Climate in World Regions: An Intercomparison of Model-Based Projections for the New IPCC Emissions Scenarios; Finnish Environment Institute: Helsinki, Finland, 2003. [Google Scholar]
- Guimberteau, M.; Ciais, P.; Ducharne, A.; Boisier, J.P.; Aguiar, A.P.D.; Biemans, H.; De Deurwaerder, H.; Galbraith, D.; Kruijt, B.; Langerwisch, F.; et al. Impacts of future deforestation and climate change on the hydrology of the Amazon Basin: A multi-model analysis with a new set of land-cover change scenarios. Hydrol. Earth Syst. Sci. 2017, 21, 1455–1475. [Google Scholar] [CrossRef]
- Riahi, K.; Rao, S.; Krey, V.; Cho, C.; Chirkov, V.; Fischer, G.; Rafaj, P. RCP 8.5—A scenario of comparatively high greenhouse gas emissions. Clim. Change 2011, 109, 33–57. [Google Scholar] [CrossRef]
- McJeon, H.; Edmonds, J.; Bauer, N.; Clarke, L.; Fisher, B.; Flannery, B.P.; Hilaire, J.; Krey, V.; Marangoni, G.; Mi, R.; et al. Limited impact on decadal-scale climate change from increased use of natural gas. Nature 2014, 514, 482–485. [Google Scholar] [CrossRef] [PubMed]
- Zanobetti, A.; Peters, A. Disentangling interactions between atmospheric pollution and weather. J. Epidemiol. Community Health 2015, 69, 613–615. [Google Scholar] [CrossRef] [PubMed]
- Wester, P.; Mishra, A.; Mukherji, A.; Shrestha, A.B. The Hindu Kush Himalaya Assessment: Mountains, Climate Change, Sustainability and People; Springer Nature: Berlin/Heidelberg, Germany, 2019. [Google Scholar]
- Keyßer, L.T.; Lenzen, M. 1.5 °C degrowth scenarios suggest the need for new mitigation pathways. Nat. Commun. 2021, 12, 2676. [Google Scholar] [CrossRef] [PubMed]
- Rogelj, J.; Popp, A.; Calvin, K.V.; Luderer, G.; Emmerling, J.; Gernaat, D.; Fujimori, S.; Strefler, J.; Hasegawa, T.; Marangoni, G.; et al. Scenarios towards limiting global mean temperature increase below 1.5 °C. Nat. Clim. Change 2018, 8, 325–332. [Google Scholar] [CrossRef]
- Jiang, K.; He, C.; Dai, H.; Liu, J.; Xu, X. Emission scenario analysis for China under the global 1.5° C target. Carbon Manag. 2018, 9, 481–491. [Google Scholar] [CrossRef]
- Tokarska, K.B.; Arora, V.K.; Gillett, N.P.; Lehner, F.; Rogelj, J.; Schleussner, C.F.; Knutti, R. Uncertainty in carbon budget estimates due to internal climate variability. Environ. Res. Lett. 2020, 15, 104064. [Google Scholar] [CrossRef]
- Chini, L.; Hurtt, G.; Sahajpal, R.; Frolking, S.; Goldewijk, K.K.; Sitch, S.; Ganzenmüller, R.; Ma, L.; Ott, L.; Pongratz, J.; et al. Land-use harmonization datasets for annual global carbon budgets. Earth Syst. Sci. Data 2021, 13, 4175–4189. [Google Scholar] [CrossRef]
- Gillingham, K.; Stock, J.H. The Cost of Reducing Greenhouse Gas Emissions. J. Econ. Perspect. 2018, 32, 53–72. [Google Scholar] [CrossRef]
- Timilsina, G.R. Demystifying the Costs of Electricity Generation Technologies; The World Bank: Washington, DC, USA, 2020. [Google Scholar]
- Hare, B.; Meinshausen, M. How much warming are we committed to and how much can be avoided? Clim. Change 2006, 75, 111–149. [Google Scholar] [CrossRef]
- Edenhofer, O.; Knopf, B.; Barker, T.; Baumstark, L.; Bellevrat, E.; Chateau, B.; Criqui, P.; Isaac, M.; Kitous, A.; Kypreos, S.; et al. The Economics of Low Stabilization: Model Comparison of Mitigation Strategies and Costs. Energy J. 2010, 31, 11–48. [Google Scholar] [CrossRef]
- Schmidt, J.; Leduc, S.; Dotzauer, E.; Schmid, E. Cost-effective policy instruments for greenhouse gas emission reduction and fossil fuel substitution through bioenergy production in Austria. Energy Policy 2011, 39, 3261–3280. [Google Scholar] [CrossRef]
- Moser, S.C.; Ekstrom, J.A. A framework to diagnose barriers to climate change adaptation. Proc. Natl. Acad. Sci. USA 2010, 107, 22026–22031. [Google Scholar] [CrossRef] [PubMed]
- Crane-Droesch, A. Machine learning methods for crop yield prediction and climate change impact assessment in agriculture. Environ. Res. Lett. 2018, 13, 114003. [Google Scholar] [CrossRef]
- Travis, W.R.; Huisenga, M.T. The effect of rate of change, variability, and extreme events on the pace of adaptation to a changing climate. Clim. Change 2013, 121, 209–222. [Google Scholar] [CrossRef]
- Berkhout, F. Adaptation to climate change by organizations. Wiley Interdiscip. Rev. Clim. Change 2012, 3, 91–106. [Google Scholar] [CrossRef]
- Dupuis, J.; Biesbroek, R. Comparing apples and oranges: The dependent variable problem in comparing and evaluating climate change adaptation policies. Glob. Environ. Change 2013, 23, 1476–1487. [Google Scholar] [CrossRef]
- Creutzig, F.; Roy, J.; Lamb, W.F.; Azevedo, I.M.; De Bruin, W.B.; Dalkmann, H.; Edelenbosch, O.Y.; Geels, F.W.; Grubler, A.; Hepburn, C.; et al. Towards demand-side solutions for mitigating climate change. Nat. Clim. Change 2018, 8, 260–263. [Google Scholar] [CrossRef]
- Hazen, E.L.; Jorgensen, S.; Rykaczewski, R.R.; Bograd, S.J.; Foley, D.G.; Jonsen, I.D.; Shaffer, S.A.; Dunne, J.P.; Costa, D.P.; Crowder, L.B.; et al. Predicted habitat shifts of Pacific top predators in a changing climate. Nat. Clim. Change 2012, 3, 234–238. [Google Scholar] [CrossRef]
- Weart, S.R. The Discovery of Global Warming; Harvard University Press: Cambridge, MA, USA, 2008. [Google Scholar]
- Tol, R.S.J. Correction and Update: The Economic Effects of Climate Change. J. Econ. Perspect. 2014, 28, 221–226. [Google Scholar] [CrossRef]
- Adano, W.R.; Dietz, T.; Witsenburg, K.; Zaal, F. Climate change, violent conflict and local institutions in Kenya’s drylands. J. Peace Res. 2012, 49, 65–80. [Google Scholar] [CrossRef]
- Groom, B.; Drupp, M.A.; Freeman, M.C.; Nesje, F. The future, now: A review of social discounting. Annu. Rev. Resour. Econ. 2022, 14, 467–491. [Google Scholar] [CrossRef]
- IPCC. Summary for Policymakers. In Climate Change 2014, Mitigation of Climate Change: Contribution of Working Group III to the Fifth Assessment Report of the Intergovernmental Panel on Climate Change; Edenhofer, O., Pichs-Madruga, R., Sokona, Y., Minx, J., Farahani, E., Kadner, S., Seyboth, K., Adler, A., Baum, I., Baum, S., et al., Eds.; Cambridge University Press: Cambridge, UK, 2014. [Google Scholar]
- Penuelas, J.; Sardans, J.; Filella, I.; Estiarte, M.; Llusià, J.; Ogaya, R.; Carnicer, J.; Bartrons, M.; Rivas-Ubach, A.; Grau, O.; et al. Impacts of Global Change on Mediterranean Forests and Their Services. Forests 2017, 8, 463. [Google Scholar] [CrossRef]
- Arrow, K.; Cropper, M.; Gollier, C.; Groom, B.; Heal, G.; Newell, R.; Nordhaus, W.; Pindyck, R.; Pizer, W.; Portney, P.; et al. Determining Benefits and Costs for Future Generations. Science 2013, 341, 349–350. [Google Scholar] [CrossRef] [PubMed]
- Giglio, S.; Maggiori, M.; Stroebel, J. Very long-run discount rates. Q. J. Econ. 2015, 130, 1–53. [Google Scholar] [CrossRef]
- Gollier, C. Pricing the Planet’s Future: The Economics of Discounting in An Uncertain World; Princeton University Press: Princeton, NJ, USA, 2013. [Google Scholar]
- Groom, B.; Maddison, D. New Estimates of the Elasticity of Marginal Utility for the UK. Environ. Resour. Econ. 2018, 72, 1155–1182. [Google Scholar] [CrossRef]
- Burgess, D.F.; Zerbe, R.O. The most appropriate discount rate. J. Benefit-Cost Anal. 2013, 4, 391–400. [Google Scholar] [CrossRef]
- Wang, Q.; Dong, Z.; Li, R.; Wang, L. Renewable energy and economic growth: New insight from country risks. Energy 2022, 238, 122018. [Google Scholar] [CrossRef]
- Wang, Q.; Li, S.; Pisarenko, Z. Heterogeneous effects of energy efficiency, oil price, environmental pressure, R&D investment, and policy on renewable energy—Evidence from the G20 countries. Energy 2020, 209, 118322. [Google Scholar]
- Wei, W.; Cai, W.; Guo, Y.; Bai, C.; Yang, L. Decoupling relationship between energy consumption and economic growth in China’s provinces from the perspective of resource security. Resour. Policy 2020, 68, 101693. [Google Scholar] [CrossRef]
- Zhang, Y.; Sun, M.; Yang, R.; Li, X.; Zhang, L.; Li, M. Decoupling water environment pressures from economic growth in the Yangtze River Economic Belt, China. Ecol. Indic. 2021, 122, 107314. [Google Scholar] [CrossRef]
- Barcker, T.; Crawford-Brown, D. Decarbonising the World’s Economy. In Assessing the Feasibility of Policies to Reduce Greenhouse Gas Emissions; Imperial College Press: London, UK, 2015. [Google Scholar]
- Deep Decarbonization Pathways Project (DDPP). Pathways to Deep Decarbonization 2015: Synthesis Report & Executive Summary; SDSN: New York, NY, USA; IDDRI: Paris, France, 2015. [Google Scholar]
- Allwood, J.M.; Ashby, M.F.; Gutowski, T.G.; Worrell, E. Material efficiency: A white paper. Resour. Conserv. Recycl. 2011, 55, 362–381. [Google Scholar] [CrossRef]
- Scott, K.; Giesekam, J.; Barrett, J.; Owen, A. Bridging the climate mitigation gap with economy-wide material productivity. J. Ind. Ecol. 2018, 23, 918–931. [Google Scholar] [CrossRef]
- Hernandez, G. Site-Level Resource Efficiency Analysis. Ph.D. Thesis, University of Cambridge, Cambridge, UK, 2018. Available online: https://www.repository.cam.ac.uk/handle/1810/284771 (accessed on 25 November 2020). [CrossRef]
- Barrett, J.; Taylor, P.; Norman, J.; Giesekam, J. Industry, materials and products (Chapter 3). In Shifting the Focus: Energy Demand in a Net-Zero Carbons U.K; Eyre, N., Killip, G., Eds.; Centre for Research into Energy Demand Solutions, University of Oxford: Oxford, UK, 2019; ISBN 978-1-913299-00-2. [Google Scholar]
- Flachenecker, F.; Kornejew, M. The causal impact of material productivity on microeconomic competitiveness and environmental performance in the Euro- pean Union. Environ. Econ. Policy Stud. 2019, 21, 87–122. [Google Scholar] [CrossRef]
- IRP. Global Resources Outlook 2019: Natural Resources for the Future We Want; A Report of the International Resource Panel; United Nations Environment Programme: Nairobi, Kenya, 2019. [Google Scholar]
- Hertwich, E. The Carbon Footprint of Material Production Rises to 23% of Global Greenhouse Gas Emissions; Center for Open Science: Charlottesville, VA, USA, 2019. [Google Scholar] [CrossRef]
- Pollitt, H.; Neuhoff, K.; Lin, X. The impact of implementing a consumption charge on carbon-intensive materials in Europe. Clim. Policy 2019, 20, S74–S89. [Google Scholar] [CrossRef]
- Buhl, J.; Liedtke, C.; Teubler, J.; Bienge, K. The Material Footprint of private households in Germany: Linking the natural resource use and socioeconomic characteristics of users from an online footprint calculator in Germany. Sustain. Prod. Consum. 2019, 20, 74–83. [Google Scholar] [CrossRef]
- Afionis, S.; Sakai, M.; Scott, K.; Barrett, J.; Gouldson, A. Consumption-based carbon accounting: Does it have a future? Wiley Interdisciplinary Reviews. Clim. Change 2017, 8, 438. [Google Scholar]
- Karakaya, E.; Yılmaz, B.; Alataş, S. How production-based and consumption-based emissions accounting systems change climate policy analysis: The case of CO2 convergence. Environ. Sci. Pollut. Res. 2019, 26, 16682–16694. [Google Scholar] [CrossRef] [PubMed]
- Haberl, H.; Wiedenhofer, D.; Virág, D.; Kalt, G.; Plank, B.; Brockway, P.; Fishman, T.; Hausknost, D.; Krausmann, F.; Leon-Gruchalski, B.; et al. A systematic review of the evidence on decoupling of GDP, resource use and GHG emissions, part II: Synthesizing the insights. Environ. Res. Lett. 2020, 15, 065003. [Google Scholar] [CrossRef]
- Haberl, H.; Wiedenhofer, D.; Virág, D.; Kalt, G.; Plank, B.; Brockway, P.; Creutzig, F. A systematic review of the evidence on decoupling of GDP, resource use and GHG emissions, part I: Bibliometric and conceptual mapping. Environ. Res. Lett. 2020, 15, 063002. [Google Scholar] [CrossRef]
- Aktaş, C.B. Dematerialization: Needs and Challenges. In Handbook of Sustainability Science in the Future: Policies, Technologies, and Education by 2050; Springer: Berlin/Heidelberg, Germany, 2021; pp. 1–13. [Google Scholar]
- Kan, X.; Hedenus, F.; Reichenberg, L. The cost of a future low-carbon electricity system without nuclear power—The case of Sweden. Energy 2020, 195, 117015. [Google Scholar] [CrossRef]
- Sayed, M.A.; Ghafouri, M.; Atallah, R.; Debbabi, M.; Assi, C. Protecting the future grid: An electric vehicle robust mitigation scheme against load altering attacks on power grids. Appl. Energy 2023, 350, 121769. [Google Scholar] [CrossRef]
- Schlachtberger, D.P.; Brown, T.; Schramm, S.; Greiner, M. The benefits of cooperation in a highly renewable European electricity network. Energy 2017, 134, 469–481. [Google Scholar] [CrossRef]
- Statistics Sweden. Women and Men in Sweden: Facts and Figures; Statistics Sweden: Stockholm, Sweden, 1985. [Google Scholar]
- Chen, H.; Guo, W.; Feng, X.; Wei, W.; Liu, H.; Feng, Y.; Gong, W. The impact of low-carbon city pilot policy on the total factor productivity of listed enterprises in China. Resour. Conserv. Recycl. 2021, 169, 105457. [Google Scholar] [CrossRef]
- Hibbard, M.; Lurie, S. The New Natural Resource Economy: Environment and Economy in Transitional Rural Communities. Soc. Nat. Resour. 2013, 26, 827–844. [Google Scholar] [CrossRef]
- Niyazbekova, S.; Jazykbayeva, B.; Mottaeva, A.; Beloussova, E.; Suleimenova, B.; Zueva, A. The Growth of “Green” finance at the global level in the context of sustainable economic development. E3S Web Conf. 2021, 244, 10058. [Google Scholar] [CrossRef]
- Schröder, P.; Vergragt, P.; Brown, H.S.; Dendler, L.; Gorenflo, N.; Matus, K.; Quist, J.; Rupprecht, C.D.; Tukker, A.; Wennersten, R. Advancing sustainable consumption and production in cities—A transdisciplinary research and stakeholder engagement framework to address consumption-based emissions and impacts. J. Clean. Prod. 2018, 213, 114–125. [Google Scholar] [CrossRef]
- Er, B.; Guneysu, Y.; Ünal, H. Financing renewable energy projects: An empirical analysis for Turkey. Int. J. Energy Econ. Policy 2018, 8, 180. [Google Scholar]
- Chen, T.; Li, M.; Li, Y.; Lin, M.; Wang, N.; Wang, M.; Zhang, Z. Mxnet: A flexible and efficient machine learning library for heterogeneous distributed systems. arXiv 2015, arXiv:1512.01274. [Google Scholar]
- GTEx Consortium; Ardlie, K.G.; Deluca, D.S.; Segrè, A.V.; Sullivan, T.J.; Young, T.R.; Gelfand, E.T.; Trowbridge, C.A.; Maller, J.B.; Tukiainen, T.; et al. The Genotype-Tissue Expression (GTEx) pilot analysis: Multitissue gene regulation in humans. Science 2015, 348, 648–660. [Google Scholar]
- Wang, J.; Li, Z.; Wu, T.; Wu, S.; Yin, T. The decoupling analysis of CO2 emissions from power generation in Chinese provincial power sector. Energy 2022, 255, 124488. [Google Scholar] [CrossRef]
- Gerbaulet, C.; von Hirschhausen, C.; Kemfert, C.; Lorenz, C.; Oei, P.-Y. European electricity sector decarbonization under different levels of foresight. Renew. Energy 2019, 141, 973–987. [Google Scholar] [CrossRef]
- Steblyanskaya, A.; Ai, M.; Denisov, A.; Efimova, O.; Rybachuk, M. Carbon dioxide emissions reduction efficiency and growth potential: Case of China. PSU Res. Rev. 2022. ahead of print. [Google Scholar] [CrossRef]
- Zhang, J.; Fan, Z.; Chen, Y.; Gao, J.; Liu, W. Decomposition and decoupling analysis of carbon dioxide emissions from economic growth in the context of China and the ASEAN countries. Sci. Total. Environ. 2020, 714, 136649. [Google Scholar] [CrossRef] [PubMed]
- Simbi, C.H.; Lin, J.; Yang, D.; Ndayishimiye, J.C.; Liu, Y.; Li, H.; Xu, L.; Ma, W. Decomposition and decoupling analysis of carbon dioxide emissions in African countries during 1984–2014. J. Environ. Sci. 2020, 102, 85–98. [Google Scholar] [CrossRef]
- Jayanthakumaran, K.; Verma, R.; Liu, Y. CO2 emissions, energy consumption, trade and income: A comparative analysis of China and India. Energy Policy 2012, 42, 450–460. [Google Scholar] [CrossRef]
- Acaravci, A.; Ozturk, I. On the relationship between energy consumption, CO2 emissions and economic growth in Europe. Energy 2010, 35, 5412–5420. [Google Scholar] [CrossRef]
- Akbostancı, E.; Türüt-Aşık, S.; Tunç, G.İ. The relationship between income and environment in Turkey: Is there an environmental Kuznets curve? Energy 2009, 37, 861–867. [Google Scholar] [CrossRef]
- Managi, S.; Jena, P.R. Environmental productivity and Kuznets curve in India. Ecol. Econ. 2008, 65, 432–440. [Google Scholar] [CrossRef]
- Pao, H.T.; Tsai, C. CO2 emissions, energy consumption and economic growth in BRIC countries. Energy Policy 2010, 38, 7850–7860. [Google Scholar] [CrossRef]
- Menyah, K.; Wolde-Rufael, Y. Energy consumption, pollutant emissions and economic growth in South Africa. Energy Econ. 2010, 32, 1374–1382. [Google Scholar] [CrossRef]
- Ziramba, E. Disaggregate energy consumption and industrial production in South Africa. Energy Policy 2009, 37, 2214–2220. [Google Scholar] [CrossRef]
- Nain, M.Z.; Ahmad, W.; Kamaiah, B. Economic growth, energy consumption and CO2 emissions in India: A disaggregated causal analysis. Int. J. Sustain. Energy 2015, 36, 807–824. [Google Scholar] [CrossRef]
- Ang, J.B. CO2 emissions, energy consumption, and output in France. Energy Policy 2007, 35, 4772–4778. [Google Scholar] [CrossRef]
- Ang, J.B. Economic development, pollutant emissions and energy consumption in Malaysia. J. Policy Model. 2008, 30, 271–278. [Google Scholar] [CrossRef]
- Shahbaz, M.; Lean, H.H.; Shabbir, M.S. Environmental Kuznets curvehypothesis in Pakistan: Cointegration and granger causality. Renew. Sustain. Energy Rev. 2012, 16, 2947–2953. [Google Scholar] [CrossRef]
- Kanjilal, K.; Ghosh, S. Environmental Kuznet’s curve for India: Evidence fromtests for cointegration with unknown structural breaks. Energy Policy 2013, 56, 509–515. [Google Scholar] [CrossRef]
- Ghosh, S. Examining carbon emissions economic growth nexus for India: Amultivariate cointegration approach. Energy Policy 2010, 38, 3008–3014. [Google Scholar] [CrossRef]
- Apergis, N.; Payne, J.E. CO2 emissions, energy usage, and output in Central America. Energy Policy 2009, 37, 3282–3286. [Google Scholar] [CrossRef]
- Olarinde, M.; Martins, I.; Abdulsalam, S. An empirical analysis of the relationship between CO2 emissions and economic growth in West Africa. Am. J. Econ. 2014, 4, 1–17. [Google Scholar]
- Shuaibu, M.I.; Oyinlola, M.A. Energy Consumption, CO2 Emissions and Economic Growth in Nigeria. In Proceedings of the 2013 NAEE International Conference, Lagos, Nigeria, 22–23 April 2013. [Google Scholar]
- Warner, M. The carbon Kuznet scurve: A cloudy picture emitted by bad econometrics? Resour. Energy Econ. 2008, 30, 388–408. [Google Scholar]
- Selden, T.M.; Song, D. Environmental quality and development: Is there a Kuznets Curve for air pollution emissions? J. Environ. Econ. Manag. 1994, 27, 147–162. [Google Scholar] [CrossRef]
- Li, R.; Li, L.; Wang, Q. The impact of energy efficiency on carbon emissions: Evidence from the transportation sector in Chinese 30 provinces. Sustain. Cities Soc. 2022, 82, 103880. [Google Scholar] [CrossRef]
- Lean, H.H.; Smyth, R. CO2 emissions, electricity consumption and output in ASEAN. Appl. Energy 2010, 87, 1858–1864. [Google Scholar] [CrossRef]
- Baek, J.; Kim, H.S. Is economic growth good or bad for the environment? Empir. Evid. Korea Energy Econ. 2013, 36, 744–749. [Google Scholar]
- Holtz-Eakin, D.; Selden, T.M. Stoking and fires? CO2 emissions and economic growth. J. Public Econ. 1995, 57, 85–101. [Google Scholar] [CrossRef]
- De Bruyn, S.M.; van den Bergh, J.C.; Opschoor, J.B. Economic growth and emissions: Reconsidering the empirical basis of environmental Kuznets curves. Ecol. Econ. 1998, 25, 161–175. [Google Scholar] [CrossRef]
- Omri, A. CO2 emissions, energy consumption and economic growth nexus in MENA countries: Evidence from simultaneous equations models. Energy Econ. 2013, 40, 657–664. [Google Scholar] [CrossRef]
- Shafik, N. Economic Development and Environmental Quality: An Econometric Analysis. Oxf. Econ. Pap. 1994, 46, 757–773. [Google Scholar] [CrossRef]
- Ozturk, I.; Acaravci, A. CO2 emissions, energy consumption and economic growth in Turkey. Renew. Sustain. Energy Rev. 2010, 14, 3220–3225. [Google Scholar] [CrossRef]
- Soytas, U.; Sari, R.; Ewing, B.T. Energy consumption, income, and carbon emissions in the United States. Ecol. Econ. 2006, 62, 482–489. [Google Scholar] [CrossRef]
- Zhang, X.P.; Cheng, X.M. Energy consumption, carbon emissions, and economic growth in China. Ecol. Econ. 2009, 68, 2706–2712. [Google Scholar] [CrossRef]
- Lotfalipour, M.R.; Falahi, M.A.; Ashena, M. Economic growth, CO2 emissions, and fossil fuels consumption in Iran. Energy 2010, 35, 5115–5120. [Google Scholar] [CrossRef]
- Saboori, B.; Sapri, M.; bin Baba, M. Economic growth, energy consumption and CO2 emissions in OECD (Organization for Economic Co-operation and Development)’s transport sector: A fully modified bi-directional relationship approach. Energy 2014, 66, 150–161. [Google Scholar] [CrossRef]
- Arouri, M.E.H.; Ben Youssef, A.; M’Henni, H.; Rault, C. Energy consumption: Economic growth and CO2 emissions in Middle East and North African countries. Energy Policy 2012, 45, 342–349. [Google Scholar] [CrossRef]
- Esteve, V.; Tamarit, C. Is there an environmental Kuznets curve for Spain? Fresh evidence from old data. Econ. Model. 2012, 29, 2696–2703. [Google Scholar] [CrossRef]
- Fodha, M.; Zaghdoud, O. Economic growth and pollutant emissions in Tunisia: An empirical analysis of the environmental Kuznets curve. Energy Policy 2010, 38, 1150–1156. [Google Scholar] [CrossRef]
- Al-Mulali, U.; Fereidouni, H.G.; Lee, J.Y.; Sab, C.N.B.C. Examining the bi-directional long run relationship between renewable energy consumption and GDP growth. Renew. Sustain. Energy Rev. 2013, 22, 209–222. [Google Scholar] [CrossRef]
- Al-Mulali, U.; Sab, C.N.C. Energy consumption, pollution and economic development in 16 emerging countries. J. Econ. Stud. 2013, 40, 686–698. [Google Scholar] [CrossRef]
- Onafowora, O.A.; Owoye, O. Bounds testing approach to analysis of the environment Kuznets curve hypothesis. Energy Econ. 2014, 44, 47–62. [Google Scholar] [CrossRef]
- Lau, L.S.; Choong, C.K.; Eng, Y.K. Investigation of the environmental Kuznets curve for carbon emissions in Malaysia: Do foreign direct investment and trade matter? Energy Policy 2014, 68, 490–497. [Google Scholar] [CrossRef]
- Li, R.; Wang, Q.; Liu, Y.; Jiang, R. Per-capita carbon emissions in 147 countries: The effect of economic, energy, social, and trade structural changes. Sustain. Prod. Consum. 2021, 27, 1149–1164. [Google Scholar] [CrossRef]
- Yang, J.; Hao, Y.; Feng, C. A race between economic growth and carbon emissions: What play important roles towards global low-carbon development? Energy Econ. 2021, 100, 105327. [Google Scholar] [CrossRef]
- Li, G.; Wei, W. Financial development, openness, innovation, carbon emissions, and economic growth in China. Energy Econ. 2021, 97, 105194. [Google Scholar] [CrossRef]
- Hu, M.; Li, R.; You, W.; Liu, Y.; Lee, C.-C. Spatiotemporal evolution of decoupling and driving forces of CO2 emissions on economic growth along the Belt and Road. J. Clean. Prod. 2020, 277, 123272. [Google Scholar] [CrossRef]
- Nathaniel, S.P.; Alam, S.; Murshed, M.; Mahmood, H.; Ahmad, P. The roles of nuclear energy, renewable energy, and economic growth in the abatement of carbon dioxide emissions in the G7 countries. Environ. Sci. Pollut. Res. 2021, 28, 47957–47972. [Google Scholar] [CrossRef] [PubMed]
- Wang, Q.; Wang, S. A comparison of decomposition the decoupling carbon emissions from economic growth in transport sector of selected provinces in eastern, central and western China. J. Clean. Prod. 2019, 229, 570–581. [Google Scholar] [CrossRef]
- Wang, Q.; Li, L. The effects of population aging, life expectancy, unemployment rate, population density, per capita GDP, urbanization on per capita carbon emissions. Sustain. Prod. Consum. 2021, 28, 760–774. [Google Scholar] [CrossRef]
- Fankhauser, S.; Stern, N. Climate Change, Development, Poverty and Economics. In The State of Economics, the State of the World; Basu, K., Rosenblatt, D., Sepulveda, C., Eds.; MIT Press: Cambridge, MA, USA, 2017. [Google Scholar]
- Carbon Tracker 2013. Unburnable Carbon 2013; Wasted Capital and Stranded Assets: London, UK, 2013. [Google Scholar]
- Jakob, M. Feasible mitigation actions in developing countries. Nat. Clim. Change 2014, 4, 961–968. [Google Scholar] [CrossRef]
- Magrin, G. 2007 Climate Change 2007: Impacts, Adaptation and Vulnerability. In Contribution of Working Group II to the Fourth Assessment Report of the Intergovernmental Panel on Climate Change (IPCC); Parry, M., Canziani, O., Palutikof, J., Van Der Linden, P., Hanson, C., Eds.; Cambridge University Press: Cambridge, UK, 2007; pp. 581–615. Available online: https://www.ipcc.ch/site/assets/uploads/2018/03/ar4_wg2_full_report.pdf (accessed on 7 December 2022).
- McKinsey and Company. Pathways to a Low-Carbon Economy: Version 2 of the Global Greenhouse Abatement Cost Curve. 2009. Available online: http://mckinsey.com/client_service/sustainability/latest_thinking/pathways_to_a_low_carbon_economy (accessed on 23 October 2023).
- Olbrisch, S.; Haites, E.; Savage, M.; Dadhich, P.; Shrivastava, M.K. Estimates of incremental investment for and cost of mitigation measures in developing countries. Clim. Policy 2011, 11, 970–986. [Google Scholar] [CrossRef]
- Foxon, T.J.; Hammond, G.P.; Pearson, P.J. Developing transition pathways for a low carbon electricity system in the U.K. Technol. Forecast. Soc. Change 2010, 77, 1203–1213. [Google Scholar] [CrossRef]
- Blanford, G.J.; Kriegler, E.; Tavoni, M. Harmonization vs. fragmentation: Overview of climate policy scenarios in EMF27. Clim. Change 2014, 123, 383–396. [Google Scholar] [CrossRef]
- Kriegler, E.; Tavoni, M.; Riahi, K.; VAN Vuuren, D.P. Introducing the limits special issue. Clim. Change Econ. 2013, 4, 1302002. [Google Scholar] [CrossRef]
- Calvin, K.; Clarke, L.; Krey, V.; Blanford, G.; Jiang, K.; Kainuma, M.; Kriegler, E.; Luderer, G.; Shukla, P. The role of Asia in mitigating climate change: Results from the Asia modeling exercise. Energy Econ. 2012, 34, S251–S260. [Google Scholar] [CrossRef]
- Edenhofer, O.; Knopf, B.; Leimbach, M.; Bauer, N. ADAM’s Modeling Comparison Project—Intentions and Prospects. Energy J. 2010, 31, 7–10. [Google Scholar] [CrossRef]
- Foxon, T.J. A coevolutionary framework for analyzing a transition to a sustainable low carbon economy. Ecol. Econ. 2011, 70, 2258–2267. [Google Scholar] [CrossRef]
- Geels, F.W. Technological transitions as evolutionary reconfiguration processes: A multi-level perspective and a case-study. Res. Policy 2002, 31, 1257–1274. [Google Scholar] [CrossRef]
- Geels, F.W. Technological Transitions and System Innovations: A Coevolutionary and Socio-Technical Analysis; Edward Elgar: Cheltenham, UK, 2005. [Google Scholar]
- Geels, F.W. The multi-level perspective on sustainability transitions: Responses to seven criticisms. Environ. Innov. Soc. Transit. 2011, 1, 24–40. [Google Scholar] [CrossRef]
- La Viña, A.G.M.; Tan, J.M.; Guanzon, T.I.M.; Caleda, M.J.; Ang, L. Navigating a trilemma: Energy security, equity, and sustainability in the Philippines’ low carbon transition. Energy Res. Soc. Sci. 2018, 35, 37–47. [Google Scholar] [CrossRef]
- International Energy Agency. 2019. Available online: https://www.iea.org/cetp/ (accessed on 15 November 2023).
- Grin, J.; Rotmans, J.; Schot, J.; Geels, F.; Loorbach, D. Transitions to Sustainable Development: New Directions in the Study of Long-Term Transformative Change; Routledge: New York, NY, USA; Oxford, UK, 2010. [Google Scholar]
- Bayulgen, O. Localizing the energy transition: Town-level political and socio-economic drivers of clean energy in the United States. Energy Res. Soc. Sci. 2020, 62, 101376. [Google Scholar] [CrossRef]
- Bataille, C.; Waisman, H.; Colombier, M.; Segafredo, L.; Williams, J.; Jotzo, F. The need for national deep decarbonization pathways for effective climate policy. Clim. Policy 2016, 16, S7–S26. [Google Scholar] [CrossRef]
- Obama, B. The irreversible momentum of clean energy. Science 2017, 355, 126–129. [Google Scholar] [CrossRef] [PubMed]
- Wang, Q.; Su, M. Drivers of decoupling economic growth from carbon emission e an empirical analysis of 192 countries using decoupling model and decomposition method. Environ. Impact Assess. Rev. 2020, 81, 106356. [Google Scholar] [CrossRef]
- Le Quéré, C.; Korsbakken, J.I.; Wilson, C.; Tosun, J.; Andrew, R.; Andres, R.J.; Canadell, J.G.; Jordan, A.; Peters, G.P.; van Vuuren, D.P. Drivers of declining CO2 emissions in 18 developed economies. Nat. Clim. Change 2019, 9, 213–217. [Google Scholar] [CrossRef]
- Chu, S.; Cui, Y.; Liu, N. The path towards sustainable energy. Nat. Mater. 2017, 16, 16–22. [Google Scholar] [CrossRef] [PubMed]
- Mustafa, A.; Faisal, S.; Ahmed, I.A.; Munir, M.; Cipolatti, E.P.; Manoel, E.A.; Pastore, C.; di Bitonto, L.; Hanelt, D.; Nitbani, F.O.; et al. Has the time finally come for green oleochemicals and biodiesel production using large-scale enzyme technologies? Current status and new developments. Biotechnol. Adv. 2023, 69, 108275. [Google Scholar] [CrossRef]
- Gbadeyan, J.; Sibiya, L.; Linganiso, L.Z.; Deenadayalu, N. Waste-to-energy: The recycling and reuse of sugar industry waste for different value-added products such as bioenegy in selected countries–a critical review. Biofuels Bioprod. Biorefining 2024. early view. [Google Scholar] [CrossRef]
- Chu, S.; Majumdar, A. Opportunities and challenges for a sustainable energy future. Nature 2012, 488, 294–303. [Google Scholar] [CrossRef] [PubMed]
- IEA. Projected Costs of Generating Electricity, 2015th ed.; International Energy Agency: Paris, France, 2015. [Google Scholar]
- Jarbandhan, V.D.B.; Komendantova, N.; Xavier, R.; Nkoana, E. Transformation of the South African energy system: Towards participatory governance. In Systems Analysis Approach for Complex Global Challenges; Mensah, P., Katerere, D., Hachigonta, S., Roodt, A., Eds.; Springer International Publishing: Cham, Switzerland, 2018; pp. 139–158. [Google Scholar]
- Ruiz-Mercado, G.J.; Segovia-Hernández, J.G.; Castro-Montoya, A.J. Transformation towards sustainable bioenergy systems. Clean Technol. Environ. Policy 2018, 20, 1385. [Google Scholar] [CrossRef]
- Grubler, A.; Wilson, C.; Bento, N.; Boza-Kiss, B.; Krey, V.; McCollum, D.L.; Rao, N.D.; Riahi, K.; Rogelj, J.; De Stercke, S.; et al. A low energy demand scenario for meeting the 1.5 _C target and sustainable development goals without negative emission technologies. Nat. Energy 2018, 3, 515–527. [Google Scholar] [CrossRef]
- Sachs, J.; Tubiana, L.; Guerin, E.; Waisman, H.; Mas, C.; Colombier, M.; Schmidt-Traub, G.; Pathways to Deep Decarbonization. IDDRI/SDSN. 2014 Report. Available online: https://www.iddri.org/en/publications-and-events/report/pathways-deep-decarbonization-2014-report (accessed on 10 November 2023).
- Ribera, T.; Colombier, M.; Waisman, H.; Bataille, C.; Pierfederici, R.; Sachs, J.; Schmidt-Traub, G.; Williams, J.; Segafredo, L.; Hamburg Coplan, J.; et al. Pathways to Deep Decarbonization—2015 Report. IDDRI/SDSN. 2015. Available online: https://www.iddri.org/en/publications-and-events/report/pathways-deep-decarbonization-2015-synthesis-report (accessed on 10 November 2023).
- CCC. Power Sector Scenarios for the Fifth Carbon Budget; Committee on Climate Change: London, UK, 2015; Available online: https://documents.theccc.org.uk/wp-content/uploads/2015/10/Power-sector-scenarios-for-the-fifth-carbon-budget.pdf (accessed on 16 December 2023).
- Adewuyi, A.O.; Awodumi, O.B. Biomass energy consumption, economic growth and carbon emissions: Fresh evidence from West Africa using a simultaneous equation model. Energy 2017, 119, 453–471. [Google Scholar] [CrossRef]
- van Vuuren, D.P.; van Soest, H.; Riahi, K.; Clarke, L.; Krey, V.; Kriegler, E.; Rogelj, J.; Schaeffer, M.; Tavoni, M. Carbon budgets and energy transition pathways. Environ. Res. Lett. 2016, 11, 075002. [Google Scholar] [CrossRef]
- Deutch, J. Decoupling Economic Growth and Carbon Emissions. Joule 2017, 1, 3–5. [Google Scholar] [CrossRef]
- Wang, Z.; Yang, L. Delinking indicators on regional industry development and carbon emissions: Beijinge-Tianjine-Hebei economic band case. Ecol. Indicat. 2015, 48, 41–48. [Google Scholar] [CrossRef]
- Bashir, M.A.; Sheng, B.; Dogan, B.; Sarwar, S.; Shahzad, U. Export product diversification and energy efficiency: Empirical evidence from OECD countries. Struct. Change Econom. Dyn. 2020, 55, 232–243. [Google Scholar] [CrossRef]
- Lacey-Barnacle, M.; Bird, C. Intermediating energy justice? The role of intermediaries in the civic energy sector in a time of austerity. Appl. Energy 2018, 226, 71–81. [Google Scholar] [CrossRef]
- IEA. World Energy Outlook 2019; International Energy Agency: Paris, France, 2019. [Google Scholar]
- Stern, D.I.; Jotzo, F. How ambitious are China and India’s emissions intensity targets? Energy Policy 2010, 38, 6776–6783. [Google Scholar] [CrossRef]
- IEA (International Energy Agency). World Energy Outlook 2013; International Energy Agency: Paris, France, 2013. [Google Scholar]
- Doda, L.B. How to price carbon in good times… and bad! Wiley Interdiscip. Rev. Clim. Change 2016, 7, 135–144. [Google Scholar] [CrossRef]
- Allcott, H.; Greenstone, M. Is there an energy efficiency gap? J. Econ. Perspect. 2012, 26, 3–28. [Google Scholar] [CrossRef]
- Howells, M.I. The targeting of industrial energy audits for DSM planning. J. Energy S. Afr. 2006, 17, 58–65. [Google Scholar] [CrossRef]
- Hughes, A.; Howells, M.I.; Trikam, A.; Kenny, A.R.; Van Es, D. A study of demand side management potential in South African industries. Wood Wood Prod. 2006, 5, 8–18. [Google Scholar]
- IIASA. Global Energy Assessment—Toward a Sustainable Future; Cambridge University Press: Cambridge, UK, 2012. [Google Scholar]
- McNeil, M.A.; Iyer, M.; Meyers, S.; Letschert, V.E.; McMahon, J.E. Potential benefits from improved energy efficiency of key electrical products: The case of India. Energy Policy 2008, 36, 3467–3476. [Google Scholar] [CrossRef]
- Spalding-Fecher, R.; Clark, A.; Davis, M.; Simmonds, G. The economics of energy efficiency for the poor—A South African case study. Energy 2002, 27, 1099–1117. [Google Scholar] [CrossRef]
- Winkler, H.; Spalding-Fecher, R.; Tyani, L.; Matibe, K. Cost-benefit analysis of energy efficiency in urban low-cost housing. Dev. S. Afr. 2002, 19, 593–614. [Google Scholar] [CrossRef]
- Dimitropoulos, J. Energy productivity improvements and the rebound effect: An overview of the state of knowledge. Energy Policy 2007, 35, 6354–6363. [Google Scholar] [CrossRef]
- Raupach, M.R.; Marland, G.; Ciais, P.; Le Quéré, C.; Canadell, J.G.; Klepper, G.; Field, C.B. Global and regional drivers of accelerating CO2 emissions. Proc. Natl. Acad. Sci. USA 2007, 104, 10288–10293. [Google Scholar] [CrossRef] [PubMed]
- Ang, B.W. Is the energy intensity a less useful indicator than the carbon factor in the study of climate change? Energy Policy 1999, 27, 943–946. [Google Scholar] [CrossRef]
- Alcántara, V.; Padilla, E. Análisis de las emisiones de CO2 y sus factores explicativos en las diferentes áreas del mundo. Rev. Econ. Crítica 2005, 4, 17–37. [Google Scholar]
- Alcantara, V.; Duro, J.A. Inequality of energy intensities across OECD countries: A note. Energy Policy 2003, 32, 1257–1260. [Google Scholar] [CrossRef]
- Sun, J. The decrease in the difference of energy intensities between OECD countries from 1971 to 1998. Energy Policy 2002, 30, 631–635. [Google Scholar] [CrossRef]
- Hanif, I.; Gago-De-Santos, P. The importance of population control and macroeconomic stability to reducing environmental degradation: An empirical test of the environmental Kuznets curve for developing countries. Environ. Dev. 2017, 23, 1–9. [Google Scholar] [CrossRef]
- Pieloch-Babiarz, A.; Misztal, A.; Kowalska, M. An impact of macroeconomic stabilization on the sustainable development of manufacturing enterprises: The case of Central and Eastern European Countries. Environ. Dev. Sustain. 2021, 23, 8669–8698. [Google Scholar] [CrossRef]
- Sirimaneetham, V.; Temple, J.R. Macroeconomic Stability and the Distribution of Growth Rates. World Bank Econ. Rev. 2009, 23, 443–479. [Google Scholar] [CrossRef]
- Vo, A.T.; Van, L.T.-H.; Vo, D.H.; Mcaleer, M. Financial inclusion and macroeconomic stability in emerging and frontier markets. Ann. Financ. Econ. 2019, 14, 1950008. [Google Scholar] [CrossRef]
- Franke, R.; Westerhoff, F. Different compositions of aggregate sentiment and their impact on macroeconomic stability. Econ. Model. 2019, 76, 117–127. [Google Scholar] [CrossRef]
- De Mendonça, H.F.; Cunha Nascimento, N. Monetary policy efficiency and macroeconomic stability: Do financial openness and economic globalization matter? N. Am. J. Econ. Financ. 2020, 51, 100870. [Google Scholar] [CrossRef]
- Wójcik-Jurkiewicz, M.; Czarnecka, M.; Kinelski, G.; Sadowska, B.; Bilińska-Reformat, K. Determinants of Decarbonisation in the Transformation of the Energy Sector: The Case of Poland. Energies 2021, 14, 1217. [Google Scholar] [CrossRef]
- Udemba, E.N.; Güngör, H.; Bekun, F.V.; Kirikkaleli, D. Economic performance of India amidst high CO2 emissions. Sustain. Prod. Consum. 2021, 27, 52–60. [Google Scholar] [CrossRef]
- Månberger, A. Deep Decarbonization and Energy Security for Low-Carbon Societies. In Green Growth and Decarbonization of Energy Systems in a Changing World; Rocamora, A.R., Ishikawa, T., Eds.; Institute for Global Environmental Strategies (IGES): Hayama, Japan, 2018; pp. 14–16. [Google Scholar]
- Dahlström, H. Decarbonizing Development: 3 Steps to Decarbonizing Development for a Zero-Carbon Future; The World Bank: Washington, DC, USA, 2015. [Google Scholar]
- Afonso, A.; Blanco-Arana, C. Financial development and economic growth: A study for OECD countries in the context of crisis. In Proceedings of the MIRDEC-8th International Academic Conference on Social Sciences, Economics, Business and Finances Studies, Lisbon, Portugal, 29–31 May 2018. REMWorking Paper 046-2018. [Google Scholar]
- Wang, Q.; Jiang, R.; Zhan, L. Is decoupling economic growth from fuel consumption possible in developing countries?—A comparison of China and India. J. Clean. Prod. 2019, 229, 806–817. [Google Scholar] [CrossRef]
- Duffield, J.S. South Korea’s National Energy Plan Six Years On. Asian Politi-Policy 2014, 6, 433–454. [Google Scholar] [CrossRef]
- Choi, W.; Dobbs, R.; Suh, D.; Mischke, J.; Chon, E.; Cho, H.; Kim, H. Beyond Korean Style: Shaping a New Growth Formula. McKinsey & Company. 2013. Available online: http://www.mckinsey.com/insights/asia-pacific/beyond_korean_style (accessed on 4 September 2023).
- Park, D.; Shin, K. Performance of the Services Sector in Korea: An Empirical Investigation (Working Paper); Peterson Institute for International Economics: Washington, DC, USA, 2012; Available online: http://2005.www.iie.com/publications/wp/wp12-20.pdf (accessed on 6 September 2023).
- Adebayo, T.S.; Kirikkaleli, D. Impact of renewable energy consumption, globalization, and technological innovation on environmental degradation in Japan: Application of wavelet tools. Environ. Dev. Sustain. 2021, 23, 16057–16082. [Google Scholar] [CrossRef]
- Papadopoulou, C.-A.; Papadopoulou, M.P.; Laspidou, C.; Munaretto, S.; Brouwer, F. Towards a Low-Carbon Economy: A Nexus-Oriented Policy Coherence Analysis in Greece. Sustainability 2020, 12, 373. [Google Scholar] [CrossRef]
- Komarnicka, A.; Murawska, A. Comparison of Consumption and Renewable Sources of Energy in European Union Countries—617 Sectoral Indicators, Economic Conditions and Environmental Impacts. Energies 2021, 14, 3714. [Google Scholar] [CrossRef]
- Tvaronavičienė, M.; Prakapienė, D.; Garškaitė-Milvydienė, K.; Prakapas, R.; Nawrot, L. Energy Efficiency in the Long-Run in the Selected European Countries. Econ. Sociol. 2018, 11, 245–254. [Google Scholar] [CrossRef]
- Simionescu, M.; Bilan, Y.; Zawadzki, P.; Wojciechowski, A.; Rabe, M. GHG Emissions Mitigation in the European Union Based on Labor Market Changes. Energies 2021, 14, 465. [Google Scholar] [CrossRef]
- Streimikiene, D. Ranking of Baltic States on progress towards the main energy security goals of European energy union strategy. J. Int. Stud. 2020, 13, 24–37. [Google Scholar] [CrossRef]
- Vaillancourt, K.; Bahn, O.; Levasseur, A. The role of bioenergy in low-carbon energy transition scenarios: A case study for Quebec (Canada). Renew. Sustain. Energy Rev. 2019, 102, 24–34. [Google Scholar] [CrossRef]
- Searchinger, T.D.; Hamburg, S.P.; Melillo, J.; Chameides, W.; Havlik, P.; Kammen, D.M.; Likens, G.E.; Lubowski, R.N.; Obersteiner, M.; Oppenheimer, M.; et al. Fixing a Critical Climate Accounting Error. Science 2009, 326, 527–528. [Google Scholar] [CrossRef]
- Issah, M.; Antwi, S. Role of macroeconomic variables on firms’ performance: Evidence from the U.K. Cogent Econ. Financ. 2017, 5, 1405581. [Google Scholar] [CrossRef]
- Vo, H.D. Sustainable agriculture & energy in the U.S.: A link between ethanol production and the acreage for corn. Econ. Sociol. 2020, 13, 259–268. [Google Scholar]
- Stavytskyy, A.; Kharlamova, G.; Giedraitis, V.; Šumskis, V. Estimating the interrelation between energy security and macroeconomic factors in European countries. J. Int. Stud. 2018, 11, 217–238. [Google Scholar] [CrossRef]
- Norton, T.A.; Zacher, H.; Ashkanasy, N.M. Organisational sustainability policies and employee green behaviour: The mediating role of work climate perceptions. J. Environ. Psychol. 2014, 38, 49–54. [Google Scholar] [CrossRef]
- Maroušek, J.; Maroušková, A. Economic Considerations on Nutrient Utilization in Wastewater Management. Energies 2021, 14, 3468. [Google Scholar] [CrossRef]
- Byrne, R.; Ockwell, D. Low Carbon Development, Poverty Reduction and Innovation System Building. In Proceedings of the Globelics Seminar: Learning, Innovation and Low Carbon Development, Aalborg University, Copenhagen, Denmark, 4–5 April 2013. [Google Scholar]
- Byrne, R.; Smith, A.; Watson, J.; Ockwell, D. Energy Pathways in Low Carbon Development. In Low-Carbon Technology Transfer; Routledge: New York, NY, USA, 2012; pp. 123–142. [Google Scholar]
- Cherp, A.; Vinichenko, V.; Jewell, J.; Brutschin, E.; Sovacool, B. Integrating techno-economic, socio-technical and political perspectives on national energy transitions: A meta-theoretical framework. Energy Res. Soc. Sci. 2018, 37, 175–190. [Google Scholar] [CrossRef]
- European Commission. Available online: https://ec.europa.eu/energy/en/annual-citizens-energy-forums (accessed on 21 October 2018).
- Kaldellis, J.; Kapsali, M.; Kaldelli, E.; Katsanou, E. Comparing recent views of public attitude on wind energy, photovoltaic and small hydro applications. Renew. Energy 2012, 52, 197–208. [Google Scholar] [CrossRef]
- Bartiaux, F.; Vandeschrick, C.; Moezzi, M.; Frogneux, N. Energy justice, unequal access to affordable warmth, and capability deprivation: A quantitative analysis for Belgium. Appl. Energy 2018, 225, 1219–1233. [Google Scholar] [CrossRef]
- Willand, N.; Horne, R. “They are grinding us into the ground”—The lived experience of (in)energy justice amongst low-income older households. Appl. Energy 2018, 226, 61–70. [Google Scholar] [CrossRef]
- Broto, V.C.; Baptista, I.; Kirshner, J.; Smith, S.; Alves, S.N. Energy justice and sustainability transitions in Mozambique. Appl. Energy 2018, 228, 645–655. [Google Scholar] [CrossRef]
- Gielen, D. Perspectives for the Energy Transition. Investment Needs for a Low-Carbon Energy System; International Energy Agency: Paris, France, 2017. [Google Scholar]
- XNA (Xinhua News Agency). China-U.S. Joint Statement on Climate Change. 2014. Available online: http://news.xinhuanet.com/energy/2014-11/13/c_127204771.htm (accessed on 2 January 2024). (In Chinese).
- Li, X. 25—Sustainable island energy systems: A case study of Tilos Island, Greece. In Energy Communities; Löbbe, S., Sioshansi, F., Robinson, D., Eds.; Academic Press: Cambridge, MA, USA, 2022; pp. 435–448. [Google Scholar]
- NDRC (National Development and Reform Commission). Enhanced Actions on Climate Change: China’s Intended Nationally Determined Contributions. 2015. Available online: http://qhs.ndrc.gov.cn/gwdt/201507/t20150701_710233.html (accessed on 4 June 2023).
- Kaldellis, J.K.; Ant, G.; Kaldelli, E.; Kapsali, M. Investigating the Energy Autonomy of Very Small Non-Interconnected Islands A Case Study: Agathonisi, Greece. Energy Sustain. Dev. 2012, 16, 476–485. [Google Scholar] [CrossRef]
- NBSC (National Bureau of Statistics of China). China Statistical Yearbook 2015; China Statistics Press: Beijing, China, 2015. (In Chinese) [Google Scholar]
- CEC (China Electricity Council). Electricity Industry Situation of 2014; CEC China: Beijing, China, 2015; Available online: http://www.cec.org.cn/guihuayutongji/gongxufenxi/dianliyunxingjiankuang/2015-0202/133565.html (accessed on 22 July 2023). (In Chinese)
- NBSC (National Bureau of Statistics of China). China Statistical Yearbook 2011; China Statistics Press: Beijing, China, 2011. (In Chinese) [Google Scholar]
- Grubler, A.; Johansson, T.; Mundaca, L.; Nakicenovic, N.; Pachauri, S.; Riahi, K. Energy primer. In Global Energy Assessment: Toward a Sustainable Future; Johansson, T., Patwardhan, A., Nakicenovic, N., Gomez-Echeverri, L., Eds.; Cambridge University Press: Cambridge, UK, 2012; pp. 99–150. [Google Scholar]
- Kunchornrat, J.; Phdungsilp, A. Multi-Level Governance of Low-Carbon Energy Systems in Thailand. Energies 2012, 5, 531–544. [Google Scholar] [CrossRef]
- Wang, H.K.H. Climate Change and Clean Energy Management Challenges and Growth Strategies, 1st ed.; Routledge: London, UK, 2019; Volume 192, pp. 11–42. Available online: https://www.taylorfrancis.com/books/mono/10.4324/9781351050715/climatechange-clean-energy-management-henry-wang (accessed on 15 August 2023).
- Lenhart, S.; Fox, D. Structural Power in Sustainability Transitions: Case Studies of Energy Storage Integration Into Regional Transmission Organization Decision Processes. Front. Clim. 2021, 3, 749021. [Google Scholar] [CrossRef]
- Kaygusuz, K. Energy for sustainable development: A case of developing countries. Renew. Sustain. Energy Rev. 2012, 16, 1116–1126. [Google Scholar] [CrossRef]
- Dufour, F. The Costs and Implications of Our Demand for Energy: A Comparative and Comprehensive Analysis of the Available Energy Resources. 2018 ACADEMIA; Volume 88, pp. 245–252. Available online: https://www.academia.edu/36768579/ (accessed on 12 September 2023). [CrossRef]
- WB (World Bank). World Development Indicators; World Bank: Washington, DC, USA, 2014; Available online: http://data.worldbank.org/data-catalog/worlddevelopment-indicators/ (accessed on 2 September 2023).
- B.P. (British Petroleum). B.P. Statistical Review of World Energy. 2014. Available online: http://www.bp.com/statisticalreview (accessed on 12 September 2023).
- Liu, Q.; Chen, Y.; Tian, C.; Zheng, X.Q.; Li, J.F. Strategic deliberation on development of low-carbon energy system in China. Adv. Clim. Change Res. 2016, 7, 26–34. [Google Scholar] [CrossRef]
- Wang, C.; Chen, J.; Zou, J. Decomposition of energy-related CO2 emission in China: 1957–2000. Energy 2005, 30, 73–83. [Google Scholar] [CrossRef]
- Samaras, C.; Nuttall, W.J.; Bazilian, M. Energy and the military: Convergence of security, economic, and environmental decision-making. Energy Strat. Rev. 2019, 26, 100409. [Google Scholar] [CrossRef]
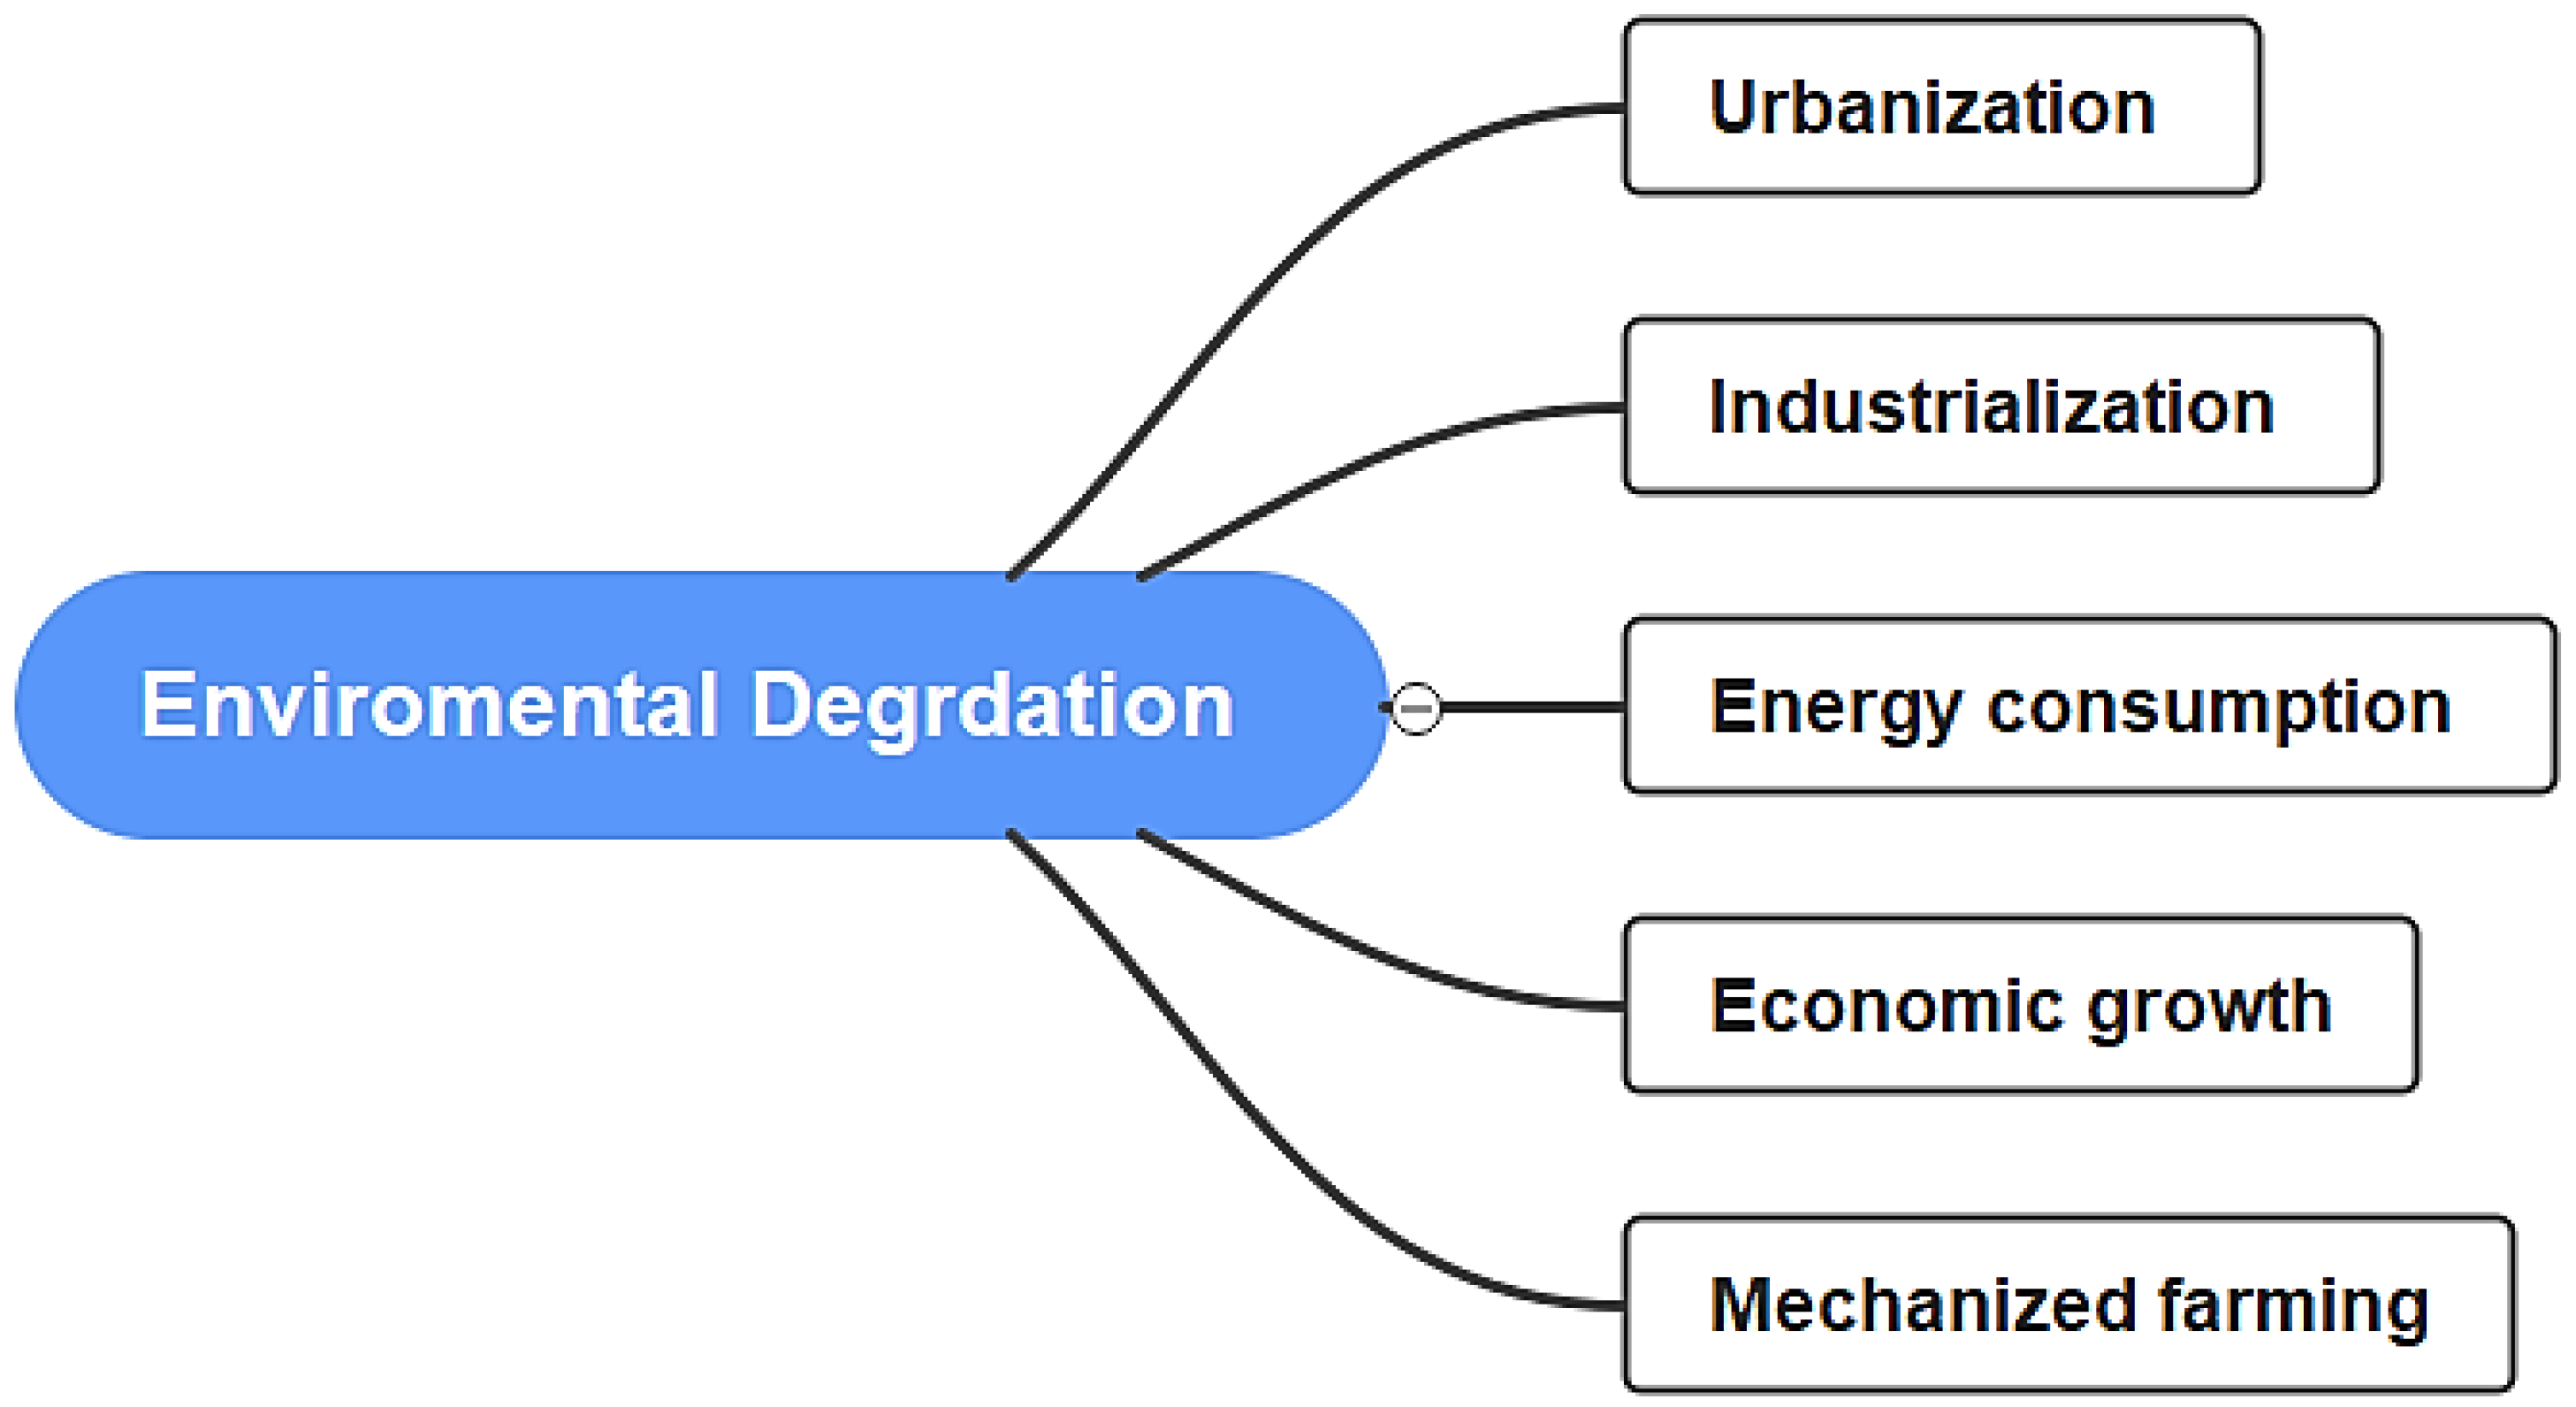

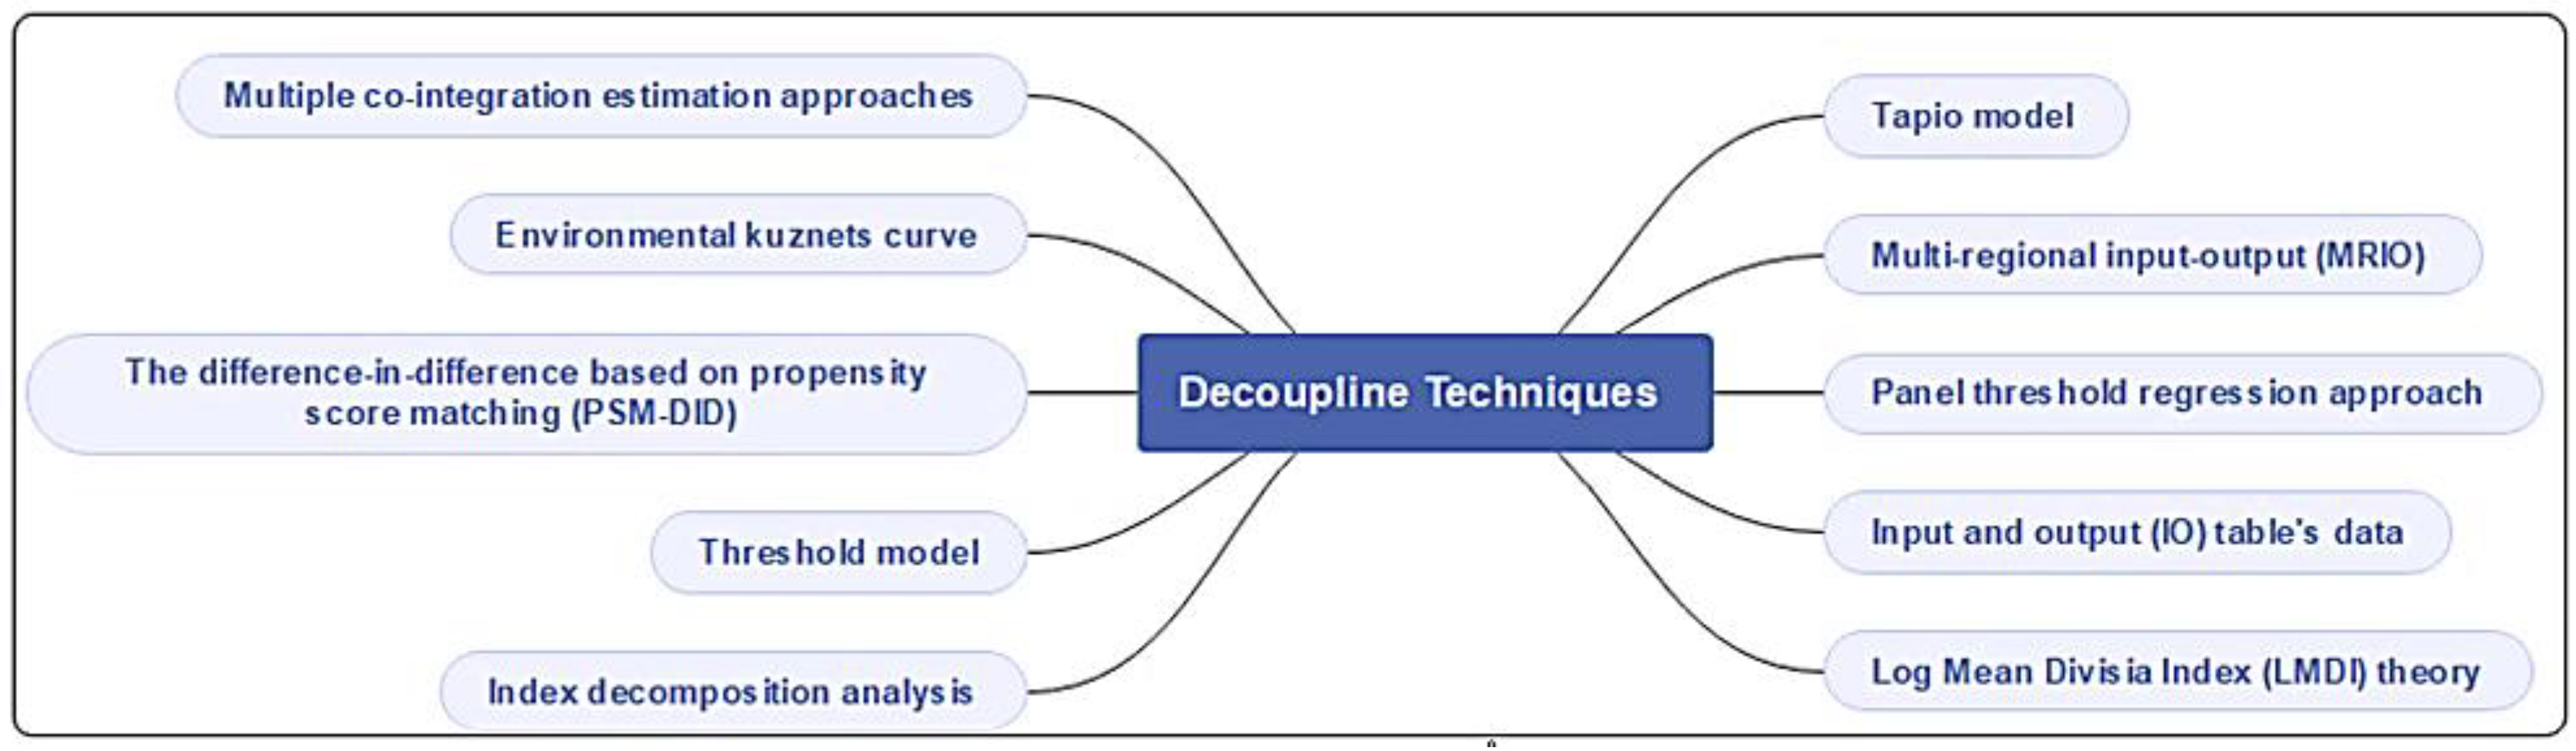
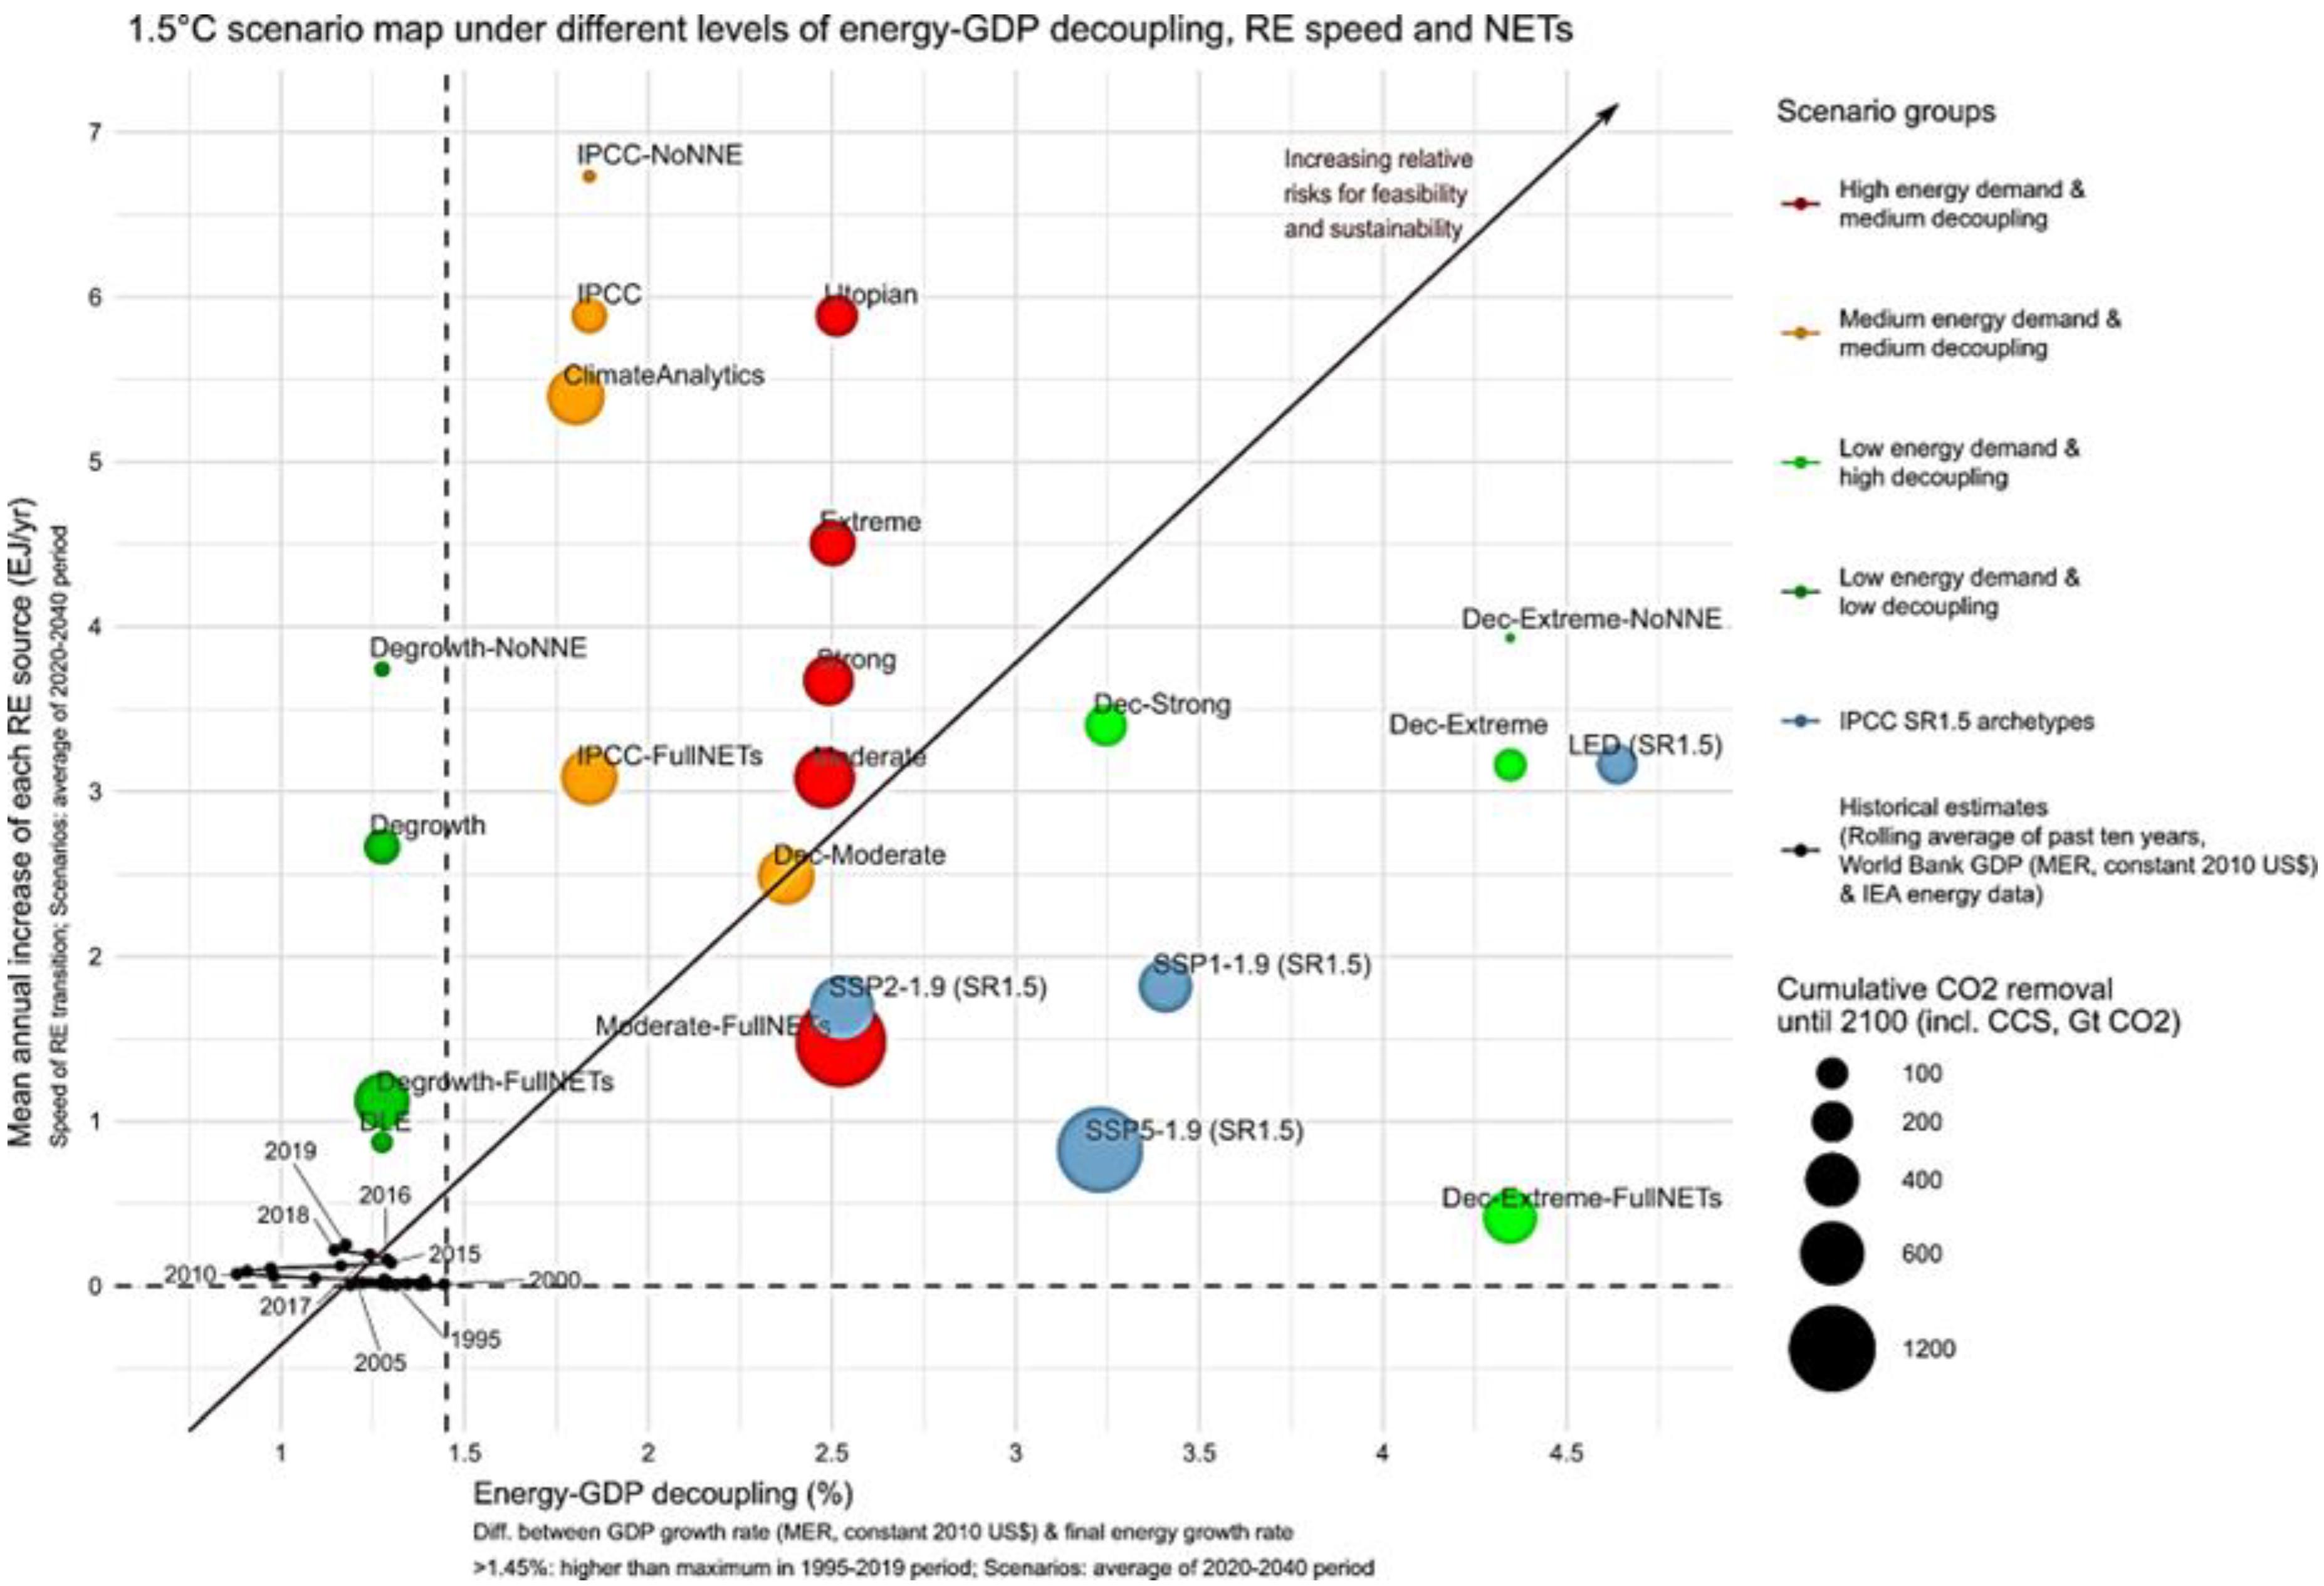
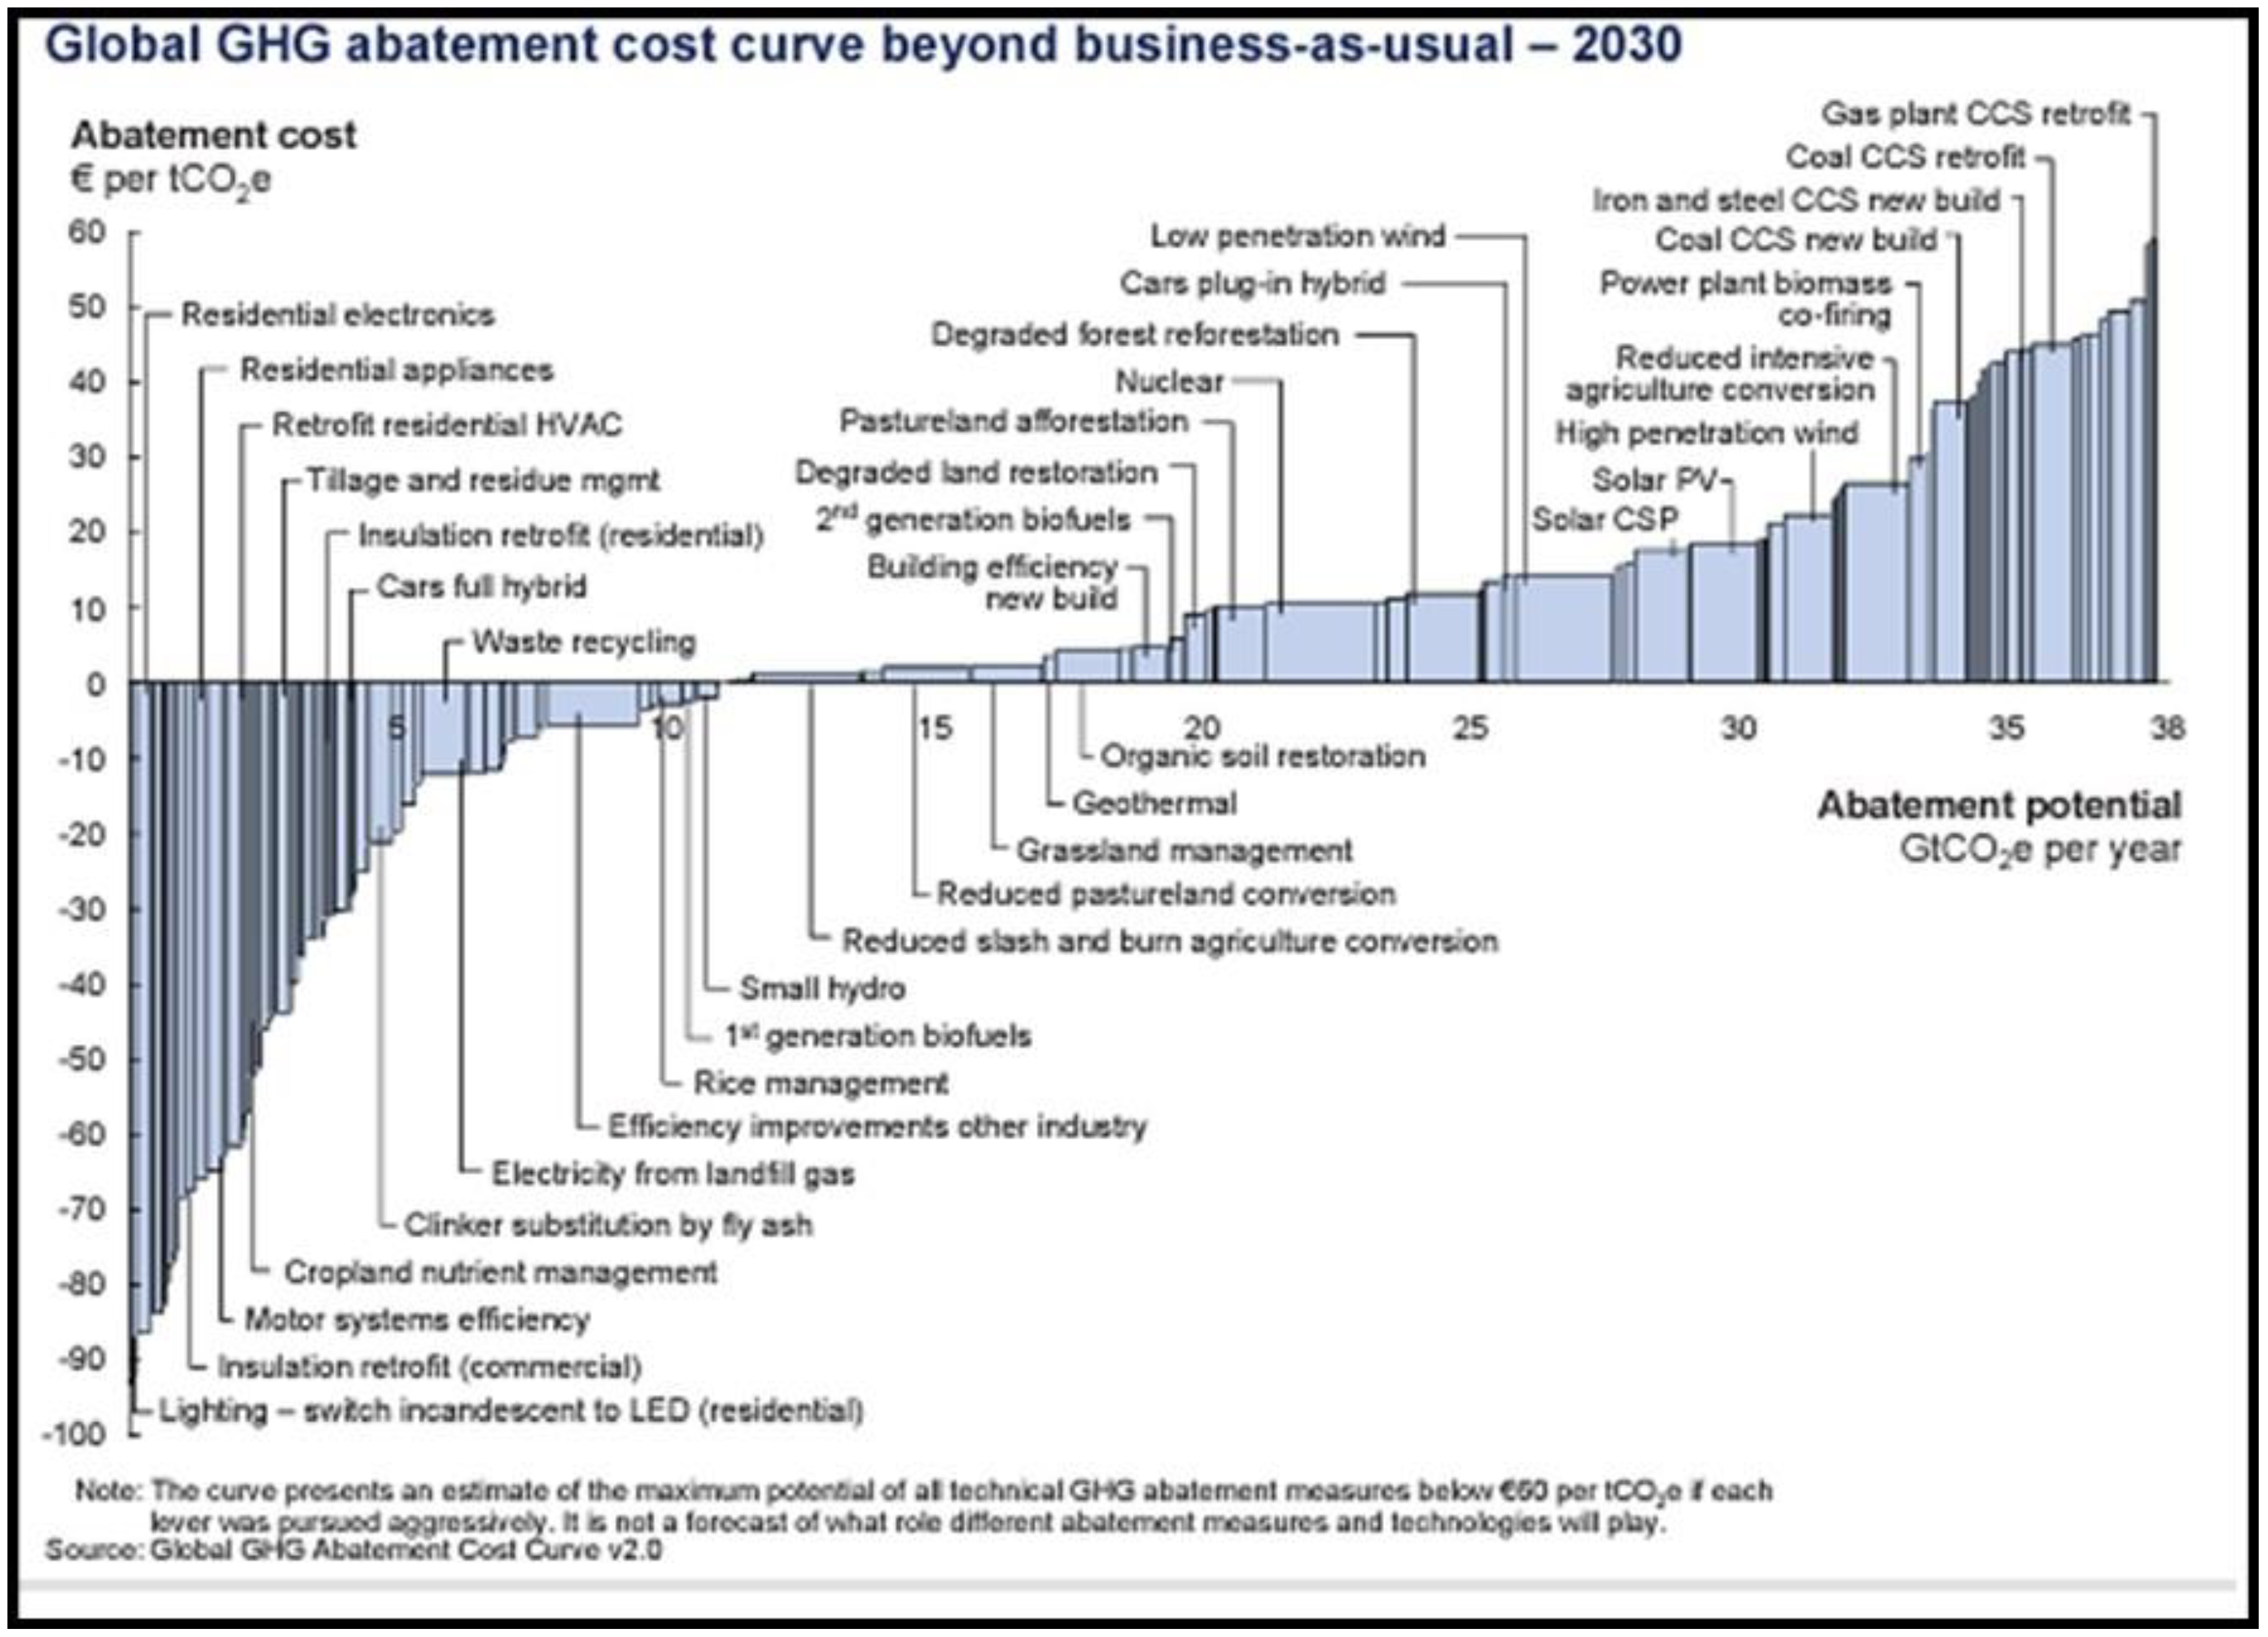
Disclaimer/Publisher’s Note: The statements, opinions and data contained in all publications are solely those of the individual author(s) and contributor(s) and not of MDPI and/or the editor(s). MDPI and/or the editor(s) disclaim responsibility for any injury to people or property resulting from any ideas, methods, instructions or products referred to in the content. |
© 2024 by the authors. Licensee MDPI, Basel, Switzerland. This article is an open access article distributed under the terms and conditions of the Creative Commons Attribution (CC BY) license (https://creativecommons.org/licenses/by/4.0/).