Abstract
To maintain the carbon dioxide concentration below the no-return threshold for climate change, we must consider the reduction in anthropic emissions coupled to carbon capture methods applied in synergy. In our recent papers, we proposed a green and reliable method for carbon mineralization using ascorbic acid aqueous solution as the reducing agent for carbon (IV) to carbon (III), thus obtaining oxalic acid exploiting green reagents. Oxalic acid is made to mineralize as calcium (as the model cation) oxalate. Oxalates are solid-state reservoirs suitable for long-term carbon storage or carbon feedstock for manufacturing applications. The carbon mineralization reaction is a double-step process (carbon reduction and oxalate precipitation), and the carbon capture efficiency is invariably represented by a double-slope curve we formerly explained as a decrease in the reducing effectiveness of ascorbic acid during reaction. In the present paper, we demonstrated that the reaction proceeds via a “pure CO2-capture” stage in which ascorbic acid oxidizes into dehydroascorbic acid and carbon (IV) reduces to carbon (III) and a “mixed” stage in which the redox reaction competes with the degradation of ascorbic acid in producing oxalic acid. Despite the irreversibility of the reduction reaction, that was demonstrated in abiotic conditions, the analysis of costs according to the market price of the reagents endorses the application of the method.
1. Introduction
The concentration of CO2 in the atmosphere is escalating due to anthropic contributions overlapping with natural outputs, and the trend will not be inverted in the near future. Recently, the IPCC Climate Change 2022 report [1] suggested, among others, carbon mineralization (carbonation in the conventional meaning) as a reliable method for permanent carbon sequestration into solids with foreseeable applications. Carbonation as a CO2 disposal method exploiting exothermic silicate-weathering reactions has been proposed as a potential alternative method to classical geological storage since the 1990s, originally considering wollastonite (CaSiO3) as the natural calcium source material [2]. From that point on, many papers have been published, proposing carbonation reactions inspired by the natural weathering of alkaline rocks and naturally occurring at the interface with air or circulating fluids [3,4]. As forecast by Seifritz in 1990, even if spontaneous, the natural weathering process is extremely slow, and the kinetics should be accelerated to apply it to industrial purposes [4,5,6,7,8,9,10,11,12,13,14,15,16,17,18,19,20,21,22,23,24,25,26,27]. The possibility of capturing and converting CO2 into target products is a major part of the chemical literature, focusing on the catalytic and photoelectrochemical reduction of CO2 to produce organic compounds, such as liquid fuels (methanol and dimethylether, formic acid or oxalic acid [28,29,30,31,32,33,34,35,36,37,38,39,40,41]). Transition metal complexes have been proposed for CO2 reduction since the late 1960s [35,36,37,38], with waste disposal and energy consumption representing their main disadvantages. In general, photo-electrochemical and catalytical reduction of CO2 techniques are associated with a significant energy drawback [38]. In this context, the reduction of CO2 to form oxalate has been accomplished by electrochemical reactions involving transition (Hg, Pb, Cu, Pd, Ag) metal complexes or anion radicals of aromatic hydrocarbons, esters, and nitriles [28,38,42,43]. Transition metal complexes and hydroxides may also be applied to convert carbon dioxide into carbonates [44,45]. Glycol–amine mixtures and polyamine coordination complexes have been reported to bind CO2 reversibly through the formation of carbamates [46,47,48,49,50,51,52,53,54]. To the best of our knowledge, only a few authors have proposed CO2 reduction in C2O42− to precipitate directly oxalate, always resorting to organometallic complexes or metal–sulfide clusters [42,43].
1.1. The Non-Conventional Mineralization Reaction of Carbon Dioxide into Oxalates
Within this framework, we proposed [55,56,57] a non-conventional carbon mineralization reaction based on the green reduction of C(IV) to C(III) using ascorbic acid (H2A) in an aqueous solution as the electron donor (irreversibly oxidized). CO2 is converted into C2O42−, giving rise to the equilibria of H2C2O4 in water (Equation (1)).
2CO2 + H2A → DHA + H2C2O4
The reaction can be described by means of two apparently simple sub-reactions (Equations (2) and (3)).
2CO2 + 2e− + 2H+ → H2C2O4
H2A → DHA + 2H+ + 2e−
Equation (2) describes the reduction of C(IV) to C(III) by means of the ascorbic acid acting as the electron donor: from two molecules of CO2, a molecule of oxalic acid is spontaneously obtained. Equation (3) describes the oxidation reaction of ascorbic acid into dehydroascorbic acid.
In the presence of calcium as the model cation, both in stoichiometric and non-stoichiometric ratios (Ca2+/H2A < 1), along with an initial pH always equal to or lower than 5.5, oxalate anions precipitate into crystalline calcium oxalate, mainly dihydrate (COD, mineral weddellite), while some calcium oxalate monohydrate (COM, mineral whewellite) is found as the only byproduct of the reaction [57]. This behavior is chemically described by Equation (4) whilst the mineralogy of crystalline products was investigated by XRPD.
2CO2 + Ca[HA]2 → 2HA− + CaC2O4
As demonstrated in our previous papers [55,57], the reaction’s performance ranges between 6 and 82% of carbon dioxide removed from the atmosphere, depending on the experimental setup, while it is constant and stable for each reactor setup. We carefully addressed this point in our previous works, showing that the larger the reaction surface, the better the yield, reaching a remarkable value of 82% with a fine-divided (sprayed) solution immersed into pure CO2 atmosphere. We also provided a model for predicting yield increase as a function of the increase in the area-to-volume ratio of gas solution [57] which was consistent with the experimental yield data published subsequently [55].
The products of the degradation of ascorbic acid were analyzed to ensure that the reaction does not produce any harmful substances [57]. It was demonstrated [57,58] that the byproducts follow the sequence: dehydroascorbic acid → diketogulonic acid → 2,3,4 trihydroxybutanoic acid + oxalic acid. The first product represents the early step of H2A degradation, and the second an intermediate product, while the last ones are both common metabolites in plants. To the best of our knowledge, safety concerns are not an issue with any of the molecules produced.
As reported in our previous papers and summarized in Figure 1, the experimental curves recorded from the simplest experimental setup (B-setup in Figure S1 in Supplementary materials) show a common trend with a double slope in the CO2 capture rate [55,57]. We preliminarily related this trend to the progress of the redox reaction and, accordingly, to the concentration of the oxalic acid produced by the C(IV) to C(III) reaction. The steep slope at the beginning of the experiment was correlated with the highest reducing power of the fresh H2A solution, corresponding to the first peak in calcium oxalate supersaturation and, consequently, to the highest nucleation frequency for COD (and, eventually, COM as a crystalline byproduct). Then, along with H2A degradation, the carbon capture efficiency slope decreased along with the C(IV) to C(III) reduction rate.
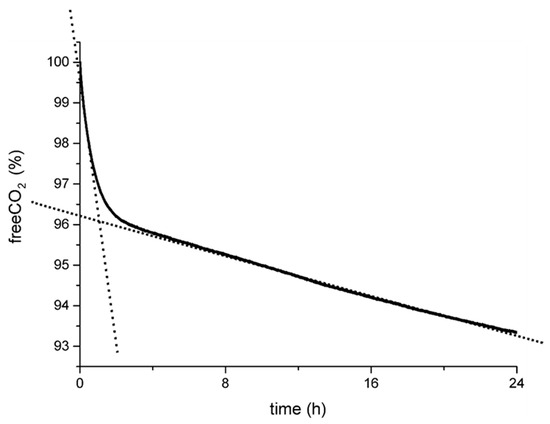
Figure 1.
General trend in the carbon capture curves as determined during capture experiments (B-setup, Figure S1 in the Supplementary Materials). The double slope was roughly associated with the kinetics of the redox reaction, i.e., fast at the initial stages when H2A-reducing power was high and then slowed down by the degradation of H2A [55,57].
The weddellite crystals obtained are stable crystalline pools for carbon dioxide long-term storage. We characterized their structure and thermal stability, expecting their potential reuse as feedstocks [56,57]. In fact, weddellite is a carbon feedstock for retrieval and reprocessing in industry (food and beverages, for instance) but can also be applied for metal recovery [59], biomedical applications [60,61,62], pre- and post-harvesting of farming soils [63,64,65,66,67,68,69,70], ceramics, chemicals, and pharmaceutics. Albeit beyond our scientific purposes, the economical sustainability of the capture reaction was positively assessed by estimating the main operational outlays (ascorbic acid supply) versus revenues from the sale of the calcium oxalate produced, with both referred to as technical-grade quality chemicals (Figure S2). In so doing, we concluded that a positive income per CO2-kg stored into Ca-oxalate in a pilot plant is achievable, even more so when considering no toxic waste discharge costs.
1.2. The Spontaneousness of the Reaction and Oxidation of H2A
It must be emphasized that, even if the topic is exceptionally important for biomedical research because of the powerful antioxidant and free radical scavenger properties of H2A, an exhaustive definition of the reactive pathway of H2A has not yet been described in the literature. The simplified reaction as found in most articles can be written as reported in Equation (3).
Some important contributions to the comprehension of the complex reaction mechanisms of H2A have been published in recent times. The simplified reaction must be compared to the complex deprotonation and oxidation sequence of reactions as reported in some papers and summarized in Table S1 and Figure S3 in Supplementary materials [71,72,73,74].
According to Tu and Njus [73,74], H2A can lose two electrons in two successive steps: a first oxidation step forming an intermediate radical product (HA•) at the equilibrium with the ascorbate radical A−• [73,74,75,76,77,78,79,80], and a second oxidation step that produces the completely oxidated dehydroascorbic acid (DHA). DHA in water, as usually represented in the literature, is energetically unstable because of its tricarbonyl structure (it can exist only in aprotic non-aqueous solvents) and reacts with water, keeping the γ-lactone ring of ascorbic acid or forming bicyclic hydrated forms. The free energies of the many configurations calculated ab initio differ slightly [74], the most stable being a bicyclic conformer (as demonstrated by NMR data [72]), proving that in aqueous media, hydration and cyclization of the fully oxidized dehydroascorbic acid are energetically favored. In comparison, hydration and cyclization of the ascorbate radical A−• are not energetically favored. Eventually, complete oxidation can occur in a single step without intermediate products by disproportionation of two A−• radicals into one ascorbate (HA−) and one dehydroascorbate (DHA4). The vitamin C redox system is extremely unstable and, in the presence of strongly oxidizing agents, oxidation may continue beyond the DHA formation, giving birth to biologically useless products and inactive compounds (the “degradation cascade” of H2A). The rate of oxidation and the nature of the reaction’s products is pH- and ionic force-dependent [73,74,81,82,83,84]. The last product of oxidation, DHA, has a pKa ~8 [85] and its E0 has been evaluated to be about −0.2 V, depending on the authors (−0.14 V [86]; −0.174 V [80]; −0.21 V [75]).
There is a general agreement in describing the further stages of the degradation of the DHA. The irreversible delactonization of the γ-lactone ring of ascorbic acid leads to 2,3-diketogulonic acid (DKGA) [84,87,88,89,90,91]. DKGA is considered the earliest waste product of the H2A degradation chain since it has no specific function in biological systems. Starting from DKGA and following its fate, the molecule continues degrading through a multiple-step process that originates several reaction products depending on the path (oxidative or non-oxidative) and the presence of enzymes [89]. In fully abiotic conditions, the decay rate of DHA depends on the pH and temperature of the solution. Still, it is not affected by the presence of oxygen, stressing that the central reaction in DHA degradation is hydration and cyclization [72,74,87]. On the contrary, oxygen enhances the oxidation of H2A. L-lisonic acid, L-xylonic acid, and L-threonic acid are some inactive products of the degradation of DKGA, but some other products are still unknown [92].
Koshiishi [93] demonstrated the participation of a CO2–H2CO3–NaHCO3 buffer in the hydrolysis of DHA in plasma and bicarbonate-containing cell culture media (Dulbecco’s modified Eagle’s medium). From the literature, the final product of the H2A to DHA degradation path is always oxalic acid.
The presence of oxalic acid at the end of the degradation path of H2A/DHA casts shadows on the trustworthiness of the carbon capture method proposed. However, experimental data presented in our early papers [55,57] factually comply with the hypothesis of an efficient carbon capture effect.
The redox potential of H2A is evaluated in the literature considering its physiological action and, generally, for the simplified reaction reported in Equation (3).
Borsook and Keighley [81] assessed this value at variable pH (ranging between 2.04 and 5.75) and H2A/DHA activity ratios. The experiments were performed at 35.5 °C because of the biochemical importance of vitamin C, and the oxidation of H2A was obtained using iodine. At pH values higher than 5.75, the rate of decomposition of DHA was too high for reliable measurements. Thus, the redox potential values at basic pH were extrapolated from the experimental data fitting. From this early paper, the figures of formal redox potential (embedding the activities of the species, the equilibrium constants of the reactions, and with pH values other than zero) for DHA|H2A range from −0.283 V (pH = 2) to −0.006 V (pH = 7), thus demonstrating once more the strong dependence of the redox potential on the pH and proton availability, accordingly. The redox mechanism is claimed to be represented by electron transfer followed by a rapid chemical step. The oxidized form (DHA) is known to decompose quickly [81].
Many other authors described the reaction mechanisms of ascorbic acid and their dependence on the proton availability by performing cyclic voltammetry measurements using variously finished electrodes. To cite some, in 1982, Falat and Cheng evaluated the formal redox potential of vitamin C at 0.1494 V at pH = 7.4 using an electrochemically treated graphite/epoxy electrode [94], while in 1985, Hu and coworkers determined a formal potential of 0.824 V at pH = 2 using glassy carbon electrodes [95]. A few years later, Wring and its team evaluated a formal potential of 0.594 V at pH = 5.0 using a graphite– epoxy composite electrode chemically modified with cobalt phthalocyanine [96] and, in 2006, Ren published a value of 0.299 V at a pH of 7.4 [97], measured using a glassy carbon electrode modified with caffeic acid. A recent paper by Lovander and coworkers [98] reported the values of the electrochemical properties of some water-soluble and fat-soluble vitamins at physiological pH. In this paper, the vitamin C redox potential evaluated at pH = 7.4 is set at 0.39 V (H2A|DHA).
Matsui et al. [99] published the standard redox potential of vitamin C and other biologically critical molecules calculated considering a linear dependence between the experimental pKa values and the theoretical Gibbs energy differences in their deprotonation reactions. Both L-H2A and DHA’s calculated redox potentials range between 0.40 V and 0.55 V, in good agreement with many experimental results.
The variability in the redox potential values reported in the literature referring to the simplified Equation (2) is possibly related to the oversimplification of the reactive system and calls for an accurate characterization with reference to the application.
1.3. Aims of the Present Work
The performance of the carbon capture reaction via H2A was thoroughly examined [55,57] in our previously published papers, and even more work is addressed on the optimization of the setup to move from the laboratory to the application. Still, some points need an explanation for a full grasp of the underlying chemical mechanism. In such a view, the aim of the present investigation is threefold:
- The spontaneousness of the reaction in the abiotic conditions we applied (no enzymes, no biologically induced oxidative stress) remains a key point to be reasserted to assure the scaling-up of the reaction and its transferability to anthropic CO2 emitters;
- An unquestionable confirmation of the fact that calcium oxalate is built by carbon from the atmosphere is pivotal, so as to rule out any possibility that CaC2O4 may form from oxalic acid originated by the degradation of ascorbic acid;
- The meaning of the carbon capture efficiency curve, and especially of the double slope shown in Figure 1, must be explained to elucidate the process mechanisms and make the system either scalable-up to the CO2 anthropic emitters, or tunable as a function of the required Ca-oxalate crystal properties.
2. Materials and Methods
2.1. Carbon Capture Experiments
All the tests have been performed on the B-setup as described in our previous papers [55,57]. The B-setup, even if less efficient than other designs tested, such as BD or SPRAY (for details about the experimental geometries, please refer to our previous work), is the most reliable in variable control and carbon capture effectiveness evaluation. A scheme of the B-setup is reported in Figure S1 in Supplementary Materials.
Carbon capture was operated in a thermostatic reactor at 20 °C using a 1 M stoichiometric calcium ascorbate (Ca[HA]2) solution prepared under an inert atmosphere, if not otherwise stated, using reagent-grade ascorbic acid (Merck Group, Darmstadt, Germany) by adding 150 mL of ultrapure vacuum-degassed water (18 MΩ water ultra-purification system with resistivity measure device, Maina SrL, Torino, Italy) and carefully mixing until a clear solution was obtained. In the meanwhile, a suspension of Ca(OH)2 was prepared by thoroughly mixing under an inert atmosphere Ca(OH)2 powder (Merck Group, Darmstadt, Germany) with 50 mL of ultrapure and vacuum-degassed water. The suspension was added dropwise to the H2A solution to rein in the degradation of the ascorbic acid induced by the sudden pH increase. Before the capture experiment started, the Ca[HA]2 solution was mixed for 30 min under an inert Ar atmosphere to ensure the complete dissolution of Ca(OH)2. The pH of the stoichiometric solution was slightly acidic (5.5), assuring no base-related carbon capture.
Pure CO2 (Sapio Srl, Milano, Italy) was bubbled into the sealed B-reactor three times at 150 mL/min to wash it from Ar, then the reactor was loaded (150 mL/min) with carbon dioxide at a fixed pressure setpoint slightly higher than the room pressure (1.042 bar) to avoid the accidental air loading by the reaction vessel. The reaction was then left to proceed. Flow rate and pressure setpoint were controlled using an EL-FLOW valve coupled to an EL-PRESS pressure meter (Bronkhorst High-Tech B.V., Ruulo, The Netherlands). The pressure drop induced by CO2 consumption by mineralization was continuously measured using the pressure meter during the whole reaction time.
Operating conditions of temperature and pressure were kept constant for the B-setup unless otherwise stated.
2.2. Characterization of the Precipitates
XRPD characterization was carried out using a Rigaku (Rigaku Corporation, Tokyo, Japan) MiniFlex 600 benchtop X-ray diffractometer (Bragg–Brentano geometry; CuKα radiation and an X-ray source operating at 40 kV and 15 mA; D/teX Ultra2 silicon strip detector; 2° < 2θ < 50°, step width 0.005°, and scan speed 0.3°/min). XRPD patterns were qualitatively evaluated using the EVA software (Bruker, Siemens, Germany) and the free software Profex v. 5.2.8 [100] to confirm the nature of the reaction’s products.
Selected samples were imaged using a Tescan VEGA (TESCAN Brno s.r.o., Brno, Czech Republic) scanning electron microscope (W filament, 15 keV, and 10 pA working conditions).
2.3. Evaluation of the Redox Potential of Ascorbic Acid in Abiotic Conditions
As revealed by the erraticism of data from the literature, the redox potential of a reaction can be affected by several parameters, such as the nature of the solvent, the ionic strength of the solution, the speciation in the solution, the pH and processes involved, and the evaluation technique and equipment. Moreover, due to the complex sequence of deprotonation and oxidation reactions described in Section 1.2, an averaged measure is likely to allow us to state the spontaneousness of the reaction. E0 data collected under physiological or biological-like conditions cannot be a steady point in our abiotic experiments. The boundary conditions are utterly different from those of the traditional biochemical applications of H2A and DHA. Nevertheless, it was indispensable to our purposes to define a value of the redox potential of H2A in our experimental conditions to solve any doubt about the effectiveness of the vitamin C in reducing carbon dioxide to mineralize it in stable oxalates, the reduction potential for carbon dioxide to produce oxalic acid being reported in the literature [101] as 0.47 V.
As a first rough step, we indirectly evaluated the redox potential of a solution of ascorbic acid 1 M, hypothesizing the simplified Equation (2) as occurring in our system.
Then, we considered Equation (5) reported as the reference reaction, forcing the hypothesis of both electrons exchanged at the same time, as follows:
where Men+ is a metal with a well-known and tabulated redox potential [101].
Men+ + 2e− → Me(n−2)+
For this indirect evaluation of the redox potential in the experimental conditions of our CO2 capture system, we tested the reaction of a 1 M H2A solution prepared using ultrapure water (18 MΩ) on an inventory of chemicals starting from a list (Table S2 in the Supplementary Materials) of well-established redox potentials to determine the oxidation potential of ascorbic acid experimentally in our abiotic conditions.
H2A can be oxidized by transition metals via two different mechanisms: (i) inner sphere electron transfer and (ii) outer sphere electron transfer. Both mechanisms can occur, but the first oxidation step invariably involves the formation of the ascorbate radical [71]. Nitrates, sulfates, and phosphates were avoided because of the variable oxidation state of nitrogen, sulfur, and phosphorous, respectively, which may result in competition over the reduction power of H2A. Details of the reactions applied are reported in Table S2.
The reactions were performed in 10 mL polycarbonate tubes filled with solution, leaving no headspace to ensure no oxygen participated in the reaction, and then sealed. The sealed tubes were left to react from a few minutes to a week to ensure a satisfactory reaction time for the slowest reduction processes.
At the end of the reaction, the resulting solid fraction was measured by XRPD to check the presence of crystalline phases of the reduced species.
2.4. Cyclic Voltammetry (CV)
CV measurements were performed at different scan rates to investigate the electrochemical processes which can occur at the electrode surface to better evaluate the onset of the oxidation of H2A under inorganic conditions. Cyclic voltammetry experiments were carried out with a standard electrochemical setup, comprising a computer-controlled potentiostat, Autolab PGSTAT12 (Metrohm, Herisau, Switzerland). The electrochemical cell was a conventional three-electrode cell equipped with a 5 mm diameter glassy carbon disc (working electrode), glassy carbon rod (counter electrode), and an Ag/AgCl/KCl 3 M (reference electrode). The electrolyte was a 1.0 M HA, 0.30 M CaCl2 solution at pH 4.2. Measurements were performed at room temperature and pressure at an aging time ranging from 0 to 26 h, in a CO2 atmosphere, with continuous CO2 flow of 50 mL min−1 at scan rates of 50, 100, and 200 mV s−1.
2.5. Liquid Chromatography (LC) Coupled to Tandem Mass Spectrometry Detection of H2A and DHA
LC measurements have been performed on a 1 M solution of H2A to avoid calcium, which hinders the measurements. For this reason, the results of the analysis are not perfectly aligned with those of the mineralization reaction and should be considered as a general line of interpretation of the degradation of the ascorbate. The first run was performed on H2A reacted with CO2 in the B-setup reactor and exposed to the air only immediately before the measurement. The second run was performed on H2A reacted with CO2 in the B-setup reactor and protected from the air during the whole experiment. In both cases, the carbon capture performance of the solution was verified and confirmed the data that we had previously published [55].
Here, 2-furfural (1 mg/mL) in MeOH was used as the internal standard (ISTD). H2A and DHA stock solutions (1 mg/mL) diluted in disodium EDTA 0.05% (w/v) were used to evaluate the degradation rates of the samples. Samples were diluted 1/10,000 in formic acid (0.2%) and 1/2 in disodium EDTA (0.05%). The calibration curve was obtained for H2A and DHA 2, 5, 10, 20 ppm and internal standard 10 ppm.
The chromatographic separation was achieved using an Accela System (Thermo Fisher Scientific, Waltham, MA, USA) and using a Luna-C18 column (150 mm × 2.1 mm; 3 μm from Phenomenex, Torrance, CA, USA). Furthermore, 0.1% formic acid (A) and methanol (B) were used as the mobile phase. Gradient elution was programmed as follows: 3 min isocratic elution at 100%, linear decrease up to 30% in 8 min, and isocratic for 1 min. The total run time, including re-conditioning, was 17 min. Detection was obtained by the SRM method on an LCQ Fleet (Thermo Fisher Scientific, Waltham, MA, USA), equipped with the electrospray source operating in positive mode.
For quantification, the calibration curve was built by plotting the area of the analyte’s peak divided by the area of the internal standard (furfural) peak towards H2A and DHA concentrations (Figure S4 in Supplementary materials). The limit of detection (LOD) was calculated as (3 × SD)/m, and the limit of quantification (LOQ) was calculated as (10 × SD)/m, where SD is the standard deviation of the instrumental response and m is the slope of the calibration curve.
2.6. Carbon and Oxygen Isotopes Fractioning during Carbon Capture
The carbon and oxygen isotopic ratio of the CO2 from the canister and the H2A reagent were measured to be used as internal standards. The CO2 from the canister was sampled and cryo-purified using a mix of alcohol and liquid nitrogen (T = −70 °C) before measuring, while carbon from H2A was extracted by burning the reagent-grade H2A used during carbon capture experiments in a sealed, free-from-air glass capsule at 620 °C. The values of d13C and d18O for the reagents are reported in Table S3.
The isotopic composition of the carbon dioxide dissolved in Ca[HA]2 solution was obtained by modifying a protocol for solid-state carbonate isotopic analysis [102]: a 1 M Ca[HA]2 solution was prepared for the B-setup experiment under an inert Ar atmosphere, as described in Section 2.1, to avoid air contamination. Carbon and oxygen were extracted by acidifying the Ca[HA]2 solution with pure phosphoric acid (title ≥ 98%). The reaction continued for 12 h at a fixed temperature of 25 °C. The CO2 produced by the reaction was extracted and cryo-purified using liquid nitrogen (T = 196 °C) in a vacuum line. Finally, the gas was fed to the spectrometer.
The isotopic composition of the calcium oxalates precipitated during the reaction was obtained by following the same protocol for solid-state carbonate isotopic analysis: the solid sample was ground and homogenized, then directly acidified at room temperature using pure phosphoric acid and extracted in a vacuum line.
d13C and d18O ratios were measured by mass spectrometry IRMS (Finnigan MAT250, Thermo Fisher Scientific, Waltham, MA, USA). The internal laboratory standard is a Carrara marble sample (M43) calibrated over the international Pee Dee Belemnite (PDB) standard. The measurement uncertainty is ±0.2 d‰.
We performed a provisional set of B-setup trials using degassed water to prepare the Ca[HA]2 solution in an inert Ar atmosphere and filling the reactor with CO2 (d13C = −43.26) up to a pressure setpoint of 1.043 bar, as described for the regular carbon capture experiment in Section 2.1, aiming to define the best experimental procedure for isotopic characterization. After 24 h, the pressure drop stood at 0.08 bar (pure CO2 atmosphere), corresponding to a carbon capture yield of 6.5%, perfectly fitting the performance of the B-setup reported in our previous works [55]. The solution was then filtered and divided into five flasks (50 mL each) without headspace to avoid oxygen contamination, and the d13C and d18O were measured at increasing reaction times.
For the second set of trials, a 1 M Ca[HA]2 solution was prepared from vacuum-degassed water. As in the other experiments, the setpoint pressure of 1.043 bar of pure CO2 was loaded. At the end of the experiment (20 h), the pressure drop measured was −0.07 bar (pure CO2 atmosphere), corresponding to a capture yield of 6%. The solution was then stored under an N2 atmosphere without filtering to evaluate fractioning. This modification in the sampling procedure allowed for avoiding artifacts introduced by handling, as occurred in the first trial.
3. Results
3.1. Spontaneousness of the Reaction
The value of the oxidation potential of H2A resulting from the raw series of metal reduction experiments ranges between 0.44 V and 0.55 V, comparable with that necessary to guarantee the spontaneousness of the reaction and fitting other experimental data and predictions from computational methods [99]. However, the difference in redox potential between H2A and carbon dioxide to oxalate is modest, explaining the slowness in triggering the carbon reduction reaction.
Applying the reaction with H2A, some elements, such as Cu, Ag, Hg, Cd, Mn, and S, precipitated in their metallic form directly from the solution (as copper in Figure S5 in the Supplementary Materials, [103]), allowing their straight removal from wastewater, as a side-effect of the proposed method.
It is worth stressing here that calcium is kept as a model cation to precipitate oxalates. Still, other divalent cations can substitute it (e.g., transition metals) to achieve the double goal of carbon capture and metal trapping using carbon dioxide from anthropic activities to trap metals from wastewater.
From CV measurements, the onset of the oxidation of H2A is detectable at 0.15 V vs. Ag/AgCl, and then the current increases almost linearly until the potential scan is reversed. This value fits the data reported for the oxidation of the ascorbate radical to DHA (please refer to Table S1 and Figure S3) [74]. No anodic current peak (no complete oxidation) is observed until after 7 h of reaction. Upon the potential scan reversal, the current decreases again linearly with the applied potential; nevertheless, it remains anodic, meaning that we reached the irreversible degradation stage. No cathodic peaks are observed. The anodic current decreases monotonically with the reaction time: since it is directly proportional to the concentration of the oxidized species in the electrolyte, we can confirm that H2A is consumed during the reaction forming its oxidized counterpart. From the current values, we can estimate that 30% to 40% of the initial ascorbic acid has been consumed after 26 h. Evidence that ascorbic acid concentration declines with time comes from the appearance of an anodic peak in the voltammetry after 21.5 h and especially at slower scan rates, i.e., 50 mV s−1 (Figure S6 in the Supplementary Materials).
The oxidation of ascorbic acid is confirmed to be completely irreversible, suggesting no possibility of reagent recovery and reuse after carbon capture. Nevertheless, neither the formation of a precipitate, nor visual changes in the electrolyte, which remained clear and colorless, were observed during the reaction. This last point was also observed in mineralization experiments, and is most likely related to the supersaturation values reached during the early part of the experiment with respect to calcium oxalate. This point will be discussed more carefully in the following paragraph.
Along with CV measurements, LC confirmed that the first step of H2A degradation into DHA begins immediately after preparing the sample. In two days and with the presence of air, a solution 1 M of H2A is completely degraded (Figure S7a in the Supplementary Materials), the concentration of DHA being consistently lower than that theoretically expected, indicating the delactonization of the DHA ring followed by the formation of waste products of the degradation cascade. Data from CV and LC set the onset of the oxidation reaction of H2A at the very beginning of the experiment, immediately after the preparation of the solution. CV moreover confirms that the solution is stable and effectively acts as a good reducing agent for carbon during the first day of reaction, even if its oxidation is already detectable. These data perfectly match the trend evaluated during carbon mineralization experiments where the steep slope (maximum efficiency) of the carbon capture curve in Figure 1 is restrained to the early two hours of reaction. Then the curve flattens (H2A oxidation detectable but with mineralization still occurring). From the LC data, we can infer that the reaction will work with lower performance for up to two days of carbon mineralization. Figure S7b (in the Supplementary Materials) shows the increase in DHA in the solution, matching the trend shown in Figure S7a (in the Supplementary Materials). The absence of oxygen delays the degradation by about two days.
3.2. Carbon Isotope Fractioning during CO2 Capture/CaC2O4∙nH2O Precipitation
Experiments with 13C-labelled CO2 have been performed to trace the carbon path within the reaction. As previously stressed, the double slope of the carbon mineralization curve in B-setup represents a recurring feature and must be explained to scale-up the method.
As described in Section 2.6, we evaluated the isotopic fingerprint of raw materials used for the reaction as our reference values.
The d13C and d18O ratios for commercial CO2 were, respectively, −43.26 and −47.31, while for commercial H2A, they were, respectively, −11.17 and −9.62, demonstrating that carbon dioxide from the canister is strongly enriched in 12C, and that the H2A isotopic composition is heavier than carbon dioxide from the canister (Table S3).
The isotopic determination was performed on the CO2 dissolved into the Ca[HA]2 solution and the solid fraction precipitated, in order to evaluate the evolution of the isotopic ratios of carbon and oxygen with time.
The first trial’s results are reported in Figure S8a in the Supplementary Materials: both the solid phase and the solution show a general 13C enrichment trend with time, but some values obtained for the solution are clearly affected by artifacts. In general, the lightest carbon isotope is removed from the gaseous phase dissolved in solution at the early stages of the reaction. The average partition coefficient α calculated as reported by Hayes [104] between products (calcium oxalate) and reagents (carbon dioxide in solution) equals 0.41 (±0.04), confirming the bias of the lightest carbon isotope (coming from the CO2 canister) for the solid phase. However, isotopic data from the solid phase as collected in the first run are deceitful because oxalate crystals precipitate in many generations, as we described in our previous papers, and the isotopic zoning of crystals may be common. Both phenomena average, over time, the isotopic content of the solid fraction. Moreover, carbon contamination from the air during the transfer of the solution from the reactor to the flasks must be considered, meaning that the system is open compared to our standard experiment.
In the second experiment, we avoided carbon contamination from the air by keeping the system closed until the end of the experiment. Thus, we were not able to evaluate the evolution of the isotopic composition of the solid phase as a function of time and it was averaged over the whole experiment duration (d13C = −16.95, Figure S8b in the Supplementary Materials). The partition coefficient α of 13C between products and reagents in this second run is equal to 0.5 (evaluated over the end-of-experiment point). Even if this is higher in value compared to the previous result, the bias of the lighter carbon isotope for the solid fraction is confirmed.
Data related to d13C in CO2 dissolved in the capturing solution showed a first-order decay trend reported both in Figure S8b (Supplementary Materials) and Figure 2. Comparing the data coming from the first and second run, the calcium oxalate average d13C ratio ranges over a narrow interval of values between −12 and −17. The gas phase in solution is progressively enriched in 13C with time, as confirmed by the α values.
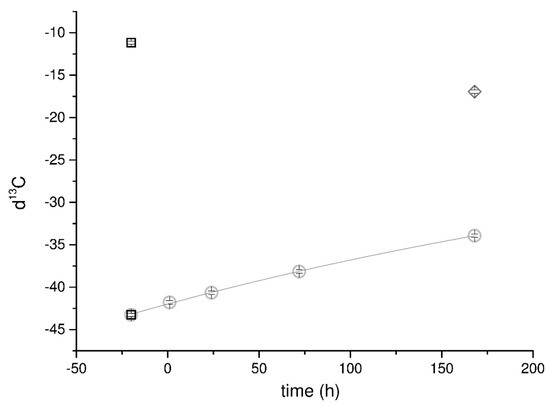
Figure 2.
Trend of d13C measured in the mineralizing system (solid diamond-, liquid circles-, and gas squares phases) vs. time. No handling in the second run allowed a better quality of data, highlighting the first-order decay of d13C in the dissolved CO2. The points related to the d13C of the CO2 from the canister and H2A (squares) are reported to be compared with the trend of the dissolved carbon. A single value for the solid fraction is reported (diamond) because of the experimental procedure intended to limit the artifacts’ appearances in the measurements as explained in the text.
Going back to the general behavior of the capture curve (Figure 1), we can finally describe it as a double-sloped capture curve in which the first part (in the light-grey field in Figure 3), with a steeper slope that suggests an efficient carbon capture process, corresponds to the pure capture mechanism in which Ca[HA]2 acts only as the reductant for C(IV) in C(III) and the concentration of the degradation products into the solution is low, as demonstrated by the CV and LC measurements. CO2 reduces into the oxalate anion and forms calcium oxalate at various degrees of hydration [56,105].
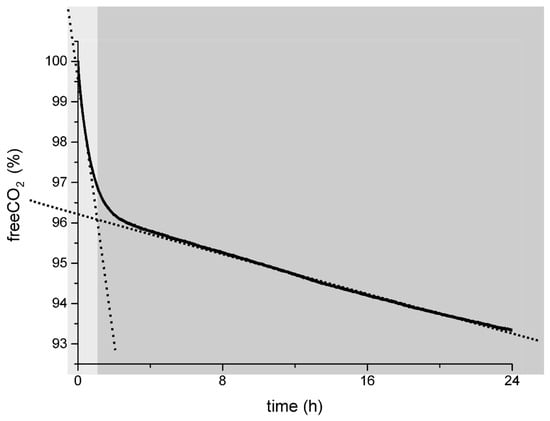
Figure 3.
The general carbon capture curve via carbon mineralization into oxalates explained: in the light-grey area, the efficient pure carbon capture process during the “low-oxidation stage” of the H2A as determined by CV and LC measurements; in the dark-grey area, the mixed process of capture and H2A degradation occurring when the H2A reaches higher degree of oxidation (30–40% from CV measurements) and the H2A degradation cascade is running.
The second part of the curve (the dark-grey shadowed field in Figure 3) represents a less efficient CO2 capture process in the presence of a double oxalate source: (i) CO2 reduction into C2O42− by the action of the H2A and (ii) degradation of the H2A into its waste products and finally into the oxalic acid.
The increase in oxalic acid’s concentration due to the presence of degradation products of H2A in the second part of the capture curve leads to an abrupt rise in calcium oxalate concentration in the solution. At supersaturation, calcium oxalate (kspCOM = 2.32 × 10⁻⁹ [101]) homogeneously nucleates in the volume of the solution. The formation of the early nuclei lowers the supersaturation, and the precipitation continues by heterogeneous nucleation on the homoepitaxial substrate, explaining the absence of visible precipitate during the early stages of mineralization experiments and in CV experiments.
The crystalline product of the mineralization reaction is pure weddellite. Figure 4 reports the PDXR pattern of the solid phase obtained from a standard carbon capture experiment (blue pattern). The calculated pattern of diffraction of weddellite is reported in red. The reference crystal structure is that of weddellite published in 1980 by Tazzoli and Domeneghetti [105] (tetragonal I 4/m, a = 12.3710 Å, c = 7.3570 Å). The perfect match between the experimental pattern and the calculated pattern is remarkable. Occasionally, some whewellite (the monohydrate form of calcium oxalate) is found as a byproduct, as reported in our early studies [57]. For more details about the crystal quality and structure stability, please refer to the literature [56].
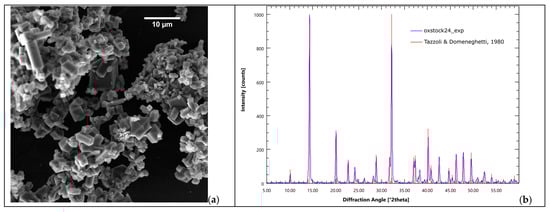
Figure 4.
Calcium oxalate is the only product of the mineralization reaction. (a) Calcium oxalate crystals from a B-setup carbon mineralization experiment; (b) XRPD pattern of the precipitate (red bars: weddellite pattern from Tazzoli and Domeneghetti, 1980 [105]).
Nevertheless, the final capture efficiency is not hindered by the double oxalate source, as was demonstrated in our previous work. Moreover, in all the capture experiments performed to verify the d13C, the final pressure into the vessel was lower than the room pressure, as occurred in the yield evaluation experiments [55], proving that carbon dioxide was efficiently removed from the atmosphere. Finally, from the LC experiments, we can infer that the carbon capture process will last for up to two days of mineralization.
4. Conclusions
In our previous work [55,57], the performance of the carbon capture reaction using H2A as the electron donor was systematically examined to optimize the experimental setup towards a sizeable apparatus. The goal was to tailor the capture process parameters to obtain the maximum yield of carbon capture and marketable Ca-oxalate with specific crystallographic and morphologic features.
In the present paper, some key points of the reaction that we proposed, which were still not completely understood, have been addressed:
- (i)
- In our previous work, we already described the process as a double-step reaction whose kinetics are controlled by the first (carbon reduction) step. Here, we confirmed that at the first reaction (Equation (1)) stage, H2A oxidizes into DHA, and in the counterpart, C(IV) reduces to C(III). In the present paper, we were able to assess, using CV measurements, the onset of the oxidation of H2A at 0.15 V, while the oxidation potential of H2A was indirectly evaluated in the range from 0.44 to 0.55 V, in agreement with former experimental data and theoretical modelling. These values demonstrate the spontaneousness of the carbon reduction reaction. On the other hand, the small redox potential gap between DHA oxidation and C reduction results in the slow triggering of the reaction, which is confirmed to be the rate-determining step. During the second stage of the reaction, the fastest step, atmospheric carbon that has been dissolved and reduced enters the crystal structure of oxalates along with the oxalic acid produced at the end of the degradation cascade of DHA. Stable isotope analysis provides d13C values in the oxalate crystal phase comparable to those of carbon from the CO2 cylinder, confirming that this reaction phase is a “pure carbon capture” phase. Progressive 13C isotope enrichment of the solution reflects the bias of the heavy isotope of carbon for the liquid fraction as evaluated by d13C trend curves in the liquid and fractionation calculations (a partition coefficient of α ~ 0.5 in the closed system).
- (ii)
- In the simplified B-system, the curve describing the carbon capture performance invariably shows a double slope. The isotopic analysis explains this behavior and demonstrates the proneness of 12C from a canister to be preferentially trapped into the solid phase (and, in contrast, of 13C to be accumulated into the liquid phase). The carbon capture curve is steep at the beginning, during the “pure carbon capture phase” and flattens afterwards, when carbon coming from both CO2 (reduced carbon) and ascorbic acid (finally degraded into oxalate) are stored in calcium oxalate crystals. From this point on, the reaction still works, but the carbon capture rate decreases because of the mixed carbon source for oxalates.
Oxalates, in turn, are crystalline reservoirs for long-term carbon dioxide storage and carbon raw materials for many manufacturing applications. Their structure and thermal stability are well known and are characterized [56] to estimate their reuse or storage behaviors. The presence of a substrate (understandably, a homoepitaxial substrate will be the best scenario and may be envisaged in future applications) assists their precipitation during mineralization reactions.
- (iii)
- As expected, the degradation of H2A into DHA and then into the products belonging to its degradation cascade, already described in our previously published work [57], is completely irreversible in abiotic conditions, when enzymatic processes are not present. CV data confirmed the irreversibility of the process during the carbon capture reaction. Therefore, reusing the H2A after the carbon mineralization reaction is not possible once the lactone ring is opened. Nevertheless, we must recall from our previous studies [55,57] that the performance of the carbon mineralization was strongly dependent on the reaction surface and can reach levels up to 82% of the carbon dioxide in a 100% CO2 atmosphere in less than 24 h, when working with a finely divided solution dispersed into a carbon dioxide atmosphere. This is a relevant yield, and is even more impressive if one considers that CO2 in oxalates is permanently stored, making the methodology an interesting and valuable addition to the suite of available carbon capture techniques. We do not need to mention that the IPCC [1] has advocated for a portfolio of carbon capture techniques in its most recent publications. Operational costs can nevertheless be significantly reduced by properly tuning the concentration of the ascorbic acid to fulfill the application’s requirements: carbon capture by means of ascorbic acid has been hitherto performed in a pure carbon dioxide atmosphere, far from the real-case scenarios, wherein the upper limit of CO2 in a gas mixture falls to about 20%. Therefore, the concentration of ascorbic acid can be tuned to match the expected yield of carbon capture, cutting wastage without affecting performance. Moreover, applying H2A to wastewater-containing metals suggests several appealing implications, such as the removal of metals from wastewaters.
Finally, we must stress that the irreversible process of delactonization could be possibly hindered by applying mixtures of reducing sugars [106]. This point will be addressed in further experiments.
Supplementary Materials
The following supporting information can be downloaded at: https://www.mdpi.com/article/10.3390/cleantechnol6040066/s1, Figure S1: The B-setup. Carbon dioxide bubbles into the calcium ascorbate solution. The pressure setpoint is controlled using a pressure meter with a feedback loop on the flow meter. and it is chosen to be slightly higher than the atmospheric pressure. After loading, the system is closed and left to react. Figure S2: Flow rate vs. net revenue at variable reaction yield. The model is built on the yields experimentally determined in our previous papers from laboratory setups [55,57]. Yields 5% and 45% are not experimentally determined and represent a hypothetical very low carbon capture performance (comparable to the average performance of the B-setup) and a cautionary average performance of a BD/SPRAY setup, respectively. From the model, we can infer that the method is economically affordable for yields larger than 10% and CO2 feeding equal or higher to 20 mL/min for a diluted Ca[HA]2 solution (200 mL, 0.1 M). Table S1: Deprotonation and oxidation reactions following the model proposed by Tu et al. [74] (see also Supporting Information Figure S2 for visual description of the reactions). pKa and E0 values are reported as in the literature: a [75], b [76], c [77], d [78], e [79]. Figure S3: Scheme of the electrochemical equilibria of ascorbic acid and its derivatives in water solution. From Tu et al., modified [3]. Table S2: The list of the metals with tabulated values of the redox potentials used to roughly evaluate the redox potential of a 1 M aqueous ascorbic acid solution. Figure S4: (a) Calibration curve for H2A; calculated LOD and LOQ were, respectively, 0.48 and 1.6 ppm; (b) Calibration curve for DHA; calculated LOD and LOQ were, respectively, 0.51 and 1.7 ppm. Figure S5: Cu0 crystals (single euhedral crystals and spherulitic aggregates) from the spontaneous redox reaction of CuO with H2A. Figure S6: Cyclic voltammogram at 50 mV/s scan rate of 1.0 M AA, 0.30 M CaCl2 solution at pH 4.2 under a CO2 atmosphere. Figure S7: LC evaluation of the H2A to DHA oxidation reaction: (a) H2A concentration as a function of time; (b) DHA concentration as a function of time. Table S3: d13C and d18O ratios in the commercial CO2 canister and the H2A reagent. Figure S8: (a) General 13C enrichment trend for both the solid phase and the solution. Some artifacts affect values from the solution. The general trend is an enrichment of the 12C in the gas fraction. Many crystal generations and zoning of crystals bring artifacts into the isotopic content of the solid phase. (b) In the second experiment, we avoided the contamination from the air that could arise from the transfer of the solution from the reactor to the flasks. No sampling of the solid phase was performed until the end of the experiment. The single solid composition is averaged over the whole experiment time (d13C = −16.95).
Author Contributions
Conceptualization, L.P.; methodology, L.P., V.B., E.A., M.P. and F.S.; validation, L.P., V.B., E.A., M.P., F.S. and Q.W.; formal analysis, L.P., V.B., E.A, M.P. and F.S.; investigation, L.P., V.B., E.A., M.P. and F.S.; resources, A.P.; data curation, L.P.; writing—original draft preparation, L.P. and A.P.; writing—review and editing, L.P. and A.P.; supervision, L.P. and A.P.; project administration, A.P.; funding acquisition, A.P. All authors have read and agreed to the published version of the manuscript.
Funding
This research was funded by the Università degli Studi di Torino (Italy) (Ricerca Locale 2021; Ricerca locale 2022), EcoSpray Technologies S.p.A. (Italy) (Ottimizzazione dei processi di cattura e intrappolamento di CO2 in sistemi allo stato solido), Italian Ministry for Education, University and Research (MIUR; project PRIN2017-2017L83S77), and by the Ministry for Ecological Transition (MiTE; project CLEAN. Waste water purification).
Institutional Review Board Statement
Not applicable.
Informed Consent Statement
Not applicable.
Data Availability Statement
Raw data are available at the following link: shorturl.at/behu6 (accessed on 1 October 2024).
Conflicts of Interest
The authors declare no conflicts of interest.
References
- IPCC (International Panel on Climate Change). Climate Change 2022. Mitigation of Climate Change; IPCC: Geneva, Switzerland, 2022. [Google Scholar]
- Seifritz, W. CO2 Disposal by Means of Silicates. Nature 1990, 345, 486. [Google Scholar] [CrossRef]
- Lackner, K.S.; Butt, D.P.; Wendt, C.H. Progress on Binding CO2 in Mineral Substrates. Energy Convers. Manag. 1997, 38, S259–S264. [Google Scholar] [CrossRef]
- Zevenhoven, R.; Fagerlund, J. Mineralisation of Carbon Dioxide (CO2). In Developments and Innovation in Carbon Dioxide (CO2) Capture and Storage Technology; Elsevier: Amterdam, The Netherlands, 2010; Volume 2, pp. 433–462. [Google Scholar]
- Azdarpour, A.; Asadullah, M.; Mohammadian, E.; Hamidi, H.; Junin, R.; Karaei, M.A. A Review on Carbon Dioxide Mineral Carbonation through PH-Swing Process. Chem. Eng. J. 2015, 279, 615–630. [Google Scholar] [CrossRef]
- Béarat, H.; Mckelvy, M.J.; Chizmeshya, A.V.G.; Gormley, D.; Nunez, R.; Carpenter, R.W.; Squires, K.; Wolf, G.H. Carbon Sequestration via Aqueous Olivine Mineral Carbonation: Role of Passivating Layer Formation. Environ. Sci. Technol. 2006, 40, 4802–4808. [Google Scholar] [CrossRef]
- Butt, D.P.; Lackner, K.S.; Wendt, C.H.; Conzone, S.D.; Kung, H.; Lu, Y.-C.; Bremser, J.K. Kinetics of Thermal Dehydroxylation and Carbonation of Magnesium Hydroxide. J. Am. Ceram. Soc. 1996, 79, 1892–1898. [Google Scholar] [CrossRef]
- Dri, M.; Sanna, A.; Maroto-Valer, M.M. Mineral Carbonation from Metal Wastes: Effect of Solid to Liquid Ratio on the Efficiency and Characterization of Carbonated Products. Appl. Energy 2014, 113, 515–523. [Google Scholar] [CrossRef]
- Eikeland, E.; Blichfeld, A.B.; Tyrsted, C.; Jensen, A.; Iversen, B.B. Optimized Carbonation of Magnesium Silicate Mineral for CO2 Storage. ACS Appl. Mater. Interfaces 2015, 7, 5258–5264. [Google Scholar] [CrossRef]
- Entezari Zarandi, A.; Larachi, F.; Beaudoin, G.; Plante, B.; Sciortino, M. Ambient Mineral Carbonation of Different Lithologies of Mafic to Ultramafic Mining Wastes/Tailings—A Comparative Study. Int. J. Greenh. Gas Control 2017, 63, 392–400. [Google Scholar] [CrossRef]
- Gadikota, G.; Matter, J.; Kelemen, P.; Park, A.H.A. Chemical and Morphological Changes during Olivine Carbonation for CO2 Storage in the Presence of NaCl and NaHCO3. Phys. Chem. Chem. Phys. 2014, 16, 4679–4693. [Google Scholar] [CrossRef]
- Gadikota, G.; Swanson, E.J.; Zhao, H.; Park, A.H.A. Experimental Design and Data Analysis for Accurate Estimation of Reaction Kinetics and Conversion for Carbon Mineralization. Ind. Eng. Chem. Res. 2014, 53, 6664–6676. [Google Scholar] [CrossRef]
- Huijgen, W.J.J.; Ruijg, G.J.; Comans, R.N.J.; Witkamp, G.J. Energy Consumption and Net CO2 Sequestration of Aqueous Mineral Carbonation. Ind. Eng. Chem. Res. 2006, 45, 9184–9194. [Google Scholar] [CrossRef]
- Kelemen, P.B.; Matter, J. In Situ Carbonation of Peridotite for CO2 Storage. Proc. Natl. Acad. Sci. USA 2008, 105, 17295–17300. [Google Scholar] [CrossRef]
- Kelemen, P.B.; McQueen, N.; Wilcox, J.; Renforth, P.; Dipple, G.; Vankeuren, A.P. Engineered Carbon Mineralization in Ultramafic Rocks for CO2 Removal from Air: Review and New Insights. Chem. Geol. 2020, 550, 119628. [Google Scholar] [CrossRef]
- Kelemen, P.B.; Matter, J.; Streit, E.E.; Rudge, J.F.; Curry, W.B.; Blusztajn, J. Rates and Mechanisms of Mineral Carbonation in Peridotite: Natural Processes and Recipes for Enhanced, in Situ CO2 Capture and Storage. Annu. Rev. Earth Planet. Sci. 2011, 39, 545–576. [Google Scholar] [CrossRef]
- Power, I.M.; Harrison, A.L.; Dipple, G.M.; Wilson, S.; Kelemen, P.B.; Hitch, M.; Southam, G. Carbon Mineralization: From Natural Analogues to Engineered Systems. Rev. Miner. Geochem. 2013, 77, 305–360. [Google Scholar] [CrossRef]
- Khoo, H.H.; Bu, J.; Wong, R.L.; Kuan, S.Y.; Sharratt, P.N. Carbon Capture and Utilization: Preliminary Life Cycle CO2, Energy, and Cost Results of Potential Mineral Carbonation. Energy Procedia 2011, 4, 2494–2501. [Google Scholar] [CrossRef]
- Khoo, H.H.; Tan, R.B.H. Life Cycle Investigation of CO2 Recovery and Sequestration. Environ. Sci. Technol. 2006, 40, 4016–4024. [Google Scholar] [CrossRef]
- Navarro, R.; Pereira, D.; Gimeno, A.; Del Barrio, S. Influence of Natural Carbonation Process in Serpentinites Used as Construction and Building Materials. Constr. Build. Mater. 2018, 170, 537–546. [Google Scholar] [CrossRef]
- Oskierski, H.C.; Beinlich, A.; Mavromatis, V.; Altarawneh, M.; Dlugogorski, B.Z. Mg Isotope Fractionation during Continental Weathering and Low Temperature Carbonation of Ultramafic Rocks. Geochim. Cosmochim. Acta 2019, 262, 60–77. [Google Scholar] [CrossRef]
- Sanna, A.; Uibu, M.; Caramanna, G.; Kuusik, R.; Maroto-Valer, M.M. A Review of Mineral Carbonation Technologies to Sequester CO2. Chem. Soc. Rev. 2014, 43, 8049–8080. [Google Scholar] [CrossRef]
- Santos, H.S.; Nguyen, H.; Venâncio, F.; Ramteke, D.; Zevenhoven, R.; Kinnunen, P. Mechanisms of Mg Carbonates Precipitation and Implications for CO2 Capture and Utilization/Storage. Inorg. Chem. Front. 2023, 10, 2507–2546. [Google Scholar] [CrossRef]
- Santos, R.M.; Knops, P.C.M.; Rijnsburger, K.L.; Chiang, Y.W. CO2 Energy Reactor—Integrated Mineral Carbonation: Perspectives on Lab-Scale Investigation and Products Valorization. Front. Energy Res. 2016, 4, 5. [Google Scholar] [CrossRef]
- Wehrung, Q.; Pastero, L.; Bernasconi, D.; Cotellucci, A.; Bruno, M.; Cavagna, S.; Destefanis, E.; Caviglia, C.; Pavese, A. Impact of Operational Parameters on the CO2 Absorption Rate in Ca(OH)2 Aqueous Carbonation─Implications for Process Efficiency. Energy Fuels 2024, 38, 16678–16691. [Google Scholar] [CrossRef]
- Zevenhoven, R.; Teir, S.; Eloneva, S. Heat Optimisation of a Staged Gas–Solid Mineral Carbonation Process for Long-Term CO2 Storage. Energy 2008, 33, 362–370. [Google Scholar] [CrossRef]
- Zhao, Y.; Wu, M.; Guo, X.; Zhang, Y.; Ji, Z.; Wang, J.; Liu, J.; Liu, J.; Wang, Z.; Chi, Q.; et al. Thorough Conversion of CO2 through Two-Step Accelerated Mineral Carbonation in the MgCl2-CaCl2-H2O System. Sep. Purif. Technol. 2019, 210, 343–354. [Google Scholar] [CrossRef]
- Amatore, C.; Saveant, J.M. Mechanism and Kinetic Characteristics of the Electrochemical Reduction of Carbon Dioxide in Media of Low Proton Availability. J. Am. Chem. Soc. 1981, 103, 5021–5023. [Google Scholar] [CrossRef]
- Aresta, M.; Dibenedetto, A. Utilisation of CO2 as a Chemical Feedstock: Opportunities and Challenges. Dalton Trans. 2007, 28, 2975. [Google Scholar] [CrossRef]
- Benson, E.E.; Kubiak, C.P.; Sathrum, A.J.; Smieja, J.M. Electrocatalytic and Homogeneous Approaches to Conversion of CO2 to Liquid Fuels. Chem. Soc. Rev. 2009, 38, 89–99. [Google Scholar] [CrossRef]
- Bockris, J.O.; Wass, J.C. The Photoelectrocatalytic Reduction of Carbon Dioxide. J. Electrochem. Soc. 1989, 136, 2521. [Google Scholar] [CrossRef]
- Costentin, C.; Robert, M.; Savéant, J.-M. Catalysis of the Electrochemical Reduction of Carbon Dioxide. Chem. Soc. Rev. 2013, 42, 2423–2436. [Google Scholar] [CrossRef]
- Finn, C.; Schnittger, S.; Yellowlees, L.J.; Love, J.B. Molecular Approaches to the Electrochemical Reduction of Carbon Dioxide. Chem. Commun. 2012, 48, 1392–1399. [Google Scholar] [CrossRef] [PubMed]
- Kortlever, R.; Shen, J.; Schouten, K.J.P.; Calle-Vallejo, F.; Koper, M.T.M. Catalysts and Reaction Pathways for the Electrochemical Reduction of Carbon Dioxide. J. Phys. Chem. Lett. 2015, 6, 4073–4082. [Google Scholar] [CrossRef] [PubMed]
- Qiao, J.; Liu, Y.; Hong, F.; Zhang, J. A Review of Catalysts for the Electroreduction of Carbon Dioxide to Produce Low-Carbon Fuels. Chem. Soc. Rev. 2014, 43, 631–675. [Google Scholar] [CrossRef]
- Zhu, D.D.; Liu, J.L.; Qiao, S.Z. Recent Advances in Inorganic Heterogeneous Electrocatalysts for Reduction of Carbon Dioxide. Adv. Mater. 2016, 28, 3423–3452. [Google Scholar] [CrossRef]
- Rosen, B.A.; Hod, I. Tunable Molecular-Scale Materials for Catalyzing the Low-Overpotential Electrochemical Conversion of CO2. Adv. Mater. 2018, 30, 1706238. [Google Scholar] [CrossRef]
- Savéant, J.-M. Molecular Catalysis of Electrochemical Reactions. Mechanistic Aspects. Chem. Rev. 2008, 108, 2348–2378. [Google Scholar] [CrossRef]
- Schneider, J.; Jia, H.; Muckerman, J.T.; Fujita, E. Thermodynamics and Kinetics of CO2, CO, and H+ Binding to the Metal Centre of CO2 Reduction Catalysts. Chem. Soc. Rev. 2012, 41, 2036–2051. [Google Scholar] [CrossRef]
- Tryk, D.; Yamamoto, T.; Kokubun, M.; Hirota, K.; Hashimoto, K.; Okawa, M.; Fujistima, A. Recent Developments in Electrochemical and Photoelectrochemical CO2 Reduction: Involvement of the (CO2)2.− Dimer Radical Anion. Appl. Organomet. Chem. 2001, 15, 113–120. [Google Scholar] [CrossRef]
- Whipple, D.T.; Kenis, P.J.A. Prospects of CO2 Utilization via Direct Heterogeneous Electrochemical Reduction. J. Phys. Chem. Lett. 2010, 1, 3451–3458. [Google Scholar] [CrossRef]
- Angamuthu, R.; Byers, P.; Lutz, M.; Spek, A.L.; Bouwman, E. Electrocatalytic CO2 Conversion to Oxalate by a Copper Complex. Science 2010, 327, 313–315. [Google Scholar] [CrossRef]
- Kushi, Y.; Nagao, H.; Nishioka, T.; Isobe, K.; Tanaka, K. Remarkable Decrease in Overpotential of Oxalate Formation in Electrochemical CO2 Reduction by a Metal–Sulfide Cluster. J. Chem. Soc. Chem. Commun. 1995, 12, 1223–1224. [Google Scholar] [CrossRef]
- van Albada, G.A.; Mutikainen, I.; Roubeau, O.; Turpeinen, U.; Reedijk, J. Ferromagnetic Trinuclear Carbonato-Bridged and Tetranuclear Hydroxo-Bridged Cu(II) Compounds with 4,4′-Dimethyl-2,2′-Bipyridine as Ligand. X-Ray Structure, Spectroscopy and Magnetism. Inorg. Chim. Acta 2002, 331, 208–215. [Google Scholar] [CrossRef]
- Youngme, S.; Chaichit, N.; Kongsaeree, P.; van Albada, G.A.; Reedijk, J. Synthesis, Structure, Spectroscopy, and Magnetism of Two New Dinuclear Carbonato-Bridged Cu(II) Complexes. Inorg. Chim. Acta 2001, 324, 232–240. [Google Scholar] [CrossRef]
- Aghel, B.; Janati, S.; Wongwises, S.; Shadloo, M.S. Review on CO2 Capture by Blended Amine Solutions. Int. J. Greenh. Gas Control 2022, 119, 103715. [Google Scholar] [CrossRef]
- Artanto, Y.; Jansen, J.; Pearson, P.; Do, T.; Cottrell, A.; Meuleman, E.; Feron, P. Performance of MEA and Amine-Blends in the CSIRO PCC Pilot Plant at Loy Yang Power in Australia. Fuel 2012, 101, 264–275. [Google Scholar] [CrossRef]
- Barzagli, F.; Giorgi, C.; Mani, F.; Peruzzini, M. Reversible Carbon Dioxide Capture by Aqueous and Non-Aqueous Amine-Based Absorbents: A Comparative Analysis Carried out by 13C NMR Spectroscopy. Appl. Energy 2018, 220, 208–219. [Google Scholar] [CrossRef]
- Crooks, J.E.; Donnellan, J.P. Kinetics and Mechanism of the Reaction between Carbon Dioxide and Amines in Aqueous Solution. J. Chem. Soc. Perkin Trans. 1989, 2, 331. [Google Scholar] [CrossRef]
- García-España, E.; Gaviña, P.; Latorre, J.; Soriano, C.; Verdejo, B. CO2 Fixation by Copper(II) Complexes of a Terpyridinophane Aza Receptor. J. Am. Chem. Soc. 2004, 126, 5082–5083. [Google Scholar] [CrossRef]
- Little, R.J.; Versteeg, G.F.; van Swaaij, W.P.M. Kinetics of CO2 with Primary and Secondary Amines in Aqueous Solutions—I. Zwitterion Deprotonation Kinetics for DEA and DIPA in Aqueous Blends of Alkanolamines. Chem. Eng. Sci. 1992, 47, 2027–2035. [Google Scholar] [CrossRef][Green Version]
- Notni, J.; Schenk, S.; Görls, H.; Breitzke, H.; Anders, E. Formation of a Unique Zinc Carbamate by CO2 Fixation: Implications for the Reactivity of Tetra-Azamacrocycle Ligated Zn(II) Complexes. Inorg. Chem. 2008, 47, 1382–1390. [Google Scholar] [CrossRef]
- Verdejo, B.; Aguilar, J.; García-España, E.; Gaviña, P.; Latorre, J.; Soriano, C.; Llinares, J.M.; Doménech, A. CO2 Fixation by Cu2+ and Zn2+ Complexes of a Terpyridinophane Aza Receptor. Crystal Structures of Cu2+ Complexes, PH-Metric, Spectroscopic, and Electrochemical Studies. Inorg. Chem. 2006, 45, 3803–3815. [Google Scholar] [CrossRef] [PubMed]
- Wehrung, Q.; Destefanis, E.; Caviglia, C.; Bernasconi, D.; Pastero, L.; Bruno, M.; Bernasconi, A.; Magnetti Vernai, A.; Di Rienzo, A.; Pavese, A. Experimental Modeling of CO2 Sorption/Desorption Cycle with MDEA/PZ Blend: Kinetics and Regeneration Temperature. Sustainability 2023, 15, 10334. [Google Scholar] [CrossRef]
- Pastero, L.; Marengo, A.; Boero, R.; Pavese, A. Non-Conventional CO2 Sequestration via Vitamin C Promoted Green Reaction: Yield Evaluation. J. CO2 Util. 2021, 44, 101420. [Google Scholar] [CrossRef]
- Curetti, N.; Pastero, L.; Bernasconi, D.; Cotellucci, A.; Corazzari, I.; Archetti, M.; Pavese, A. Thermal Stability of Calcium Oxalates from CO2 Sequestration for Storage Purposes: An In-Situ HT-XRPD and TGA Combined Study. Minerals 2021, 12, 53. [Google Scholar] [CrossRef]
- Pastero, L.; Curetti, N.; Ortenzi, M.A.; Schiavoni, M.; Destefanis, E.; Pavese, A. CO2 Capture and Sequestration in Stable Ca-Oxalate, via Ca-Ascorbate Promoted Green Reaction. Sci. Total Environ. 2019, 666, 1232–1244. [Google Scholar] [CrossRef]
- Mecinović, J.; Hamed, R.B.; Schofield, C.J. Iron-Mediated Cleavage of C-C Bonds in Vicinal Tricarbonyl Compounds in Water. Angew. Chem. Int. Ed. 2009, 48, 2796–2800. [Google Scholar] [CrossRef]
- Verma, A.; Kore, R.; Corbin, D.R.; Shiflett, M.B. Metal Recovery Using Oxalate Chemistry: A Technical Review. Ind. Eng. Chem. Res. 2019, 58, 15381–15393. [Google Scholar] [CrossRef]
- Cunha-Cruz, J.; Stout, J.R.; Heaton, L.J.; Wataha, J.C. Dentin Hypersensitivity and Oxalates. J. Dent. Res. 2011, 90, 304–310. [Google Scholar] [CrossRef]
- Firouzmandi, M.; Valipour, F.; Roshanzamir, M.; Mobaleghi, T. The Effect of Oxalate-Based Desensitizers on the Microleakage and Shear Bond Strength of Resin Modified Glass Ionomer. J. Clin. Exp. Dent. 2017, 9, e1183–e1188. [Google Scholar] [CrossRef]
- Pashley, D.H.; Carvalho, R.M.; Pereira, J.C.; Villanueva, R.; Tay, F.R. The Use of Oxalate to Reduce Dentin Permeability under Adhesive Restorations. Am. J. Dent. 2001, 14, 89–94. [Google Scholar]
- Ding, Z.; Tian, S.; Zheng, X.; Zhou, Z.; Xu, Y. Responses of Reactive Oxygen Metabolism and Quality in Mango Fruit to Exogenous Oxalic Acid or Salicylic Acid under Chilling Temperature Stress. Physiol. Plant. 2007, 130, 112–121. [Google Scholar] [CrossRef]
- Jin, P.; Zhu, H.; Wang, L.; Shan, T.; Zheng, Y. Oxalic Acid Alleviates Chilling Injury in Peach Fruit by Regulating Energy Metabolism and Fatty Acid Contents. Food Chem. 2014, 161, 87–93. [Google Scholar] [CrossRef] [PubMed]
- Kant, K.; Arora, A.; Singh, V.P.; Kumar, R. Effect of Exogenous Application of Salicylic Acid and Oxalic Acid on Post Harvest Shelf-Life of Tomato (Solanum lycopersicon L.). Indian J. Plant Physiol. 2013, 18, 15–21. [Google Scholar] [CrossRef]
- Martínez-Esplá, A.; García-Pastor, M.E.; Zapata, P.J.; Guillén, F.; Serrano, M.; Valero, D.; Gironés-Vilaplana, A. Preharvest Application of Oxalic Acid Improves Quality and Phytochemical Content of Artichoke (Cynara scolymus L.) at Harvest and during Storage. Food Chem. 2017, 230, 343–349. [Google Scholar] [CrossRef]
- Wu, F.; Zhang, D.; Zhang, H.; Jiang, G.; Su, X.; Qu, H.; Jiang, Y.; Duan, X. Physiological and Biochemical Response of Harvested Plum Fruit to Oxalic Acid during Ripening or Shelf-Life. Food Res. Int. 2011, 44, 1299–1305. [Google Scholar] [CrossRef]
- Zheng, X.; Tian, S.; Gidley, M.J.; Yue, H.; Li, B. Effects of Exogenous Oxalic Acid on Ripening and Decay Incidence in Mango Fruit during Storage at Room Temperature. Postharvest Biol. Technol. 2007, 45, 281–284. [Google Scholar] [CrossRef]
- Zheng, X.; Tian, S. Effect of Oxalic Acid on Control of Postharvest Browning of Litchi Fruit. Food Chem. 2006, 96, 519–523. [Google Scholar] [CrossRef]
- Zhu, Y.; Yu, J.; Brecht, J.K.; Jiang, T.; Zheng, X. Pre-Harvest Application of Oxalic Acid Increases Quality and Resistance to Penicillium Expansum in Kiwifruit during Postharvest Storage. Food Chem. 2016, 190, 537–543. [Google Scholar] [CrossRef]
- Davies, M.B.; Austin, J.A.; Partridge, D.A. Vitamin C: Its Chemistry and Biochemistry; Royal Society of Chemistry: London, UK, 1991; ISBN 9780851863337. [Google Scholar]
- Kerber, R.C. “As Simple as Possible, but Not Simpler”—The Case of Dehydroascorbic Acid. J. Chem. Educ. 2008, 85, 1237. [Google Scholar] [CrossRef]
- Njus, D.; Kelley, P.M.; Tu, Y.-J.; Schlegel, H.B. Ascorbic Acid: The Chemistry Underlying Its Antioxidant Properties. Free Radic. Biol. Med. 2020, 159, 37–43. [Google Scholar] [CrossRef]
- Tu, Y.-J.; Njus, D.; Schlegel, H.B. A Theoretical Study of Ascorbic Acid Oxidation and HOO−/O2− Radical Scavenging. Org. Biomol. Chem. 2017, 15, 4417–4431. [Google Scholar] [CrossRef] [PubMed]
- Williams, N.H.; Yandell, J.K. Outer-Sphere Electron-Transfer Reactions of Ascorbate Anions. Aust. J. Chem. 1982, 35, 1133–1144. [Google Scholar] [CrossRef]
- Laroff, G.P.; Fessenden, R.W.; Schuler, R.H. Electron Spin Resonance Spectra of Radical Intermediates in the Oxidation of Ascorbic Acid and Related Substances. J. Am. Chem. Soc. 1972, 94, 9062–9073. [Google Scholar] [CrossRef] [PubMed]
- Njus, D.; Jalukar, V.; Zu, J.; Kelley, P. Concerted Proton-Electron Transfer between Ascorbic Acid and Cytochrome B561. Am. J. Clin. Nutr. 1991, 54, 1179S–1183S. [Google Scholar] [CrossRef]
- Steenken, S.; Neta, P. Electron Transfer Rates and Equilibriums between Substituted Phenoxide Ions and Phenoxyl Radicals. J. Phys. Chem. 1979, 83, 1134–1137. [Google Scholar] [CrossRef]
- Tur’yan, Y.I.; Kohen, R. Formal Redox Potentials of the Dehydro-l-Ascorbic Acid/l-Ascorbic Acid System. J. Electroanal. Chem. 1995, 380, 273–277. [Google Scholar] [CrossRef]
- Iyanagi, T.; Yamazaki, I.; Anan, K.F. One-Electron Oxidation-Reduction Properties of Ascorbic Acid. Biochim. Biophys. Acta (BBA) Bioenerg. 1985, 806, 255–261. [Google Scholar] [CrossRef]
- Borsook, H.; Keighley, G. Oxidation-Reduction Potential of Ascorbic Acid (Vitamin C). Proc. Natl. Acad. Sci. USA 1933, 19, 875–878. [Google Scholar] [CrossRef]
- Markarian, S.A.; Sargsyan, H.R. Electronic Absorption Spectra of Ascorbic Acid in Water and Water–Dialkylsulfoxide Mixtures. J. Appl. Spectrosc. 2011, 78, 6–10. [Google Scholar] [CrossRef]
- Ruiz, J.J.; Aldaz, A.; Dominguez, M. Mechanism of L-Ascorbic Acid Oxidation on a Mercury Electrode. II. Basic Medium. Can. J. Chem. 1978, 56, 1533–1537. [Google Scholar] [CrossRef]
- Ruiz, J.J.; Aldaz, A.; Dominguez, M. Mechanism of L-Ascorbic Acid Oxidation and Dehydro-L-Ascorbic Acid Reduction on a Mercury Electrode. I. Acid Medium. Can. J. Chem. 1977, 55, 2799–2806. [Google Scholar] [CrossRef]
- Ball, E.G. Studies on Oxidation-Reduction. J. Biol. Chem. 1937, 118, 219–239. [Google Scholar] [CrossRef]
- Creutz, C. Complexities of Ascorbate as a Reducing Agent. Inorg. Chem. 1981, 20, 4449–4452. [Google Scholar] [CrossRef]
- Bode, A.M.; Cunningham, L.; Rose, R.C. Spontaneous Decay of Oxidized Ascorbic Acid (Dehydro-L-Ascorbic Acid) Evaluated by High-Pressure Liquid Chromatography. Clin. Chem. 1990, 36, 1807–1809. [Google Scholar] [CrossRef]
- Green, M.A.; Fry, S.C. Vitamin C Degradation in Plant Cells via Enzymatic Hydrolysis of 4-O-Oxalyl-l-Threonate. Nature 2005, 433, 83–87. [Google Scholar] [CrossRef]
- Kurata, T.; Wakabayashi, H.; Sakurai, Y. Degradation of L-Ascorbic Acid and Mechanism of Non-Enzymic Browning Reaction. Agric. Biol. Chem. 1967, 31, 101–105. [Google Scholar] [CrossRef]
- Parsons, H.T.; Yasmin, T.; Fry, S.C. Alternative Pathways of Dehydroascorbic Acid Degradation in Vitro and in Plant Cell Cultures: Novel Insights into Vitamin C Catabolism. Biochem. J. 2011, 440, 375–385. [Google Scholar] [CrossRef]
- Parsons, H.T.; Fry, S.C. Oxidation of Dehydroascorbic Acid and 2,3-Diketogulonate under Plant Apoplastic Conditions. Phytochemistry 2012, 75, 41–49. [Google Scholar] [CrossRef]
- Nobile, S.; Woodhill, J.M. What Is Vitamin C? In Vitamin C; Springer: Dordrecht, The Netherlands, 1981; pp. 21–26. [Google Scholar]
- Koshiishi, I.; Mamura, Y.; Imanari, T. Bicarbonate Promotes a Cleavage of Lactone Ring of Dehydroascorbate. Biochim. Biophys. Acta (BBA)-Gen. Subj. 1998, 1379, 257–263. [Google Scholar] [CrossRef]
- Falat, L.; Cheng, H.Y. Voltammetric Differentiation of Ascorbic Acid and Dopamine at an Electrochemically Treated Graphite/Epoxy Electrode. Anal. Chem. 1982, 54, 2108–2111. [Google Scholar] [CrossRef]
- Hu, I.F.; Kuwana, T. Oxidative Mechanism of Ascorbic Acid at Glassy Carbon Electrodes. Anal. Chem. 1986, 58, 3235–3239. [Google Scholar] [CrossRef]
- Wring, S.A.; Hart, J.P.; Birch, B.J. Voltammetric Behaviour of Ascorbic Acid at a Graphite—Epoxy Composite Electrode Chemically Modified with Cobalt Phthalocyanine and Its Amperometric Determination in Multivitamin Preparations. Anal. Chim. Acta 1990, 229, 63–70. [Google Scholar] [CrossRef]
- Ren, W.; Luo, H.Q.; Li, N.B. Simultaneous Voltammetric Measurement of Ascorbic Acid, Epinephrine and Uric Acid at a Glassy Carbon Electrode Modified with Caffeic Acid. Biosens. Bioelectron. 2006, 21, 1086–1092. [Google Scholar] [CrossRef] [PubMed]
- Lovander, M.D.; Lyon, J.D.; Parr, D.L.; Wang, J.; Parke, B.; Leddy, J. Critical Review—Electrochemical Properties of 13 Vitamins: A Critical Review and Assessment. J. Electrochem. Soc. 2018, 165, G18–G49. [Google Scholar] [CrossRef]
- Matsui, T.; Kitagawa, Y.; Okumura, M.; Shigeta, Y. Accurate Standard Hydrogen Electrode Potential and Applications to the Redox Potentials of Vitamin C and NAD/NADH. J. Phys. Chem. A 2015, 119, 369–376. [Google Scholar] [CrossRef]
- Doebelin, N.; Kleeberg, R. Profex: A Graphical User Interface for the Rietveld Refinement Program BGMN. J. Appl. Crystallogr. 2015, 48, 1573–1580. [Google Scholar] [CrossRef] [PubMed]
- Lide, D.R. (Ed.) CRC Handbook of Chemistry and Physics: A Ready-Reference Book of Chemical and Physical Data, 84th ed.; CRC Press: Boca Raton, FL, USA, 2003; ISBN 0849304849. [Google Scholar]
- Kroopnick, P. The Dissolved O2-CO2-13C System in the Eastern Equatorial Pacific. Deep Sea Res. Oceanogr. Abstr. 1974, 21, 211–227. [Google Scholar] [CrossRef]
- Xiong, J.; Wang, Y.; Xue, Q.; Wu, X. Synthesis of Highly Stable Dispersions of Nanosized Copper Particles Using L-Ascorbic Acid. Green Chem. 2011, 13, 900–904. [Google Scholar] [CrossRef]
- Hayes, J. An Introduction to Isotopic Calculations; Woods Hole Oceanographic Institution: Woods Hole, MA, USA, 2004. [Google Scholar]
- Tazzoli, V.; Domeneghetti, C. The Crystal Structures of Whewellite and Weddellite; Re-Examination and Comparison. Am. Mineral. 1980, 65, 327–334. [Google Scholar]
- Palanisamy, V.; Sanphui, P.; Palanisamy, K.; Prakash, M.; Bansal, A.K. Design of Ascorbic Acid Eutectic Mixtures with Sugars to Inhibit Oxidative Degradation. Front. Chem. 2022, 10, 754269. [Google Scholar] [CrossRef]


Disclaimer/Publisher’s Note: The statements, opinions and data contained in all publications are solely those of the individual author(s) and contributor(s) and not of MDPI and/or the editor(s). MDPI and/or the editor(s) disclaim responsibility for any injury to people or property resulting from any ideas, methods, instructions or products referred to in the content. |
© 2024 by the authors. Licensee MDPI, Basel, Switzerland. This article is an open access article distributed under the terms and conditions of the Creative Commons Attribution (CC BY) license (https://creativecommons.org/licenses/by/4.0/).